PARTISAN POLARIZATION DOMINATES TRUMP ERA FINDINGS FROM THE 2018 AMERICAN VALUES SURVEY
|
|
|
- Audrey Morgan
- 5 years ago
- Views:
Transcription


1 PARTISAN POLARIZATION DOMINATES TRUMP ERA FINDINGS FROM THE 2018 AMERICAN VALUES SURVEY
2
3 PARTISAN POLARIZATION DOMINATES TRUMP ERA FINDINGS FROM THE 2018 AMERICAN VALUES SURVEY Robert P. Jones, PhD, Daniel Cox, PhD, Rob Griffin, PhD, Maxine Najle, PhD, Molly Fisch-Friedman, and Alex Vandermaas-Peeler
4 Acknowledgments The PRRI 2018 American Values Survey was made possible by generous grants from The Carnegie Corporation of New York, The Nathan Cummings Foundation, Unitarian Universalist Veatch Program at Shelter Rock, and The New World Foundation. The authors would also like to thank Carolyn Davis, Loretto McNally, and Sheridan Ruiz for their strategic support; Jioni Palmer, David Tigabu, and Douglas Barclay for their editorial and communications support; Aevon Bucknor and Monica Brinn for their administrative support; and Tim Duffy for his able assistance with graphics and report design and layout. We would also like to thank Kivvit for providing communications outreach. PRRI th Street NW, Floor Nine Washington D.C For more information, contact
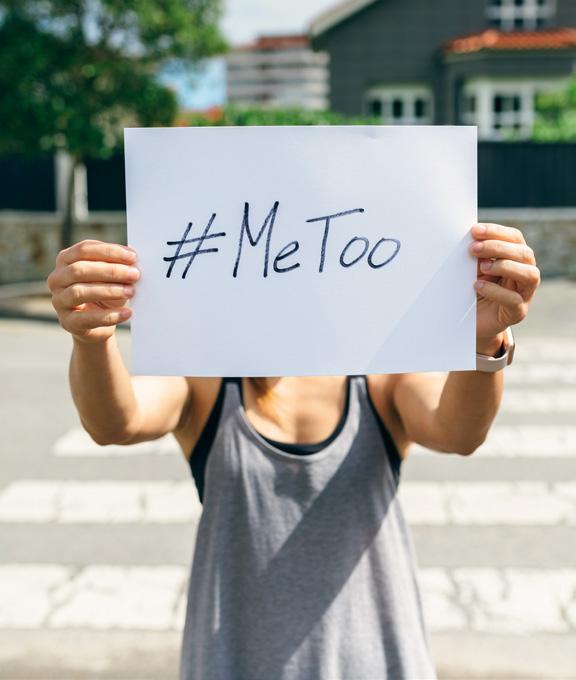
5 Contents 7 The 2018 Midterm Elections 14 Referendum on Trump 19 Views of Russia, the FBI, and the Special Counsel 21 Sexual Harassment and #MeToo 27 Immigration and Cultural Change 41 Race in America 47 Appendix 1: Survey Methodology 49 Appendix 2: About PRRI and the Authors
6 6 PARTISAN POLARIZATION DOMINATES TRUMP ERA
7 FINDINGS FROM THE 2018 AMERICAN VALUES SURVEY 7 The 2018 Midterm Elections Voting Priorities When asked to pick the top two most important issues for their vote this election cycle, Americans are more likely to point to the cost of health care than any other issue. Four in ten (40%) say that the cost of health care is either the first or second most important issue for them. About one-third (34%) say the same about the economy, while about one-quarter cite the growing gap between rich and poor (27%) and immigration (25%). Less than one in five cite gun policy (19%), national security (18%), or racial inequality (14%) while less than one in ten (7%) cite abortion. Just three percent of Americans say that lesbian, gay, bisexual, or transgender issues are either the first or second most important issue to them this election cycle. There are significant differences between partisans on which issues are most important for their voting decisions. Democrats are more likely than Republicans to prioritize the cost of health care (41% vs. 34%), the growing gap between rich and poor (39% vs. 8%), gun policy (25% vs. 14%), and racial inequality (23% vs. 6%). By contrast, Republicans are more likely than Democrats to prior- FIGURE 1. Issue Prioritization by Party Percent who say the following is the first or second most important issue to their vote this year Republican All Americans Democrat The economy National security 9 40 Immigration Abortion 7 10 The cost of health care The growing gap between rich and poor 8 39 Gun policy Racial inequality 6 23 Lesbian, gay, bisexual, and transgender issues Source: PRRI 2018 American Values Survey.
8 8 PARTISAN POLARIZATION DOMINATES TRUMP ERA itize the economy (44% vs. 24%), national security (40% vs. 9%), and immigration (36% vs. 18%). Few Democrats or Republicans say abortion or lesbian, gay, bisexual, or transgender issues are the first or second most important issues for their vote this year. Men and women have similar issue priorities, with two exceptions. While men are more likely than women to prioritize the economy (39% vs. 30%), women are more likely than men to prioritize the cost of health care (44% vs. 35%). There are a few gender divides within the political parties. Among Republicans, men are more likely than women to prioritize the economy (49% vs. 39%), but less likely to prioritize the growing gap between rich and poor (6% vs. 11%). Among Democrats, women are somewhat more likely than men to prioritize abortion (9% vs. 3%). There are significant racial and ethnic divides on the importance of these issues. Hispanic Americans (40%) are more likely than both white (25%) and black (12%) Americans to prioritize immigration. While more than one in five (23%) white Americans say that national security is their first or second most important issue, only about one in ten (12%) Hispanic Americans and seven percent of black Americans similarly prioritize this issue. Nearly half (46%) of black Americans prioritize racial inequality as their first or second most important voting issue, compared to about one in five (18%) Hispanic Americans and seven percent of white Americans. Voting Likelihood More than half (54%) of Americans report that they are absolutely certain to vote in the midterms, while 19% say they will probably vote. About one-quarter (26%) put their odds of voting at or less, including 8% who say they are definitely not voting. There are notable racial and ethnic differences on this question. Nearly six in ten black (58%) and white (57%) Americans say they are absolutely certain to vote, compared to only about four in ten (43%) Hispanic Americans. Among whites, those with a four-year college degree are significantly more likely than those without a degree to report they are certain to vote (71% vs. 49%). There are also gender differences within racial and ethnic groups. Notably, more than six in ten (62%) black women, compared to 52% of black men, say they are absolutely certain to vote. Hispanic men and women are about equally likely to say they will vote. Among white Americans, men are more likely than women to say they are absolutely certain to vote (63% vs. 51%). Seniors (ages 65 and older) are significantly more likely than young Americans (ages 18-29) to report that they intend to vote in the 2018 midterm elections. More than eight in ten (81%) seniors say they are absolutely certain to vote, compared to just 30% of young Americans.
9 FINDINGS FROM THE 2018 AMERICAN VALUES SURVEY 9 FIGURE 2. Black Women Most Likely to Report All of Their Close Friends Are Voting Percent who say All Americans White women Black women Hispanic women White men Black men Hispanic men They are absolutely certain to vote All of their close friends are voting Source: PRRI 2018 American Values Survey. Partisans are about equally likely to report that they will vote. About six in ten Democrats (63%) and Republicans (59%) say they are absolutely certain to vote. While Democratic men and women are about as likely to say they will vote, Republican men are more likely than Republican women to say they are absolutely certain to vote (66% vs. 51%). Close Friends Voting A majority of Americans report that all or most of their close friends will be voting in the upcoming midterm elections. Six in ten say that all (11%) or most (49%) of their close friends will be voting. About four in ten (39%) Americans report that about half or less than half of their friends will turn out to vote, including three percent who say that none of their friends will vote. More than one in five (22%) black Americans, compared to just 10% of Hispanic Americans and nine percent of white Americans, report that all their friends will vote in the midterms. Hispanic Americans (45%) are more likely than white (38%) or black (34%) Americans to say that about half or less than half of their close friends will vote in the midterms. There are notable gender gaps among racial and ethnic groups. Black women and black men are both more likely than members of other racial or ethnic groups to say that all of their close friends will be voting in the midterm elections. Black women stand out in particular, because they are significantly more likely than either white or Hispanic women to report that all of their friends
10 10 PARTISAN POLARIZATION DOMINATES TRUMP ERA will be voting (25% vs. 9% and 14% respectively). Similarly, black men are more likely than either white or Hispanic men to report that all of their friends will be voting (18% vs. 10% and 5%, respectively). Democrats are more likely than Republicans to say that all their close friends will be voting in the midterms (15% vs. 9%). While there are no gender gaps among Republicans, Democratic women are more likely than Democratic men to say that all of their close friends will be voting (18% vs. 12%). Vote Choice Heading into November, Democratic candidates have a nine-point advantage over Republican candidates. 1 Nearly half (48%) of registered voters say that they would choose the Democratic candidate on the ballot if the election were held today, while about four in ten (39%) say they would vote for the Republican. 2 There is a significant gender gap when it comes to candidate preference. Women (57%) are more likely than men (39%) to say they would vote for a Democrat if the election were held today. Conversely, men are more likely than women to support the Republican candidate (48% vs. 31%). Reasons for Voting Among those who prefer the Democratic candidate in the 2018 election, roughly equal numbers say they are doing it to advance the issues they care about (49%) or that they are doing it to oppose Trump and his agenda (48%). 3 Just two percent say they are voting this way to support Trump and his agenda. Similarly, those who prefer the Republican candidate in the 2018 election are as likely to say they are doing it to advance issues they care about (46%) as they are to say they re doing it to support Trump and his agenda (46%). Notably, almost one in ten (7%) say they are voting for a Republican candidate in order to oppose Trump and his agenda. There are some notable demographic differences on this question among those who favor Republican candidates. Within this group, Americans with a four-year college degree are more likely than those without a degree to say their vote is about advancing issues they care about (55% vs. 42%) and less likely to say it is about supporting Trump (39% vs. 49%). Women who support a Republican are more likely than men to say that their vote is about opposing Trump and his agenda (11% vs. 3%). Young Americans who say they prefer the Republican candidate are also more likely than seniors to express this sentiment (18% vs. 2%). 1 PRRI October 2018 Survey. 2 Analysis in this section is limited to those who report that they are registered to vote. 3 This analysis includes all Americans who identified a candidate preference.
11 FINDINGS FROM THE 2018 AMERICAN VALUES SURVEY 11 Views of President Trump Six in ten (60%) Americans hold an unfavorable opinion of President Donald Trump, including nearly half (47%) who say their opinion is very unfavorable. Only 35% of Americans have a favorable opinion of Trump, including 14% who say their opinion is very favorable. More than eight in ten (82%) Republicans report having a favorable opinion of Trump, including over one-third (37%) who say they have a very favorable opinion of the president. By contrast, only 10% of Democrats view Trump favorably. Almost nine in ten (89%) Democrats have an unfavorable opinion of the president, including 79% who hold a very unfavorable view. More than six in ten (64%) political independents view the president unfavorably. With the unique exception of white evangelical Protestants, majorities of all other major religious groups have an unfavorable opinion of Trump. Majorities of black Protestants (80%), religiously unaffiliated Americans (75%), Hispanic Catholics (74%), non-christian religious Americans (73%), white mainline Protestants (52%), and white Catholics (52%) have a negative opinion of Trump. By contrast, almost seven in ten (68%) white evangelical Protestants have a favorable view of Trump, including 28% who have a very favorable view. Views of the Republican and Democratic Party Americans generally view the Democratic Party more favorably than the Republican Party. While about half (48%) of Americans report a favorable view of the Democratic Party, just one-third (33%) have a favorable view of the Republican Party. About six in ten (61%) Americans have an unfavorable opinion of the Republican Party, compared to about half (46%) who view the Democratic Party unfavorably. The vast majority of Democrats (87%) and Republicans (82%) hold a favorable view of their own party, including about one-quarter who have a very favorable view of their own party (26% vs. 25%). Partisans feel about equally negative about the opposite party. Overwhelming majorities of Democrats (90%) and Republicans (87%) have an unfavorable opinion of the opposing party, including majorities who have a very unfavorable view of the other party (53% vs. 58%). The Impact of Increasing Diversity of Elected Officials With one exception, relatively large numbers of Americans say that having more members of under-represented groups elected to public office would make no difference for the country. About half say that electing more people from non-christian religious groups (53%), more non-religious people (50%), or more lesbian, gay, bisexual, and transgender people (48%) would not make much of a difference. About four in ten Americans also say that electing more people from racial
12 12 PARTISAN POLARIZATION DOMINATES TRUMP ERA and ethnic minority groups (44%) and women (42%) wouldn t make much of a difference. By contrast, only one-quarter (25%) say that electing more people from working-class backgrounds would make no difference. Americans are more likely to say electing more people from the following backgrounds would make things better rather than worse: working-class (69% vs. 5%), women (50% vs. 6%), racial and ethnic minorities (44% vs. 11%), lesbian, gay, bisexual, and transgender people (29% vs. 21%), or non-religious people (27% vs. 21%). Americans are divided on the effect of electing more people from non-christian religious groups (24% better vs. 21% worse). There are striking partisan differences on this issue. Democrats are more likely than Republicans to say that electing more people from the following backgrounds would make things in the country better: working-class (74% vs. 64%), women (72% vs. 26%), racial and ethnic minorities (61% vs. 22%), lesbian, gay, bisexual, and transgender people (44% vs. 9%), non-religious people (37% vs. 10%), or non-christian religious groups (35% vs. 9%). Conversely, Republicans are more likely than Democrats to say that electing more individuals from under-represented groups would have a negative impact: lesbian, gay, bisexual, and transgender people (40% vs. 12%), non-christian religious groups (40% vs. 16%), non-religious people (40% vs. 14%), people from racial and ethnic minority groups (18% vs. 7%), or women (9% vs. 4%). FIGURE 3. Americans Views on Electing More People From Underrepresented Groups Percent who think electing more of the following groups of people to political office would make things in the country Worse Not much different Better People from working class backgrounds Women People from racial and ethnic minority groups Lesbian, gay, bisexual, and transgender people Non-religious people People from non- Christian religious groups Source: PRRI 2018 American Values Survey.
13 FINDINGS FROM THE 2018 AMERICAN VALUES SURVEY 13 Views on Socialism Americans are divided in their understandings of socialism. While a majority (54%) identify socialism as a system of government that provides citizens with health insurance, retirement support, and access to free higher education, about four in ten (43%) say socialism is a system where the government controls key parts of the economy, such as utilities, transportation, and communications industries. Democrats are more likely than Republicans to say socialism is about providing citizens with services (61% vs. 43%), while Republicans are more likely than Democrats to say it is about government control of industry (54% vs. 36%).
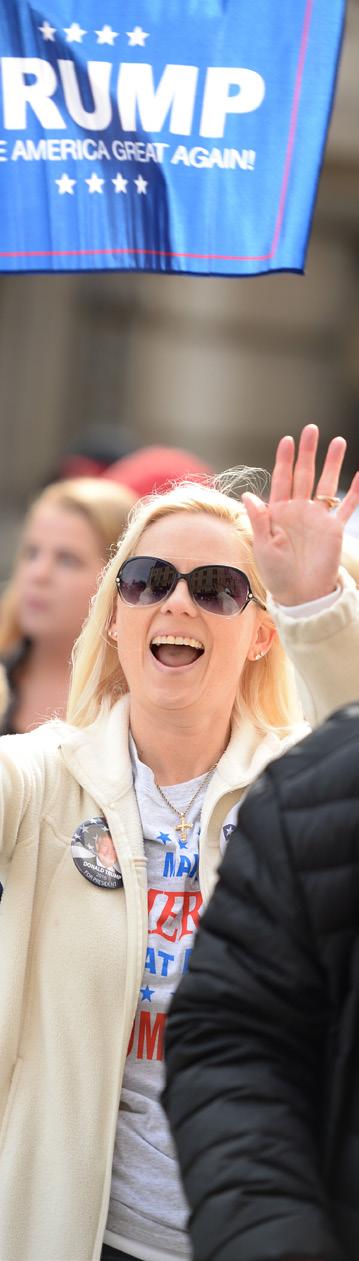
14 14 PARTISAN POLARIZATION DOMINATES TRUMP ERA Referendum on Trump Across a wide array of measures, a majority of Americans disapprove of the president and his conduct in office. Almost six in ten (58%) disapprove of Trump s job performance as president. Nearly seven in ten say they would like his speech and behavior to be more consistent with his predecessors (69%) or that he has damaged the dignity of the presidency (69%). Nearly six in ten (59%) say he has not used his authority to pardon appropriately, and a majority (54%) believe that his decisions and behavior as president have encouraged white supremacist groups. Among Republicans, and independents who lean toward the Republican Party, one-third (33%) say they would prefer someone else as the Republican nominee in Support for Trump is nearly unchanged from one year earlier. 4 Trump Approval With the 2018 midterms fast approaching, nearly six in ten (58%) Americans disapprove of Trump s performance as president, including 42% who strongly disapprove. Just over four in ten (41%) Americans have a positive view of Trump s job performance. FIGURE 4. High Levels of Negative Sentiments About President Trump Percent who report the following attitudes President Trump has damaged the dignity of the presidency Wish President Trump s speech and behavior were more consistent with previous presidents President Trump has not used his authority to pardon appropriately Disapprove of the job Donald Trump is doing as president President Trump s behavior has encouraged white supremacist groups 54 Prefer GOP nominee for president in 2020 be someone other than Donald Trump* *Asked among Republicans and Republican leaning independents Source: PRRI 2018 American Values Survey PRRI 2017 American Values Survey.
15 FINDINGS FROM THE 2018 AMERICAN VALUES SURVEY 15 A majority of Americans say there is nothing that President Trump could do to change their opinion of him. More than four in ten (46%) say they disapprove of Trump s job performance and that there is nothing he could do to win their approval, while 14% say they approve of Trump and that there is nothing he could do to lose their approval. By contrast, four in ten Americans either approve (27%) or disapprove (13%) of the president but say that there is something he could do to change their mind. Among Democrats, almost eight in ten (78%) say they disapprove of the president and there is nothing he can do to win their approval, while 12% disapprove but say there is something he could do win their approval. By contrast, nearly four in ten (37%) Republicans say they approve of the president and that there is nothing he can do to lose their support. A slim majority (51%) of Republicans approve of Trump but say there is something he could do lose their approval. There are notable gender gaps among partisans. Democratic women are more likely than Democratic men to say they will never approve of Trump (82% vs. 72%). By contrast, Republican men are more likely than Republican women to say they will always approve of Trump (44% vs. 30%). There are deep divides between members of different religious traditions. Black Protestants (66%) are more likely than religiously unaffiliated Americans (58%), Hispanic Catholics (56%), white Catholics (39%), and white mainline Protestants (38%) to say they will never approve of Trump. Only 16% of white evangelical Protestants say the president cannot win their approval. Meanwhile, about one-quarter of white evangelical Protestants (25%) and white mainline Protestants (22%) say there is nothing Trump could do to lose their support, compared to 19% of white Catholics and 12% of Hispanic Catholics. Just six percent of black Protestants and four percent of religiously unaffiliated Americans say there is nothing Trump could do to lose their approval. Trump as the Republican Nominee in 2020 By a margin of two to one, Republicans and independents who lean Republican say they want Donald Trump to be the nominee in About two-thirds (66%) of Republicans prefer Trump as the nominee. One-third (33%) say they would prefer someone else. 5 There are notable demographic divides among Republicans on this question. Republican women are more likely than Republican men to say they would prefer an alternative Republican candidate in 2020 (38% vs. 28%). Similarly, young Republicans are more likely than seniors to say they want a different nominee (45% vs. 24%). Still, there is no major Republican subgroup in which a majority expresses a preference for a candidate other than Trump in In this section, Republican includes independents who lean towards the Republican party.
16 16 PARTISAN POLARIZATION DOMINATES TRUMP ERA The Dignity of the Presidency A majority of Americans think that President Trump has marred the office of the president. Almost seven in ten (69%) say that he has damaged the dignity of the presidency, while three in ten (30%) disagree. There are striking partisan divides on this question. More than nine in ten (91%) Democrats, seven in ten (70%) independents, and nearly four in ten (37%) Republicans think that Trump has damaged the office of the presidency. There are no notable educational or gender divides between co-partisans. Even among Americans who approve of Trump s job performance, 31% believe he has damaged the dignity of the presidency. With the exception of white evangelical Protestants, strong majorities of every major religious group believe that Donald Trump has damaged the dignity of the presidency. More than three-quarters (77%) of religiously unaffiliated Americans and about two-thirds of white mainline Protestants (68%) and Catholics (67%) agree that President Trump has damaged the dignity of the presidency. This view is shared by less than half (47%) of white evangelical Protestants. A majority (53%) of white evangelical Protestants say that President Trump has not damaged the dignity of the presidency. Presidential Speech and Behavior Similarly, almost seven in ten (69%) Americans say that they would like President Trump s speech and behavior to be more consistent with his predecessors, while 29% disagree. FIGURE 5. Most Americans Say Trump Has Damaged the Dignity of the Presidency Do you think President Donald Trump has damaged the dignity of the presidency, or not? No Yes All Americans Unaffiliated White mainline Protestant Catholic White evangelical Protestant Source: PRRI 2018 American Values Survey.
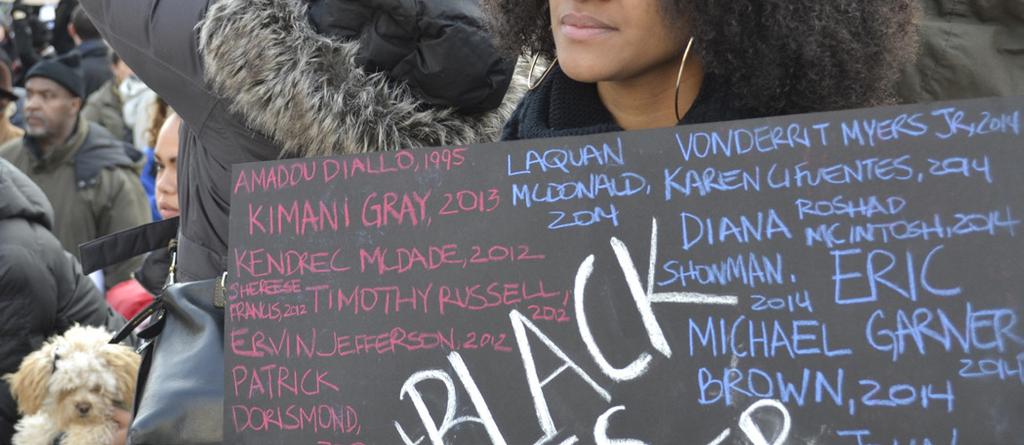
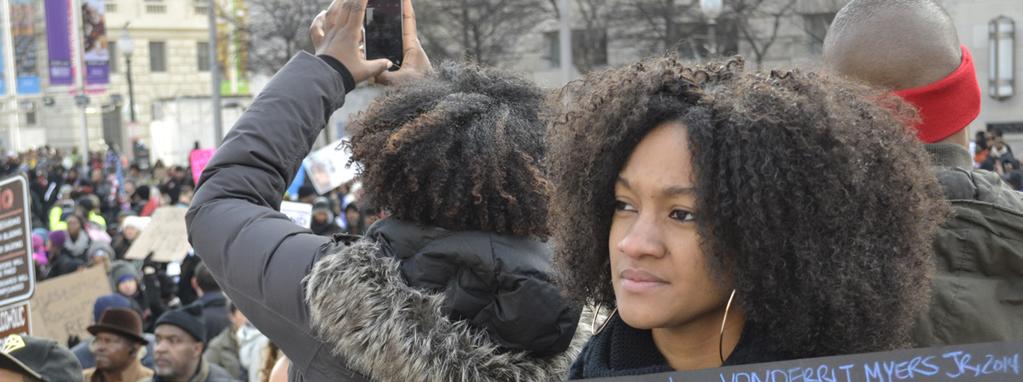
17 FINDINGS FROM THE 2018 AMERICAN VALUES SURVEY 17 There is some bipartisan agreement on this question. More than eight in ten (84%) Democrats, two-thirds (67%) of independents, and even a majority (57%) of Republicans report that they wish President Trump s conduct was more consistent with that of previous presidents. While Democrats attitudes are similar across demographic lines, there are notable differences among Republicans. Republican women are more likely than Republican men to say they wish that President Trump s behavior was consistent with past presidents conduct (66% vs. 49%). In addition, Republicans with a four-year college degree are more likely than those without a degree to express this sentiment (69% vs. 52%). Encouraging White Supremacists A majority (54%) of Americans say that President Trump s decisions and behavior as president have encouraged white supremacist groups, compared to just five percent who believe the president has discouraged white supremacist groups. Nearly four in ten (39%) say Trump s behavior has had no effect on white supremacist groups. There are large differences between racial and ethnic groups on this issue. About seven in ten black (72%) and Hispanic (68%) Americans, compared to less than half (45%) of white Americans, believe that the president s conduct has encouraged white supremacist groups. Among white Americans, those with a four-year college degree are more likely than those without a degree to say that Trump s decisions and behavior as president have encouraged white supremacist groups (58% vs. 38%). Democrats are much more likely than Republicans to say that the president s behavior has encouraged white supremacist groups (83% vs. 15%). Similarly small numbers of Democrats (5%) and Republicans (8%) say Trump s behavior has discouraged white supremacist groups. Republicans are substantially more likely than Democrats to say that Trump s behavior has had no effect on white supremacist groups (77% vs. 11%). Notably, nonwhite Republicans are about four times more likely than white Republicans to say that Trump has encouraged white supremacist groups (37% vs. 9%). The vast majority (83%) of white Republicans think that Trump s conduct has had no impact on white supremacists. There is far more agreement among Democrats. Almost nine in ten (89%) Hispanic Democrats and eight in ten black (82%) and white (81%) Democrats say that Trump s decisions and behavior as president have encouraged white supremacist groups. White Christians stand out compared to other religious groups on this issue. Majorities of black Protestants (75%), religiously unaffiliated Americans (69%), Hispanic Catholics (68%), non-christians (64%), and Hispanic Protestants (63%) say that Trump s decisions and behavior have en-
18 18 PARTISAN POLARIZATION DOMINATES TRUMP ERA couraged white supremacists. By contrast, less than half of white mainline Protestants (43%) and white Catholics (43%) and only 26% of white evangelical Protestants share this view. Trump s Use of the Pardon Power Nearly six in ten (59%) Americans believe that President Trump has not used his authority to pardon appropriately, compared to 38% who think that he has used his pardon power appropriately. A majority of Democrats (85%) and independents (61%), compared to just one in five (21%) Republicans, say that the president has not used his authority to pardon appropriately. More than three-quarters (76%) of Republicans say that Trump has used his authority to pardon appropriately. Impeachment Nearly half (47%) of Americans say that based on what they have read or heard, President Trump should be impeached, compared to 51% who disagree. In February 2017, shortly after Trump took office, only three in ten (30%) Americans supported Trump s impeachment. 6 Across racial and ethnic lines, women are consistently more likely than men to say that Trump should be impeached. A majority (54%) of women, compared to about four in ten (39%) men, say that based on what they have read or heard, Trump should be impeached. Notably, nearly eight in ten (78%) black women and nearly two-thirds of Hispanic women (64%), compared to only 44% of white women, say Trump should be impeached. A majority (54%) of white women say they do not believe Trump should be impeached. More than three-quarters (77%) of Democrats and about four in ten (44%) independents say that the president should be impeached. Even about one in ten (11%) Republicans agree with this sentiment. Democrats, independents, and Republicans are all more likely than they were at the start of Trump s presidency to say that he should be impeached (58%, 27%, and 4%, respectively). Notably, the gap between Republicans and independents has broadened significantly over this time, from 23 percentage points to 33 percentage points. There are notable demographic divides among Democrats about whether the president should be impeached. Almost nine in ten (87%) Hispanic Democrats say that President Trump should be impeached, compared to about three-quarters of black (77%) and white (72%) Democrats. Among white Democrats, those with a four-year college degree (80%) are more likely than those without a degree (66%) to say President Trump should be impeached. Democratic women (80%) are also somewhat more likely than Democratic men (73%) to express this sentiment. 6 PRRI February 2017 Survey.
19 FINDINGS FROM THE 2018 AMERICAN VALUES SURVEY 19 Views of Russia, the FBI, and the Special Counsel The FBI Overall, Americans have a positive view of the FBI. Nearly two-thirds (65%) of Americans say they have a favorable opinion of the FBI, compared to just 29% who say they view the FBI unfavorably. Majorities of both major political parties have a favorable view of the FBI, though Democrats are more likely than Republicans to view the institution favorably. More than seven in ten (73%) Democrats and over half (57%) of Republicans say they have a positive opinion of the FBI. Political independents views mirror those of the general public. Two-thirds (67%) of seniors (ages 65 and older), compared to 56% of young Americans (ages 18-29), report having a generally favorable view of the FBI. Nearly four in ten (39%) young Americans say their opinion of the FBI is unfavorable. Nearly seven in ten (69%) black Americans report having a favorable opinion of the FBI, compared to 64% of white Americans and 60% of Hispanic Americans. Special Counsel Robert Mueller The general public is fairly split on their overall opinion of Robert Mueller, the special counsel appointed to investigate Russian interference in the 2016 presidential election. Nearly four in ten (39%) Americans say they have a favorable opinion of Mueller, compared to 45% who say they have an unfavorable opinion and 14% who say they have not heard of Mueller. The opinions of partisans about Robert Mueller diverge substantially. Nearly six in ten (59%) Democrats, compared to only 17% of Republicans, say their opinion of Mueller is positive overall. By contrast, more than seven in ten (71%) Republicans report having an unfavorable view of Mueller. Nearly half (48%) of black Americans report having a favorable opinion of Mueller, compared to only 38% of white Americans and 31% of Hispanic Americans. Nearly half of whites (47%) and Hispanics (47%) say their overall opinion of the special counsel is unfavorable. Among whites, there are notable educational differences. More than half (54%) of whites with a college degree view Mueller favorably, compared to only 30% of whites without a college degree.
20 20 PARTISAN POLARIZATION DOMINATES TRUMP ERA Russia and Russian President Vladimir Putin Three-quarters (75%) of Americans say they have an unfavorable view of Russia, including 35% who hold a very unfavorable view. Just 14% of Americans view Russia favorably. There are only minor partisan differences in views of Russia. More than eight in ten (82%) Democrats say they have an unfavorable opinion of Russia, compared to nearly three-quarters of Republicans (74%) and independents (73%). There are modest generational divides in views of Russia. Nearly eight in ten (79%) seniors report having an unfavorable opinion of Russia. By contrast, two-thirds (67%) of young Americans say they have an unfavorable view of Russia, while nearly one in five (19%) have a favorable opinion and 15% say they have not heard of Russia or have no opinion. Views of Russian President Vladimir Putin closely track views of Russia overall, with eight in ten (80%) Americans saying they view Putin unfavorably. Only 10% of Americans say they have a favorable opinion of him. Russia: Ally or Enemy? The majority of Americans hold an adversarial view of Russia. Almost seven in ten view Russia as either unfriendly (45%) or an enemy of the U.S. (23%). Only about three in ten view Russia as either friendly (24%) or an ally of the U.S. (5%). Compared to one year ago, Americans today are more likely to view Russia as unfriendly. In 2017, about half of Americans viewed Russia as either unfriendly (31%) or an enemy (24%). 7 There are notable differences between partisans on whether Russia is an enemy or an ally. Nearly half of Democrats (45%) and Republicans (46%) say Russia is unfriendly, although Democrats are about twice as likely as Republicans to say that Russia is an enemy of the U.S. (33% vs. 15%). Seniors are twice as likely as young Americans to say that they consider Russia to be an enemy (32% vs. 16%). By contrast, young Americans are more likely than seniors to say relations with Russia are friendly (31% vs. 15%). 7 PRRI August 2017 Survey.
21 FINDINGS FROM THE 2018 AMERICAN VALUES SURVEY 21 Sexual Harassment and #MeToo Institutions Handling of Sexual Harassment and Assault Americans generally do not think that institutions are doing a good job responding to issues of sexual harassment and assault. Majorities of Americans say that the Republican Party (63%), churches and places of worship (62%), colleges and universities (55%), and the Democratic Party (51%) are not handling these issues well. By contrast, 54% of Americans say that businesses are handling issues of sexual harassment and assault at least somewhat well, while 43% of Americans say businesses are not handling these issues well. The Democratic and Republican Parties Americans do not generally think that the two major political parties are doing a good job responding to sexual harassment and assault. More than six in ten (63%) Americans say the Republican Party is not responding well to these issues, while 51% say the Democratic Party is not handling these issues well. Women are slightly more likely than men to say that the Republican Party is doing a poor job handling issues of sexual assault and harassment (66% vs. 60%). There is no notable gender divide on assessments of the Democratic Party. FIGURE 6. How Well Are the Political Parties Responding to Sexual Harassment and Assault? How well do you think the following organizations and institutions are responding to the issue of sexual harassment and assault? Not well Well Democratic men The Democratic Party The Republican Party Democratic women Republican men Republican women Source: PRRI 2018 American Values Survey.
22 22 PARTISAN POLARIZATION DOMINATES TRUMP ERA Partisans generally think their own political party is doing a good job responding to these issues. More than six in ten Republicans (65%) and Democrats (63%) say their own party handles sexual harassment and assault at least somewhat well. By contrast, just about one-third (35%) of Republicans and 16% of Democrats say the opposite party is responding well to these issues. More than eight in ten (83%) Democrats say the Republican Party is doing a poor job responding to sexual harassment and assault. There are notable gender divides within the parties. Among both Democrats and Republicans, men (69% and 71%) are more likely than women (59% and 58%) to say their own party is responding well to the issue of sexual harassment and assault. Churches and Places of Worship More than six in ten (62%) Americans say that churches and places of worship are not responding well to issues of sexual harassment and assault. Just about one-third (36%) say these institutions are responding well. Women and men are about equally likely to say that places of worship are doing a poor job of handling these issues. FIGURE 7. White Evangelical Protestants Are Only Major Religious Group to Say Churches Handle Sexual Harrassment and Assault Well How well do you think churches and other places of worship are responding to the issue of sexual harassment and assault? Not too or not at all well Somewhat or very well All Americans White evangelical Protestant Black Protestant Catholic White mainline Protestant Hispanic Protestant Unaffiliated Source: PRRI 2018 American Values Survey.
23 FINDINGS FROM THE 2018 AMERICAN VALUES SURVEY 23 With the exception of white evangelical Protestants, Americans from different religious traditions generally agree that churches and places of worship are not responding well to issues of sexual harassment and assault. Majorities of religiously unaffiliated Americans (82%), Hispanic Catholics (63%), white mainline Protestants (59%), and white Catholics (55%) say that churches and religious institutions are handling these issues poorly, compared to just four in ten (40%) white evangelical Protestants. Six in ten (60%) white evangelical Protestants believe churches and places of worship are handling these issues well. With the exception of Catholics, men and women who belong to the same religious tradition have similar opinions on this issue. However, Catholic women are significantly more likely than Catholic men to say that churches and places of worship are handling issues of sexual harassment and assault poorly (66% vs. 48%). Young Americans (ages 18-29) are more likely than seniors (ages 65 and older) to say that churches and places of worship are handling this issue poorly. Two-thirds (67%) of young Americans, compared to 52% of seniors, say that religious institutions are handling issues of sexual harassment and assault poorly. Businesses A majority (54%) of Americans feel that businesses are responding well to issues of sexual harassment and assault, compared to about four in ten (43%) who say businesses are not responding well. Women and men are about equally likely to say that businesses are doing well in responding to issues of sexual harassment and assault. Republicans are significantly more likely than Democrats to say that businesses are handling these issues well (69% vs. 45%). There are no notable gender gaps among partisans. Seniors are more likely than young Americans to agree that businesses are handling these issues well. Almost six in ten (57%) seniors say businesses are handling issues of sexual harassment and assault well, compared to less than half (46%) of young Americans. Assessment of the #MeToo Movement Almost half of Americans say that #MeToo movement has had a positive impact. About half (48%) say it has helped address sexual harassment and assault in the workplace. Less than one in five (18%) say it has led to the unfair treatment of men, and 16% say it has not really made any difference. Almost one in five (17%) Americans say they have not heard of the #MeToo movement.
24 24 PARTISAN POLARIZATION DOMINATES TRUMP ERA There is a sharp gender divide on the impact of #MeToo. Women are more likely than men to say that #MeToo has helped address sexual harassment and assault in the workplace (53% vs. 42%), while men are more likely than women to say that the movement has led to unfair treatment of men (23% vs. 14%). There are also stark partisan divides on the movement s impact. Democrats are more than twice as likely as Republicans to say that #MeToo has helped address issues of sexual harassment and assault in the workplace (64% vs. 29%). By contrast, Republicans are nearly four times as likely as Democrats to say that the movement has led to men being treated unfairly (33% vs. 9%). Among Republicans, men are more likely than women to say that #MeToo has resulted in men being treated unfairly (38% vs. 26%) and less likely to say that it has helped address sexual harassment and assault in the workplace (26% vs. 34%). Among Democrats, women are more likely than men to say that #MeToo has helped address sexual harassment and assault in the workplace (67% vs. 58%). Americans of different racial and ethnic backgrounds perceive the #MeToo movement differently. White Americans (21%) are more likely than Hispanic (14%) and black (10%) Americans to say that #MeToo has led to men being treated unfairly. Among whites, those with a four-year college degree are more likely than those without a degree to say that #MeToo has helped address issues of sexual harassment and assault in the workplace (60% vs. 39%). Whites without a college FIGURE 8. Impact of #MeToo by Gender and Political Affiliation Do you think the #MeToo movement has Led to the unfair treatment of men Helped address sexual harassment and assault in the workplace Not really made any difference I have not heard of the #MeToo movement All Americans Democratic women Democratic men Republican women Republican men Source: PRRI 2018 American Values Survey.
25 FINDINGS FROM THE 2018 AMERICAN VALUES SURVEY 25 degree, however, are no more likely than whites with a college degree to say the movement has negatively impacted men (22% vs. 21%). There are also gender differences among racial and ethnic groups. Among both Hispanic and white Americans, women (60% and 51%) are more likely than men (35% and 41%) to say that that #MeToo has helped address issues of sexual harassment and assault in the workplace. By contrast, Hispanic and white men (21% and 27%) are more likely than Hispanic and white women (9% and 16%) to say that #MeToo has led to men being treated unfairly. There are slight generational differences in how #MeToo is viewed. Though seniors and young Americans are about equally likely to say that the movement has helped address issues in the workplace (52% vs. 49%), seniors are slightly more likely than young Americans to say that men have been unfairly treated as a result of the #MeToo movement (18% vs. 12%). Young women are more likely than young men to say that #MeToo has helped address issues of sexual harassment and assault in the workplace (55% vs. 43%). Young women are also less likely than young men to say that #MeToo has led to men being treated unfairly (6% vs. 18%). Discrimination Against Men vs. Women Almost four in ten (38%) Americans agree that that discrimination against men has become as big a problem as discrimination against women, compared to 61% who disagree. Men are more likely than women to say that discrimination against men is as big a problem as discrimination against women (44% vs. 31%). There are sharp partisan divides on this issue. A majority (53%) of Republicans, compared to just 27% of Democrats, agree that discrimination against men is as big a problem as discrimination against women. Among Republicans, men (63%) are much more likely than women (44%) to express this sentiment. There are no comparable differences between Democratic men and women. There are notable generational divides on this issue. More than four in ten (45%) seniors agree that discrimination against men is as big a problem as discrimination against women, compared to just 30% of young Americans. Senior men are much more likely than senior women to think that discrimination against men is as big a problem as discrimination against women (57% vs. 34%). Does Feminism Represent Women? The American public is divided on whether the feminist movement accurately reflects the views of most women. More than half (51%) agree with this notion, while almost as many (47%) disagree.
26 26 PARTISAN POLARIZATION DOMINATES TRUMP ERA A majority (56%) of women, compared to only 46% of men, say the feminist movement reflects the views of most women. Democrats are more than twice as likely as Republicans to see the feminist movement as representative of women s views. More than seven in ten (72%) Democrats think the feminist movement accurately reflects the views of most women, while only one-third (33%) of Republicans agree. There are no substantive gender divides among Democrats and Republicans. There are sharp racial and ethnic divides on this question. Nearly two-thirds of black (66%) and Hispanic (65%) Americans believe that the feminist movement accurately reflects the views of most women, compared to less than half (45%) of white Americans. White Americans with and without a four-year college degree are about equally likely to express this sentiment.
27 FINDINGS FROM THE 2018 AMERICAN VALUES SURVEY 27 Immigration and Cultural Change Concerns About Cultural Change Nostalgia for the 1950s Americans are divided on whether American culture and way of life have changed for the better (50%) or for the worse (47%) since the 1950s. Attitudes on this issue have remained relatively stable since A majority of black (56%) and Hispanic Americans (55%) say that things have mostly gotten better since the 1950s, while white Americans are more divided: 47% of white Americans say things have improved, while more than half (51%) say things have mostly gotten worse. Among white Americans, those with a four-year college degree are more likely than those without a degree to say that American culture has mostly changed for the better (58% vs. 40%). There are significant partisan divides on this issue. Six in ten (60%) Democrats and a majority (53%) of independents say that things have mostly changed for the better since the 1950s. Only about one-third (34%) of Republicans hold this view, while nearly two-thirds (64%) say that things have mostly changed for the worse. FIGURE 9. Republicans More Concerned with Cultural Change Percent who say Democrat All Americans Republican The American way of life needs to be protected from foreign influence Since the 1950s, American culture and way of life has mostly changed for the worse The impact of the U.S. becoming majority nonwhite by 2045 will be mostly negative Things have changed so much that they often feel like a stranger in their own country Source: PRRI 2018 American Values Survey. 8 PRRI 2015 American Values Survey.
28 28 PARTISAN POLARIZATION DOMINATES TRUMP ERA Seniors (ages 65 and older) are notably more likely than young Americans (ages 18-29) to express nostalgia for the 1950s. Seniors are more likely than young Americans to say that things have changed for the worse since the 1950s (55% vs. 39%). Four in ten (43%) seniors say that things have mostly changed for the better, compared to almost six in ten (58%) young Americans who express this sentiment. While there is no significant gender gap among young people, senior men are significantly more likely than senior women to say that American culture has mostly changed for the worse (62% vs. 49%). Impact of Coming Demographic Change Nearly two-thirds (64%) of Americans say that the U.S. becoming a majority-nonwhite nation by 2045 will be a mostly positive change. One-third (33%) of Americans say that the impact of this demographic shift will be mostly negative. While about eight in ten Hispanic (80%) and black (79%) Americans say that the impact of the U.S. becoming a majority-nonwhite country will be mostly positive, significantly fewer (55%) white Americans hold this view. Among white Americans, those with a four-year college degree are more likely than those without a degree to view this demographic change positively (67% vs. 48%). There are no substantive gender divides among racial and ethnic groups. Views of the coming demographic realignment differ sharply among partisans. Eight in ten (80%) Democrats and two-thirds (67%) of independents, compared to only 36% of Republicans, say that the growth of the nonwhite population will be a positive change. More than six in ten (61%) Republicans believe that the shift to being a majority-nonwhite country will be a mostly negative development. With the exception of white evangelical Protestants, all other major religious groups believe that the country s racial and ethnic realignment will be mostly positive. Majorities of Hispanic Catholics (81%), black Protestants (80%), religiously unaffiliated Americans (74%), white Catholics (51%), and white mainline Protestants (51%) believe that this change will be mostly positive, while less than half (44%) of white evangelical Protestants hold this view. A majority (54%) of white evangelical Protestants say that becoming majority-nonwhite nation in the future will be mostly negative. Seniors are notably divided in their attitudes toward the impact of these projections. A slim majority (52%) of seniors, including less than half (46%) of senior men, say that these demographic changes will be mostly positive. By contrast, fully three-quarters (75%) of young Americans hold this view.
29 FINDINGS FROM THE 2018 AMERICAN VALUES SURVEY 29 Feeling Like a Stranger in Your Own Country Nearly half (47%) of Americans say that things have changed so much they often feel like a stranger in their own country, while a slim majority (51%) disagree. Feelings of cultural alienation have risen since 2016, when 41% of Americans agreed with this statement. 9 Nearly six in ten (58%) Republicans say that things have changed so much they often feel like a stranger in their own country an increase from 2016 when less than half (49%) of Republicans felt this way. Only about four in ten (42%) Democrats say that they feel like a stranger in their own country, although this is also an increase over the last two years; in 2016, one-third (33%) of Democrats felt this way. Protecting the American Way of Life From Foreign Influence Americans are similarly divided on whether the American way of life needs to be protected from foreign influence. Half (50%) of Americans believe American culture needs to be protected, while a similar number (48%) disagree. There is a notable gender gap on this issue. A majority (56%) of men, but only 46% of women, agree that the American way of life needs to be protected from foreign influence. White Americans are more likely than nonwhite Americans to worry about the country s vulnerability to foreign influence. A majority (56%) of white Americans agree that the American way of life needs to be protected from foreign influence, while less than half (45%) of black Americans and about one-third (37%) of Hispanic Americans hold this view. Among white Americans, those with a four-year college degree are far less likely than those without a degree to say that that the American way of life needs to be protected from foreign influence (41% vs. 65%). Additionally, white men are more likely than white women to express this sentiment (61% vs. 51%). There are strong partisan divides on this issue. More than three-quarters (76%) of Republicans believe the American way of life needs to be protected from foreign influence. By contrast, less than half (46%) of independents and just 39% of Democrats agree with this statement. Seniors are nearly twice as likely as young Americans to agree that the American way of life needs to be protected from foreign influence (63% vs. 34%). Nearly half (45%) of young men say the American way of life needs protection from foreign influence, while less than one-quarter (24%) of young women hold this view. There is no comparable gender divide among seniors. 9 PRRI/The Atlantic 2016 White Working Class Survey.
GOP leads on economy, Democrats on health care, immigration
 FOR RELEASE JUNE 20, 2018 Voters More Focused on Control of Congress and the President Than in Past Midterms GOP leads on economy, Democrats on health care, immigration FOR MEDIA OR OTHER INQUIRIES: Carroll
Citizenship, Values, & Cultural Concerns:
 Citizenship, Values, & Cultural Concerns: What Americans Want From Immigration Reform Findings from the 2013 Religion, Values, and Immigration Reform Survey Robert P. Jones Daniel Cox Juhem Navarro-Rivera
Wide and growing divides in views of racial discrimination
 FOR RELEASE MARCH 01, 2018 The Generation Gap in American Politics Wide and growing divides in views of racial discrimination FOR MEDIA OR OTHER INQUIRIES: Carroll Doherty, Director of Political Research
PRRI March 2018 Survey Total = 2,020 (810 Landline, 1,210 Cell) March 14 March 25, 2018
 March 14 March 25, 2018") PRRI March 2018 Survey Total = 2,020 (810 Landline, 1,210 Cell) March 14 March 25, 2018 Q.1 I'd like to ask you about priorities for President Donald Trump and Congress. As I read from a list, please tell
PRRI March 2018 Survey Total = 2,020 (810 Landline, 1,210 Cell) March 14 March 25, 2018 Q.1 I'd like to ask you about priorities for President Donald Trump and Congress. As I read from a list, please tell
RECOMMENDED CITATION: Pew Research Center, July, 2016, 2016 Campaign: Strong Interest, Widespread Dissatisfaction
 NUMBERS, FACTS AND TRENDS SHAPING THE WORLD FOR RELEASE JULY 07, 2016 FOR MEDIA OR OTHER INQUIRIES: Carroll Doherty, Director of Political Research Jocelyn Kiley, Associate Director, Research Bridget Johnson,
GW POLITICS POLL 2018 MIDTERM ELECTION WAVE 1
 GW POLITICS POLL 2018 MIDTERM ELECTION WAVE 1 The survey was fielded May 14 30, 2018 with a sample of registered voters. The survey was fielded by YouGov with a sample of registered voters. YouGov recruits
Young Voters in the 2010 Elections
 Young Voters in the 2010 Elections By CIRCLE Staff November 9, 2010 This CIRCLE fact sheet summarizes important findings from the 2010 National House Exit Polls conducted by Edison Research. The respondents
GOP Makes Big Gains among White Voters
 1 Especially among the Young and Poor GOP Makes Big Gains among White Voters As the country enters into the 2012 presidential election cycle, the electorate s partisan affiliations have shifted significantly
FOR RELEASE JANUARY 18, 2018
 FOR RELEASE JANUARY 18, 2018 FOR MEDIA OR OTHER INQUIRIES: Carroll Doherty, Director of Political Research Jocelyn Kiley, Associate Director, Research Olivia O Hea, Communications Assistant 202.419.4372
FOR RELEASE MARCH 20, 2018
 FOR RELEASE MARCH 20, 2018 FOR MEDIA OR OTHER INQUIRIES: Carroll Doherty, Director of Political Research Jocelyn Kiley, Associate Director, Research Olivia O Hea, Communications Assistant 202.419.4372
NUMBERS, FACTS AND TRENDS SHAPING THE WORLD. FOR RELEASE September 12, 2014 FOR FURTHER INFORMATION ON THIS REPORT:
 NUMBERS, FACTS AND TRENDS SHAPING THE WORLD FOR RELEASE September 12, 2014 FOR FURTHER INFORMATION ON THIS REPORT: Carroll Doherty, Director of Political Research Jocelyn Kiley, Associate Director Rachel
The Battleground: Democratic Analysis March 13 th, 2018
 The Battleground: Democratic Analysis March 13 th, 2018 By Celinda Lake, Daniel Gotoff, Gary Ritterstein, Corey Teter, and Hayley Cohen As the midterm election cycle picks up steam, American voters continue
RECOMMENDED CITATION: Pew Research Center, December, 2016, Low Approval of Trump s Transition but Outlook for His Presidency Improves
 NUMBERS, FACTS AND TRENDS SHAPING THE WORLD FOR RELEASE DECEMBER 8, 2016 FOR MEDIA OR OTHER INQUIRIES: Carroll Doherty, Director of Political Research Jocelyn Kiley, Associate Director, Research Bridget
National Tracking Poll
 National Tracking Poll Project: 190452 N Size: 1992 Registered Voters Margin of Error: ± 2% Topline Report April 19-21, 2019 P1 Now, generally speaking, would you say that things in the country are going
FOR RELEASE APRIL 26, 2018
 FOR RELEASE APRIL 26, 2018 FOR MEDIA OR OTHER INQUIRIES: Carroll Doherty, Director of Political Research Jocelyn Kiley, Associate Director, Research Bridget Johnson, Communications Associate 202.419.4372
THE 2004 NATIONAL SURVEY OF LATINOS: POLITICS AND CIVIC PARTICIPATION
 Summary and Chartpack Pew Hispanic Center/Kaiser Family Foundation THE 2004 NATIONAL SURVEY OF LATINOS: POLITICS AND CIVIC PARTICIPATION July 2004 Methodology The Pew Hispanic Center/Kaiser Family Foundation
RECOMMENDED CITATION: Pew Research Center, September, 2016, The Parties on the Eve of the 2016 Election: Two Coalitions, Moving Further Apart
 NUMBERS, FACTS AND TRENDS SHAPING THE WORLD FOR RELEASE SEPTEMBER 13, 2016 FOR MEDIA OR OTHER INQUIRIES: Carroll Doherty, Director of Political Research Jocelyn Kiley, Associate Director, Research Alec
The Cook Political Report / LSU Manship School Midterm Election Poll
 The Cook Political Report / LSU Manship School Midterm Election Poll The Cook Political Report-LSU Manship School poll, a national survey with an oversample of voters in the most competitive U.S. House
Romney Leads GOP Contest, Trails in Matchup with Obama
 WEDNESDAY, MARCH 14, 2012 Gas Prices Offset Good News about Jobs Romney Leads GOP Contest, Trails in Matchup with Obama FOR FURTHER INFORMATION CONTACT: Andrew Kohut President, Pew Research Center Carroll
PEW RESEARCH CENTER FOR MEDIA OR OTHER INQUIRIES:
 FOR MEDIA OR OTHER INQUIRIES: Carroll Doherty, Director of Political Research Jocelyn Kiley, Associate Director, Research Bridget Johnson, Communications Manager 202.419.4372 RECOMMENDED CITATION Pew Research
Six in 10 Say Ban Assault Weapons, Up Sharply in Parkland s Aftermath
 ABC NEWS/WASHINGTON POST POLL: Gun Policy EMBARGOED FOR RELEASE AFTER 7 a.m. Friday, April 20, 2018 Six in 10 Say Ban Assault Weapons, Up Sharply in Parkland s Aftermath Support for new gun laws has risen
Central Florida Puerto Ricans Findings from 403 Telephone interviews conducted in June / July 2017.
 Findings from 403 Telephone interviews conducted in June / July 2017. Background This memorandum summarizes a survey of Central Florida residents of Puerto Rican descent: We interviewed 403 Puerto Ricans
THE VANISHING CENTER OF AMERICAN DEMOCRACY APPENDIX
 APPENDIX Survey Questionnaire with Percentage Distributions of Response All numbers are weighted percentage of response. Figures do not always add up to 100 percent due to rounding. 1. When the government
National Tracking Poll
 National Tracking Poll Project: 180533 N Size: 1990 Registered Voters Margin of Error: ± 2% Topline Report May 17-19, 2018 P1 Question Response Frequency Percentage Now, generally speaking, would you say
American Values Survey Initial Report
 Initial Report FOR RELEASE: WEDNESDAY, SEPTEMBER 20, 2006 10:00 AM Robert P. Jones, Ph.D. Director and Senior Fellow Dan Cox Policy & Values Research Associate September 20, 2006 A Project of 2006 AMERICAN
PRRI/The Atlantic 2016 Post- election White Working Class Survey Total = 1,162 (540 Landline, 622 Cell phone) November 9 20, 2016
 November 9 20, 2016") December 1, PRRI/The Atlantic Post- election White Working Class Survey Total = 1,162 (540 Landline, 622 Cell phone) November 9 20, Thinking about the presidential election this year Q.1 A lot of people
December 1, PRRI/The Atlantic Post- election White Working Class Survey Total = 1,162 (540 Landline, 622 Cell phone) November 9 20, Thinking about the presidential election this year Q.1 A lot of people
FOR RELEASE October 1, 2018
 FOR RELEASE October 1, 2018 FOR MEDIA OR OTHER INQUIRIES: Carroll Doherty, Director of Political Research Jocelyn Kiley, Associate Director, Research Bridget Johnson, Communications Manager 202.419.4372
United States General Exit Poll PRES04 - Horizontal Percentages Time of Weighting: 11/2/2004 7:33:46 PM Time Created: 11/2/2004 7:33:46 PM
 Page 1 of 12 Number of Interviews - 11,027 Vote Estimate Not for On-Air 100 51 48 1 - Use Are you: (n=10,978) Male 46 47 51 1-2 Female 54 54 45 1 2 Sex by race (n=10,824) White male 36 41 58 1 - White
Institute for Public Policy
 Institute for Public Policy 2018 Gubernatorial Race Report of Findings October 2018 Table of Contents SECTION ONE About the Poll SECTION TWO Project Overview SECTION THREE Key Findings & Headlines SECTION
Catholic voters presidential preference, issue priorities, and opinion of certain church policies
 Catholic voters presidential preference, issue priorities, and opinion of certain church policies This memo highlights the findings from a national public opinion survey conducted for Catholics for Choice
National Tracking Poll
 National Tracking Poll Project: 180724 N Size: 1991 Registered Voters Margin of Error: ± 2% Topline Report July 13-14, 2018 P1 Question Response Frequency Percentage Now, generally speaking, would you
BLISS INSTITUTE 2006 GENERAL ELECTION SURVEY
 BLISS INSTITUTE 2006 GENERAL ELECTION SURVEY Ray C. Bliss Institute of Applied Politics The University of Akron Executive Summary The Bliss Institute 2006 General Election Survey finds Democrat Ted Strickland
FOR RELEASE DECEMBER 07, 2017
 FOR RELEASE DECEMBER 07, 2017 FOR MEDIA OR OTHER INQUIRIES: Carroll Doherty, Director of Political Research Jocelyn Kiley, Associate Director, Research Bridget Johnson, Communications Associate 202.419.4372
National: Trump Down, Dems Up, Russia Bad, Kushner Out
 Please attribute this information to: Monmouth University Poll West Long Branch, NJ 07764 www.monmouth.edu/polling Follow on Twitter: @MonmouthPoll Released: Wednesday, 7, Contact: PATRICK MURRAY 732-979-6769
Inside Trump s GOP: Not what you think July National Phone Survey & Factor Analysis from April Battleground Phone Survey.
 Inside Trump s GOP: Not what you think July National Phone Survey & Factor Analysis from April Battleground Phone Survey July 2018 Methodology: July national phone survey. Democracy Corps and Greenberg
Institute for Public Policy
 Institute for Public Policy 2018 Gubernatorial Race Report of Findings Table of Contents SECTION ONE About the Poll SECTION TWO Project Overview SECTION THREE Key Findings & Headlines SECTION FOUR Detailed
American Values Survey Initial Report
 Initial Report Robert P. Jones, Ph.D. Director and Senior Fellow Dan Cox Policy & Values Research Associate October 25, 2006 (Initial Release September 20, 2006) www.centerforamericanvalues.org At 2006
2018 Vote Margin Narrows as Democratic Engagement Slips
 ABC NEWS/WASHINGTON POST POLL: 2018 Midterms EMBARGOED FOR RELEASE AFTER 7:00 a.m. Monday, April 16, 2018 2018 Vote Margin Narrows as Democratic Engagement Slips A Democratic advantage in the upcoming
It s Democrats +8 in Likely Voter Preference, With Trump and Health Care on Center Stage
 ABC NEWS/WASHINGTON POST POLL: The 2018 Midterm Elections EMBARGOED FOR RELEASE AFTER 12:00 a.m. Sunday, Nov. 4, 2018 It s Democrats +8 in Likely Voter Preference, With Trump and Health Care on Center
National Tracking Poll
 National Tracking Poll Project: 180647 N Size: 1990 Registered Voters Margin of Error: ± 2% Topline Report June 28-29, 2018 P1 Question Response Frequency Percentage Now, generally speaking, would you
An in-depth examination of North Carolina voter attitudes in important current issues. Registered Voters in North Carolina
 An in-depth examination of North Carolina voter attitudes in important current issues Registered Voters in North Carolina January 21-25, 2018 Table of Contents Key Survey Insights... 3 Satisfaction with
Nevada Poll Results Tarkanian 39%, Heller 31% (31% undecided) 31% would renominate Heller (51% want someone else, 18% undecided)
 31% would renominate Heller (51% want someone else, 18% undecided)") Nevada Poll Results Tarkanian 39%, Heller 31% (31% undecided) 31% would renominate Heller (51% want someone else, 18% undecided) POLLING METHODOLOGY For this poll, a sample of likely Republican households
Nevada Poll Results Tarkanian 39%, Heller 31% (31% undecided) 31% would renominate Heller (51% want someone else, 18% undecided) POLLING METHODOLOGY For this poll, a sample of likely Republican households
RECOMMENDED CITATION: Pew Research Center, July, 2015, Negative Views of Supreme Court at Record High, Driven by Republican Dissatisfaction
 NUMBERS, FACTS AND TRENDS SHAPING THE WORLD FOR RELEASE JULY 29, 2015 FOR FURTHER INFORMATION ON THIS REPORT: Carroll Doherty, Director of Political Research Bridget Jameson, Communications Associate 202.419.4372
Support for Gun Checks Stays High; Two-Thirds Back a Path for Immigrants
 ABC NEWS/WASHINGTON POST POLL: Gun Control, Immigration & Politics EMBARGOED FOR RELEASE AFTER 7 a.m. Tuesday, April 16, 2013 Support for Gun Checks Stays High; Two-Thirds Back a Path for Immigrants Support
FREE EXPRESSION ON CAMPUS: WHAT COLLEGE STUDENTS THINK ABOUT FIRST AMENDMENT ISSUES
 FREE EXPRESSION ON CAMPUS: WHAT COLLEGE STUDENTS THINK ABOUT FIRST AMENDMENT ISSUES A GALLUP/KNIGHT FOUNDATION SURVEY WITH SUPPORT FROM: COPYRIGHT STANDARDS This document contains proprietary research
PRRI/The Atlantic April 2016 Survey Total = 2,033 (813 Landline, 1,220 Cell phone) March 30 April 3, 2016
 March 30 April 3, 2016") 7, PRRI/The Atlantic Survey Total = 2,033 (813 Landline, 1,220 Cell phone) March 30 3, Q.1 Now we d like your views on some political leaders. Would you say your overall opinion of [INSERT; RANDOMIZE LIST]
7, PRRI/The Atlantic Survey Total = 2,033 (813 Landline, 1,220 Cell phone) March 30 3, Q.1 Now we d like your views on some political leaders. Would you say your overall opinion of [INSERT; RANDOMIZE LIST]
Californians. their government. ppic state wide surve y MARCH in collaboration with The James Irvine Foundation CONTENTS
 ppic state wide surve y MARCH 2014 Californians & their government Mark Baldassare Dean Bonner Sonja Petek Jui Shrestha CONTENTS About the Survey 2 Press Release 3 State Government 6 Federal Government
American Politics and Foreign Policy
 American Politics and Foreign Policy Shibley Telhami and Stella Rouse Principal Investigators A survey sponsored by University of Maryland Critical Issues Poll fielded by Nielsen Scarborough Survey Methodology
FOR RELEASE MAY 3, 2018
 FOR RELEASE MAY 3, 2018 FOR MEDIA OR OTHER INQUIRIES: Carroll Doherty, Director of Political Research Jocelyn Kiley, Associate Director, Research Bridget Johnson, Communications Associate 202.419.4372
4. The Hispanic Catholic Vote
 Catholics for a Free Choice 2004 Survey of Catholic Likely Voters Page 2 4. The Hispanic Catholic Vote The Catholic Hispanic vote represents millions of Americans, and is a growing force in American political
National Tracking Poll
 National Tracking Poll Project: 180612 N Size: 1994 Registered Voters Margin of Error: ± 2% Topline Report June 07-10, 2018 P1 Question Response Frequency Percentage Now, generally speaking, would you
POLITICS AND THE PRESIDENT April 6-9, 2006
 CBS NEWS POLL For release: April 10, 2006 6:30 P.M. POLITICS AND THE PRESIDENT April 6-9, 2006 Although President Bush s approval ratings have stopped the downward slide that occurred earlier this year
Institute for Public Policy
 Institute for Public Policy 2018 Gubernatorial Race Report of Findings November 2018 Table of Contents SECTION ONE About the Poll SECTION TWO Project Overview SECTION THREE Key Findings & Headlines SECTION
HART RESEARCH ASSOCIATES/PUBLIC OPINION STRATEGIES Study # page 1
 HART RESEARCH ASSOCIATES/PUBLIC OPINION STRATEGIES Study #17505 -- page 1 Interviews: 900 Adults, including 405 respondents with a cell phone only and Date: December 13-15, 2017 12 respondents reached
National Tracking Poll
 National Tracking Poll Project: 181015 N Size: 2189 Registered Voters Margin of Error: ± 2% Topline Report October 07-07, 2018 P1 Question Response Frequency Percentage Now, generally speaking, would you
The 2014 Jewish Vote National Post-Election Jewish Survey. November 5, 2014
 The 14 Jewish Vote National Post-Election Jewish Survey November 5, 14 Methodology National survey of 8 Jewish voters in 14 election conducted November 4, 14; margin of error +/- 3.5 percent National survey
Working-Class Whites Poll Selected Findings
 Kaiser Family Foundation/CNN Working-Class Whites Poll Selected Findings September 2016 Kaiser Family Foundation/CNN Working-Class Whites Poll Conventional Wisdom September 2016 Exhibit 1.1 Working-Class
Amid Record Low One-Year Approval, Half Question Trump s Mental Stability
 ABC NEWS/WASHINGTON POST POLL: Trump s First Year EMBARGOED FOR RELEASE AFTER 12:01 a.m. Sunday, Jan. 21, 2018 Amid Record Low One-Year Approval, Half Question Trump s Mental Stability A year in the presidential
RECOMMENDED CITATION: Pew Research Center, August, 2016, On Immigration Policy, Partisan Differences but Also Some Common Ground
 NUMBERS, FACTS AND TRENDS SHAPING THE WORLD FOR RELEASE AUGUST 25, 2016 FOR MEDIA OR OTHER INQUIRIES: Carroll Doherty, Director of Political Research Jocelyn Kiley, Associate Director, Research Bridget
Hillary Clinton, 83% of Democrats said favorable, only 6% of Republicans gave her that mark.
 ROCK HILL, SOUTH CAROLINA With the Nov. 8 election approaching quickly, likely voters in Virginia support Hillary Clinton to become the 45th president, according to the latest Winthrop Poll. Forty-one
2016 Texas Lyceum Poll
 2016 of Immigration, Discrimination, Transgender Student Facility Access, Medicaid Expansion, Voter ID, and Ride-Hailing Regulation Attitudes A September 1-11, 2016 survey of adult Texans reveals they
November 2018 Hidden Tribes: Midterms Report
 November 2018 Hidden Tribes: Midterms Report Stephen Hawkins Daniel Yudkin Miriam Juan-Torres Tim Dixon November 2018 Hidden Tribes: Midterms Report Authors Stephen Hawkins Daniel Yudkin Miriam Juan-Torres
National Tracking Poll
 National Tracking Poll Project: 181064 N Size: 1961 Registered Voters Margin of Error: ± 2% Topline Report October 30 - November 02, 2018 P1 Question Response Frequency Percentage Now, generally speaking,
Religion In Campaign 08 CLINTON AND GIULIANI SEEN AS NOT HIGHLY RELIGIOUS; ROMNEY S RELIGION RAISES CONCERNS
 FOR RELEASE: THURSDAY SEPTEMBER 6, 2007 2:00 PM Religion In Campaign 08 CLINTON AND GIULIANI SEEN AS NOT HIGHLY RELIGIOUS; ROMNEY S RELIGION RAISES CONCERNS Also inside Social issues trumped by economy,
Support for Abortion Slips
 Support for Abortion Slips Issue Ranks Lower on the Agenda Oct. 1, 2009 In this report: Overview Support for Legal Abortion; Restricting and Reducing Abortion Importance of Abortion as an Issue; Confidence
HART RESEARCH ASSOCIATES/PUBLIC OPINION STRATEGIES Study # page 1
 HART RESEARCH ASSOCIATES/PUBLIC OPINION STRATEGIES Study #181489 -- page 1 Interviews: 900 Adults, including 405 respondents with a cell phone only and Date: December 9-12, 2018 16 respondents reached
Inside Trump s GOP: not what you think Findings from focus groups, national phone survey, and factor analysis
 Date: August 3, 2018 To: From: Friends of Stanley Greenberg and James Carville Nancy Zdunkewiz Inside Trump s GOP: not what you think Findings from focus groups, national phone survey, and factor analysis
Muhlenberg College/Morning Call 2018 Midterm Election Survey April Wave
 Muhlenberg College/Morning Call 2018 Midterm Election Survey April Wave Key Findings: 1. With about 7 months remaining before the 2018 elections Democratic candidates are in strong positions across an
Obama and Immigration: What He Did vs. How He Did it
 ABC NEWS/WASHINGTON POST POLL: Immigration EMBARGOED FOR RELEASE AFTER 7 a.m. Wednesday, Dec. 17, 2014 Obama and Immigration: What He Did vs. How He Did it A slim majority of Americans support the immigration
Low Marks for the 2012 Election
 THURSDAY, NOVEMBER 15, 2012 Voters Pessimistic About Partisan Cooperation Low Marks for the 2012 Election FOR FURTHER INFORMATION CONTACT: Andrew Kohut President, Pew Research Center Carroll Doherty and
Most are skeptical Trump will act to block future Russian meddling
 FOR RELEASE MARCH 15, 2018 Public Confidence in Mueller s Investigation Remains Steady Most are skeptical Trump will act to block future Russian meddling FOR MEDIA OR OTHER INQUIRIES: Carroll Doherty,
FOR RELEASE AUGUST 16, 2018
 FOR RELEASE AUGUST 16, 2018 FOR MEDIA OR OTHER INQUIRIES: Carroll Doherty, Director of Political Research Jocelyn Kiley, Associate Director, Research Bridget Johnson, Communications Manager 202.419.4372
These are the highlights of the latest Field Poll completed among a random sample of 997 California registered voters.
 THE FIELD POLL THE INDEPENDENT AND NON-PARTISAN SURVEY OF PUBLIC OPINION ESTABLISHED IN 1947 AS THE CALIFORNIA POLL BY MERVIN FIELD Field Research Corporation 601 California Street, Suite 900 San Francisco,
;alsdkjf;alskdnfasldkfjalksdjf
 ;alsdkjf;alskdnfasldkfjalksdjf EXECUTIVE SUMMARY The Bowen Center for Public Affairs at Ball State University is pleased to partner again this year with WISH- TV, Channel 8, in Indianapolis, in presenting
Growing share of public says there is too little focus on race issues
 FOR RELEASE DECEMBER 19, 2017 Most Americans Say Trump s Election Has Led to Worse Race Relations in the U.S. Growing share of public says there is too little focus on race issues FOR MEDIA OR OTHER INQUIRIES:
WHITE EVANGELICALS, THE ISSUES AND THE 2008 ELECTION October 12-16, 2007
 CBS NEWS POLL For release: Thursday, October 18, 2007 6:30 PM EDT WHITE EVANGELICALS, THE ISSUES AND THE 2008 ELECTION October 12-16, 2007 Evangelicals have become important supporters of the Republican
The Battleground: Democratic Perspective September 7 th, 2016
 The Battleground: Democratic Perspective September 7 th, 2016 Democratic Strategic Analysis: By Celinda Lake, Daniel Gotoff, and Corey Teter As we enter the home stretch of the 2016 cycle, the political
Public Preference for a GOP Congress Marks a New Low in Obama s Approval
 ABC NEWS/WASHINGTON POST POLL: Obama and 2014 Politics EMBARGOED FOR RELEASE AFTER 12:01 a.m. Tuesday, April 29, 2014 Public Preference for a GOP Congress Marks a New Low in Obama s Approval Weary of waiting
Fewer Are Angry at Government, But Discontent Remains High
 THURSDAY, MARCH 3, 2011 Republicans, Tea Party Supporters More Mellow Fewer Are Angry at Government, But Discontent Remains High FOR FURTHER INFORMATION CONTACT: Andrew Kohut President, Pew Research Center
PPIC STATEWIDE SURVEY
 PPIC STATEWIDE SURVEY SEPTEMBER 2004 Californians and Their Government Public Policy Institute of California Mark Baldassare Research Director & Survey Director The Public Policy Institute of California
Some Gun Measures Broadly Backed But the Politics Show an Even Split
 ABC NEWS/WASHINGTON POST POLL: Gun Control EMBARGOED FOR RELEASE AFTER 7 a.m. Tuesday, March 12, 2013 Some Gun Measures Broadly Backed But the Politics Show an Even Split While Senate negotiators struggle
Civitas Institute North Carolina Statewide Poll Results November 17 19, 2018
 Civitas Institute North Carolina Statewide Poll Results November 17 19, 2018 Q. First, did you vote in the recent elections that took place on November 6th? Yes 100% Q. Do you feel things in the United
CONGRESS, THE FOLEY FALLOUT AND THE NOVEMBER ELECTIONS October 5 8, 2006
 CBS NEWS/NEW YORK TIMES POLL For release: Monday, October 9, 2006 6:30 P.M. CONGRESS, THE FOLEY FALLOUT AND THE NOVEMBER ELECTIONS October 5 8, 2006 Americans give Republican Congressional leaders terrible
Californians & Their Government
 Californians & Their Government Mark Baldassare Dean Bonner David Kordus Lunna Lopes CONTENTS Press Release 3 Federal Government 6 State Government 15 Regional Map 22 Methodology 23 Questionnaire and Results
The 2016 Election: What Just Happened?
 The 2016 Election: What Just Happened? Polling Misses by State Polling Misses by State Polling Misses by State Polling Misses by State Jennifer Wolak University of Colorado Boulder A story to start - Travel
RECOMMENDED CITATION: Pew Research Center, May, 2015, Negative Views of New Congress Cross Party Lines
 NUMBERS, FACTS AND TRENDS SHAPING THE WORLD FOR RELEASE MAY 21, 2015 FOR FURTHER INFORMATION ON THIS REPORT: Carroll Doherty, Director of Political Research Jocelyn Kiley, Associate Director, Research
National Tracking Poll
 National Tracking Poll Project: 190125 N Size: 1984 Registered Voters Margin of Error: ± 2% Topline Report January 11-14, 2019 P1 Question Response Frequency Percentage Now, generally speaking, would you
HIGH POINT UNIVERSITY POLL MEMO RELEASE 9/24/2018 (UPDATE)
") HIGH POINT UNIVERSITY POLL MEMO RELEASE 9/24/2018 (UPDATE) ELEMENTS Population represented Sample size Mode of data collection Type of sample (probability/nonprobability) Start and end dates of data collection
HIGH POINT UNIVERSITY POLL MEMO RELEASE 9/24/2018 (UPDATE) ELEMENTS Population represented Sample size Mode of data collection Type of sample (probability/nonprobability) Start and end dates of data collection
PEW RESEARCH CENTER. FOR RELEASE January 16, 2019 FOR MEDIA OR OTHER INQUIRIES:
 FOR RELEASE January 16, 2019 FOR MEDIA OR OTHER INQUIRIES: Carroll Doherty, Director of Political Research Jocelyn Kiley, Associate Director, Research Bridget Johnson, Communications Manager 202.419.4372
Focus on OUR Concerns
 Voters to Washington in 2018: Focus on OUR Concerns An analysis of the 2018 Midterm Elections The Winston Group 101 Constitution Ave. NW, Suite 710 East Washington, DC 20001 www.winstongroup.net Table
FOR RELEASE MAY 10, 2018
 FOR RELEASE MAY 10, 2018 FOR MEDIA OR OTHER INQUIRIES: Carroll Doherty, Director of Political Research Jocelyn Kiley, Associate Director, Research Olivia O Hea, Communications Assistant 202.419.4372 RECOMMENDED
National Tracking Poll
 National Tracking Poll Project: 180416 N Size: 1917 Registered Voters Margin of Error: ± 2% Topline Report April 12-17, 2018 P1 Question Response Frequency Percentage Now, generally speaking, would you
Californians. their government. ppic state wide surve y SEPTEMBER supported with funding from The James Irvine Foundation CONTENTS
 ppic state wide surve y SEPTEMBER 2015 Californians & their government Mark Baldassare Dean Bonner David Kordus Lunna Lopes CONTENTS About the Survey 2 Press Release 3 State Government 6 Federal Government
VOTERS AND HEALTH CARE IN THE 2018 CONGRESSIONAL ELECTION
 VOTERS AND HEALTH CARE IN THE 2018 CONGRESSIONAL ELECTION October 2018 TABLE OF CONTENTS PART I: PRESIDENT TRUMP... 1 PART II: NATIONAL PRIORITIES... 2 PART III: HEALTH CARE... 3 VOTERS AND HEALTH CARE
PENNSYLVANIA: SMALL GOP LEAD IN CD01
 Please attribute this information to: Monmouth University Poll West Long Branch, NJ 07764 www.monmouth.edu/polling Follow on Twitter: @MonmouthPoll Released: Wednesday, October 3, Contact: PATRICK MURRAY
National Tracking Poll
 National Tracking Poll Project: 190140 N Size: 1996 Registered Voters Margin of Error: ± 2% Topline Report January 18-22, 2019 P1 Now, generally speaking, would you say that things in the country are going
National Tracking Poll
 National Tracking Poll Project: 181111 N Size: 1952 Registered Voters Margin of Error: ± 2% Topline Report November 07-09, 2018 Question Response Frequency Percentage dempol1 Did you vote in the 2018 midterm
The 2006 United States Senate Race In Pennsylvania: Santorum vs. Casey
 The Morning Call/ Muhlenberg College Institute of Public Opinion The 2006 United States Senate Race In Pennsylvania: Santorum vs. Casey KEY FINDINGS REPORT September 26, 2005 KEY FINDINGS: 1. With just
Discomfort with Social Directions Marks a Charged Political Landscape
 ABC NEWS/WASHINGTON POST POLL: Social Issues EMBARGOED FOR RELEASE AFTER 7 a.m. Wednesday, July 22, 2015 Discomfort with Social Directions Marks a Charged Political Landscape Americans by a wide margin
NEW JERSEY: DEM MAINTAINS EDGE IN CD11
 Please attribute this information to: Monmouth University Poll West Long Branch, NJ 07764 www.monmouth.edu/polling Follow on Twitter: @MonmouthPoll Released: Tuesday, October 9, Contact: PATRICK MURRAY