Bargaining over a New Welfare State
|
|
|
- Emil Hines
- 5 years ago
- Views:
Transcription
1 Bargaining over a New Welfare State A Model of the Regional Distribution of New Deal Funds Alessandro Bonatti Yale University Kaj Thomsson Yale University February 2, 2007 Abstract We develop a theoretical model of bargaining in the US Congress and we apply it to the presidential period of Franklin Roosevelt. The goal of the paper is twofold: rst, to improve our understanding of the objectives behind the New Deal; secondly, by developing an estimable model of the US Congress, to narrow the gap between formal models of legislatures and their empirical or qualitative counterparts. In the theoretical model, the distribution of federal funds across di erent regions of the country is the outcome of a bargaining game in which the President acts as the agenda-setter and Congress bargains over the nal shape of the spending bill. For any set of preferences (for the President) and any given distribution of seats in the Congress, we can solve the model for a unique predicted outcome. We then use the actual distributions for several New Deal programs to estimate the preference parameters of the Roosevelt administration. We link theory to data and estimate the model s parameters using a simple minimum distance approach. The results indicate that economic concerns for relief and recovery, though not necessarily for fundamental reform and development, largely drove the New Deal, and that political concerns mattered, but more on the margin. We would like to thank Hanming Fang, Tim Guinnane, David Mayhew, Ben Polak, Kenneth Scheve, John Wallis and Gavin Wright for very helpful comments and suggestions. We also thank Florian Plöckl for his generous help with the regional characterizations and Price Fishback for kindly sharing his data with us. 1
2 1 Introduction The New Deal period was, by most accounts, the birth of the US welfare state. It was an era of unprecedented growth in government spending, and in the scope of activities performed by the federal government. In the mid 1920 s, total federal (non-military) spending were approximately 3 percent of GNP, while in the mid 1930 s this gure had increased to about 10 percent. The support for state and local government expenditures from the federal level also increased dramatically. In the early part of the 20th Century, less than one percent of state and local revenues came from the federal government, while in the late 1930 s about 15 percent of state and local revenues were federal aid. 1 since. 2 The New Deal was controversial already from the beginning and has stayed controversial ever Of particular relevance here is the o cial line of the three R s (relief, recovery and reform) emphasized by the New Dealers as the motivation behind this increase in federal spending and federal aid to the local level. However, Roosevelt s critics accused him of using national funds in order to reward Democratic states as well as to gain popularity in potential swing states. Economic historians have long been interested in this debate about the motivation behind the New Deal, and the determinants of the New Deal spending allocation. As stated by John Wallis, the question of focus in this New Deal literature has been: Did Roosevelt and the New Dealers allocate money between states to achieve their stated goals of relief and reform by giving money to states with lower employment and lower incomes, or did they promote their won interests and allocate more money to states that were politically sensitive? [Wallis, 1998] This empirical literature started with Reading (1973), who developed a simple model in order to test whether the New Deal spending pattern was in fact consistent with a focus on reform and relief/recovery. The reform variables contained variables such as per capita income and percentage of African-American households, and the relief variables measured changes in state-level macro indicators such as unemployment and aggregate income. Reading s analysis lent no support to the stated goals of reform, but he did nd support for the idea that economic recovery was a motivating factor, driving the New Deal allocation pattern across states. The second classic study in this New Deal literature, Wright (1974), built on the analysis of Reading to investigate a potentially political motive behind the New Deal. Speci cally, Wright added a number of political variables to the dataset created by Reading. In particular, Wright constructed a political productivity index, intended to capture the possibility that the Roosevelt administration systematically favored potential swing states in order to secure reelection for himself 1 These values are taken from Wallis (1985) and Wallis (1998). 2 The attacks have come from the left as well as from the right, on a number of di erent topics and from a number of di erent angles. Among many others, the New Deal has been criticized by Zinn (1966) and Bernstein (1968) for being essentially conservative, by Powell (2003) and Cole and Ohanian (2004) for prolonging the Great Depression, by Libecap (1998) for instigating a lasting system of state intervention in agricultural markets, and by Flynn (1934) for being basically fascist. 2
3 and to secure a Democratic majority in the Congress. Wright did nd support for the idea that there was a political motivation behind the New Deal allocation, and that this political motivation was non-negligible; his political variables did a better job in explaining the spending pattern than the variables re ecting the economic concerns related to relief, recovery and reform. These two studies, and in particular the conclusion in Wright (1974) regarding the political motivation behind the New Deal, generated a signi cant amount of following research. Recently, Anderson and Tollison (1991) included a number of variables intended to capture the role of Congress in the determination of the New Deal allocation, and concluded that the New Deal was primarily driven by political concerns, both by the Roosevelt administration and individual Congress members. The studies discussed above suggest that the implementation of the New Deal, or at least the distribution of the major programs, might have been politically rather than economically motivated. However, in a series of papers, John Wallis (1984, 1985, 1998) derives results that depart from this view. According to Wallis, both economic and political concerns were important to the New Dealers, and these di erent motives interacted in ways that are not perfectly captured by the other studies. In his papers, Wallis takes the position that the distribution of New Deal funds was primarily motivated by economic concerns, but that political concerns mattered too, and that the economic reasons behind the programs interacted with political motives. Most recently, in joint work with Price Fishback and Shawn Kantor, Wallis argues that: Roosevelt s successful reelections were based on developing speci c programs for a broad range of constituents, delivering on his stated goals, but also spending more at the margin for political purposes. [Fishback, Kantor and Wallis, 2003] To summarize, previous studies provide support for the idea that political purposes probably in uenced the spending pattern of the New Deal. However, there is no consensus regarding the relative in uence of political motives and economic concerns. A serious challenge for the authors in this literature, as pointed out by Wallis, is the interaction between economic and political concerns. If some states were both economically sound and politically favorable targets for the President, the di erent possible motives behind the distribution of funds is di cult to disentangle. All of the studies described above attempt to control for characteristics that might contaminate their estimates of the relevant parameters. However, none of the papers mentioned above provide a formal model, neither for the game between the President and the Congress members, nor for the intra-congress bargaining. Hence, the exact meaning of the parameter estimates in the studies by Reading, Wright, Anderson and Tollison, Wallis and others is still not perfectly clear. believe that a formal treatment of this topic can provide some additional structure helpful for the interpretation of the di ering and sometimes non-comparable results. 3 3 There are a few papers, such as Fleck (1999, 2001) and Strömberg (2004), that do develop formal models in order to interpret various aspects of the New Deal spending. These papers, however, di er signi cantly from ours in their methodological approach and/or their posed question. Fleck assumes that the President was trying to maximize his reelection probability, derive predictions and then test these predictions. His ndings broadly support they idea that We 3
4 Speci cally, in this paper we provide a formal model of the interaction between the President and the Congress during the implementation of new spending programs. We model the resulting allocation of funds as a function of the President s preferences and of the distribution of seats in Congress. We estimate the relevant parameters of the model using data from New Deal programs. Our model accounts for what we believe to be the key features of the President-Congress bargaining game. We wish to stress, however, that we do not attempt to capture the full richness of the previous studies on this topic, as the computational limitations implied by the formal modeling approach makes this impossible. Most importantly, we limit ourselves to try to understand the roles of the President and the Congress, while leaving the execution of the programs unmodeled. Hence, this paper should appropriately be viewed as a complement, not a substitute, to the existing empirical literature on the determinants of the allocation of New Deal funds. In addition to the contribution it hopefully makes to the New Deal debate, this paper can be viewed as an attempt to place models of legislative bargaining in a more concrete setting. The bulk of theoretical (formal) political economy research on legislative bargaining is highly abstract, 4 and while research in this tradition has provided valuable insights about the general nature of the role constitutions and agenda-setting power for the outcome of legislation, it provides limited guidance for understanding the outcome of particular legislative sessions or speci c periods of major reform. Instead of a general theory of legislative bargaining, our paper provides a model of a speci c legislative setting. 5 Hence, our paper can also be viewed as an alternative case-based or bottomup approach to the formal modeling of legislatures. Hopefully, this approach can generate insights that would not trivially follow from more general theoretical models. In the rest of the paper, we rst describe extensively our modeling approach and the preferences of the players involved. We then formally describe our theoretical setup and derive a number of propositions that characterize the outcome of the interaction between the President and Congress. Two simple examples illustrate how the equilibrium of our formal model can be found and characterized, under di erent assumptions on the New Dealers motivations. The theoretical part is followed by an empirical part, where we describe the data, the empirical approach and the resulting parameter estimates. The nal section concludes and discusses interesting venues for future research. 2 States, Regions and Goals As mentioned in the introduction, the focus of this paper is on the interaction between the President and the Congress, with speci c attention paid to the role of Congress in shaping legislation political (reelection) concerns did matter. He is, however, not able to assess the relative importance of this and other motives. Strömberg, on the other hand, does estimate the structural parameters of his model. The model, however, is con ned to an analysis of the impact of media on the spending of one particular program (FERA) - i.e. he does not attempt to say anything about the aggregate distribution of New Deal funds. 4 Notable contributions to this literature include Baron and Ferejohn (1989), Baron (1996) and Banks and Duggan (2000). 5 In this regard, our paper is perhaps most closely related to the work of Knight (2004, 2005), who uses the model of Baron and Ferejohn (1989) in applied settings. 4
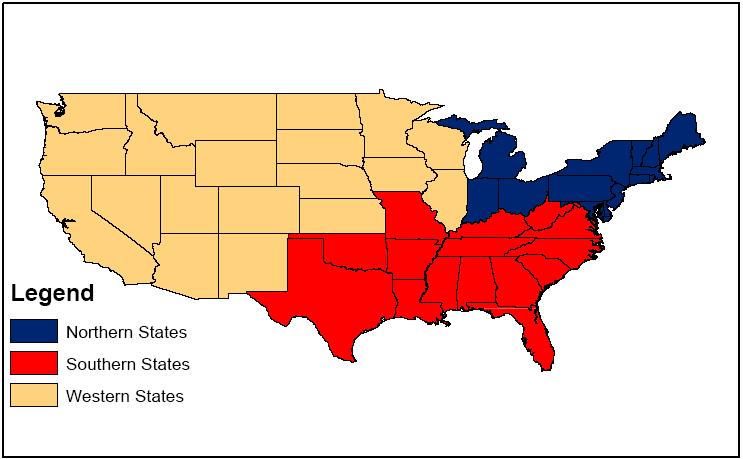
5 introduced by the President. With the goal of empirically estimating the relevant parameters of the model, any attempt to formally model the complex nature of congressional bargaining must restrict itself to a stylized setting. In this paper, we rely on the fact that during the period of consideration, the US was divided in several ways that correlated with broad geographic regions. After careful consideration of the data, we believe that an appropriate simpli cation is to divide the country into a smaller number of regions. More speci cally, we believe that the optimal trade-o between simplicity and transparency on one hand, and realism on the other, is model with focus on three regions: the South, the North and the West. During the period we are interested in these regions di ered signi cantly, both economically and politically, but the states were remarkably homogenous within each region. The assignment of states to regions (Table 12), together with a map showing the correlation between our classi cation and the political division of the country at that time (Figure 2), is shown in the Appendix. The formal model takes into account that these regions were represented with di erent shares of seats in the Senate and the House of Representatives. A greater share of the seats in any of the two chambers implied a greater bargaining power, something that had to be taken into consideration by the Roosevelt administration when designing the bills for the New Deal programs. In order to distinguish the di erent possible motivations behind the New Deal, or more specifically the regional distribution of New Deal spending, we model the objective function of the Roosevelt administration as a combination of concerns for (i) relief and recovery, (ii) fundamental reform and development, (iii) political productivity/reelection probability, and (iv) rewarding Democrats. 6 These four possible concerns cover the di erent objectives that people in the aforementioned literature on the New Deal have been ascribing to the allocation of funds. Our theoretical model maps the relative strengths of the concerns into a proposal by Roosevelt as well as a nal bill passed - changed or unchanged - through the House and the Senate. 2.1 Assigning Goals to Regions In order to justify our assignment of goals to regions, we appeal to a number of aggregate economic, political and social statistics. These statistics show signi cant di erences among the three regions along several dimensions. We now proceed to describe the three regions. The South The rst of these, the South, was the poorest region in the country during the period of the New Deal. This is best seen by looking at the level of economic activity, as re ected in retail sales (Graph 1). 6 Of these four di erent motives/concerns, we consider the rst two to be economic and the last two political. 5
6 Retail Sales p.c NORTH SOUTH WEST Graph 1 Furthermore, the South was the least developed region of the country according to more general criteria, such as the illiteracy rate (Graph 2). Illiteracy Rate NORTH SOUTH WEST Graph 2 Hence, if fundamental reform and long-run development were the only considerations that went into the shaping of the New Deal, this region would have been the primary target of New Deal means. In addition to being poor, all of the states in this region were Democratic and had voted largely in support of Roosevelt in the 1932 election: 6
7 Democratic Vote Share 1932 Presidential Election NORTH SOUTH WEST Graph 3 Furthermore, their support had been solid over the previous decades. Hence, one would expect that a partisan executive branch, with the objective of rewarding states in which it had received support, would have yet another reason (in addition to their economic/reform needs) to target the states in the South. However, these states were also so solid in their support for the Democratic party that any reelection motive behind the allocation of New Deal funds would have had to be to their disadvantage. Finally, their actual drop in economic performance during the Great Depression was not as signi cant as the drop of the other regions. Hence, if the primary motive behind the New Deal was to provide short-term relief and/or recovery, this would also have been to the disadvantage of the Southern states. The West The second of the regions, the West, was also a largely Democratic region during the period of the New Deal implementation. Roosevelt won 58% of the popular vote in the West, and only four states had a signi cant republican representation in their congressional delegation. However, the states in the West were not nearly as solidly grounded in the Democratic camp as the states in the South. In fact, over the previous decades, support for the Democratic party in western states had been more volatile than anywhere else (Graph 4). 7
8 Std. Dev. Democratic Vote NORTH SOUTH WEST Graph 4 Hence, if the Roosevelt administration had political motives in mind when implementing the New Deal programs, one would expect the President to include the Western states both in attempts to reward its own base (and the Congress members from its party) and in attempts to secure electoral votes for coming elections. However, the states in the West were not as poor as the states in the South, which implies that a New Deal that was primarily motivated by fundamental economic reform would not have paid particular attention to these states. Finally, we emphasize that whether programs aiming at immediate relief and recovery would have been to the advantage of the West or not depends on what kind of program we are focusing on. Though the West was not hit as hard as the Northeast in terms of manufacturing output, it did su er a severe drop in agricultural output. This is illustrated in Graph 5, which shows the percentage of failing farmland in the di erent regions Failing Farmland 0.00 NORTH SOUTH WEST Graph 5 8
9 Hence, farming programs, and also public works programs, for which the West was a suitable target (due to its low level of existing infrastructure and its natural resources availability), would have provided relief and recovery in this region of the country. However, more general relief programs targeted at parts of the country in which the manufacturing sector was hard-hit were unlikely to have the states in the West as targets for provision of relief and recovery. The North The third of the regions, the North, was also richer than the South. Hence, in terms of need for fundamental reform and long-run development, one would not expect the New Deal programs to target the North. In addition, the North was largely Republican, so partisan concerns (i.e. a focus on Democratic states) would have added to the disadvantage of these states, in the sense of not being recognized and targeted for spending by the Presidential administration. The Northern states did, however, have two characteristics that potentially worked to their favor. They were not solidly Republican; FDR narrowly lost many of these states and in addition their support for the Democratic presidential contender in the recent history had been very low. Hence a reelection-motivated FDR would have had incentives to target these states with the objective of building popularity for coming elections. In addition, the industrial North was particularly hard-hit by the drop in the manufacturing sector. This is already evident in some early statistics, such as the 1930 unemployment rate (Graph 6). Unemployment Rate NORTH SOUTH WEST Graph 6 Hence, if relief / recovery was the primary motivation behind the New Deal, programs providing general relief should have been targeted at the Northern states. 2.2 New Deal Programs and FDR s Goals To summarize the previous description, we characterize the regions in the following way. 9
10 South West North Poor X Hard-hit X 7 X 8 Potential swing-state X X Democratic in previous election X X Table 1: Regional Characteristics Note that Table 1 classi es the West (the North) as being Hard-hit only as far as the agricultural (industrial) sector is concerned. Based on the characteristics above, we can nally assign goals to regions. In doing this, we allow money spent in a region to serve one or more of the administration s goals/motives. More importantly, following the classi cation of Table 1, we let the assignment of relief/recovery concerns to a given region depend on the type of program being considered. 9 Table 2 illustrates this assignment. In Table 2, r denotes general relief programs, f denotes farming programs and p denotes public works programs. South West North Reform/Development Concerns X Relief and Recovery Concerns p p; f r; p Productivity/Reelection Concerns X X Partisanship/Rewarding Concerns X X Table 2: Goals-to-Regions Assignment 2.3 Preferences Before turning to the formal model, the reader should note that we make a number of restrictions with respect to the preferences of the President and the Congress members. Some of them have been mentioned above. In addition, we do not explicitly analyze preferences over the revenue generating process. That is, we focus exclusively on the spending side of the New Deal, and therefore implicitly assume that any preferences that the President and the legislators might have had over the tax collection (and over budget de cit levels) did not interact with their preferences for the shape of the spending. This is a signi cant simpli cation, but one that is, to the very least, in line with the previous literature to which we hope to make a contribution. Regarding the Congress members, we assume that they are perfect representatives of their constituencies, with preferences de ned (only) over the allocation received by their states. This is also a signi cant simpli cation, and one that would be interesting to extend. In the conclusion, we discuss how this could be extended. 7 The West is considered hard-hit when it comes to the agricultural sector. 8 The North is considered hard-hit when it comes to the industrial sector. 9 Regarding the assignment of relief and recovery concerns, we are agnostic about whether public works projects were used to provide relief/recovery, in addition to fundamental reform and long-run development, in the South. In the baseline model, we do include relief/recovery concerns for the South, in addition to the North and the West (who both experienced signi cant drops in di erent sectors). 10
11 Given these assumptions about the preferences, our paper should best be thought of as a model of an executive branch (with agenda-setting power) trying to implement a program with a particular allocation in mind. The executive faces an explicitly modeled congressional constraint generated by the need to reconcile the interests of legislators (with amending power) that represent di erent (and disjoint) constituencies. We do not claim that this representation captures everything that mattered during the implementation of the New Deal. However, we do believe that our setup captures some of the most important aspects that follow from the structure of the Congress and the con ict of interest between the President and the legislators. Without further excuses, we now turn to the formal model and the estimation of the parameters that capture the relative importance of the four di erent concerns/motives described above. 3 Theory 3.1 The Model We model the allocation decisions within each type of program as a separate bargaining game. In this game, the President acts as an agenda setter and Congress determines the nal division of a xed amount of resources. The set of congressional players is given by the three groups of states (regions) introduced above, I = fw est; North; Southg. An outcome of the bargaining game is simply a division of a unit size pie among the three regions X = (X W ; X N ; X S ) 2 2 : Each group i 2 I holds a fraction q i of the total seats in the House and a fraction p i of the seats in the Senate. No group has an absolute majority of seats in either chamber. Each group represents a fraction N i of the total U.S. population. In line with the description of congressmen s preferences, let the utility function of region i be given by: u i (x) = X i 8i 2 I Unlike congressional players, we allow the President to assign di erent weights to the various objectives he can pursue through the allocation of the pie. Let ; ; ; and represent the weights that the President assigns to political productivity, rewarding, relief/recovery and reform, respectively. We assume that the President s preferences are de ned over the per capita shares assigned to each group, weighted by population size and the parameters pertaining to the each group s characteristics. More speci cally, we assume the President s utility function to be given by: u P res (x) = X i2i c i N i ln x i where c i = [1 (i 2 P roductive) + 1 (i 2 Democrat) + 1 (i 2 HardHit) + 1 (i 2 P oor) ] This speci cation has the advantage of providing a straightforward characterization of the Presi- 11
12 dent s ideal allocation in the absence of political constraints: x i = c i N P i j2i c jn j For example, in the case of the general relief programs, the ideal allocation x is given by x W = x N = x S = N W ( + ) N W ( + ) + N N ( + ) + N S ( + ) N N ( + ) N W ( + ) + N N ( + ) + N S ( + ) N S ( + ) N W ( + ) + N N ( + ) + N S ( + ) The timing of the game re ects the description of the most important steps in the legislative process previously described. First, the President proposes a split of the total resources going into a particular program, where the split is denoted by x 2 2 : The House evaluates the proposal as follows: with an initial yes/no vote it determines whether to pass the bill on unchanged. This e ectively requires two groups voting in favor of the President s proposal. If the proposal passes unchanged, the Senate takes on the proposal. Otherwise, a House member is randomly selected to renegotiate the allocation, by proposing an amendment x 2 2. Each member has the same probability of being recognized. Hence, groups are recognized to make a proposal with probabilities proportional to their shares of seats q i in the House. An amendment proposal is e ectively a takeit-or-leave-it o er that one group of states makes to the rest of the chamber. The House votes on the proposed amendment, a positive vote resulting in the bill being passed on to the Senate, a negative vote implying the bill is scratched. The Senate follows a similar procedure, where the text approved by the House represents the initial proposal. The bargaining process in the Senate may yield a di erent outcome from that of the House because groups are represented in di erent proportions. If the Senate approves the initial proposal, then the outcome is directly implemented. However, if the Senate modi es the initial proposal, we model the outcome of bargaining in the Conference Committee as a convex combination of the House and Senate bills. In more precise terms, the president s strategy set consists of all possible proposals. A strategy for a congressional player is a more complicated object: for each chamber it consists of the following: (i) a mapping from proposals into a binary vote, (ii) a history independent amendment proposal and (iii) a function from amendments into binary votes. Note that we assume that congressman always vote for their preferred option, regardless of whether they could be pivotal. 3.2 Theoretical Results Proceeding by backward induction, we rst analyze the Senate bargaining subgame following the rejection of the House bill. At this stage, a senator is randomly selected an amender. Since the amender makes a take-it-or-leave it o er, she can propose an allocation in which her group keeps the 12
13 entire amount of resources. When a House bill (x) is introduced in the Senate, each congressional player (i) compares her payo from voting in favor of the bill (x i ) to the expected gains from rejecting it. 10 The extent of these gains is equal to the probability of a senator from group i being selected as a proposer at the subsequent amending stage: In this case, in fact, group i achieves a payo of 1; while it obtains a payo of zero otherwise. The probability of being recognized is in turn equal to the group s share of seats in the Senate (p i ). We summarize this discussion in Proposition 1. Proposition 1 The groups continuation values in the Senate are given by their shares of seats fp i g i2i : In our model, no group holds the majority of the seats in the Senate. It follows that the bills passed by the House that are also approved by the Senate are those in which at least two groups receive more than their continuation values. The next step is to analyze the game in the House following the rejection of the President s proposal. The representative who s selected as a proposer again holds all the bargaining power within the House. Broadly speaking, the amender chooses between two options: she can either propose an allocation that will be also approved by the Senate, or she can choose a proposal that will be amended in the Senate. The amender s optimal choice in the former class consists of acquiring the support of the group with the lowest continuation value in the Senate to form a coalition. In this case, the amender obtains a payo of x i = 1 min j6=i p j. The best option in the latter class is to keep the entire amount of resources (x i = 1), since the outcome of the Senate renegotiation stage is independent of the initial proposal. By construction, the rst type of proposal will be accepted by the Senate, while the second one will be rejected, leading to an expected outcome in the Senate of x = p: The Conference Committee will then determine the nal bill, which gives the House amender a payo of x i = 1 2 (x i = 1) (x i = p i ). We can therefore conclude the following: Proposition 2 The proposer s payo in the House is given by max 1 min p j; 1 + p i j6=i 2 Proposition 3 For any distribution of seats, all Representatives propose an amendment that will be approved by the Senate. Proof. For any p 2 2 such that p i 6= p j 8i; j ; it is the case that 1 min j6=i p j > 1+p i 2 : To see this, let the proposer be a member of group i and de ne p H := max j6=i p j and p L := min j6=i p j : Then note 1+p that 1 min j6=i p i 1 j 2 = p i + p H 2 p i 2 = 2p H 1+p i 2 = p H+(1 p L p i ) 1+p i 2 = 1 2 (p H p L ) > 0: 10 As customary in this literature, we focus on undominated strategies. We assume that each player s vote on a given proposal is uniquely based on her preferences. 13
14 Therefore, following rejection of the President s proposal,the group selected as an amender targets the group that holds the smallest share of seats in the Senate and o ers its continuation value. More speci cally, if p 1 > p 2 > p 3 ; groups 1 and 2 target group 3; while group 3 targets group 2: Proposition 4 The groups House continuation values are given by V 1 = q 1 (1 p 3 ) V 2 = q 2 (1 p 3 ) + q 3 p 2 V 3 = (1 q 3 ) p 3 + q 3 (1 p 2 ) where q i is group i s share of seats in the House. Naturally, the allocations passing in the House are those that provide expected utility levels E (x i ) V i for at least two members. Finally, it is important to observe that, if the President s proposal is rejected by the House, one congressional group will not be allocated any resources. Given our assumptions on the President s risk aversion, we obtain the following result: Corollary 5 The President always proposes an allocation that is approved by the House. 14
15 Given these results, and using the composition of Congress in 1932, the set of proposals that would be approved unchanged can be drawn as follows: Figure 1: Bargaining Outcomes and Congressional Constraints 3.3 Examples The following numerical examples illustrate the outcomes of the President-Congress bargaining game under di erent assumptions on the President s preferences. In particular, we maintain the composition of Congress in 1932 and consider the two cases in which the President pursues only economic goals (reform, recovery) and political goals (productivity, reform) respectively Economic Goals Suppose the President is equally interested in reform and recovery but completely uninterested in politics. In our model s terminology, this is equivalent to assuming = = 0 and = = 1 2 : As an example, consider a general relief program, such as unemployment bene ts. the President s 15
16 ideal allocation in this case would be given by x W = 0 x N = x S = N N = :57 N N + N S N S = :43 N N + N S and it would pass since both x N and x S exceed max fv N ; p N g and max fv S ; p S g respectively. Now, consider the case of a farming program. the President s ideal allocation is given by x W = N W = :45 N S + N W x N = 0 x S = N S = :55 N S + N W This allocation would also pass, though supported by a di erent majority coalition. Finally, for public works programs the President s ideal allocation would be given by N W x W = = :20 2N S + N W + N N N N x N = = :32 2N S + N W + N N x 2N S S = = :48 2N S + N W + N N This allocation would pass in the House since both the West and the South would endorse it, and it would pass in the Senate, supported this time by the North and the South. Hence, we can conclude that an economic President would see the ideal allocations pass, and these ideal allocations would be given by the expressions above Political Goals In this example, we suppose that the President only cares about political productivity and rewarding Democratic states. Formally, let = = 1 2 and = = 0: Then for general relief programs, the President s ideal allocation is x W = x N = x S = 2N W = :19 2N W + N N + N S N N = :59 2N W + N N + N S N S = :22 2N W + N N + N S Only the North s representatives would support this allocation, which would be therefore rejected by the House. As a consequence, the President would choose to buy o the South in the House 16
17 and the North in the Senate, by proposing the following allocation: 11 x W = (1 V S p N ) = :35 x N = p N = :29 x S = V S = :36 In this case, the ideal and constrained optimal allocations for public works and farming programs would be identical. In fact, these programs only di er with respect to the economic relief component, which receives zero weight in the current formulation of the President s preferences. 4 Empirical Part 4.1 Description of the Data The empirical part of this study uses data collected by Fishback, Kantor and Wallis (2003) on the distribution of spending for the New Deal programs implemented immediately after Roosevelt s inauguration in 1933 (during the so called 100 Days ). 12 Their original data, taken from the US O ce of Government Reports (1940), is used for a more detailed (county-level) empirical study. We have aggregated their values, rst to the state then to the regional level. The regional aggregation is done according to the assignment of states to regions reported in table 12. In terms of direct/explicit relief, the two centerpieces of the Roosevelt administration s reconstruction e orts were the Federal Emergency Relief Act (FERA) and the Works Progress Administration (WPA). FERA passed in 1933 and was enacted to provide immediate grants to states for relief projects. WPA passed two years later, in 1935 (under the Emergency Relief Appropriation Act), with the purpose of providing public employment for people who were out of work. Given our focus on the 100 Days, we always include FERA (1933) in our estimations, whereas we only use WPA in some robustness checks. In addition to FERA and WPA, in most but not all of our estimations we include in the general relief category loans from the Home Owners Loan Corporation (HOLC), set up in 1933 under the Home Owners Re nancing Act with the stated objective of lending to homeowners who were facing signi cant risk of defaulting on their mortgage, and insured loans given by the Federal Housing Administration (INS/FHA). 13 Besides direct relief programs, the government used public works projects to provide relief through employment as well as through stimulation to the economy. Most importantly, the Public Works Administration (PWA) was set up in 1933, under the National Industrial Recovery Act. 11 Formally, one needs to verify that FDR prefers this allocation to other constrained allocations close to his ideal point. It can be shown, for instance, that he would obtain a lower utility were he to "buy o " only one region. 12 In some extensions, we also use data from all the years 1933 to In addition to these programs/agencies, the Civil Works Administration (CWA) falls in the category of "general relief." The distribution of funds of this administration were, however, small in comparison with the other programs. We did try to include CWA funds. As it had no no e ect on the estimation results we have chosen not to include it here. 17
18 The PWA funded such diverse projects as airports, schools, hospital, warships, dams and bridges. Following Fishback, Kantor and Wallis, we distinguish these from general relief programs and classify them in separate category of public works. 14 In addition to general relief and public works programs, we consider the farm programs enacted during the New Deal period as a separate category. These programs are su ciently distinct from all the others to justify a separation. In this category, the two largest programs were the Agricultural Adjustment Act (AAA) and the Farm Credit Act (FCA), both passed in The former was enacted with the stated objective of providing immediate relief to farmers and paying subsidies to farmers for curtailing production of certain crops. The latter was intended to provide operating loans to farmers on a short-term credit basis. In addition to these two programs, a number of agencies with smaller funds, such as the Farm Security Administration and the Rural Electri cation Administration, were established. As these were too small to change the estimation results, they are also omitted here. The distributions of funds over the three regions, for the nine di erent programs described above, are reported in table 3. Program Name Program Type Year Total Funds Region Shares (billion $) North South West FERA General Relief WPA General Relief HOLC General Relief INS/FHA General Relief PWA, Federal Public Works PWA, Match 1 Public Works PWA, Match 2 Public Works AAA Farming FCA Farming Table 3: Program Details In what follows, we use all of the 1933 programs as a baseline empirical approach, with the programs weighted by their size (total funds). In various robustness checks, we rst of include all the programs from the rst New Deal. We then use speci cations that di er from the baseline case by using unweighted programs and by grouping programs based on their type and year. 4.2 Empirical Approach The main goal of our empirical approach is to identify the parameter values of the President s objective function that provide the best t of our model s predicted allocations to the observed data. We will refer to theoretical allocations as our model s predicted allocations as a function of FDR s preferences and of the outcome of the President-Congress bargaining game. In fact, 14 Note that the activities of the PWA were divided into two di erent kinds of programs: federal programs and state-programs (and loans). The latter were matched with federal money but on the initiative of local authorities. 18
19 given a utility function for FDR, the equilibria of our model can essentially lead to three very di erent outcomes: (i) the immediate approval of bills that implement FDR s ideal allocation, (ii) the immediate approval of bills that implement a Congress-constrained allocations di erent from FDR s ideal allocation, (iii) the approval of bills that pass untouched through the House but are radically amended in the Senate. 15 Discerning between the three types of outcomes in the data is a key step in determining the relevant theoretical allocations. In the actual empirical work, we start by plotting the allocations in the simplex representing the outcomes of the bargaining game (Figure 1). We observe that almost none of these observations lie in a passing region (which would lead to type (i) outcomes). We then exploit the historical fact that during the 100 Days Congress did not amend FDR s proposals substantially (if at all). 16 Therefore, we conclude that each observed allocation must correspond to a type (ii) outcome: that is, it must re ect the solution to the President s Congress-constrained optimization problem. In other words, we conjecture that Roosevelt was aware that his ideal allocations were politically infeasible and that his proposals took congressional constraints into account. Therefore, our observations must be generated from allocations approved by Congress that lie along one or more constraints. We attribute any di erences between the observed allocations and the (theoretical) congressional constraints to execution error by the federal agencies through which the funds were distributed. 17 Identifying the relevant binding constraints is the hardest task in this approach. To this end, we divide programs in General Relief / Public Works / Farming. For each group, we select the constraint closest to the observed allocations and we conjecture it was the binding congressional constraint. We then construct the theoretical allocation for each group of programs, as the equilibrium of our model under the conjectured (constrained) group s speci c congressional constraint. Having determined (conjectured) which constraints that were the binding ones, we proceed to the actual derivation of the model s parameters. In general, we aim at keeping our empirical approach as simple (or, more accurately, transparent) as possible. With this in mind, we adopt an intuitive minimum distance approach, by which we try to bring theoretical and observed allocation as close as possible. 18 Formally, our parameter estimates - under the above described conjecture 15 Note that we do not have to consider a fourth case in which the House amends the President s proposal, as shown in our theoretical model (Corollary 5). 16 For instance, according to Patterson (1967, page 3): the passage of eleven key bills in 1933 took only a total of forty hours of debate in the House. The legislative process in the Senate was a bit more careful but still not slow. 17 By these means we allow - and indeed we nd - these errors not to have a zero mean. Not surprisingly, the observed allocations are often closer to FDR s estimated ideal points. Note that this does not a ect the Congressional bargaining game described above. It simply means that FDR, or agencies with similar objectives as FDR, probably had some ex-post in uence over the spending. 18 Note that we do not attempt to use the standard econometric approach (asymptotic theory) in order to obtain standard errors and perform hypotheses testing. The limited amount of data - in the baseline case nine observations, and in many speci cations less than that - implies that asymptotic theory and large number approximations is simply not appropriate. 19
20 regarding the constraints - are given by the solution to the following problem: min ;;; KX i=1 w i x OBS i s:t: (; ; ; ) (0; 0; 0; 0) s:t: = 1 x T i HEORY 2 where w is a K considered. dimensional vector of weights containing the total size of each of the programs Finally, once we have obtained a vector of parameter estimates, we perform a number of simple checks (not hypothesis tests in the traditional sense) of the internal consistency of the results and the tightness of the parameter estimates. First and foremost, after estimating the preference parameters, we make an attempt to falsify our conjecture about slack vs. binding constraints, using the estimation results. Given the estimated parameter values, we can easily compute FDR s ideal allocations. Then, under the conjecture of Congress-constrained allocations, if any of FDR s ideal allocations lie in the passing regions, then our conjectured equilibrium is falsi ed by the data. Obviously, for each conjectured combination of binding vs slack constraints, we can at most use this rst test to conclude that the data does not falsify our model. This test will not necessarily reject a false model. Therefore, we also perform several robustness checks, in which we try a number of alternative assumptions about which constraints (if any) that were actually binding, and seek to obtain non-falsi able conjectures. In addition, we estimate a number of settings in which we gradually relax various modeling assumptions (such as independence of voting across bills or constant bargaining powers across congressional groups) in order to control for logrolling and for the formation of tighter majority coalitions. 4.3 Baseline Estimation Results Our baseline estimation considers the levels of the allocation of funds in the seven New Deal programs passed during the 100 Days. In the criterion function, each program is weighted by its total size. As a theoretical allocation, we consider a scenario in which FDR s distribution of general relief funds is constrained by the West in the Senate whereas the allocations of farming and public works funds are both constrained by the South in the House. This procedure delivers parameters estimates of Politics Economics Productivity () Rewarding () Recovery () Reform () 0:1120 0:0920 0:6029 0:1931 Table 4: Baseline Parameter Estimates These parameters imply that FDR s ideal allocations would have been the following:. 20
21 N S W Relief 0:6739 0:2055 0:1206 Farming 0:1339 0:2607 0:6054 Pub.Works 0:3762 0:3574 0:2663 Table 5: Ideal Allocations This ideal allocation can be viewed as a counterfactual experiment, in which we ask the question: How di erent would the distribution of funds have looked if the executive branch (FDR) had been unconstrained in the implementation of new government programs? We can note, for instance, the implication that FDR would have liked to give a greater share of the general relief programs to the North, had he not been constrained by the West. Finally, in order to perform a falsi cation test, we derive the predictions that follow from our estimated parameters, but with Roosevelt constrained. The constrained model predicts the following allocations: N S W Relief 0:4598 0:1402 0:4000 Farming 0:1159 0:3600 0:5241 Pub.Works 0:3747 0:3600 0:2653 Table 6: Predicted Allocations These allocations di er from the observations by an average of 0:0582: More importantly, the conjectured scenario in which these constraints (West in the Senate for general relief programs, South in the House for the other programs) are binding is the only one under which our estimated ideal allocations would not pass through Congress untouched. In other words, our baseline conjecture is the only one in which the conjectured congressional constraints can not be falsi ed jointly by the data and the parameter estimates. We take this as a check of the internal consistency of the model. 4.4 Robustness Checks Our baseline speci cation (reprinted as BASE in Table 7) considers the levels of the nine observed allocations separately. We now proceed to operate a series of robustness checks by means of estimating our parameters under several di erent speci cations of the President-Congress bargaining game Minor Changes to the Estimation Approach In this part, we present the results of several minor changes to the estimation execution. First and foremost, we estimate the model including all the nine programs (L9). We then test for congressional logrolling. Speci cally, this means that we treat all allocations from any given type of program passed in the same year as a unique bill, which leaves us with ve observations. The 21
22 result of this estimation is displayed in the row labeled L5: Finally, instead of assigning di erent weights to di erent programs based on their size (in total spending), we estimate the parameters assigning equal weights to all of the nine baseline program programs. The results of this exercise are labeled L9UW. Productivity () Rewarding () Recovery () Reform () BASE 0:1120 0:0920 0:6029 0:1931 L9 0:1107 0:0918 0:6051 0:1924 L5 0:1539 0:0868 0:5590 0:2003 L9UW 0:1068 0:0927 0:5993 0:2012 Table 7: Minor Changes Program-Speci c Bargaining Powers In the next three robustness checks (R9, R5, R9UW), we give a di erent interpretation to our structural error. Here, we acknowledge that our model s constraints can only represent with approximation the bargaining powers in place in Congress during the New Deal. Moreover, by requiring the President to obtain the support of two large congressional players, we are de facto ruling out the possibility of building smaller majority coalitions. In reality, by targeting only part of the states in a given region, FDR could potentially tend less to that region s interest and propose an allocation that is closer to his ideal point. Certainly, the historical evidence does suggests that FDR s proposals passed with large support. However, it is still possible that some of the bills crafting and actual bargaining took place outside of the formal sessions of the Congress, implying that the voting record in Congress do not fully capture the shape of the real coalitions behind the bills. Hence, we believe that an alternative speci cation, with a less precise interpretation of the constraints, is a useful exercise. More speci cally, while maintaining the same conjecture regarding which constraints were binding ones, we now assume that the politically constraining regions received exactly what was necessary in each session to win their support. This is equivalent to assuming that, for each program, the constraining region were able to correctly predict the nal allocation and required exactly what it eventually got in order to vote in favor of the program. Note that this is consistent with the idea that, for all the programs where the observed allocations do not fall in theoretical "passing regions" (as given in gure 1), FDR might have passed the bills with winning coalition that were smaller than the ones implied by the baseline approach. Now note that, given our Cobb-Douglas assumption on the President s utility function, the ratio between the shares of any two regions is independent of the share received by the third one. Together with the assumption that the observed allocations directly deliver the binding constraint for each program, this implies that we are able to estimate FDR s preference parameters on the basis only of the ratios of the allocations received by the non-constraining regions. We carry out this estimation approach for all programs separately and also under our logrolling 22
23 speci cation (R5) : Finally, we perform the estimation placing equal weights on all nine programs (R9UW). The resulting parameter estimates are very similar to the case of varying weights. This works as a con rmation of the relative homogeneity of approved allocations across the three types of programs, which is already evident from the data. The results of our estimation under these robustness checks are reported in Table 8: Productivity () Rewarding () Recovery () Reform () BASE 0:0924 0:0960 0:5445 0:2249 R9 0:0976 0:1157 0:5728 0:2139 R5 0:1263 0:1235 0:5735 0:1767 R9UW 0:0964 0:1002 0:5685 0:2349 Table 8: Program Speci c Bargaining Powers To summarize the results of di erent empirical procedures, we are quite con dent that our estimates lie within the following bounds: Productivity () Rewarding () Recovery () Reform () min 0:0924 0:0868 0:5445 0:1767 max 0:1539 0:1235 0:6051 0:2349 Table 9: Ranges for Parameter Estimates These preliminary estimates indicate that economic concerns, in particular providing relief/recovery, were the primary motives behind the New Deal. Political motives were also existent, but less important Continuous Goals-to-Program Assignments As a nal and somewhat di erent robustness check, we propose a smoothening of our assignment of goals to speci c programs. Thus far, we have maintained a discrete f0; 1g type assumption according to which money spent in a given region on a given program can either serve a speci c goal, or not at all. More realistically, the allocation of funds to a given program can serve a goal to a lesser or greater extent. We use this robustness check for two reasons. First of all, we want to try to provide a more precise characterization of our assignments, say by matching some key statistical fact. Second, we want to explore the sensitivity of our estimates to minor perturbations of the criterion function. The results are quite comforting. More speci cally, we try perturbing our assignment in the following ways: We nd that economic motives acquire even larger relevance when this assignment is considered. The parameter estimates are given in the following table:. 23
24 Perturbation 1 Perturbation 2 South West North South West North Reform/Dev. 0:7 0:2 0:1 0:6 0:3 0:1 Relief/Recovery r : 0:1 f : 0:1 p : 1 r : 0:2 f : 0:85 p : 1 r : 0:7 f : 0:05 p : 1 r : 0:1 f : 0:3 p : 0:5 r : 0:4 f : 0:7 p : 0:8 r : 0:5 f : 0 p : 0:7 Pol. Productivity 0:3 0:8 0:9 0:5 0:7 0:8 Rewarding Dems. 0:9 0:8 0:3 0:8 0:7 0:5 Table 10: Alternative Goals to Programs Assignments Productivity () Rewarding () Recovery () Reform () P1 0:0328 0:0871 0:7656 0:1146 P2 0:0261 0:1007 0:8013 0: Concluding Discussion Table 11: Perturbations Estimates In this paper, we develop a theoretical model of bargaining in the US Congress, and we apply the model to the spending decisions of 1933 during the so-called 100 Days, in the hope of improving our understanding of the objectives behind the implementation of the New Deal. In the theoretical model, the distribution of government funds across di erent regions of the country is the outcome of a bargaining game, in which the President acts as the agenda-setter (the proposer) and Congress bargains over the nal shape of the spending bill. We take into account the two-chamber structure of the Congress, by explicitly modeling the sequential nature of the legislative process, with the House of Representatives acting before the Senate. We assume that the Congress members are sequentially rational. That is, we assume that the House members understand the Senate might alter a bill that passed through their chamber, and we assume that both the House and Senate members understand that, in the case of disagreement between the House and the Senate, the nal outcome will be a convex combination decided by a conference committee. We also assume a sequentially rational President. That is, we assume that the President knows what bills will pass unchanged, and that he understands how Congress will modify the ones that do not. For any given set of preference parameters (in the President s utility function) and any given distribution of seats in the Congress, we can solve the model for a unique predicted outcome, i.e. a unique predicted distribution of funds across regions. This allows us to use the actual distributions of New Deal funds to estimate the preference parameters of the Roosevelt administration. We link theory to data and estimate the model s parameters using a simple minimum distance approach. That is, we estimate Roosevelt s preference parameters by minimizing a weighted distance between the actual distributions and the theoretical (model) expressions characterizing the equilibrium. The limited number of data points implies the standard econometric approach (asymptotic theory) for deriving standard errors and hypotheses tests is not appropriate. Hence, we are unable to assess the tightness of our estimated parameter values. Instead, as a robustness check, we estimate a 24
25 number of di erent versions of the model, controlling for possible logrolling and misspeci cations of the constraints imposed on Roosevelt by the 73rd Congress. In addition, we discuss and apply some more conceptual tests - ways in which parameter estimates could be falsi ed due to internal incoherencies of the model. Our baseline estimation, though not all of the estimations presented as robustness checks, pass these falsi cation tests. The baseline parameter estimates indicate that the motivation behind the New Deal was primarily economic, but that political concerns do seem to have existed as well. All of the robustness checks give a similar and reasonably coherent picture. In particular, all the speci cations deliver estimates that imply a signi cantly greater concern for relief/recovery (one of the two motives labeled as economic ) than for any other motive. This is broadly in line with what we perceive to be the general message of the body of research by John Wallis: that economic concerns for relief and recovery, though not necessarily for fundamental reform and development, largely drove the New Deal, and that political concerns mattered but more on the margin. Regarding the other possible motives, political productivity (reelection concerns) appears to have been of lesser importance. The relative relevance of concerns for fundamental reform vs. reward for democratic states is unclear, as it varies across speci cations. Neither of these motives appears to have been as important as relief/recovery, but for both fundamental reform and reward there are speci cations in which they appear quite important. However, it is never the case that both come out as important in the same speci cation. Hence, we cannot fully determine the relative importance of these two motives. Finally, we would like to stress again that this paper should be viewed as a complement to the existing literature on the objectives of the New Deal. Our formal approach has the advantage of delivering a precise meaning to the estimated parameters, within the context of the model. However, this comes at the obvious cost of seriously reducing the richness of the model s institutional setting, as compared to the previous research. We can only explain the part of the spending that was determined by the President and Congress. In addition, we do not capture preferences over the tax collection or budget de cit necessary to fund the spending programs (though this is a simpli cation we share with previous research). Finally, the aggregation of states into regions implies we have nothing to contribute to the analysis of the local (intra-region) distribution of funds. While recognizing these limitations, we do believe that there is scope for further research that could extend this paper in several ways. In particular, although we do perform a number of robustness checks controlling for di erent forms of logrolling, we do not explicitly model how (whether) funds from one type program could be used by the President to relax constraints for a di erent program. To do that would require introducing additional dynamic features to account for the sequential nature multiple bills, and issues of credibility would become central. We consider this extension very interesting, as it would provide a general model that could be used to analyze political logrolling. However, it would also introduce signi cant additional modeling complexity, and would necessarily shift the focus away from the empirical / historical aspects of this research project. Hence, it falls outside the scope of this paper, which is meant to be applied with focus on 25
26 the New Deal period. References [1] Banks, Je rey S. and John Duggan (2000), A Bargaining Model of Collective Choice, American Political Science Review, Vol. 94: [2] Baron, David and John Ferejohn (1989), Bargaining in Legislatures, American Political Science Review, Vol. 83: [3] Baron, David (1996), A Dynamic Theory of Collective Goods Programs, American Political Science Review, Vol. 90: [4] Bernstein, Barton J. (1968), The New Deal: The Conservative Achievements of Liberal Reform in Barton J. Bernstein (ed.) Towards a New Past: Dissenting Essays in American History, Pantheon Books. [5] Cole, Harold L. and Lee E. Ohanian (2004), New Deal Policies and the Persistence of the Great Depression: A General Equilibrium Analysis, Journal of Political Economy, Vol. 112: [6] Fishback, Price V., Shawn Kantor and John J. Wallis (2003) Can the New Deal s three Rs be rehabilitated? A program-by-program, county-by-county analysis, Explorations in Economic History, Vol. 40: [7] Fleck, Robert K. (1999), "Electoral Incentives, Public Policy, and the New Deal Realignment." Southern Economic Journal Vol: 65: [8] Fleck, Robert K. (2001), "Inter-Party Competition, Intra-Party Competition, and Distributive Policy: A Model and Test Using New Deal Data." Public Choice, Vol: 108: [9] Flynn, John T. (1944), As We Go Marching, Doubleday, Doran and Company. [10] Knight, Brian (2004), Parochial Interests and the Centralized Provision of Local Public Goods: Evidence from Congressional Voting on Transportation Projects, Journal of Public Economics, Vol. 88(3 4): [11] Knight, Brian, (2005), Estimating the Value of Proposal Power, American Economic Review, Vol. 95(5): [12] Libecap, Gary (1998), The Great Depression and the Regulating State: Federal Government Regulation of Agriculture, , in Michael D. Bordo, Claudia Goldin and Eugene N. White, The De ning Moment: The Great Depression and the American Economy in the Twentieth Century, University of Chicago Press. 26
27 [13] Patterson, James T. (1967), Congressional Conservatism and the New Deal: The Growth of the Conservative Coalition in Congress, , University of Kentucky Press. [14] Powell, Jim (2003), FDR s Folly, How Roosevelt and His New Deal Prolonged the Great Depression, Crown Forum. [15] Reading, Don C. (1973), New Deal activity and the states, 1933 to 1939, Journal of Economic History, Vol. 33: [16] Strömberg, David. (2004), "Radio s Impact on Public Spending," Quarterly Journal of Economics, Vol. 119: [17] US O ce of Government Reports, Statistical Section (1940). Report No. 10, volume 1, County reports of estimated federal expenditures, March 4, 1933 June 30, [18] Wallis, John J. (1984), The birth of the old federalism: nancing the New Deal, , Journal of Economic History, Vol. 44: [19] Wallis, John J. (1985) Why 1933? The Origins and Timing of National Government Growth , Research in Economic History, Vol. 8: [20] Wallis, John J. (1998), The political economy of New Deal spending revisited, again: with and without Nevada, Explorations in Economic History, Vol. 35: [21] Wright, Gavin (1974), The political economy of New Deal spending: an econometric analysis, Review of Economics and Statistics, Vol. 56: [22] Zinn, Howard (1966), New Deal Thought, Bobbs-Merrill. 27
28 A Regional Classi cation: Tables and Maps Northern States Southern States Western States Connecticut Alabama Arizona Delaware Arkansas California Indiana Florida Colorado Maine Georgia Idaho Maryland Kentucky Illinois Massachusetts Louisiana Iowa Michigan Mississippi Kansas New Hampshire Missouri Minnesota New Jersey North Carolina Montana New York Oklahoma Nebraska Ohio Tennessee Nevada Pennsylvania Texas New Mexico Rhode Island Virginia North Dakota Vermont Oregon South Dakota Utah Washington Wisconsin Wyoming Table 12: Composition of State Groups (Regions) Northern States Southern States Western States Connecticut Lost Alabama Won Arizona Won Delaware Lost Arkansas Won California Won Indiana Won<55% Florida Won Colorado Won<55% Maine Lost Georgia Won Idaho Won Maryland Won Kentucky Won Illinois Won Massachusetts Won<55% Louisiana Won Iowa Won Michigan Won<55% Mississippi Won Kansas Won<55% New Hampshire Lost Missouri Won Minnesota Won New Jersey Won<55% North Carolina Won Montana Won New York Won<55% Oklahoma Won Nebraska Won Ohio Won<55% South Carolina Won Nevada Won Pennsylvania Lost Tennessee Won New Mexico Won Rhode Island Won Texas Won North Dakota Won Vermont Lost Virginia Won Oregon Won West Virginia Won South Dakota Won Utah Won Washington Won Wisconsin Won Wyoming Won Figure 2: Political Support for FDR in 1932 Election 28
29 29
Public and Private Welfare State Institutions
 Public and Private Welfare State Institutions A Formal Theory of American Exceptionalism Kaj Thomsson, Yale University and RIIE y November 15, 2008 Abstract I develop a formal model of di erential welfare
Decentralization via Federal and Unitary Referenda
 Decentralization via Federal and Unitary Referenda First Version: January 1997 This version: May 22 Ben Lockwood 1 Department of Economics, University of Warwick, Coventry CV4 7AL UK. email: b.lockwood@warwick.ac.uk
The Immigration Policy Puzzle
 MPRA Munich Personal RePEc Archive The Immigration Policy Puzzle Paolo Giordani and Michele Ruta UISS Guido Carli University, World Trade Organization 2009 Online at https://mpra.ub.uni-muenchen.de/23584/
Decision Making Procedures for Committees of Careerist Experts. The call for "more transparency" is voiced nowadays by politicians and pundits
 Decision Making Procedures for Committees of Careerist Experts Gilat Levy; Department of Economics, London School of Economics. The call for "more transparency" is voiced nowadays by politicians and pundits
July, Abstract. Keywords: Criminality, law enforcement, social system.
 Nontechnical Summary For most types of crimes but especially for violent ones, the number of o enses per inhabitant is larger in the US than in Europe. In the same time, expenditures for police, courts
Let the Experts Decide? Asymmetric Information, Abstention, and Coordination in Standing Committees 1
 Let the Experts Decide? Asymmetric Information, Abstention, and Coordination in Standing Committees 1 Rebecca Morton 2 Jean-Robert Tyran 3 November 2, 2008 1 We appreciate greatly the work of Michael Rudy
Earmarks. Olivier Herlem Erasmus University Rotterdam, Tinbergen Institute. December 1, Abstract
 Earmarks Olivier Herlem Erasmus University Rotterdam, Tinbergen Institute December 1, 2014 Abstract For many, earmarks - federal funds designated for local projects of US politicians - epitomize wasteful
Political Economics II Spring Lectures 4-5 Part II Partisan Politics and Political Agency. Torsten Persson, IIES
 Lectures 4-5_190213.pdf Political Economics II Spring 2019 Lectures 4-5 Part II Partisan Politics and Political Agency Torsten Persson, IIES 1 Introduction: Partisan Politics Aims continue exploring policy
The E ects of Identities, Incentives, and Information on Voting 1
 The E ects of Identities, Incentives, and Information on Voting Anna Bassi 2 Rebecca Morton 3 Kenneth Williams 4 July 2, 28 We thank Ted Brader, Jens Grosser, Gabe Lenz, Tom Palfrey, Brian Rogers, Josh
Social Networks, Achievement Motivation, and Corruption: Theory and Evidence
 Social Networks, Achievement Motivation, and Corruption: Theory and Evidence J. Roberto Parra-Segura University of Cambridge September, 009 (Draft, please do not cite or circulate) We develop an equilibrium
Nomination Processes and Policy Outcomes
 Nomination Processes and Policy Outcomes Matthew O. Jackson, Laurent Mathevet, Kyle Mattes y Forthcoming: Quarterly Journal of Political Science Abstract We provide a set of new models of three di erent
Brain drain and Human Capital Formation in Developing Countries. Are there Really Winners?
 Brain drain and Human Capital Formation in Developing Countries. Are there Really Winners? José Luis Groizard Universitat de les Illes Balears Ctra de Valldemossa km. 7,5 07122 Palma de Mallorca Spain
ONLINE APPENDIX: Why Do Voters Dismantle Checks and Balances? Extensions and Robustness
 CeNTRe for APPlieD MACRo - AND PeTRoleuM economics (CAMP) CAMP Working Paper Series No 2/2013 ONLINE APPENDIX: Why Do Voters Dismantle Checks and Balances? Extensions and Robustness Daron Acemoglu, James
Policy Reputation and Political Accountability
 Policy Reputation and Political Accountability Tapas Kundu October 9, 2016 Abstract We develop a model of electoral competition where both economic policy and politician s e ort a ect voters payo. When
MIDTERM EXAM 1: Political Economy Winter 2017
 Name: MIDTERM EXAM 1: Political Economy Winter 2017 Student Number: You must always show your thinking to get full credit. You have one hour and twenty minutes to complete all questions. All questions
Lobbying and Elections
 Lobbying and Elections Jan Klingelhöfer RWTH Aachen University April 15, 2013 Abstract analyze the interaction between post-election lobbying and the voting decisions of forward-looking voters. The existing
THREATS TO SUE AND COST DIVISIBILITY UNDER ASYMMETRIC INFORMATION. Alon Klement. Discussion Paper No /2000
 ISSN 1045-6333 THREATS TO SUE AND COST DIVISIBILITY UNDER ASYMMETRIC INFORMATION Alon Klement Discussion Paper No. 273 1/2000 Harvard Law School Cambridge, MA 02138 The Center for Law, Economics, and Business
Tax Competition and Migration: The Race-to-the-Bottom Hypothesis Revisited
 Tax Competition and Migration: The Race-to-the-Bottom Hypothesis Revisited Assaf Razin y and Efraim Sadka z January 2011 Abstract The literature on tax competition with free capital mobility cites several
DISCUSSION PAPERS IN ECONOMICS
 DISCUSSION PAPERS IN ECONOMICS Working Paper No. 09-03 Offshoring, Immigration, and the Native Wage Distribution William W. Olney University of Colorado revised November 2009 revised August 2009 March
Nominations for Sale. Silvia Console-Battilana and Kenneth A. Shepsle y. 1 Introduction
 Nominations for Sale Silvia Console-Battilana and Kenneth A. Shepsle y Abstract Models of nomination politics in the US often nd "gridlock" in equilibrium because of the super-majority requirement in the
Notes on Strategic and Sincere Voting
 Notes on Strategic and Sincere Voting Francesco Trebbi March 8, 2019 Idea Kawai and Watanabe (AER 2013): Inferring Strategic Voting. They structurally estimate a model of strategic voting and quantify
Political Parties and Network Formation
 ömmföäflsäafaäsflassflassflas ffffffffffffffffffffffffffffffffffff Discussion Papers Political Parties and Network Formation Topi Miettinen University of Helsinki, RUESG and HECER and University College
Diversity and Redistribution
 Diversity and Redistribution Raquel Fernández y NYU, CEPR, NBER Gilat Levy z LSE and CEPR Revised: October 2007 Abstract In this paper we analyze the interaction of income and preference heterogeneity
Political Institutions as Robust Control: Theory and Application to Economic Growth
 Political Institutions as Robust Control: Theory and Application to Economic Growth Timothy Besley LSE and CIFAR Hannes Mueller IAE (CSIC), MOVE and Barcelona GSE July 15, 2015 Abstract This paper develops
Politics as Usual? Local Democracy and Public Resource Allocation in South India
 Politics as Usual? Local Democracy and Public Resource Allocation in South India Timothy Besley LSE and CIFAR Rohini Pande Harvard University Revised September 2007 Vijayendra Rao World Bank Abstract This
POLITICAL EQUILIBRIUM SOCIAL SECURITY WITH MIGRATION
 POLITICAL EQUILIBRIUM SOCIAL SECURITY WITH MIGRATION Laura Marsiliani University of Durham laura.marsiliani@durham.ac.uk Thomas I. Renström University of Durham and CEPR t.i.renstrom@durham.ac.uk We analyze
Autocracy, Democracy and Trade Policy
 Autocracy, Democracy and Trade Policy Sebastian Galiani Washington University in St. Louis Gustavo Torrens y Washington University in St. Louis First version: May, 2010. Present version: November, 2011.
E ciency, Equity, and Timing of Voting Mechanisms 1
 E ciency, Equity, and Timing of Voting Mechanisms 1 Marco Battaglini Princeton University Rebecca Morton New York University Thomas Palfrey California Institute of Technology This version November 29,
On Public Opinion Polls and Voters Turnout
 On Public Opinion Polls and Voters Turnout Esteban F. Klor y and Eyal Winter z September 2006 We are grateful to Oriol Carbonell-Nicolau, Eric Gould, Dan Levin, Bradley Ru e and Moses Shayo for very helpful
On Public Opinion Polls and Voters Turnout
 On Public Opinion Polls and Voters Turnout Esteban F. Klor y and Eyal Winter z March 2014 We are grateful to Oriol Carbonell-Nicolau, Eric Gould, Dan Levin, Rebecca Morton, Bradley Ru e and Moses Shayo
The Political Economy of Data. Tim Besley. Kuwait Professor of Economics and Political Science, LSE. IFS Annual Lecture. October 15 th 2007
 The Political Economy of Data Tim Besley Kuwait Professor of Economics and Political Science, LSE IFS Annual Lecture October 15 th 2007 Bank of England There is nothing a politician likes so little as
Migration Creation, Diversion, and Retention: New Deal Grants and Migration:
 DISCUSSION PAPER SERIES IZA DP No. 3060 Migration Creation, Diversion, and Retention: New Deal Grants and Migration: 1935-1940 Todd Sorensen Price Fishback Samuel Allen Shawn Kantor September 2007 Forschungsinstitut
1 Electoral Competition under Certainty
 1 Electoral Competition under Certainty We begin with models of electoral competition. This chapter explores electoral competition when voting behavior is deterministic; the following chapter considers
14.770: Introduction to Political Economy Lecture 11: Economic Policy under Representative Democracy
 14.770: Introduction to Political Economy Lecture 11: Economic Policy under Representative Democracy Daron Acemoglu MIT October 16, 2017. Daron Acemoglu (MIT) Political Economy Lecture 11 October 16, 2017.
Optimal Gerrymandering in a Competitive. Environment
 Optimal Gerrymandering in a Competitive Environment John N. Friedman and Richard T. Holden December 9, 2008 Abstract We analyze a model of optimal gerrymandering where two parties receive a noisy signal
Mauricio Soares Bugarin Electoral Control en the Presence of Gridlocks
 Mauricio Soares Bugarin Electoral Control en the Presence of Gridlocks Electoral control in the presence of gridlocks Mauricio Soares Bugarin y University of Brasilia April 2001 Abstract This article presents
Authoritarianism and Democracy in Rentier States. Thad Dunning Department of Political Science University of California, Berkeley
 Authoritarianism and Democracy in Rentier States Thad Dunning Department of Political Science University of California, Berkeley CHAPTER THREE FORMAL MODEL 1 CHAPTER THREE 1 Introduction In Chapters One
1. The Relationship Between Party Control, Latino CVAP and the Passage of Bills Benefitting Immigrants
 The Ideological and Electoral Determinants of Laws Targeting Undocumented Migrants in the U.S. States Online Appendix In this additional methodological appendix I present some alternative model specifications
Do barriers to candidacy reduce political competition? Evidence from a bachelor s degree requirement for legislators in Pakistan
 Do barriers to candidacy reduce political competition? Evidence from a bachelor s degree requirement for legislators in Pakistan September 2013 Madiha Afzal* Abstract In the 2002 election, candidates for
Copyright All rights reserved.
 ECONOMICS AND POLITICS 0954-1985 Volume 10 March 1998 No. 1 ARE PACS TRYING TO INFLUENCE POLITICIANS OR VOTERS? STEVEN D. LEVITT Political Action Committees (PACs) can a ect public policies in either of
policy-making. footnote We adopt a simple parametric specification which allows us to go between the two polar cases studied in this literature.
 Introduction Which tier of government should be responsible for particular taxing and spending decisions? From Philadelphia to Maastricht, this question has vexed constitution designers. Yet still the
Separate When Equal? Racial Inequality and Residential Segregation
 Separate When Equal? Racial Inequality and Residential Segregation Patrick Bayer Hanming Fang Robert McMillan January 13, 2005 Abstract Conventional wisdom suggests that residential segregation will fall
Sincere Versus Sophisticated Voting When Legislators Vote Sequentially
 Sincere Versus Sophisticated Voting When Legislators Vote Sequentially Tim Groseclose Departments of Political Science and Economics UCLA Jeffrey Milyo Department of Economics University of Missouri September
Supplementary Materials for Strategic Abstention in Proportional Representation Systems (Evidence from Multiple Countries)
") Supplementary Materials for Strategic Abstention in Proportional Representation Systems (Evidence from Multiple Countries) Guillem Riambau July 15, 2018 1 1 Construction of variables and descriptive statistics.
Supplementary Materials for Strategic Abstention in Proportional Representation Systems (Evidence from Multiple Countries) Guillem Riambau July 15, 2018 1 1 Construction of variables and descriptive statistics.
Incumbents Interests, Voters Bias and Gender Quotas
 Incumbents Interests, Voters Bias and Gender Quotas Guillaume R. Fréchette New York University Francois Maniquet C.O.R.E. Massimo Morelli The Ohio State University March 23 2006 We are highly indebted
Coalition Governments and Political Rents
 Coalition Governments and Political Rents Dr. Refik Emre Aytimur Georg-August-Universität Göttingen January 01 Abstract We analyze the impact of coalition governments on the ability of political competition
3 Electoral Competition
 3 Electoral Competition We now turn to a discussion of two-party electoral competition in representative democracy. The underlying policy question addressed in this chapter, as well as the remaining chapters
The Substitutability of Immigrant and Native Labor: Evidence at the Establishment Level
 The Substitutability of Immigrant and Native Labor: Evidence at the Establishment Level Raymundo M. Campos-Vazquez JOB MARKET PAPER November 2008 University of California, Berkeley Department of Economics
NBER WORKING PAPER SERIES THE SKILL COMPOSITION OF MIGRATION AND THE GENEROSITY OF THE WELFARE STATE. Alon Cohen Assaf Razin Efraim Sadka
 NBER WORKING PAPER SERIES THE SKILL COMPOSITION OF MIGRATION AND THE GENEROSITY OF THE WELFARE STATE Alon Cohen Assaf Razin Efraim Sadka Working Paper 14738 http://www.nber.org/papers/w14738 NATIONAL BUREAU
A Role for Government Policy and Sunspots in Explaining Endogenous Fluctuations in Illegal Immigration 1
 A Role for Government Policy and Sunspots in Explaining Endogenous Fluctuations in Illegal Immigration 1 Mark G. Guzman 2 Research Department Federal Reserve Bank of Dallas Joseph H. Haslag Department
Sending Information to Interactive Receivers Playing a Generalized Prisoners Dilemma
 Sending Information to Interactive Receivers Playing a Generalized Prisoners Dilemma K r Eliaz and Roberto Serrano y February 20, 2013 Abstract Consider the problem of information disclosure for a planner
Electoral Bias and Policy Choice: Theory and Evidence
 Electoral Bias and Policy Choice: Theory and Evidence Timothy Besley London School of Economics, CIAR and IFS Ian Preston University College, London and IFS February, 007 Abstract This paper develops an
Intertwined Federalism: Accountability Problems under Partial Decentralization
 Groupe de Recherche en Économie et Développement International Cahier de recherche / Working Paper 08-22 Intertwined Federalism: Accountability Problems under Partial Decentralization Marcelin Joanis Intertwined
Voting with Their Feet?
 Policy Research Working Paper 7047 WPS7047 Voting with Their Feet? Access to Infrastructure and Migration in Nepal Forhad Shilpi Prem Sangraula Yue Li Public Disclosure Authorized Public Disclosure Authorized
Supporting Information Political Quid Pro Quo Agreements: An Experimental Study
 Supporting Information Political Quid Pro Quo Agreements: An Experimental Study Jens Großer Florida State University and IAS, Princeton Ernesto Reuben Columbia University and IZA Agnieszka Tymula New York
'Wave riding' or 'Owning the issue': How do candidates determine campaign agendas?
 'Wave riding' or 'Owning the issue': How do candidates determine campaign agendas? Mariya Burdina University of Colorado, Boulder Department of Economics October 5th, 008 Abstract In this paper I adress
The use of coercion in society: insecure property rights, con ict and economic backwardness
 Chapter? The use of coercion in society: insecure property rights, con ict and economic backwardness Francisco M. Gonzalez* Abstract This article o ers an equilibrium analysis of the in uence of insecure
Political Ideology and Trade Policy: A Cross-country, Cross-industry Analysis
 Political Ideology and Trade Policy: A Cross-country, Cross-industry Analysis Heiwai Tang Tufts University, MIT Sloan, LdA May 7, 2012 Abstract Research on political economy of trade policy has taken two
A Role for Sunspots in Explaining Endogenous Fluctutations in Illegal Immigration 1
 A Role for Sunspots in Explaining Endogenous Fluctutations in Illegal Immigration 1 Mark G. Guzman Research Department Federal Reserve Bank of Dallas Joseph H. Haslag Department of Economics University
Quorum Rules and Shareholder Power
 Quorum Rules and Shareholder Power Patricia Charléty y, Marie-Cécile Fagart z and Saïd Souam x February 15, 2016 Abstract This paper completely characterizes the equilibria of a costly voting game where
The 2010 Midterm Election for the US House of Representatives
 Douglas A. Hibbs, Jr. www.douglas-hibbs.com/house2010election22september2010.pdf Center for Public Sector Research (CEFOS), Gothenburg University 22 September 2010 (to be updated at BEA s next data release
FINAL EXAM: Political Economy Winter 2017
 FINAL EXAM: Political Economy Winter 2017 Name: You must always show your thinking to get full credit. You have two hours and thirty minutes to complete all questions. This page is for your grade. Leave
Melting Pot vs. Cultural Mosaic Dynamic Public Finance Perspective
 Melting Pot vs. Cultural Mosaic Dynamic Public Finance Perspective Gurgen Aslanyan CERGE-EI y, Prague April 2013 Abstract The traditional immigrant countries can be characterised as either supporting a
Sincere versus sophisticated voting when legislators vote sequentially
 Soc Choice Welf (2013) 40:745 751 DOI 10.1007/s00355-011-0639-x ORIGINAL PAPER Sincere versus sophisticated voting when legislators vote sequentially Tim Groseclose Jeffrey Milyo Received: 27 August 2010
Political Agency in Democracies and Dictatorships. Georgy Vladimirovich Egorov
 Political Agency in Democracies and Dictatorships A dissertation presented by Georgy Vladimirovich Egorov to The Department of Economics in partial ful llment of the requirements for the degree of Doctor
Essays on the Single-mindedness Theory. Emanuele Canegrati Catholic University, Milan
 Emanuele Canegrati Catholic University, Milan Abstract The scope of this work is analysing how economic policies chosen by governments are in uenced by the power of social groups. The core idea is taken
WORKING PAPER NO. 256 INFORMATION ACQUISITION AND DECISION MAKING IN COMMITTEES: A SURVEY
 EUROPEAN CENTRAL BANK WORKING PAPER SERIES E C B E Z B E K T B C E E K P WORKING PAPER NO. 256 INFORMATION ACQUISITION AND DECISION MAKING IN COMMITTEES: A SURVEY BY KERSTIN GERLING, HANS PETER GRÜNER,
Electoral Bias and Policy Choice: Theory and Evidence. Timothy Besley London School of Economics, CIAR and IFS
 Electoral Bias and Policy Choice: Theory and Evidence Timothy Besley London School of Economics, CIAR and IFS Ian Preston University College London and IFS Political Economy and Public Policy Series The
The welfare consequences of strategic behaviour under approval and plurality voting
 The welfare consequences of strategic behaviour under approval and plurality voting Aki Lehtinen Department of social and moral philosophy P.O.Box9 00014 University of Helsinki Finland aki.lehtinen@helsinki.
Preferential votes and minority representation in open list proportional representation systems
 Soc Choice Welf (018) 50:81 303 https://doi.org/10.1007/s00355-017-1084- ORIGINAL PAPER Preferential votes and minority representation in open list proportional representation systems Margherita Negri
Bipartisan Gerrymandering
 Bipartisan Gerrymandering Hideo Konishi y Chen-Yu Pan z February 15, 2016 Abstract In this paper we propose a tractable model of partisan gerrymandering followed by electoral competitions in policy positions
Measuring International Skilled Migration: New Estimates Controlling for Age of Entry
 Measuring International Skilled Migration: New Estimates Controlling for Age of Entry Michel Beine a,frédéricdocquier b and Hillel Rapoport c a University of Luxemburg and Université Libre de Bruxelles
EFFICIENCY OF COMPARATIVE NEGLIGENCE : A GAME THEORETIC ANALYSIS
 EFFICIENCY OF COMPARATIVE NEGLIGENCE : A GAME THEORETIC ANALYSIS TAI-YEONG CHUNG * The widespread shift from contributory negligence to comparative negligence in the twentieth century has spurred scholars
Adverse Selection and Career Outcomes in the Ethiopian Physician Labor Market y
 Adverse Selection and Career Outcomes in the Ethiopian Physician Labor Market y Joost de Laat Université du Québec à Montréal (UQAM) William Jack Georgetown University February 20, 2008 Abstract This paper
Congressional Gridlock: The Effects of the Master Lever
 Congressional Gridlock: The Effects of the Master Lever Olga Gorelkina Max Planck Institute, Bonn Ioanna Grypari Max Planck Institute, Bonn Preliminary & Incomplete February 11, 2015 Abstract This paper
Polarization and Income Inequality: A Dynamic Model of Unequal Democracy
 Polarization and Income Inequality: A Dynamic Model of Unequal Democracy Timothy Feddersen and Faruk Gul 1 March 30th 2015 1 We thank Weifeng Zhong for research assistance. Thanks also to John Duggan for
Who wins and who loses after a coalition government? The electoral results of parties
 Who wins and who loses after a coalition government? The electoral results of parties Ignacio Urquizu Sancho Juan March Institute & Complutense University of Madrid January 22, 2007 One of the main gaps
The Provision of Public Goods Under Alternative. Electoral Incentives
 The Provision of Public Goods Under Alternative Electoral Incentives Alessandro Lizzeri and Nicola Persico March 10, 2000 American Economic Review, forthcoming ABSTRACT Politicians who care about the spoils
When Transaction Costs Restore Eciency: Coalition Formation with Costly Binding Agreements
 When Transaction Costs Restore Eciency: Coalition Formation with Costly Binding Agreements Zsolt Udvari JOB MARKET PAPER October 29, 2018 For the most recent version please click here Abstract Establishing
Schooling, Nation Building, and Industrialization
 Schooling, Nation Building, and Industrialization Esther Hauk Javier Ortega August 2012 Abstract We model a two-region country where value is created through bilateral production between masses and elites.
Part I: Univariate Spatial Model (20%)
") 17.251 Fall 2012 Midterm Exam answers Directions: Do the following problem. Part I: Univariate Spatial Model (20%) The nation is faced with a situation in which, if legislation isn t passed, the level
17.251 Fall 2012 Midterm Exam answers Directions: Do the following problem. Part I: Univariate Spatial Model (20%) The nation is faced with a situation in which, if legislation isn t passed, the level
Purchasing-Power-Parity Changes and the Saving Behavior of Temporary Migrants
 Purchasing-Power-Parity Changes and the Saving Behavior of Temporary Migrants Alpaslan Akay, Slobodan Djajić, Murat G. Kirdar y, and Alexandra Vinogradova z st November 207 Abstract This study examines
Polarization and the Power of Lobbyists
 Polarization and the Power of Lobbyists John William Hat eld Graduate School of Business Stanford University October 2007 Abstract We consider how changes in the polarization of a legislature a ect the
1 Aggregating Preferences
 ECON 301: General Equilibrium III (Welfare) 1 Intermediate Microeconomics II, ECON 301 General Equilibrium III: Welfare We are done with the vital concepts of general equilibrium Its power principally
1. Introduction. Michael Finus
 1. Introduction Michael Finus Global warming is believed to be one of the most serious environmental problems for current and hture generations. This shared belief led more than 180 countries to sign the
Sampling Equilibrium, with an Application to Strategic Voting Martin J. Osborne 1 and Ariel Rubinstein 2 September 12th, 2002.
 Sampling Equilibrium, with an Application to Strategic Voting Martin J. Osborne 1 and Ariel Rubinstein 2 September 12th, 2002 Abstract We suggest an equilibrium concept for a strategic model with a large
The Idealized Electoral College Voting Mechanism and. Shareholder Power
 The Idealied Electoral College Voting Mechanism and Shareholder Power Edward Dickersin Van Wesep September 17, 2012 Abstract Increasing concern over corporate governance has led to calls for more shareholder
VOTING ON INCOME REDISTRIBUTION: HOW A LITTLE BIT OF ALTRUISM CREATES TRANSITIVITY DONALD WITTMAN ECONOMICS DEPARTMENT UNIVERSITY OF CALIFORNIA
 1 VOTING ON INCOME REDISTRIBUTION: HOW A LITTLE BIT OF ALTRUISM CREATES TRANSITIVITY DONALD WITTMAN ECONOMICS DEPARTMENT UNIVERSITY OF CALIFORNIA SANTA CRUZ wittman@ucsc.edu ABSTRACT We consider an election
Separate When Equal? Racial Inequality and Residential Segregation
 Separate When Equal? Racial Inequality and Residential Segregation Patrick Bayer Hanming Fang Robert McMillan June 22, 2005 Abstract Middle-class black neighborhoods are in short supply in many U.S. metropolitan
Poverty Reduction and Economic Growth: The Asian Experience Peter Warr
 Poverty Reduction and Economic Growth: The Asian Experience Peter Warr Abstract. The Asian experience of poverty reduction has varied widely. Over recent decades the economies of East and Southeast Asia
Ambiguity and Extremism in Elections
 Ambiguity and Extremism in Elections Alberto Alesina Harvard University Richard Holden Massachusetts Institute of Technology June 008 Abstract We analyze a model in which voters are uncertain about the
Honors General Exam Part 1: Microeconomics (33 points) Harvard University
 Harvard University") Honors General Exam Part 1: Microeconomics (33 points) Harvard University April 9, 2014 QUESTION 1. (6 points) The inverse demand function for apples is defined by the equation p = 214 5q, where q is the
Honors General Exam Part 1: Microeconomics (33 points) Harvard University April 9, 2014 QUESTION 1. (6 points) The inverse demand function for apples is defined by the equation p = 214 5q, where q is the
Policy Reversal. Espen R. Moen and Christian Riis. Abstract. We analyze the existence of policy reversal, the phenomenon sometimes observed
 Policy Reversal Espen R. Moen and Christian Riis Abstract We analyze the existence of policy reversal, the phenomenon sometimes observed that a certain policy (say extreme left-wing) is implemented by
Weak States And Steady States: The Dynamics of Fiscal Capacity
 Weak States And Steady States: The Dynamics of Fiscal Capacity Timothy Besley London School of Economics and CIFAR Ethan Ilzetzki London School of Economics Torsten Persson IIES, Stockholm University and
The Case of the Disappearing Bias: A 2014 Update to the Gerrymandering or Geography Debate
 The Case of the Disappearing Bias: A 2014 Update to the Gerrymandering or Geography Debate Nicholas Goedert Lafayette College goedertn@lafayette.edu May, 2015 ABSTRACT: This note observes that the pro-republican
EMPLOYMENT AND GUBERNATORIAL ELECTIONS DURING THE GILDED AGE
 ECONOMICS AND POLITICS 0954-1985 Volume 10 November 1998 No. 3 EMPLOYMENT AND GUBERNATORIAL ELECTIONS DURING THE GILDED AGE JAC C. HECKELMAN* The theory of political business cycles predicts economies
Coalition and Party Formation in a Legislative. Voting Game. April 1998, Revision: April Forthcoming in the Journal of Economic Theory.
 Coalition and Party Formation in a Legislative Voting Game Matthew O. Jackson and Boaz Moselle April 1998, Revision: April 2000 Forthcoming in the Journal of Economic Theory Abstract We examine a legislative
Uncovered Power: External Agenda Setting, Sophisticated Voting, and Transnational Lobbying
 Uncovered Power: External Agenda Setting, Sophisticated Voting, and Transnational Lobbying Silvia Console Battilana, Stanford University y Job Market Paper Abstract Where does the balance of power lie
Determinants of Corruption: Government E ectiveness vs. Cultural Norms y
 Determinants of Corruption: Government E ectiveness vs. Cultural Norms y Mudit Kapoor and Shamika Ravi Indian School of Business, India 15th July 2009 Abstract In this paper we show that parking behavior
Ethnic Polarization, Potential Con ict, and Civil Wars
 Ethnic Polarization, Potential Con ict, and Civil Wars Jose G. Montalvo Universitat Pompeu Fabra and IVIE Marta Reynal-Querol The World Bank March 2005 Abstract This paper analyzes the relationship between