UC-BERKELEY. Center on Institutions and Governance Working Paper No. 23
|
|
|
- Godwin Butler
- 6 years ago
- Views:
Transcription

1 UC-BERKELEY Center on Institutions and Governance Working Paper No. 23 The Evolution of Party Politics in Texas, : Tracing the Emergence of a Partisan Legislature Mark P. Jones, Juan Pablo Micozzi and Greg Vonnahme Institute of Governmental Studies University of California, Berkeley April 2006 This paper can be downloaded without charge at: Center for Institutions and Governance Working Papers Series:
2 THE EVOLUTION OF PARTY POLITICS IN TEXAS, : TRACING THE EMERGENCE OF A PARTISAN LEGISLATURE Mark P. Jones Juan Pablo Micozzi Greg Vonnahme Department of Political Science Rice University Houston, Texas mpjones@rice.edu April 10, 2006 Paper prepared for the University of California-Berkeley Center on Institutions and Governance and University of California-San Diego Department of Political Science sponsored "Conference on Legislative Behavior in Europe, the US, and Beyond," La Jolla, CA, April 14-15, 2006.
3 1 THE EVOLUTION OF PARTY POLITICS IN TEXAS, : TRACING THE EMERGENCE OF A PARTISAN LEGISLATURE 1 Poole and Rosenthal's (1997) seminal Congress: A Political-Economic History of Roll Call Voting provides an ideal model for the use of roll call vote data to improve scholarly understanding of political history. In a much reduced scope, the first goal of this overall project is to employ Poole and Rosenthal's general intellectual approach to analyze an era of profound partisan change in Texas, as the state moved from a one-party system dominated by the Democratic Party to a two-party system dominated by the Republican Party. The second goal of this broader project is to utilize the Texas case to contribute to the development of general theories of legislative behavior. In this paper we make a small initial contribution to this development by assessing the extent to which different general models of legislative voting behavior, the Floor Agenda Model and the Party Agenda Model (Cox and McCubbins 2005a), explain the voting behavior of members of the Texas House of Representatives over time. In doing so, we highlight the potential for state-level analysis to expand and improve our understanding of legislative bodies in the United States and abroad (Gamm and Huber 2002; Squire and Hamm 2005). The paper's structure is as follows. First, we provide a brief overview of the institutional and political features of the Texas House of Representatives and of the evolution of its partisan composition over time. Second, we discuss our roll call data as well as the methodology we utilize, and then present the results of a one-dimensional analysis of these data (as well as discuss the possibility of the existence of higher order 1 We thank Raúl González, Wonjae Hwang, Robert "Tripp" Parks, and Rosa Sandoval Bustos for their invaluable assistance with this research project.
4 2 dimensions). As will become evident below, this is very much a work in progress, and to date we have only analyzed a portion of the roll call vote data that will eventually be included in this study. Third, we highlight the evolution of inter-party heterogeneity in the Texas House. Fourth, we evaluate four competing models of legislative voting, in particular the Floor Agenda Model and the Cartel Agenda Model, following the empirical strategy utilized by Lawrence et al. (2006) in their evaluation of the relative utility of these models for understanding voting behavior in the U.S. House of Representatives. Fifth, we identify a future direction for research related to the role of the Speaker (and his bipartisan team) in structuring legislative voting behavior in the Texas House, especially during the era of Democratic dominance. THE TEXAS HOUSE OF REPRESENTATIVES Like all U.S. states (except Nebraska), Texas has a bicameral legislature. The Texas House of Representatives consists of 150 members, elected from single-member plurality districts for two year terms. 2 There are no limits on re-election, although for the legislative sessions held between 1981 and 2005, the median House member was only serving either their third or fourth term in office at the start of the session. 3 Under the Texas Constitution the state's legislature holds a regular session of a maximum of 140 days every two years (odd years), from the second Tuesday in January until late May or early June. The governor also is empowered to call an unlimited number of special sessions (up to 30 days in length) to treat specific topics (and only those topics) determined by the governor. During the period, a median and mean of two 2 There are 31 senators, elected from single-member plurality districts for four year terms (on a staggered cycle), with no limits on re-election. 3 The representative located at the 75th percentile in terms of longevity was on average serving their sixth term at the start of the session. This number gradually increased over the past 25 years, from five terms in 1981 to seven terms in 2005.
5 3 special sessions were called during each two year legislative session (the range was from 0 to 6, with a modal value of 0). The presiding officer in the House of Representatives is the Speaker. Unlike his counterpart in the Senate (the Lieutenant Governor, who is directly elected in a state-wide race), the Speaker is elected at the start of each biennial session by the House membership. Prior to 1975, Speakers almost always served for a single two year term, and never for more than two terms. Since 1975 however, this pattern has changed, with only four individuals occupying the office of Speaker since that date: Bill Clayton: 1975, 1977, 1979, 1981; Gib Lewis: 1983, 1985, 1987, 1989, 1991; Pete Laney: 1993, 1995, 1997, 1999, 2001; Tom Craddick, 2003, "Unlike most of their predecessors, Clayton, Lewis, Laney, and Craddick devoted long hours to the job and kept large fulltime staffs" (Dye et al. 2005, 768). The Texas Speaker is endowed by the House rules (approved at the start of every two-year session) with considerable procedural and institutional powers. According to Squire and Hamm (2005), who draw from Clucas (2001), the Texas Speaker possesses an Institutional Power Index score that ranks in the upper quintile of lower house speakers in the U.S. states, and equivalent to those possessed by legendary U.S. House Speaker Joseph Cannon (see also, Schickler 2001). The Speaker's most important powers are as follows (Dye et al. 2005; Kraemer et al. 2003; McCleskey et al. 1982). 5 First, the Speaker appoints all committee chairs and 4 The Speaker for the 1973 legislative session was Price Daniel Jr. 5 As mentioned above, the rules governing each two year session are approved in January of each odd year. While many (though not all) of the rules discussed here have remained the same over the period examined in this paper, we will in the future be gathering copies of the rules in place for each one of these 17 sessions in order to evaluate all relevant variance in the House rules over time (Cox and McCubbins 2005a).
6 4 vice-chairs. Second, the Speaker appoints one-half of the members of substantive committees (the chair and vice chair are not included as part of the "Speaker's half"), with the remainder appointed on a pure seniority basis (although the Speaker determines membership in the event of ties in the level of seniority). 6 Third, the Speaker appoints all members of procedural committees, including the crucial Calendars Committee which serves as the gateway to the floor (a power that is of extra importance when one considers the short duration of the legislative sessions). Fourth, the Speaker appoints all five House representatives on conference committees (the Lieutenant Governor appoints an equal number of senators). Fifth, the Speaker determines to which committee a bill is referred for its first reading. Sixth, the Speaker is empowered to interpret procedural rules in the event of a dispute. Seventh, the Speaker has the power to recognize (or not recognize) representatives on the floor who wish to speak, make a motion, etc. Eighth, the Speaker, along with the Lieutenant Governor, controls three important extra-legislative institutions: the Legislative Budget Board, the Legislative Council, and the Legislative Audit Committee (Maxwell et al. 2006). For all three institutions, the Lieutenant Governor and Speaker are members of the governing bodies, as well as together appoint (one-half each) all of the other members of the bodies. The Legislative Budget Board is an especially powerful institution, providing the Speaker with a profound amount of influence over the elaboration and execution of the state budget (Maxwell et al. 2006). Political parties do not play a formal role in the functioning of legislative politics in the Texas House (Anderson et al. 1992; Dye et al. 2005). Historically this was because the House was dominated by a single political party (the Democratic Party), but the 6 In 2003 the rules were modified to allow the Speaker to appoint all members of the Appropriations Committee (the most influential and prominent committee in the House).
7 5 tradition continues today even though the Democrats are now a minority in the House (see Figure 1). While party caucuses exist (the Democratic Caucus was established in 1981, although it took several years for all Democrats to join it; while the Republican Caucus was established in 1989), they play no formal role in the legislative process. 7 Formal partisan institutions of great relevance for the functioning of the U.S. House such as the majority leader, the minority leader, the majority whip, and the minority whip are simply absent from the Texas legislative environment. Elections in Texas are however partisan (with all major party candidates for the office of representative required to win a party primary to compete in the general election under that party's label), and thus representatives' general partisanship historically has been identified based on the label of the party under which they were elected. Since the early 1990s however, all Democratic and Republican House members have belonged to their respective party caucus (Hamm and Harmel 1993). 8 Figure 1 about here The Texas House, like the Texas polity, has historically been divided into what Kraemer et al. (2003, p. 74) aptly refer to as "Two Parties, Three Factions." The two parties are the Democratic Party and the Republican Party, while the three factions (from left to right on the ideological spectrum) are the Liberal Democrats, Conservative Democrats, and Republicans (Barnes and O'Neill 2006; Davidson 1990; Kraemer et al. 2003; Knaggs 1986; Maxwell et al. 2006). In the past, the dominant faction in state 7 The weak role of the party caucus is exemplified by the fact that neither Democratic Speaker Gib Lewis nor the key members of his leadership team initially joined the Democratic Caucus in the 1980s (Anderson et al. 1992; Hamm and Harmel 1993). 8 Other noteworthy caucuses in the Texas House include the Texas Conservative Coalition, the Legislative Study Group (Liberals), the Mexican American Legislative Caucus, and the Texas Legislative Black Caucus.
8 6 politics and in the legislature were the Conservative Democrats, who however during the last ten years were slowly eclipsed by the Republican Party, which is now dominant. The role occupied by the majority party in organizing the legislative process in the U.S. House (Cox and McCubbins 2005a), is in Texas played by the Speaker and his leadership team (Jones et al. 1992; Kraemer et al. 2003; Maxwell et al. 2006). 9 Historically, the Speaker tended to deal with individual legislators on a primarily personal basis, with the ideological orientation of the representative and their loyalty to the Speaker normally much more relevant than their partisan affiliation (Hamm and Harmel 1993; Kraemer et al. 2003). According to most observers the role of political parties in the Texas House changed with the election of Tom Craddick as Speaker in 2003 (and the shift to a Republican majority after 130 years of Democratic control of the House), with the partisan nature of House organization increasingly important for the functioning of the legislative process (Barnes and O'Neill 2006; Dye et al. 2005). Scholars point to Craddick's leadership and organizational style as much more similar to that seen in the U.S. House of Representatives than found historically in the Texas House (Barnes and O'Neill 2006; Dye et al 2005). Former Lieutenant Governor William Hobby Jr. ( ) reported a sharp contrast between the functioning of the House in the pre and post Craddick eras. He underscored the much stronger partisan nature of the House under Craddick than was the case during his tenure in office as well as throughout the 1990s, and noted that under Craddick the Texas House now looks and operates much more like 9 Members of the Speaker's leadership team normally occupy positions on key committees, and often are chairs and vice-chairs (Maxwell et al. 2006).
9 7 the U.S. House than was the case prior to Craddick's arrival (and that of the Republican majority) in 2003 (Hobby 2005). ROLL CALL VOTE ANALYSIS OF THE HOUSE: METHODS AND RESULTS When completed this project will examine roll call vote data from the 17 legislative sessions (two year periods) held between 1973 and In this version of the paper we examine roll call data for the following legislative sessions (we refer to the sessions using their initial year): 1983, 1987, 1993, 1995, 1997, 1999, 2001, 2003, 2005 (up to April 16, 2006). The results of all votes, except voice votes, are recorded. To specify how representatives ideal points relate to their vote choices in the legislative sessions, we utilize a spatial model of roll call voting. This spatial model also allows us to evaluate the dimensionality of Chamber roll call votes. To this end, we employ the Bayesian estimation procedure developed by Jackman and his colleagues (Clinton et al. 2004; Jackman 2001, 2000). 10 With a one-dimensional spatial model, the roll call vote analysis is expressed as: * y = U ( ζ ) U ( ψ ) = X β α + ε (1) ij i j i j i j j ij where y * ij, a latent variable, is a choice between a "Yes" position, ζ j, and a "No" position, ψ j, for each deputy i on each bill j. In this one-dimensional context, equation (1) for the utility differential y ij * can be expressed as a linear regression with the unobserved ideal points X i and unknown parameters β j and α j. We assume ε ij ~ N ( 0, 1 ). X i is a (n 1) matrix of ideal points, β j is a (1 m) matrix of discrimination parameters which represents a characteristic of bill j, and α j is a m-vector 10 For additional information on this procedure see the cited authors.
10 8 of intercepts. By the assumption of utility maximization, y ij * = 1 if y > 0, ij y ij = 0 otherwise. Using the probit link function, we obtain the model-parameters estimated by a Bayesian simulation method based on Gibbs sampling. We utilize truncated normal sampling to operationalize the probit model (positive and negative infinity are respectively operationalized as +10 and -10). Using a Gibbs sampler, we generate a large number of samples from the joint posterior density of the parameters and obtain the summary statistics used for inference. In our models, we let the Gibbs sampler run for a long burn-in period of between 50,000 and 1000,000 iterations, and then saved 5000 of the last 30,000 observations for inference. 11 The estimation procedure provides us with the representatives' mean and median ideal points and their 95% posterior confidence interval. To identify both ideal points and discrimination parameters, we assign priors to the parameters. 12 Uniform (1.0, -1.0) priors are given to the density over the ideal points X i. These uniform priors result in ideal points located within the intervals of 1.0 and For one-dimensional fits we assigned initial values for the ideal points, with the Republican Party at 1.0, and the Democratic Party at -1.0 (Anderson et al. 2002; Davidson 1990; Kraemer et al. 2003; Knaggs 1986; Maxwell et al. 2006). Normal priors are given for the discrimination parameters β j : β j ~ N ( 0, 10). After obtaining discrimination parameters for each period, we can determine how many discrimination parameters are distinguishable from zero. The discrimination parameters β j show "how change in X i translates into support for proposal j" (Jackman 11 The decision to save the last 5000 iterations was based on technical considerations, and, especially given the long burn-in period, has no effect on the results. 12 The procedure is sufficiently robust that if a representative's prior does not match their vote behavior, the latter determines the results obtained.
11 9 2001, p. 229). If only a small number of discrimination parameters are distinguishable from zero in a one-dimensional model, then there may exist higher dimensions in the data. Included in the initial population are all valid roll call votes held during the nine legislative sessions. Due to problems of convergence stemming from unanimous or nearunanimous (lopsided) votes, following Jackman (2001) and Poole and Rosenthal (1997) we exclude lopsided votes in which fewer than 2.5% of the representatives were on the losing side. To insure the sample obtained through the Gibbs sampler is representative of the underlying stationary distribution, we employ a combination of convergence diagnostics as well as a visual inspection of the trace plots. To perform convergence diagnostics and statistical and graphical analysis of Gibbs sampling output we use BOA (Bayesian Output Analysis program) (Smith 2003). We utilize two distinct convergence diagnostics (Geweke; Heidelbergen and Welch) (Cowles and Carlin 1996; Smith 2003). These diagnostics indicate the sample output almost perfectly converges to the posterior distribution. An average of over 99% of the parameters (in the case of both votes and deputies) are statistically significant at the 5% level in the convergence tests. With a handful of exceptions, representatives who did not achieve convergence did so due to the small percentage of roll calls on which they voted. Following the general methodology of Clinton et al. (2001), representatives who failed to vote on more than 80% of the votes were excluded from the analysis in which Bayesian ideal points are employed.
12 10 Table 1 provides information on the extent to which the roll call votes achieved discrimination on this single dimension for each of the nine legislative sessions. The lowest percentage of votes that achieved discrimination is 82.5% (1987), while the highest is 96.8% (1999). The mean percentage of votes that achieved discrimination is 91% (the median is 92%). In other words, on average 91% of the roll calls discriminate with respect to the recovered policy continuum. For the period, these results strongly suggest there exists only one dimension underlying the observed policy space in the Texas House. For the 1983, 1987, and 1993 sessions the results are however less clear in this respect. Table 1 about here By plotting the discrimination parameters (posterior means) against the percentage of representatives voting "Yes", we obtained a figure for each session in which the roll call votes that failed to achieve discrimination on the single dimension are detailed (similar figures are provided for the votes that achieved discrimination on the single dimension). These 18 figures are contained in Appendix I. By examining the nine figures for the votes that failed to discriminate, we can determine if a one-dimensional model is a reasonable fit to the data (Jackman 2001). Since there are few bills that result in close roll calls and fail to discriminate among representatives simultaneously, it is very unlikely that a higher-dimensional model would provide a better fit to the data for the 1995 to 2005 legislative sessions. For the 1983, 1985, and 1993 sessions, an overwhelming majority of the votes that did not discriminate on this first dimension were relatively lopsided. Nonetheless, the existence of more than a few votes that both did not discriminate on this dimension and at the same time were relatively close indicates the
13 11 need for future research to determine whether higher order dimensions exist (and if so, what their basis is), or if the votes that failed to discriminate (and at the same were close) were the consequence of primarily stochastic factors (i.e., the votes were on transient topics that did not belong to any consistent dimension). Once we have completed the analysis of the roll call vote data for the remaining legislative sessions (1973, 1975, 1977, 1979, 1981, 1985, 1989, 1991, 2005[04/06-05/06]), we will begin a comprehensive investigation to uncover any common trait, that is the basis of the potential higher order dimension(s), shared by the votes that failed to discriminate on this first (ideological) dimension. We plan to review newspaper and magazine (Austin American-Statesman, Dallas Morning News, Houston Chronicle, Houston Post, Texas Observer) coverage of the legislative session, examine materials related to the votes contained in the legislative archives, and conduct interviews with representatives who were in office when the votes took place. We also calculated the classification success rate for this one-dimensional model for each time period, a rate that serves as an additional goodness of fit measure. Classifications are performed by generating predicted probabilities p ij of each individual representative's voting decision with all model parameters set to their posterior means. The classification threshold c is 0.5. Therefore, if cases have predicted probabilities lying on the correct side of a classification threshold, pij > c when y ij = 1, they are recoded as correct predictions. Likewise, if pij c when y ij = 0, these cases also are considered correct predictions (Jackman 2001, 2000). The rate of correct classification for the onedimensional model varies from 83% to 90% for the nine legislative sessions.
14 12 INTER-PARTY HETEROGENEITY Representatives in the Texas House are arrayed along a Liberal-Conservative (or left-right in the vernacular of the rest of the world) ideological dimension, with Liberal Democrats occupying the left of the continuum, Conservative Democrats in the middle, and Republicans located on the right. 13 Figures detailing the distribution of the representatives' mean ideal points (and respective 95% confidence intervals) for each of the nine legislative sessions are located in Appendix II. Figure 2 provides the evolution of the median ideal points of the Democratic Party and the Republican Party for the nine legislative sessions (Aldrich and Rohde 1998; and Aldrich et al. 2002). Between 1983 and 2005 the Euclidean distance between the Democrats and the Republicans has increased, starting from a low of 0.65 in 1983 and surpassing 1.00 continuously since 1995 (with a high of 1.26 in 2003). Figure 2 about here Figure 3 provides a similar depiction of the evolution of inter-party heterogeneity through the use of a measure of the level of overlap between the members of the Democratic and Republican parties (Aldrich and Rohde 1998; Aldrich et al. 2002). Overlap-1 is measured as the minimum percentage of the members of the two delegations whose ideal points would have to be changed in order to yield complete separation between the two parties. Overlap-2 is measured as the minimum number of members of the two delegations whose ideal points would have to be changed in order to yield complete separation between the two parties divided by the number of members in the 13 While we are relatively confident that in the six most recent sessions only this single ideological dimension underlies the House policy space, it is possible (though not assured) that at least one (albeit minor) higher order dimension existed prior to Analysis of the other legislative sessions, particularly those from the 1970s, will shed greater light on this issue.
15 13 delegation of the smaller party. Overlap-1 and Overlap-2 underscore the increase in the level of inter-party heterogeneity that took place between 1983 and 2005, a pattern that is also revealed through the examination of the distribution of the mean ideal points of the Democratic (blue) and Republican (red) representatives for the nine legislative sessions contained in Appendix II. In the 1980s a significant (albeit still not large) number of Democrats could be found to the right of some Republicans on the single ideological dimension (and vice versa), but by 1999 all traces of overlap had vanished (and by 2003 there were not even any instances where the 95% confidence intervals of a Democratic and a Republican representative overlapped). Figure 3 about here PREFERENCE VS. PARTISAN EFFECTS ON LEGISLATIVE VOTING. The question of the extent to which legislator preferences or political parties influence the legislative process in the U.S. House of Representatives has in recent years consumed a larger share of political science's premier scholars intellectual energy than any other. While the debate on the U.S. Congress appears to either be resolved (Cox and McCubbins 2005a) or to have reached a stalemate (Krehbiel 2004), a rich, yet relatively unexplored avenue for improving general legislative theory is the evaluation of these competing theories in other legislative bodies, both abroad and at home at the state and municipal level (Gamm and Huber 2002; Squire and Hamm 2005). In this section we make a contribution in this respect through the evaluation of preference and party based models' relative ability to explain legislative behavior in the Texas House of Representatives between 1983 and 2006.
16 14 In their recent Legislative Studies Quarterly article, Lawrence et al. (2006) present four stylized theories (and accompanying models) of preference and party based legislative voting behavior based on their review of the vast literature on non-partisan and partisan theories. These four models are the Preference Model (Krehbiel 1998, 1991), the Veto Preference Model (Brady and Volden 1998; Krehbiel 1998), the Party Loyalty Inducement Model (Maltzman 1998), and the Majority Party Agenda Control Model (Cox and McCubbins 2005a; Sinclair 1983). 14 For a graphical depiction of these four models taken from Lawrence et al. (2006), see Appendix III. We evaluate three of these four models, as well as one additional model that is a slight variation of the Majority Party Agenda Control Model. We do not evaluate the Veto Preference Model in large part because we lack at present a good measure of the governor's location on the ideological spectrum for much of this period, which is necessary for the testing of this model. 15 Following the strategy employed by Lawrence et al. (2006) we utilize one dependent variable and four independent variables to assess the relative explanatory power of these four models. The dependent variable for this analysis is the individual representative's win rate in non-lopsided (2.5% threshold) roll call votes (number of times 14 Lawrence et al. (2006) do not evaluate a separate model that incorporates information on inter-party and intra-party heterogeneity along the lines of Conditional Party Government (CPG) Theory. Information on one aspect of intra-party heterogeneity in the Texas House, the standard deviation of the ideal points of all House representatives, Democratic representatives, and Republican representatives, is provided in Appendix IV (Aldrich and Rohde 1998; Aldrich et al. 2002). 15 Lawrence et al. (2006) do not find the Veto Preference Model to be especially effective in explaining legislative voting in the U.S. House. Furthermore, the Veto Preference Model would seem more designed for a situation where the chief executive lies closer to the ideological extremes than to the median, which generally has not been the case in Texas where the governors tend to straddle the center of the ideological spectrum in the state (the current governor, Rick Perry [2000- ], is a possible exception).
17 15 on the majority side/total number votes cast). In the future we also plan to utilize a variable that follows the exact same methodology as Lawrence et al. (2006), who analyzed only the win rate for final passage votes. 16 However, given the observed similarity of most representatives' votes on second and third (final passage) readings, we do not expect results derived from this analysis to be greatly different from those presented here. 17 Our independent variables (drawn from Lawrence et al. 2006) are based on two pieces of information for each representative: their partisan affiliation and their mean ideal point on the Liberal-Conservative ideological dimension detailed above. Distance from Median: the absolute ideological distance of a representative (i.e., there mean ideal point) from the House median (i.e., the median representative's mean ideal point). Majority Political Party: whether a representative is a member of the party that holds the majority of the seats in the House (coded 1); the Democrats for all legislative sessions except 2003 and Majority Side of Median: whether a representative's mean ideal point is on the majority side of the median (coded 1). Minority Side of Median * Distance from Median: whether a representative's mean ideal point is on the minority side of the median (coded 1) multiplied by Distance from Median. 16 We are unsure if the logic underlying Lawrence et al.'s (2006) decision to restrict their analysis to final passage votes is equally compelling in the Texas context. 17 When a bill is undergoing its third reading, it can only be amended by a two-thirds vote, with changes introduced at the second reading thus difficult to modify after that stage in the legislative process is concluded.
18 16 Minority Party * Distance from Median: whether a representative is a member of the party that does not hold a majority of the seats in the House (coded 1) multiplied by Distance from Median. Lawrence et al. (2006) utilize combinations of these variables to test three of models we are evaluate here. The Pure Preference Model is operationalized as Distance from Median. The Party Loyalty Inducement Model is operationalized as Majority Political Party. The Majority Party Agenda Model is operationalized using two variables: Majority Side of Median and the interactive Minority Side of Median * Distance from Median. We add one model that is a slight variant of the Majority Party Agenda Control Model (labeled Majority Party Agenda Control Model II). It is operationalized using two variables: Majority Political Party and the interactive Minority Party * Distance from Median. There are two main differences between this operationalization and that employed by Lawrence et al. (2006) for the Majority Party Agenda Control Model. First, members of the majority party who are on the minority side of the House median are still treated as members of the majority party (and hence we expect them to have win rates that are equal to their co-partisans). Second, members of the minority party who are on the majority side of the House median are considered to have win rates that will vary inversely with their proximity to the House median We are uncertain about this operationalization, but have it included for instructive purposes as well as due to some concerns we have regarding the operationalization of the Party Agenda Control Model by Lawrence et al. (2006), in particular the fact that majority party members on the minority side of the House median are treated in a equivalent manner to minority party members. Our operationalization has some particular conceptual problems when members of the minority party lie on the majority side of the House median. This problem is however empirically confined to a mere
19 17 To test these models Lawrence et al. (2006) employ weighted least squares (WLS) with a logistic transformation (the glogit command in Stata). They then use the Bayesian Information Criterion (BIC) statistic to evaluate their four non-nested models. The lower the value of the BIC statistic, the better the model, with absolute differences in BIC values of more than 10 generally considered to be very strong evidence that one model is superior to another (Raftery 1995). Our econometric analysis is conducted using Ordinary Least Squares (OLS) with robust standard errors to correct for the heteroskedasticity inherent in these type of data (i.e., proportions). 19 Our use of OLS in place of WLS is due primarily to our inability (due to time limitations) to determine how to calculate BIC statistics when using WLS with a logistic transformation. Our results obtained using WLS with a logistic transformation provide substantive conclusions regarding the impact of the independent variables and of the superiority of the different models (using the Adjusted R2 and Standard Error of the Estimate statistics to evaluate the models) that are identical to those presented here. Once we can determine how to calculate the BIC statistic following the methodology of Lawrence et al. (2006) however, we will do so as a robustness check. Lawrence et al. (2006) conclude that of the four models examined, the Majority Party Agenda Control Model did the best job in explaining individual win rates on final passage votes. At the same time, they found that among the four models, the Pure Preference Model performed the worst (with the caveat that the Veto Preference Model in handful of representatives (three, one each in 1987, 1993, and 1995) for the years examined. 19 This corrects for one of the three concerns with OLS raised by Lawrence et al. (1996), especially since WLS itself introduces heteroskedasticity into the analysis. The issue of nonsense predicted probabilities resulting from the use of a proportion as a dependent variable is not a major concern for us at present.
20 18 several instances provided theoretically incorrect results, albeit with a BIC that was lower than that of the Pure Preference Model). They conclude that the superior model for explaining members' legislative voting behavior in the U.S. House is the Majority Party Agenda Control Model, thereby adding to the already considerable body of evidence in support of this model of congressional behavior (see Cox and McCubbins 2005a). Tables 2 (1983), 3 (1987), 4 (1993), 5 (1995), 6 (1997), 7 (1999), 8 (2001), 9 (2003), and 10 (2005) respectively provide the results of our legislative session specific analysis of these four models. Utilizing the BIC to evaluate model superiority, we can conclude that for the period, the Pure Preference Model is on average superior to all of the other models in terms of its ability to explain individual representative win rates. 20 Tables 2, 3, 4, 5, 6, 7, 8, 9, 10 about here For the seven ( ) legislative sessions (see Tables 2 through 8), the BIC for the Pure Preference Model was substantially lower (i.e., a BIC difference of more than 10, indicating that the evidence in favor of the model is "Very Strong" according to Raftery (1995)) than that of all other models in five legislative sessions, equivalent to the BIC of the Party Loyalty Inducement Model in one session (2001), and inferior to the Party Loyalty Inducement Model in one session (1997). Most importantly, in all seven legislative sessions the Pure Preference Model outperformed the Majority Party Agenda Control Model and the Majority Party Agenda Control Model II. While in 1983, 1997, and 2001 the Majority Party Agenda Control Model (and in 1997 and 2001 the Majority Party Agenda Control Model II as well) had a BIC that was 20 The use of JA encompassing tests provides similar conclusions related to model superiority (Davidson and Mackinnon 1981).
21 19 substantially lower than that of the Pure Preference Model, this BIC was for a model where the estimated coefficient for the variable Majority Side of Median (and for Majority Political Party in the related Model II) was negative and significant (which was in fact the case for all of the legislative sessions prior to 2003 for both models). That is, the effect of Majority Side of Median (and of Majority Political Party in Model II) was directly contrary to that hypothesized by the Majority Party Agenda Control Model, with a representative's location on the majority side of the median, or within the majority political party, resulting, ceteris paribus, in a decrease in their individual win rate compared to representatives on the minority side of the median or within the minority political party, once the distance of these latter representatives from the median had been controlled for. In sum, while the Majority Party Agenda Control models fit the data well, they are not informative for the hypothesis. 21 Tables 9 (2003) and 10 (2005) depict a decidedly different reality than Tables 2 through 8. For these legislative sessions, the Majority Party Agenda Control Model and the Majority Party Agenda Control Model II both substantially outperform the Pure Preference Model as well as the Party Loyalty Inducement Model. In both sessions the Pure Preference Model performed markedly worse than the two Majority Party Agenda Control models (with the Party Loyalty Inducement Model coming in third). Compared to the previous legislative sessions, in both 2003 and 2005 the parameter for Majority Side of Median and Majority Political Party switched signs, going from negative and statistically significant to positive and statistically significant, providing results that are 21 As a consequence, even if the ideal point scores incorporate some aspects of party pressure (McCarty, Poole, and Rosenthal 2001), which is something we plan on investigating in the future for the Texas House, the superiority of the Pure Preference Model to the Majority Party Agenda Control model still would appear to hold.
22 20 very comparable to those presented by Lawrence et al. (2006) in their analysis of the U.S. House. This dramatic shift in the econometric results corresponds to the powerful change in the functioning of the Texas House highlighted by many observers (Barnes and O'Neill 2006, Dye et al. 2005; Hobby 2005) since the Republican Party obtained a majority of the seats in the House in the 2002 election, and Speaker Tom Craddick assumed office in These findings provide strong and convincing evidence to support the assertion of former Lieutenant Governor William Hobby Jr. that since 2003 the Texas House of Representatives has looked and operated much more like the strongly partisan U.S. House of Representatives than like the relatively non-partisan Texas House that existed prior to One question that will be difficult to answer, perhaps for some time (but perhaps not given the outcome of the 2005 Republican primaries), is whether this shift is primarily the product of a change in the role of political parties in Texas politics in general, and in the Texas House in particular, or if it is primarily the consequence of the leadership style and beliefs of Speaker Tom Craddick (Barnes and O'Neill 2006). Employing the methodology of Lawrence et al. (2006), we conclude that a Pure Preference Model (á la Krehbiel) best explains individual win rates in the Texas House prior to 2003 and that a Majority Party Agenda Control Model (á la Cox and McCubbins) best explains individual win rates in the Texas House since Of course, alternative measures and methodologies will need to be utilized in the future to determine the robustness of these conclusions. They include examining separately the win rates for final passage votes as well as using the methodology of Cox and Poole (2002) to assess
23 21 whether larger than expected Rice indices on roll call votes occur more than one would expect to happen by chance (i.e., under a model of no party influence). Our conclusion regarding the superiority of the Pure Preference Model to the Majority Party Agenda Control Model for explaining the functioning of the Texas House is not entirely consistent with that of Cox and McCubbins (2005b). Using data on majority party and minority party roll rates for the legislative sessions, Cox and McCubbins (2005b) tested a Cartel Agenda Model and a Floor Agenda Model and determined that the "majority party in the Texas Legislature controls agenda power in a way consistent with the predictions of the Cartel Agenda Model." We plan to investigate the reasons behind these somewhat different conclusions in a future version of this paper. One hurried, and quite possibly incorrect, explanation for this divergence is related to the nature of the coalition that ran the Texas House prior to Under the ancien régime in force, the Speaker operated in a relatively non-partisan manner, with the Speaker's team and support coalition normally encompassing a mixture of moderate and conservative Democrats and Republicans (Maxwell et al. 2006). As a consequence, a majority of both the majority and minority parties were normally within the Speaker's support base, with Liberal Democrats and especially Very Conservative Republicans left out. The figures in Appendix V highlight, for the period, the degree to which representatives whose mean ideal points were located near the center of the ideological spectrum, regardless of party affiliation, tended to have higher individual win rates than those Democrats and Republicans at the extremes of the ideological distribution (i.e., liberal Democrats and conservative Republicans). Twice liberal
24 22 Democrats fared somewhat better than conservative Republicans (1983, 1993) and in one instance conservative Republicans tended to fare better than liberal Democrats (1995), but overall, in five of the pre-2003 periods (the exceptions are 1997 and 2001), the Democrats and Republicans closer to the center of the ideological spectrum tended to have higher individual win rates than their co-partisans at the extremes. 22 The Appendix V figures for 2003 and 2005 graphically display the dramatic change in partisan voting behavior that occurred in the Texas House beginning in In 2003 (the figure for which could be described as a Republican waterfall) and 2005, on both sides of the aisle, partisan factors clearly influenced representatives' individual win rates to an extent not previously observed in the Texas House. THE SPEAKER'S TEAM Between 1983 and 2002 the Texas House was run by a centrist Democratic Speaker who relied principally on the support of moderate and conservative Democrats and Republicans (Maxwell et al. 2006). During this time period a representative's ideological pre-disposition and personal relationship with the Speaker tended to trump their partisan affiliation in terms of their legislative behavior. This nonpartisan/bipartisan alliance ended with the election of Speaker Tom Craddick, who since 2003 has run the Texas House of Representatives in a manner that would be very familiar to observers of the U.S. House of Representatives were they to visit Austin. One area where we plan to conduct additional work is on the relationship between the Pure Preference/Floor Agenda Model and the existence of a powerful Speaker, who, once initially elected (since 1975 at least), is able to utilize the ample institutional and 22 We plan to conduct a similar analysis to that provided in Appendix V using individual win rate data from final passage votes only.
25 23 procedural resources provided by the office of Speaker to obtain future re-election as Speaker (even if the Speaker is no longer located at the same ideological location, vis-àvis the rest of the House, as when originally elected). We will develop a much better understanding of the origin, nature, and functioning of the Speaker's Team. At present, we however limit our discussion of this extremely important topic for the understanding of the Texas House (prior to 2003 in particular) to the presentation of information on committee chairs. After the Speaker, the Texas House committee chairs are the most powerful individuals in the legislature. Most committee chairs also are considered to be ideologically or personally close to the Speaker (Dye et al. 2005; Kraemer et al. 2003; Maxwell et al. 2006), especially those on the most important committees (e.g., Appropriations, Calendars, Public Education, State Affairs, Ways and Means) (Maxwell et al. 2006). 23 As Dye et al. (2005) note, the Speaker depends on these key committee chairs to help implement his legislative agenda. Speakers in the Texas House rarely cast roll call votes, and thus we lack a direct measure of their location on the Liberal-Conservative ideological dimension underlying the observed policy space in the Texas House. However, we do know the location of House Appropriations Committee Chair, the most important position in the Chamber after that of Speaker (Hailey 2005), and a position that is appointed by the Speaker. We thus for now use the mean ideal point of the Appropriations Chair as a very rough proxy for the location of the Speaker on the Liberal-Conservative ideological spectrum Speakers at times may appoint individuals for reasons other than ideological or personal compatibility, such as for reasons of regional, partisan, gender, or ethnic/racial diversity or due to the requests of powerful lobbies (Kraemer et al. 2003, Maxwell et al. 2006). 24 All recent Speakers served for a substantial period in the House prior to their election as Speaker (Clayton: six terms, Lewis: six terms, Laney: 10 terms, Craddick: 17 terms).
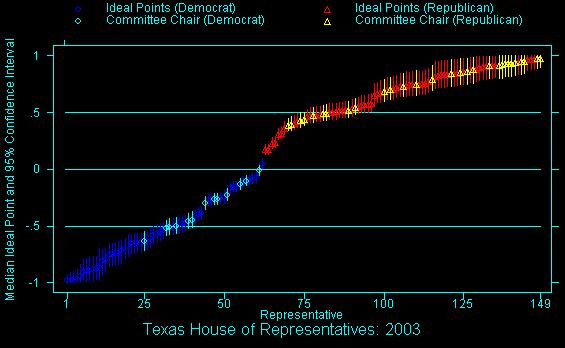
26 24 Table 11 provides information on the mean absolute distance (from the mean ideal point of the Appropriations Committee Chair) of the mean ideal points of the committee chairs compared to the mean absolute difference of all other representatives. In every one of the nine legislative sessions examined here, the committee chairs possessed mean ideal points that were significantly closer to that of the Appropriations Chair (and perhaps thus to the Speaker) than the other House members. This is a very rough measure of both the Speaker's location on the ideological spectrum as well as of the members of the Speaker's team (since as mentioned previously, not all committee chairs are appointed based on their proximity to the Speaker). Table 11 about here Finally, Appendix VI provides figures that are comparable to those in Appendix II (i.e., the representative's respective mean ideal points and 95% confidence intervals along the Liberal-Conservative ideological dimension), except that committee chairs from the Democratic Party are colored light blue (other Democrats are dark blue) and committee chairs from the Republican Party are colored yellow (other Republicans are red). The figures provide an enlightening window on a potential avenue for future research on the factors and logic underlying the Speaker's crafting of a legislative team and support base in the House. If the distribution of committee chairs tells us anything, it is that the strategies adopted by the Speakers have varied over time. In some years committee chairs can be found spread across the ideological spectrum (1983, 1987, 1993, 1995), while in others the committee chairs tended to be clustered closer to the center of the ideological spectrum (1997). Finally, since 1999 the Speakers (first the Democratic Thus the DW-Nominate methodology (Poole and Rosenthal 1997) could be employed as an alternative way to determine the location of the Speaker on the Liberal-Conservative ideological dimension.
27 25 Speaker Pete Laney in 1999 and 2001, then the Republican Speaker Tom Craddick in 2003 and 2005) appear to have adopted a strategy of providing committee chairs to an ideologically diverse group of members from their own party, while only allocating chairs to members of the opposition party who were closest to the median (i.e., liberal Republicans by Laney and conservative Democrats by Craddick). 25 CONCLUSION As anyone who has just finished reading this paper is by now all too well aware, this is very, very, much a work in progress. We still have a long way to go in gathering more data, performing additional analysis, and improving our qualitative understanding of the inner-workings of the Texas House over the past thirty years. Once we have completed this first stage of the project focusing on the period, we plan to go back further in time to explore the functioning of the Texas House (and of the Texas Senate) in the pure one-party era. 26 We also plan to broaden our analysis of the period to include the Senate. The Texas Senate differs from the House in several important manners, including the presence of a directly elected leader (the Lieutenant Governor, a Republican since 1999) as well as the need for any bill to obtain the support of two-thirds of the senators in order to proceed to the Senate floor (Cox and McCubbins 2005b). The Senate thus provides a somewhat different institutional context in which to explore the evolution of the party system in the state of 25 The most liberal Republicans, pejoratively referred to by their more conservative copartisans as RINOS (Republican in Name Only), did however not fare as well in the allocation of committee chairs under Craddick as the most conservative Democrats had under Laney. 26 The evolution of Republican representation in the Senate is roughly equivalent to that depicted in Figure 1 for the House, with the notable exception that the Republicans gained an absolute majority of the seats in the Senate in 1998, four years earlier than in the House.
28 26 Texas as well as to understand the extent to which different existing theories of legislative organization and behavior help us understand the functioning of the Texas Legislature over time.
29 27 REFERENCES Aldrich, John H., Mark M. Berger, and David W. Rohde "The Historical Variability in Conditional Party Government, ," in David W. Brady and Mathew D. McCubbins, eds., Party, Process, and Political Change in Congress: New Perspectives on the History of Congress. Stanford: Stanford University Press. Aldrich, John H., and David W. Rohde "Measuring Conditional Party Government," Paper presented at the Annual Meeting of the Midwest Political Science Association, Chicago, April. Anderson, James E., Richard W. Murray, and Edward L. Farley Texas Politics: An Introduction (Sixth Edition). New York: HarperCollins. Barnes, Tiffany, and Timothy J. O'Neill "'Learning to Govern': The Texas Experience," Journal of Political Science. (Forthcoming 2006). Brady, David W., and Craig Volden Revolving Gridlock. Boulder: Westview. Clinton, Joshua, Simon Jackman, and Douglas Rivers "The Statistical Analysis of Roll Call Data." American Political Science Review 98(May): Clinton, Joshua, Simon Jackman, and Douglas Rivers "The Statistical Analysis of Roll Call Data," Unpublished Manuscript, Stanford University. Clucas, Richard A "Principal-Agent Theory and the Power of State House Speakers," Legislative Studies Quarterly 26: Cowles, Mary Kathryn, and Bradley P. Carlin "Markov Chain Monte Carlo Convergence Diagnostics: A Comparative Review." Journal of the American Statistical Association 91(June):
30 28 Cox, Gary W., and Mathew D. McCubbins. 2005a. Setting the Agenda: Responsible Party Government in the U.S. House of Representatives. New York: Cambridge University Press. Cox, Gary W., and Mathew D. McCubbins. 2005b. "Procedural Cartels in Texas: A Note," Unpublished Manuscript, University of California-San Diego. Cox, Gary W., and Keith T. Poole "On Measuring Partisanship in Roll Call Voting: The U.S. House of Representatives, ," American Journal of Political Science 46: Davidson, Chandler Race and Class in Texas Politics. Princeton: Princeton University Press. Davidson, Russell, and James G. MacKinnon "Several Tests for Model Specification in the Presence of Alternative Hypotheses," Econometrica 49: Dye, Thomas R., Tucker Gibson, and Clay Robison Politics in America, Texas Version (Sixth Edition). Englewood Cliffs, NJ: Prentice Hall. Gamm, Gerald, and John Huber "Legislatures as Political Institutions: Beyond the Contemporary Congress." In Political Science: The State of the Discipline, ed. Ira Katznelson and Helen V. Milner. New York: W. W. Norton, Gelman, Andrew, and Donald B. Rubin "Inference From Iterative Simulation Using Multiple Sequences." Statistical Science 7(November): Hamm, Keith E., and Robert Harmel "Legislative Party Development and the Speaker System: The Case of the Texas House," The Journal of Politics 55: Hobby, William Hobby Jr Interview with former Lieutenant Governor Hobby ( ), October 5.
31 29 Jackman, Simon "Multidimensional Analysis of Roll Call Data via Bayesian Simulation: Identification, Estimation, Inference, and Model Checking." Political Analysis 9(Summer): Jackman, Simon "Estimation and Inference Are Missing Data Problems: Unifying Social Science Statistics via Bayesian Simulation." Political Analysis 8(Autumn): Jones, Eugene W., Joe E. Ericson, Lyle C. Brown, and Robert S. Trotter, Jr Practicing Texas Politics (Eighth Edition). Boston: Houghton Mifflin. Jones, Mark P., and Wonjae Hwang "Party Government in Presidential Democracies: Extending Cartel Theory Beyond the U.S. Congress," American Journal of Political Science 49: Knaggs, John R Two-Party Texas: The John Tower Era, Austin: Eakin Press. Kraemer, Richard H., Charldean Newell, and David F. Prindle Essentials of Texas Politics (Seventh Edition). Belmont, CA: Wadsworth. Krehbiel, Keith "Partisan Roll Rates in a Nonpartisan Legislature," Stanford University Graduate School of Business Research Paper 1870R. Krehbiel, Keith Pivotal Politics: A Theory of U.S. Lawmaking. Chicago: University of Chicago Press. Krehbiel, Keith Information and Legislative Organization. Ann Arbor: University of Michigan Press. Lawrence, Eric D., Forrest Maltzman, and Steven S. Smith "Who Wins? Party Effects in Legislative Voting," Legislative Studies Quarterly 31:
32 30 Maltzman, Forrest "Maintaining Congressional Committees: Sources of Member Support," Legislative Studies Quarterly 23: Maxwell, William Earl, and Ernest Crain (with Edwin S. Davis, Elizabeth N. Flores, Joseph Ignagni, Cynthia Opheim, Christopher Wlezien Texas Politics Today (Twelfth Edition). Belmont, CA: Thomson Wadsworth. McCleskey, Clifton, Allan K. Butcher, Daniel E. Farlow, and J. Pat Stephens The Government and Politics of Texas (Seventh Edition). Boston: Little, Brown and Company. Poole, Keith T Spatial Models of Parliamentary Voting. New York: Cambridge University Press. Poole, Keith T., and Howard Rosenthal Congress: A Political-Economic History of Roll Call Voting. New York: Oxford University Press. Raftery, Adrian E "Bayesian Model Selection in Social Research," Sociological Methodology 25: Schickler, Eric Disjointed Pluralism: Institutional Innovation and the Development of the U.S. Congress. Princeton: Princeton University Press. Sinclair, Barbara Majority Leadership in the U.S. House. Baltimore: Johns Hopkins University Press. Smith, Brian J Bayesian Output Analysis Program (BOA), Version 1.0 User's Manual. ( Squire, Peverill, and Keith E. Hamm Chambers: Congress, State Legislatures, and the Future of Legislative Studies. Columbus: Ohio State University Press.
33 Table 1. One Dimensional Analysis of the Texas House of Representatives Saving 5,000 obs. from the last 30,000 obs. after a burn-in period. (thin= 6) Year Goodness of fit Rate of correct Convergence Test discrimination Geweke (1%) HW (5%) Votes 1973 Ideal points No. of Iteration [82.79, 83.03] [84.00, 84.31] [82.18, 82.56] [86.84, 87.18] [85.51, 85.87] [87.14, 87.55] [86.36, 86.77] [89.83, 90.01] [87.65, 87.86] 520/ /524 (99.2%) (83.8%) 156/156 (100%) 325/ /326 (99.7%) (82.5%) 150/150 (100%) 267/312 (85.6%) 181/194 (93.3%) 100% 100% 100% 100% 310/312 (99.4%) 100% 149/150 (99.3%) 193/194 (99.5%) 149/149 (100%) 227/ /231 (98.3%) (92.2%) 147/150 (98%) 151/ /155 (97.4%) (96.8%) 145/149 (97.3%) 176/ /180 (97.8) (94.4%) 149/149 (100%) 549/ /551 (99.6%) (96.4%) 151/151 (100%) 499/ /506 (98.6%) (92.7%) 150/150 (100%) 100% 193/194 (99.5%) 100% 100% 100% 100% 100% 100% 100% 100% 100% 100% 100% 50,000 50,000 70, ,000 90,000 60,000 70,000 70,000 70,000
34 TABLE 2: DETERMINANTS OF WIN-RATES IN THE TEXAS HOUSE OF REPRESENTATIVES, 1983 PARTY MAJORITY PARTY MAJORITY PARTY PURE LOYALTY AGENDA AGENDA PREFERENCE INDUCEMENT CONTROL CONTROL EXPLANATORY VARIABLES MODEL MODEL MODEL MODEL II Distance from Median *** (0.028) Majority Political Party 0.093*** (0.015) Majority Side of Median *** (0.013) Minority Side of Median * Distance *** (0.027) Majority Political Party *** (0.021) Minority Party * Distance from Median *** (0.045) Constant (0.010) (0.013) (0.011) (0.019) Adjusted R Square Bayesian Information Criterion Number of Cases
35 TABLE 3: DETERMINANTS OF WIN-RATES IN THE TEXAS HOUSE OF REPRESENTATIVES, 1987 PARTY MAJORITY PARTY MAJORITY PARTY PURE LOYALTY AGENDA AGENDA PREFERENCE INDUCEMENT CONTROL CONTROL EXPLANATORY VARIABLES MODEL MODEL MODEL MODEL II Distance from Median *** (0.015) Majority Political Party 0.023* (0.010) Majority Side of Median *** (0.0126) Minority Side of Median * Distance *** (0.017) Majority Political Party *** (0.013) Minority Party * Distance from Median *** (0.019) Constant (0.009) (0.007) (0.010) (0.011) Adjusted R Square Bayesian Information Criterion Number of Cases
36 TABLE 4: DETERMINANTS OF WIN-RATES IN THE TEXAS HOUSE OF REPRESENTATIVES, 1993 PARTY MAJORITY PARTY MAJORITY PARTY PURE LOYALTY AGENDA AGENDA PREFERENCE INDUCEMENT CONTROL CONTROL EXPLANATORY VARIABLES MODEL MODEL MODEL MODEL II Distance from Median *** (0.016) Majority Political Party 0.065*** (0.010) Majority Side of Median *** (0.016) Minority Side of Median * Distance *** (0.024) Majority Political Party ** (0.015) Minority Party * Distance from Median *** (0.022) Constant (0.009) (0.007) (0.014) (0.014) Adjusted R Square Bayesian Information Criterion Number of Cases
37 TABLE 5: DETERMINANTS OF WIN-RATES IN THE TEXAS HOUSE OF REPRESENTATIVES, 1995 PARTY MAJORITY PARTY MAJORITY PARTY PURE LOYALTY AGENDA AGENDA PREFERENCE INDUCEMENT CONTROL CONTROL EXPLANATORY VARIABLES MODEL MODEL MODEL MODEL II Distance from Median *** (0.013) Majority Political Party *** (0.014) Majority Side of Median *** (0.017) Minority Side of Median * Distance *** (0.022) Majority Political Party *** (0.017) Minority Party * Distance from Median *** (0.022) Constant (0.008) (0.005) (0.011) (0.011) Adjusted R Square Bayesian Information Criterion Number of Cases
38 TABLE 6: DETERMINANTS OF WIN-RATES IN THE TEXAS HOUSE OF REPRESENTATIVES, 1997 PARTY MAJORITY PARTY MAJORITY PARTY PURE LOYALTY AGENDA AGENDA PREFERENCE INDUCEMENT CONTROL CONTROL EXPLANATORY VARIABLES MODEL MODEL MODEL MODEL II Distance from Median *** (0.031) Majority Political Party 0.172*** (0.012) Majority Side of Median * (0.011) Minority Side of Median * Distance *** (0.014) Majority Political Party *** (0.010) Minority Party * Distance from Median *** (0.012) Constant (0.016) (0.010) (0.010) (0.008) Adjusted R Square Bayesian Information Criterion Number of Cases
39 TABLE 7: DETERMINANTS OF WIN-RATES IN THE TEXAS HOUSE OF REPRESENTATIVES, 1999 PARTY MAJORITY PARTY MAJORITY PARTY PURE LOYALTY AGENDA AGENDA PREFERENCE INDUCEMENT CONTROL CONTROL EXPLANATORY VARIABLES MODEL MODEL MODEL MODEL II Distance from Median *** (0.013) Majority Political Party (0.012) Majority Side of Median *** (0.018) Minority Side of Median * Distance *** (0.027) Majority Political Party *** (0.018) Minority Party * Distance from Median *** (0.023) Constant (0.008) (0.009) (0.016) (0.016) Adjusted R Square Bayesian Information Criterion Number of Cases
40 TABLE 8: DETERMINANTS OF WIN-RATES IN THE TEXAS HOUSE OF REPRESENTATIVES, 2001 PARTY MAJORITY PARTY MAJORITY PARTY PURE LOYALTY AGENDA AGENDA PREFERENCE INDUCEMENT CONTROL CONTROL EXPLANATORY VARIABLES MODEL MODEL MODEL MODEL II Distance from Median *** (0.017) Majority Political Party 0.233*** (0.539) Majority Side of Median *** (0.012) Minority Side of Median * Distance *** (0.014) Majority Political Party *** (0.013) Minority Party * Distance from Median *** (0.015) Constant (0.011) (0.011) (0.011) (0.012) Adjusted R Square Bayesian Information Criterion Number of Cases
41 TABLE 9: DETERMINANTS OF WIN-RATES IN THE TEXAS HOUSE OF REPRESENTATIVES, 2003 PARTY MAJORITY PARTY MAJORITY PARTY PURE LOYALTY AGENDA AGENDA PREFERENCE INDUCEMENT CONTROL CONTROL EXPLANATORY VARIABLES MODEL MODEL MODEL MODEL II Distance from Median *** (0.019) Majority Political Party 0.585*** (0.016) Majority Side of Median 0.081*** (0.016) Minority Side of Median * Distance *** (0.019) Majority Political Party 0.199*** (0.027) Minority Party * Distance from Median *** (0.026) Constant (0.017) (0.016) (0.016) (0.027) Adjusted R Square Bayesian Information Criterion Number of Cases
42 TABLE 10: DETERMINANTS OF WIN-RATES IN THE TEXAS HOUSE OF REPRESENTATIVES, 2005 PARTY MAJORITY PARTY MAJORITY PARTY PURE LOYALTY AGENDA AGENDA PREFERENCE INDUCEMENT CONTROL CONTROL EXPLANATORY VARIABLES MODEL MODEL MODEL MODEL II Distance from Median *** (0.011) Majority Political Party 0.363*** (0.012) Majority Side of Median 0.043*** (0.011) Minority Side of Median * Distance *** (0.011) Majority Political Party 0.094*** (0.011) Minority Party * Distance from Median *** (0.011) Constant (0.010) (0.011) (0.010) (0.010) Adjusted R Square Bayesian Information Criterion Number of Cases
43 TABLE 11: COMMITTEE CHAIRS AND THE HOUSE LEADERSHIP MEAN IDEAL POINT DIFFERENCE FROM THE APPROPRIATIONS CHAIR COMMITTEE ALL OTHER SIGNIFICANCE LEGISLATIVE SESSION CHAIRS REPRESENTATIVES (P. VALUE) T-Test of Difference of Means for Committee Chairs and Other Representatives.
44 FIGURE 1. THE EMERGENCE OF A TWO PARTY SYSTEM IN THE TEXAS HOUSE: NUMBER OF REPRESENTATIVES IN THE TEXAS HOUSE Democrats Republicans ELECTION YEAR
45 FIGURE 2. THE EVOLUTION OF INTER-PARTY HETEROGENEITY: PARTY MEDIANS IN THE TEXAS HOUSE MEDIAN PARTY IDEAL POINT Democrats Republicans LEGISLATIVE SESSION YEAR
46 FIGURE 3. THE EVOLUTION OF INTER-PARTY HETEROGENEITY II: PARTISAN OVERLAP IN THE TEXAS HOUSE 50 Percentage of Representatives Moved to Eliminate All Overlap Overlap-1 Overlap YEAR
47 APPENDIX I ROLL CALL VOTE DISCRIMINATION ON THE LIBERAL-CONSERVATIVE DIMENSION, (18 Figures)
48 Percentage of Yes Votes Discriminated Votes: 1983
49 Percentage of Yes Votes Non-Discriminated Votes: 1983
50 Percentage of Yes Votes Discriminated Votes: 1987
51 Percentage of Yes Votes Non-Discriminated Votes: 1987
52 Percentage of Yes Votes Discriminated Votes: 1993
53 Percentage of Yes Votes Non-Discriminated Votes: 1993
54 Percentage of Yes Votes Discriminated Votes: 1995
55 Percentage of Yes Votes Non-Discriminated Votes: 1995
56 Percentage of Yes Votes Discriminated Votes: 1997
57 Percentage of Yes Votes Non-Discriminated Votes: 1997
58 Percentage of Yes Votes Discriminated Votes: 1999
59 Percentage of Yes Votes Non-Discriminated Votes: 1999
60 Percentage of Yes Votes Discriminated Votes: 2001
61 Percentage of Yes Votes Non-Discriminated Votes: 2001
62 Percentage of Yes Votes Discriminated Votes: 2003
63 Percentage of Yes Votes Non-Discriminated Votes: 2003
64 Percentage of Yes Votes Discriminated Votes: 2005
65 Percentage of Yes Votes Non-Discriminated Votes: 2005
66 APPENDIX II DISTRIBUTION OF THE REPRESENTATIVES' MEAN IDEAL POINTS (AND 95% CI) ON THE LIBERAL-CONSERVATIVE DIMENSION, (9 Figures)
67 Ideal Points (Democrat) Ideal Points (Republican) Representative Texas House of Representatives: 1983
68 Ideal Points (Democrat) Ideal Points (Republican) Representative Texas House of Representatives: 1987
69 Ideal Points (Democrat) Ideal Points (Republican) Representative Texas House of Representatives: 1993
70 Ideal Points (Democrat) Ideal Points (Republican) Representative Texas House of Representatives: 1995
71 Ideal Points (Democrat) Ideal Points (Republican) Representative Texas House of Representatives: 1997
72 Ideal Points (Democrat) Ideal Points (Republican) Representative Texas House of Representatives: 1999
73 Ideal Points (Democrat) Ideal Points (Republican) Representative Texas House of Representatives: 2001
74 Ideal Points (Democrat) Ideal Points (Republican) Representative Texas House of Representatives: 2003
75 Ideal Points (Democrat) Ideal Points (Republican) Representative Texas House of Representatives: 2005
76 APPENDIX III FOUR MODELS OF LEGISLATIVE VOTING BEHAVIOR (LAWRENCE ET AL. 2006, P. 39) (4 Figures)
77 Figure 1. Four Models of Party and Preferences Effects on Voting for the Winning Side. Figure 1A Model 1. Pure Preference [ m-x 1 = m-x 2 ] Percent Voting on Winning Side X m 1 X 2 Policy Preference Figure 1B Model 2. Veto Preference [case of Left President, Right Majority] Percent Voting on Winning Side V l m m V r Policy Preference Figure 1C Model 3. Party Loyalty Inducement Percent Voting on Winning Side majority party minority party 38
78 Policy Preference Figure 1D Model 4. Majority Party Agenda Control [Majority party on Right, minority party on Left] Percent Voting on Winning Side m M Policy Preference 39
79 APPENDIX IV INTRA-PARTY HETEROGENEITY, (1 Figure)
80 INTRA-PARTY AND HOUSE HETEROGENEITY IN THE TEXAS HOUSE OF REPRESENTATIVES STANDARD DEVIATION OF PARTY DELEGATION/HOUSE IDEAL POINTS Democrats Republicans House LEGISLATIVE SESSION YEAR
81 APPENDIX V REPRESENTATIVES' INDIVIDUAL WIN RATES (REVERSE ROLL RATES) AND MEAN IDEAL POINTS ON THE LIBERAL-CONSERVATIVE DIMENSION, (9 Figures)
82 1983 House Reverse Roll Rate Estimated ideal point Liberal-Conservative Rank Dem Mean Rep
83 1987 House Reverse Roll Rate Estimated ideal point Liberal-Conservative Rank Dem Mean Rep
84 1993 House Reverse Roll Rate Estimated ideal point Liberal-Conservative Rank Dem Mean Rep
85 1995 House Reverse Roll Rate Estimated ideal point Liberal-Conservative Rank Dem Mean Rep
86 1997 House Reverse Roll Rate Estimated ideal point Liberal-Conservative Rank Dem Mean Rep
87 1999 House Reverse Roll Rate Estimated ideal point Liberal-Conservative Rank Dem Mean Rep
88 2001 House Reverse Roll Rate Estimated ideal point Liberal-Conservative Rank Dem Mean Rep
89 2003 House Reverse Roll Rate Estimated ideal point Liberal-Conservative Rank Dem Mean Rep
90 2005 House Reverse Roll Rate Estimated ideal point Liberal-Conservative Rank Dem Mean Rep
91 APPENDIX VI DISTRIBUTION OF THE REPRESENTATIVES' MEAN IDEAL POINTS (AND 95% CI) ON THE LIBERAL-CONSERVATIVE DIMENSION, : COMMITTEE CHAIRS VS. RANK-AND-FILE MEMBERS (9 Figures)
92
93
94

95
96
97
98
99
1. The Relationship Between Party Control, Latino CVAP and the Passage of Bills Benefitting Immigrants
 The Ideological and Electoral Determinants of Laws Targeting Undocumented Migrants in the U.S. States Online Appendix In this additional methodological appendix I present some alternative model specifications
Do two parties represent the US? Clustering analysis of US public ideology survey
 Do two parties represent the US? Clustering analysis of US public ideology survey Louisa Lee 1 and Siyu Zhang 2, 3 Advised by: Vicky Chuqiao Yang 1 1 Department of Engineering Sciences and Applied Mathematics,
Political Economics II Spring Lectures 4-5 Part II Partisan Politics and Political Agency. Torsten Persson, IIES
 Lectures 4-5_190213.pdf Political Economics II Spring 2019 Lectures 4-5 Part II Partisan Politics and Political Agency Torsten Persson, IIES 1 Introduction: Partisan Politics Aims continue exploring policy
Research Statement. Jeffrey J. Harden. 2 Dissertation Research: The Dimensions of Representation
 Research Statement Jeffrey J. Harden 1 Introduction My research agenda includes work in both quantitative methodology and American politics. In methodology I am broadly interested in developing and evaluating
Comparing Floor-Dominated and Party-Dominated Explanations of Policy Change in the House of Representatives
 Comparing Floor-Dominated and Party-Dominated Explanations of Policy Change in the House of Representatives Cary R. Covington University of Iowa Andrew A. Bargen University of Iowa We test two explanations
THE HUNT FOR PARTY DISCIPLINE IN CONGRESS #
 THE HUNT FOR PARTY DISCIPLINE IN CONGRESS # Nolan McCarty*, Keith T. Poole**, and Howard Rosenthal*** 2 October 2000 ABSTRACT This paper analyzes party discipline in the House of Representatives between
Amy Tenhouse. Incumbency Surge: Examining the 1996 Margin of Victory for U.S. House Incumbents
 Amy Tenhouse Incumbency Surge: Examining the 1996 Margin of Victory for U.S. House Incumbents In 1996, the American public reelected 357 members to the United States House of Representatives; of those
Chapter Four: Chamber Competitiveness, Political Polarization, and Political Parties
 Chapter Four: Chamber Competitiveness, Political Polarization, and Political Parties Building off of the previous chapter in this dissertation, this chapter investigates the involvement of political parties
Determinants of legislative success in House committees*
 Public Choice 74: 233-243, 1992. 1992 Kluwer Academic Publishers. Printed in the Netherlands. Research note Determinants of legislative success in House committees* SCOTT J. THOMAS BERNARD GROFMAN School
On Measuring Partisanship in Roll Call Voting: The U.S. House of Representatives, *
 1 January 2002 draft Original draft May 2001 On Measuring Partisanship in Roll Call Voting: The U.S. House of Representatives, 1877-1999* by Gary W. Cox Department of Political Science University of California,
Following the Leader: The Impact of Presidential Campaign Visits on Legislative Support for the President's Policy Preferences
 University of Colorado, Boulder CU Scholar Undergraduate Honors Theses Honors Program Spring 2011 Following the Leader: The Impact of Presidential Campaign Visits on Legislative Support for the President's
Segal and Howard also constructed a social liberalism score (see Segal & Howard 1999).
.") APPENDIX A: Ideology Scores for Judicial Appointees For a very long time, a judge s own partisan affiliation 1 has been employed as a useful surrogate of ideology (Segal & Spaeth 1990). The approach treats
APPENDIX A: Ideology Scores for Judicial Appointees For a very long time, a judge s own partisan affiliation 1 has been employed as a useful surrogate of ideology (Segal & Spaeth 1990). The approach treats
The Implications of Using Models of Direct Democracy for Cases of Representative Democracy.
 The Implications of Using Models of Direct Democracy for Cases of Representative Democracy. Robi Ragan June 3, 2008 1 Introduction Representative democracy translates the preferences of the electorate
The Seventeenth Amendment, Senate Ideology, and the Growth of Government
 The Seventeenth Amendment, Senate Ideology, and the Growth of Government Danko Tarabar College of Business and Economics 1601 University Ave, PO BOX 6025 West Virginia University Phone: 681-212-9983 datarabar@mix.wvu.edu
Supplementary Materials for Strategic Abstention in Proportional Representation Systems (Evidence from Multiple Countries)
") Supplementary Materials for Strategic Abstention in Proportional Representation Systems (Evidence from Multiple Countries) Guillem Riambau July 15, 2018 1 1 Construction of variables and descriptive statistics.
Supplementary Materials for Strategic Abstention in Proportional Representation Systems (Evidence from Multiple Countries) Guillem Riambau July 15, 2018 1 1 Construction of variables and descriptive statistics.
UC Davis UC Davis Previously Published Works
 UC Davis UC Davis Previously Published Works Title Constitutional design and 2014 senate election outcomes Permalink https://escholarship.org/uc/item/8kx5k8zk Journal Forum (Germany), 12(4) Authors Highton,
Wisconsin Economic Scorecard
 RESEARCH PAPER> May 2012 Wisconsin Economic Scorecard Analysis: Determinants of Individual Opinion about the State Economy Joseph Cera Researcher Survey Center Manager The Wisconsin Economic Scorecard
Are Congressional Leaders Middlepersons or Extremists? Yes.
 Stephen Jessee The University of Texas at Austin Neil Malhotra University of Pennsylvania Are Congressional Leaders Middlepersons or Extremists? Yes. Influential theories of legislative organization predict
The California Primary and Redistricting
 The California Primary and Redistricting This study analyzes what is the important impact of changes in the primary voting rules after a Congressional and Legislative Redistricting. Under a citizen s committee,
Appendices for Elections and the Regression-Discontinuity Design: Lessons from Close U.S. House Races,
 Appendices for Elections and the Regression-Discontinuity Design: Lessons from Close U.S. House Races, 1942 2008 Devin M. Caughey Jasjeet S. Sekhon 7/20/2011 (10:34) Ph.D. candidate, Travers Department
Restrictive Rules and Conditional Party Government: A Computational Model
 Restrictive Rules and Conditional Party Government: A Computational Model Damon M. Cann Dept. of Political Science Utah State University Jeremy C. Pope Dept. of Political Science Center for the Study of
When Loyalty Is Tested
 When Loyalty Is Tested Do Party Leaders Use Committee Assignments as Rewards? Nicole Asmussen Vanderbilt University Adam Ramey New York University Abu Dhabi 8/24/2011 Theories of parties in Congress contend
1 Electoral Competition under Certainty
 1 Electoral Competition under Certainty We begin with models of electoral competition. This chapter explores electoral competition when voting behavior is deterministic; the following chapter considers
Learning and Visualizing Political Issues from Voting Records Erik Goldman, Evan Cox, Mikhail Kerzhner. Abstract
 Learning and Visualizing Political Issues from Voting Records Erik Goldman, Evan Cox, Mikhail Kerzhner Abstract For our project, we analyze data from US Congress voting records, a dataset that consists
Are Congressional Leaders Middlepersons or Extremists? Yes.
 Are Congressional Leaders Middlepersons or Extremists? Yes. Stephen Jessee Department of Government University of Texas 1 University Station A1800 Austin, TX 78712 (512) 232-7282 sjessee@mail.utexas.edu
Supporting Information for Competing Gridlock Models and Status Quo Policies
 for Competing Gridlock Models and Status Quo Policies Jonathan Woon University of Pittsburgh Ian P. Cook University of Pittsburgh January 15, 2015 Extended Discussion of Competing Models Spatial models
Ambition and Party Loyalty in the U.S. Senate 1
 Ambition and Party Loyalty in the U.S. Senate 1 Sarah A. Treul Department of Political Science University of Minnesota Minneapolis, MN 55455 streul@umn.edu April 3, 2007 1 Paper originally prepared for
Party, Policy, and the Ambition to Run for Higher Office
 JOHN H. ALDRICH Duke University DANIELLE M. THOMSEN Syracuse University Party, Policy, and the Ambition to Run for Higher Office This article examines why some state legislators run for Congress and others
Can Ideal Point Estimates be Used as Explanatory Variables?
 Can Ideal Point Estimates be Used as Explanatory Variables? Andrew D. Martin Washington University admartin@wustl.edu Kevin M. Quinn Harvard University kevin quinn@harvard.edu October 8, 2005 1 Introduction
Partisan Agenda Control and the Dimensionality of Congress
 Partisan Agenda Control and the Dimensionality of Congress Keith L. Dougherty Associate Professor University of Georgia dougherk@uga.edu Michael S. Lynch Assistant Professor University of Kansas mlynch@ku.edu
Transnational Dimensions of Civil War
 Transnational Dimensions of Civil War Kristian Skrede Gleditsch University of California, San Diego & Centre for the Study of Civil War, International Peace Research Institute, Oslo See http://weber.ucsd.edu/
The Changing Relative Power of Party Leaders in Congress
 The Changing Relative Power of Party Leaders in Congress Pamela Ban Harvard University Daniel J. Moskowitz Harvard University James M. Snyder, Jr. Harvard University and NBER February 12, 2016 Abstract
Res Publica 29. Literature Review
 Res Publica 29 Greg Crowe and Elizabeth Ann Eberspacher Partisanship and Constituency Influences on Congressional Roll-Call Voting Behavior in the US House This research examines the factors that influence
Congressional Gridlock: The Effects of the Master Lever
 Congressional Gridlock: The Effects of the Master Lever Olga Gorelkina Max Planck Institute, Bonn Ioanna Grypari Max Planck Institute, Bonn Preliminary & Incomplete February 11, 2015 Abstract This paper
Designing Weighted Voting Games to Proportionality
 Designing Weighted Voting Games to Proportionality In the analysis of weighted voting a scheme may be constructed which apportions at least one vote, per-representative units. The numbers of weighted votes
APPLICATION: THE SUPREME COURT
 APPLICATION: THE SUPREME COURT 1 Extra Credit Google search: URL should be: Choose Initial login for all programs Session name: kld1 You will earn extra credit points on HW4 equivalent to the dollar amounts
Components of party polarization in the US House of Representatives
 Article Components of party polarization in the US House of Representatives Journal of Theoretical Politics 1 27 ÓThe Author(s) 215 Reprints and permissions: sagepub.co.uk/journalspermissions.nav DOI:
AMERICAN JOURNAL OF UNDERGRADUATE RESEARCH VOL. 3 NO. 4 (2005)
") , Partisanship and the Post Bounce: A MemoryBased Model of Post Presidential Candidate Evaluations Part II Empirical Results Justin Grimmer Department of Mathematics and Computer Science Wabash College
, Partisanship and the Post Bounce: A MemoryBased Model of Post Presidential Candidate Evaluations Part II Empirical Results Justin Grimmer Department of Mathematics and Computer Science Wabash College
national congresses and show the results from a number of alternate model specifications for
 Appendix In this Appendix, we explain how we processed and analyzed the speeches at parties national congresses and show the results from a number of alternate model specifications for the analysis presented
Distorting Democracy: How Gerrymandering Skews the Composition of the House of Representatives
 1 Celia Heudebourg Minju Kim Corey McGinnis MATH 155: Final Project Distorting Democracy: How Gerrymandering Skews the Composition of the House of Representatives Introduction Do you think your vote mattered
Immigrant Legalization
 Technical Appendices Immigrant Legalization Assessing the Labor Market Effects Laura Hill Magnus Lofstrom Joseph Hayes Contents Appendix A. Data from the 2003 New Immigrant Survey Appendix B. Measuring
A positive correlation between turnout and plurality does not refute the rational voter model
 Quality & Quantity 26: 85-93, 1992. 85 O 1992 Kluwer Academic Publishers. Printed in the Netherlands. Note A positive correlation between turnout and plurality does not refute the rational voter model
Partisan Influence in Congress and Institutional Change
 Partisan Influence in Congress and Institutional Change Scott de Marchi Duke University demarchi@duke.edu Michael Ensley Indiana University ensley@indiana.edu Michael Tofias UW-Milwaukee tofias@uwm.edu
Legislative Pruning: Committee Chair Elections and Majority Party Agenda Setting
 Legislative Pruning: Committee Chair Elections and Majority Party Agenda Setting Scott M. Guenther 1 Legislative parties are commonly thought of as coalitions of like-minded, reelection seeking politicians.
Comparing the Data Sets
 Comparing the Data Sets Online Appendix to Accompany "Rival Strategies of Validation: Tools for Evaluating Measures of Democracy" Jason Seawright and David Collier Comparative Political Studies 47, No.
Federal Primary Election Runoffs and Voter Turnout Decline,
 Federal Primary Election Runoffs and Voter Turnout Decline, 1994-2012 July 2013 Summary of Facts and Findings Near-Universal Decline in Turnout: Of 171 regularly scheduled primary runoffs in U.S House
Can Politicians Police Themselves? Natural Experimental Evidence from Brazil s Audit Courts Supplementary Appendix
 Can Politicians Police Themselves? Natural Experimental Evidence from Brazil s Audit Courts Supplementary Appendix F. Daniel Hidalgo MIT Júlio Canello IESP Renato Lima-de-Oliveira MIT December 16, 215
UC-BERKELEY. Center on Institutions and Governance Working Paper No. 22. Interval Properties of Ideal Point Estimators
 UC-BERKELEY Center on Institutions and Governance Working Paper No. 22 Interval Properties of Ideal Point Estimators Royce Carroll and Keith T. Poole Institute of Governmental Studies University of California,
UNDERSTANDING THE COST OF ENACTING LEGISLATION: LEGISLATIVE EFFICIENCY AND THE IMPACT OF SESSION LENGTH
 UNDERSTANDING THE COST OF ENACTING LEGISLATION: LEGISLATIVE EFFICIENCY AND THE IMPACT OF SESSION LENGTH A Thesis submitted to the Faculty of the Graduate School of Arts and Sciences of Georgetown University
Congruence in Political Parties
 Descriptive Representation of Women and Ideological Congruence in Political Parties Georgia Kernell Northwestern University gkernell@northwestern.edu June 15, 2011 Abstract This paper examines the relationship
Coalition Building and Overcoming Legislative Gridlock in Foreign Policy,
 PRESIDENTIAL Peake / COALITION STUDIES BUILDING QUARTERLY AND OVERCOMING / March 2002 GRIDLOCK Coalition Building and Overcoming Legislative Gridlock in Foreign Policy, 1947-98 JEFFREY S. PEAKE Bowling
Table XX presents the corrected results of the first regression model reported in Table
 Correction to Tables 2.2 and A.4 Submitted by Robert L Mermer II May 4, 2016 Table XX presents the corrected results of the first regression model reported in Table A.4 of the online appendix (the left
Chapter 6 Online Appendix. general these issues do not cause significant problems for our analysis in this chapter. One
 Chapter 6 Online Appendix Potential shortcomings of SF-ratio analysis Using SF-ratios to understand strategic behavior is not without potential problems, but in general these issues do not cause significant
Combining national and constituency polling for forecasting
 Combining national and constituency polling for forecasting Chris Hanretty, Ben Lauderdale, Nick Vivyan Abstract We describe a method for forecasting British general elections by combining national and
Appendix to Non-Parametric Unfolding of Binary Choice Data Keith T. Poole Graduate School of Industrial Administration Carnegie-Mellon University
 Appendix to Non-Parametric Unfolding of Binary Choice Data Keith T. Poole Graduate School of Industrial Administration Carnegie-Mellon University 7 July 1999 This appendix is a supplement to Non-Parametric
Do Individual Heterogeneity and Spatial Correlation Matter?
 Do Individual Heterogeneity and Spatial Correlation Matter? An Innovative Approach to the Characterisation of the European Political Space. Giovanna Iannantuoni, Elena Manzoni and Francesca Rossi EXTENDED
Vote Switchers and Party Influence in the U.S. House. Garry Young George Washington University
 Vote Switchers and Party Influence in the U.S. House Garry Young George Washington University YoungG@gwu.edu Vicky Wilkins University of Georgia vwilkins@uga.edu Thanks to Keith Dougherty, Valerie Heitshusen,
Dimensionality in Congressional Voting: The Role of Issues and Agendas. Thomas A. Ringenberg
 Dimensionality in Congressional Voting: The Role of Issues and Agendas By Thomas A. Ringenberg Submitted to the graduate degree program in Political Science and the Graduate Faculty of the University of
Over the last 50 years, political scientists and
 Measuring Policy Content on the U.S. Supreme Court Kevin T. McGuire Georg Vanberg Charles E. Smith, Jr. Gregory A. Caldeira University of North Carolina at Chapel Hill University of North Carolina at Chapel
Corruption and business procedures: an empirical investigation
 Corruption and business procedures: an empirical investigation S. Roy*, Department of Economics, High Point University, High Point, NC - 27262, USA. Email: sroy@highpoint.edu Abstract We implement OLS,
Guns and Butter in U.S. Presidential Elections
 Guns and Butter in U.S. Presidential Elections by Stephen E. Haynes and Joe A. Stone September 20, 2004 Working Paper No. 91 Department of Economics, University of Oregon Abstract: Previous models of the
What is The Probability Your Vote will Make a Difference?
 Berkeley Law From the SelectedWorks of Aaron Edlin 2009 What is The Probability Your Vote will Make a Difference? Andrew Gelman, Columbia University Nate Silver Aaron S. Edlin, University of California,
Working Paper: The Effect of Electronic Voting Machines on Change in Support for Bush in the 2004 Florida Elections
 Working Paper: The Effect of Electronic Voting Machines on Change in Support for Bush in the 2004 Florida Elections Michael Hout, Laura Mangels, Jennifer Carlson, Rachel Best With the assistance of the
Simulating Electoral College Results using Ranked Choice Voting if a Strong Third Party Candidate were in the Election Race
 Simulating Electoral College Results using Ranked Choice Voting if a Strong Third Party Candidate were in the Election Race Michele L. Joyner and Nicholas J. Joyner Department of Mathematics & Statistics
Median voter theorem - continuous choice
 Median voter theorem - continuous choice In most economic applications voters are asked to make a non-discrete choice - e.g. choosing taxes. In these applications the condition of single-peakedness is
Who Consents? A Theoretical and Empirical Examination of Pivotal Senators in Judicial Selection
 Who Consents? A Theoretical and Empirical Examination of Pivotal Senators in Judicial Selection David M. Primo University of Rochester david.primo@rochester.edu Sarah A. Binder The Brookings Institution
The Causes of Wage Differentials between Immigrant and Native Physicians
 The Causes of Wage Differentials between Immigrant and Native Physicians I. Introduction Current projections, as indicated by the 2000 Census, suggest that racial and ethnic minorities will outnumber non-hispanic
Differences in remittances from US and Spanish migrants in Colombia. Abstract
 Differences in remittances from US and Spanish migrants in Colombia François-Charles Wolff LEN, University of Nantes Liliana Ortiz Bello LEN, University of Nantes Abstract Using data collected among exchange
Estimating Candidates Political Orientation in a Polarized Congress
 Estimating Candidates Political Orientation in a Polarized Congress Chris Tausanovitch Department of Political Science UCLA Christopher Warshaw Department of Political Science Massachusetts Institute of
Party Influence in a Bicameral Setting: U.S. Appropriations from
 Party Influence in a Bicameral Setting: U.S. Appropriations from 1880-1947 June 24 2013 Mark Owens Bicameralism & Policy Outcomes 1. How valuable is bicameralism to the lawmaking process? 2. How different
Forecasting the 2018 Midterm Election using National Polls and District Information
 Forecasting the 2018 Midterm Election using National Polls and District Information Joseph Bafumi, Dartmouth College Robert S. Erikson, Columbia University Christopher Wlezien, University of Texas at Austin
Part I: Univariate Spatial Model (20%)
") 17.251 Fall 2012 Midterm Exam answers Directions: Do the following problem. Part I: Univariate Spatial Model (20%) The nation is faced with a situation in which, if legislation isn t passed, the level
17.251 Fall 2012 Midterm Exam answers Directions: Do the following problem. Part I: Univariate Spatial Model (20%) The nation is faced with a situation in which, if legislation isn t passed, the level
Strategic Partisanship: Party Priorities, Agenda Control and the Decline of Bipartisan Cooperation in the House
 Strategic Partisanship: Party Priorities, Agenda Control and the Decline of Bipartisan Cooperation in the House Laurel Harbridge Assistant Professor, Department of Political Science Faculty Fellow, Institute
Powersharing, Protection, and Peace. Scott Gates, Benjamin A. T. Graham, Yonatan Lupu Håvard Strand, Kaare W. Strøm. September 17, 2015
 Powersharing, Protection, and Peace Scott Gates, Benjamin A. T. Graham, Yonatan Lupu Håvard Strand, Kaare W. Strøm September 17, 2015 Corresponding Author: Yonatan Lupu, Department of Political Science,
Separated Powers in the United States: The Ideology of Agencies, Presidents, and Congress
 Separated Powers in the United States: The Ideology of Agencies, Presidents, and Congress Joshua D. Clinton, Anthony Bertelli, Christian Grose, David E. Lewis, and David C. Nixon Abstract Democratic politics
Congressional Agenda Control and the Decline of Bipartisan Cooperation
 Congressional Agenda Control and the Decline of Bipartisan Cooperation Laurel Harbridge Northwestern University College Fellow, Department of Political Science l-harbridge@northwestern.edu Electoral incentives
Parties and Agenda Setting in the Senate,
 Parties and Agenda Setting in the Senate, 1973 1998 Gregory Koger Assistant Professor University of Miami 5250 University Drive Jenkins Building, Room 314 Coral Gables, FL 33146 6534 gregory.koger@miami.edu
Congressional Agenda Control and the Decline of Bipartisan Cooperation
 Congressional Agenda Control and the Decline of Bipartisan Cooperation Laurel Harbridge Assistant Professor, Department of Political Science Faculty Fellow, Institute for Policy Research Northwestern University
A Not So Divided America Is the public as polarized as Congress, or are red and blue districts pretty much the same? Conducted by
 Is the public as polarized as Congress, or are red and blue districts pretty much the same? Conducted by A Joint Program of the Center on Policy Attitudes and the School of Public Policy at the University
Cross-District Variation in Split-Ticket Voting
 Cross-District Variation in Split-Ticket Voting Daniel J. Lee Robert Lupton Department of Political Science Michigan State University January 10, 2014 Abstract We test hypotheses on split-ticket voting
The Speaker s Discretion: Conference Committee Appointments from the 97 th -106 th Congress
 The Speaker s Discretion: Conference Committee Appointments from the 97 th -106 th Congress Jeff Lazarus Department of Political Science University of California, San Diego jlazarus@weber.ucsd.edu Nathan
Chapter 12: Congress. American Democracy Now, 4/e
 Chapter 12: Congress American Democracy Now, 4/e Congress Where Do You Stand? How would you rate the overall performance of Congress today? a. Favorably b. Unfavorably c. Neither favorably nor unfavorably
Supporting Information for Signaling and Counter-Signaling in the Judicial Hierarchy: An Empirical Analysis of En Banc Review
 Supporting Information for Signaling and Counter-Signaling in the Judicial Hierarchy: An Empirical Analysis of En Banc Review In this appendix, we: explain our case selection procedures; Deborah Beim Alexander
Many theories and hypotheses in political science
 (How) Can We Estimate the Ideology of Citizens and Political Elites on the Same Scale? Stephen Jessee University of Texas at Austin Abstract: Estimating the ideological positions of political elites on
Online Appendix for Redistricting and the Causal Impact of Race on Voter Turnout
 Online Appendix for Redistricting and the Causal Impact of Race on Voter Turnout Bernard L. Fraga Contents Appendix A Details of Estimation Strategy 1 A.1 Hypotheses.....................................
APPLICATION: PIVOTAL POLITICS
 APPLICATION: PIVOTAL POLITICS 1 A. Goals Pivotal Politics 1. Want to apply game theory to the legislative process to determine: 1. which outcomes are in SPE, and 2. which status quos would not change in
A REPLICATION OF THE POLITICAL DETERMINANTS OF FEDERAL EXPENDITURE AT THE STATE LEVEL (PUBLIC CHOICE, 2005) Stratford Douglas* and W.
 Stratford Douglas* and W.") A REPLICATION OF THE POLITICAL DETERMINANTS OF FEDERAL EXPENDITURE AT THE STATE LEVEL (PUBLIC CHOICE, 2005) by Stratford Douglas* and W. Robert Reed Revised, 26 December 2013 * Stratford Douglas, Department
A REPLICATION OF THE POLITICAL DETERMINANTS OF FEDERAL EXPENDITURE AT THE STATE LEVEL (PUBLIC CHOICE, 2005) by Stratford Douglas* and W. Robert Reed Revised, 26 December 2013 * Stratford Douglas, Department
Electoral Systems and Judicial Review in Developing Countries*
 Electoral Systems and Judicial Review in Developing Countries* Ernani Carvalho Universidade Federal de Pernambuco, Brazil Leon Victor de Queiroz Barbosa Universidade Federal de Campina Grande, Brazil (Yadav,
THE WORKMEN S CIRCLE SURVEY OF AMERICAN JEWS. Jews, Economic Justice & the Vote in Steven M. Cohen and Samuel Abrams
 THE WORKMEN S CIRCLE SURVEY OF AMERICAN JEWS Jews, Economic Justice & the Vote in 2012 Steven M. Cohen and Samuel Abrams 1/4/2013 2 Overview Economic justice concerns were the critical consideration dividing
Examining the Influences over Roll Call Voting in Multiple Issue Areas: A Comparative U.S. State Analysis
 University of Massachusetts at Dartmouth From the SelectedWorks of Shannon Jenkins March, 2010 Examining the Influences over Roll Call Voting in Multiple Issue Areas: A Comparative U.S. State Analysis
Introduction to Path Analysis: Multivariate Regression
 Introduction to Path Analysis: Multivariate Regression EPSY 905: Multivariate Analysis Spring 2016 Lecture #7 March 9, 2016 EPSY 905: Multivariate Regression via Path Analysis Today s Lecture Multivariate
Gender preference and age at arrival among Asian immigrant women to the US
 Gender preference and age at arrival among Asian immigrant women to the US Ben Ost a and Eva Dziadula b a Department of Economics, University of Illinois at Chicago, 601 South Morgan UH718 M/C144 Chicago,
Partisan Nation: The Rise of Affective Partisan Polarization in the American Electorate
 Partisan Nation: The Rise of Affective Partisan Polarization in the American Electorate Alan I. Abramowitz Department of Political Science Emory University Abstract Partisan conflict has reached new heights
Analyzing the Legislative Productivity of Congress During the Obama Administration
 Western Michigan University ScholarWorks at WMU Honors Theses Lee Honors College 12-5-2017 Analyzing the Legislative Productivity of Congress During the Obama Administration Zachary Hunkins Western Michigan
The Case of the Disappearing Bias: A 2014 Update to the Gerrymandering or Geography Debate
 The Case of the Disappearing Bias: A 2014 Update to the Gerrymandering or Geography Debate Nicholas Goedert Lafayette College goedertn@lafayette.edu May, 2015 ABSTRACT: This note observes that the pro-republican
Ohio State University
 Fake News Did Have a Significant Impact on the Vote in the 2016 Election: Original Full-Length Version with Methodological Appendix By Richard Gunther, Paul A. Beck, and Erik C. Nisbet Ohio State University
The Texas Legislature Part III. How can you look at the Texas Legislature and still believe in intelligent design? Kinky Friedman
 The Texas Legislature Part III How can you look at the Texas Legislature and still believe in intelligent design? Kinky Friedman Texas Legislative Process Texas Legislative Process The Texas Constitution
Poverty Reduction and Economic Growth: The Asian Experience Peter Warr
 Poverty Reduction and Economic Growth: The Asian Experience Peter Warr Abstract. The Asian experience of poverty reduction has varied widely. Over recent decades the economies of East and Southeast Asia
Vote Compass Methodology
 Vote Compass Methodology 1 Introduction Vote Compass is a civic engagement application developed by the team of social and data scientists from Vox Pop Labs. Its objective is to promote electoral literacy
Incumbency Advantages in the Canadian Parliament
 Incumbency Advantages in the Canadian Parliament Chad Kendall Department of Economics University of British Columbia Marie Rekkas* Department of Economics Simon Fraser University mrekkas@sfu.ca 778-782-6793