Californians. their government. september in collaboration with The James Irvine Foundation
|
|
|
- Logan Logan
- 5 years ago
- Views:
Transcription

1 september 2008 Californians & their government in collaboration with The James Irvine Foundation Mark Baldassare Dean Bonner Jennifer Paluch Sonja Petek
2 The Public Policy Institute of California is dedicated to informing and improving public policy in California through independent, objective, nonpartisan research on major economic, social, and political issues. The institute s goal is to raise public awareness and to give elected representatives and other decisionmakers a more informed basis for developing policies and programs. The institute s research focuses on the underlying forces shaping California s future, cutting across a wide range of public policy concerns, including economic development, education, environment and resources, governance, population, public finance, and social and health policy. PPIC is a private, nonprofit organization. It does not take or support positions on any ballot measures or on any local, state, or federal legislation, nor does it endorse, support, or oppose any political parties or candidates for public office. PPIC was established in 1994 with an endowment from William R. Hewlett. Mark Baldassare is President and Chief Executive Officer of PPIC. Thomas C. Sutton is Chair of the Board of Directors. PUBLIC POLICY INSTITUTE OF CALIFORNIA 500 Washington Street, Suite 600 San Francisco, California phone: fax: PPIC Sacramento Center Senator Office Building 1121 L Street, Suite 801 Sacramento, California phone: fax: survey@ppic.org
3 TABLE OF CONTENTS About the Survey 1 Press Release 3 November 2008 Election 7 State and National Issues 15 Regional Map 24 Methodology 25 Questionnaire and Results 27
4
5 ABOUT THE SURVEY The PPIC Statewide Survey provides policymakers, the media, and the general public with objective, advocacy-free information on the perceptions, opinions, and public policy preferences of California residents. Inaugurated in April 1998, this is the 90 th PPIC Statewide Survey in a series that has generated a database that includes the responses of more than 192,000 Californians. This survey is the 31 st in the Californians and Their Government series, which periodically examines the social, economic, and political trends that influence public policy preferences and ballot choices. The series is currently supported with funding from The James Irvine Foundation. This survey seeks to raise public awareness, inform decisionmakers, and stimulate public discussion about state and national issues and the November general election. The context for this survey includes a presidential campaign, a downturn in the national economy, and the state budget standoff. Through analysis of likely voters, we examine issues in the fall general election, including the presidential race and three of the state propositions on the November ballot. The survey also examines Californians opinions of state and national issues, including their overall outlook on the state and economic conditions, perceptions of elected officials who represent them in Sacramento and Washington, perceptions and policy preferences regarding the state budget, general attitudes towards the citizens initiative process, attitudes toward the workings of the twoparty system, and overall importance of and enthusiasm about the 2008 presidential election. This report presents the responses of 2,002 California adult residents, including 1,157 likely voters, on these specific topics: The November election, including preferences in the presidential election and satisfaction with the choice of candidates; importance of candidates debate performances and preferences about what issues should be included in the debates; candidate preferences for handling specific policy issues; attention to news about the presidential candidates; support for and perceived importance of Proposition 4 (parental notification of a minor child s abortion) and Proposition 8 (eliminating same-sex couples right to marry); and support for Proposition 11 (redistricting reform) and perceptions of the need for changes in the redistricting process. State and national issues, including the current direction of the state and future economic outlook, approval ratings for Governor Schwarzenegger, the California Legislature, and respondents own state legislative representatives; approval ratings for President Bush, the U.S. Congress, Senators Barbara Boxer and Dianne Feinstein, House Speaker Nancy Pelosi, and respondents own congressional representatives; the general direction and economic outlook for the state; attitudes toward the state budget; perceptions of the citizens initiative process; and attitudes towards the major political parties and the presidential election. The extent to which Californians based on their political party affiliation, region of residence, race/ethnicity, and other demographics may differ with regard to perceptions, attitudes, and preferences involving the November election ballot and state and national issues. Copies of this report may be ordered online ( or by phone ( ). For questions about the survey, please contact survey@ppic.org. View our searchable PPIC Statewide Survey database online at 1
6
7 PRESS RELEASE Para ver este comunicado de prensa en español, por favor visite nuestra página de internet: PPIC STATEWIDE SURVEY: CALIFORNIANS AND THEIR GOVERNMENT Obama Holds 10-Point Lead in California, But Debates Loom Large ELECTORATE ENGAGED, WORRIED ABOUT ECONOMY PALIN ENERGIZES GOP BUT FAILS TO CHANGE THE RACE SAN FRANCISCO, California, September 24, 2008 California s likely voters prefer the Democratic ticket of Barack Obama and Joseph Biden to Republican contenders John McCain and Sarah Palin by 10 points, but they ll be watching closely to see how the candidates perform in a series of televised debates before marking their ballots. Eight in 10 say the debates will be very important (38%) or somewhat important (41%) in deciding who gets their votes, according to a statewide survey released today by the Public Policy Institute of California (PPIC) with funding from The James Irvine Foundation. What do they want to hear the candidates debate? The economy leads the list. Despite a month of high-profile activity that included the party conventions and selection of vice presidential candidates, the Democratic contenders lead (50% to 40%) over the Republicans among California s likely voters is nearly identical to what it was in August (48% to 39%). Widely viewed as a move to win over women voters, McCain s addition of Palin to the GOP ticket has shifted few votes to the Republicans. Female likely voters, who supported the Democratic ticket by 21 points last month (53% to 32%), support it by 20 points today (56% to 36%). Democrats and Republicans support their respective party s tickets in overwhelming numbers, while independents back Obama-Biden over McCain-Palin, 53 percent to 35 percent. Latino likely voters favor Obama-Biden (57% to 30%), but their support for the Democratic ticket has dropped substantially since August (71% to 16%). As the campaign enters its final weeks, a majority of California s likely voters (65%) say they are more enthusiastic than usual about voting. They are happier with their choices than they were a month ago (64% today, 48% in August), with Republicans registering the sharpest increase in satisfaction (67% today, 35% in August). Democrats satisfaction is also higher (74% today, 68% in August). The selection of Governor Palin dramatically increased the enthusiasm of California Republicans for their ticket, but it does not look like it will change many votes, says Mark Baldassare, PPIC president and CEO. Californians are loyal to their parties in this race, but they still hope to learn more from the debates. They are worried about the economy, upset with leaders at all levels of government, and want to hear the presidential candidates plans to change the course. VOTERS RANK ECONOMY AS TOP ISSUE FOR DEBATES With Wall Street in turmoil, likely voters across political and demographic groups most frequently name the economy as the issue they most want to hear the candidates debate. Four in 10 (40%) mention the economy, followed by the war in Iraq (12%), immigration (7%), and health care (6%). When asked which candidate would do a better job handling key issues Likely voters prefer Obama to McCain on the economy (53% to 37%), health care (57% to 29%), and energy policy (51% to 38%). They prefer McCain to Obama on foreign policy (51% to 43%). 3
8 Californians and Their Government They are more divided on who would better handle the war in Iraq (49% Obama, 44% McCain) and immigration (42% Obama, 40% McCain). Views on these issues are divided along partisan lines, with most voters believing their party s candidate is the one for the job. Among independent likely voters A majority prefer Obama to McCain on health care (59% to 25%), the economy (50% to 39%), and energy policy (55% to 35%). They prefer McCain on foreign policy (53% to 36%). They are divided over who they would prefer to handle the war in Iraq (48% Obama, 46% McCain) and immigration (40% Obama, 39% McCain). Regardless of their partisan leanings, Californians view the presidential election as crucial for the course of the nation. Most likely voters (79%) say that in making progress on important issues, it really matters who wins. With stakes this high in voters minds, it s no surprise that nine in 10 are following news of the campaign very closely (52%) or somewhat closely (39%). STATE BAN ON GAY MARRIAGE LOSING, RESTRICTIONS ON TEEN ABORTION WINNING When it comes to the state ballot, a majority of likely voters oppose Proposition 8 (55% no, 41% yes), the constitutional amendment that would eliminate same-sex marriage in California. The overall percentages have held steady since August (54% no, 40% yes), but there have been shifts among voter groups. More Democrats plan to vote no on the measure (71% today, 66% in August), and more independents plan to vote yes (42% today, 36% in August). Eight in 10 likely voters say the outcome of this measure is very important (54%) or somewhat important (26%) to them, with those who plan to vote yes (62%) more likely than those voting against it (51%) to say the results are very important. Almost half of likely voters back Proposition 4 (48% yes, 41% no), the constitutional amendment that would require a parent to be notified at least 48 hours before a minor child has an abortion. They were more closely divided in August (47% yes, 44% no). Voters defeated similar measures in 2005 and Proposition 11, which would take the authority to draw legislative district lines from elected officials and give it to a commission of registered voters, has failed to rally a majority in favor or against it. Likely voters are as divided (38% yes, 33% no, 29% undecided) as they were in August (39% yes, 36% no, 25% undecided). Support for the measure has increased among Democrats by 5 points and dropped among independents by 10 points. However, divisions on this measure do not indicate support for the current redistricting process: About seven in 10 likely voters (69%) think it needs to be changed. 4 PPIC Statewide Survey
9 Press Release IN WAKE OF BUDGET STANDOFF, SUPPORT GROWS TO LOWER TWO-THIRDS THRESHOLD At the time of this survey, the state budget standoff had entered its fourth month, and Californians frustration with the process was reflected in their changing views about structural reform. Three in four (76%) say major changes are needed in the budget process an increase of 11 points since May, when the governor released his revised budget. Nearly half (49%) think it would be a good idea to lower the threshold for passing the budget from two-thirds to a 55 percent majority of the state legislature. This proposal, which was defeated at the polls in 2004, is opposed by only 37 percent of the state s residents. A year ago, nearly half (46%) thought this change was a bad idea, and only 44 percent thought it was a good idea. A majority (62%) say it would be a good idea to strictly limit the amount of state spending increases allowed each year, while less than a third (31%) consider it a bad idea. APPROVAL RATINGS FOR STATE LEGISLATURE, BUSH SINK TO NEW LOWS Against the backdrop of a worsening economy and the longest budget impasse in state history, Californians are feeling grim about the future and dissatisfied with many of their state and national leaders. A record-high 44 percent of adults say that jobs and the economy are the top issues facing the state. This is true across all party and demographic groups, although Democrats (47%) and independents (44%) are more likely than Republicans (36%) to hold this view. Nearly seven in 10 Californians (68%) expect bad times financially in the year ahead. About half say the current housing situation in California will hurt their finances a great deal (31%) or somewhat (21%). The perception that the state is going in the wrong direction is widely held (68%). While this negative view has changed little since last month, it has grown by 18 points in the last year. Californians are pessimistic about their elected leaders ability to handle the challenges: State legislature gets record low rating: Only one in five Californians (21%) approve of the job the legislature is doing, a decline of 5 points since last month. Constituents give their own legislators low marks: Only one in three residents (34%) approve of the job their own state senator and assembly member are doing, an 8-point drop since March and a 7-point drop from a year ago. Governor fares slightly better: Governor Arnold Schwarzenegger s 38 percent approval rating has held steady from last month but is still 12 points lower than a year ago. President Bush s approval drops to new low: Among Californians, the president s approval rating is 23 percent, a slightly more negative assessment than he received in a recent CBS News/New York Times national poll (27% approval). Congress job approval rating slips: Congress 29 percent approval rating is about the same as last month, but 4 points lower than in March. Congressional representatives rated higher: The state s residents give higher approval ratings to their own Congressional representative (49%) and to Senator Dianne Feinstein (48%), Senator Barbara Boxer (44%), and House Speaker Nancy Pelosi (40%). September
10 Californians and Their Government MORE KEY FINDINGS: How Californians would have balanced the budget Page 20 As they have since January, a plurality of residents (43%) favor a mix of spending cuts and tax increases, while fewer (36%) favor balancing the budget mainly through cuts and fewer still (7%) prefer tax hikes alone or borrowing money and running a deficit (5%). But they are deeply divided along party lines in their preferences. Residents conflicted over the initiative process Page 21 As they get ready to vote on a state ballot that includes 12 propositions 10 of them citizens initiatives Californians say the process is flawed and that there are too many initiatives on the ballot and that they re too complicated. However, 38 percent say initiatives should be the guiding force in determining policy, while 32 percent choose the legislature and 20 percent prefer the governor. Many say a third political party is needed Page 22 Despite their views that there are important differences between the two major parties, a slim majority of Californians (52%) say that the nation needs a third political party. Republicans are much less likely than they were four years ago to say that the two major parties are doing an adequate job. ABOUT THE SURVEY This survey is the 31 st in the Californians and Their Government series and is supported with funding from The James Irvine Foundation. It seeks to raise public awareness, inform decisionmakers, and stimulate public discussion on state and national issues and the November general election. This is the 90 th PPIC Statewide Survey in a series that has generated a database that includes the responses of more than 192,000 Californians. Findings are based on a telephone survey of 2,002 California adult residents interviewed from September 9 16, Interviews were conducted in English or Spanish. The sampling error for the total sample is +/- 2% and for the 1,157 likely voters is +/- 3%. For more information on methodology, see page 25. Mark Baldassare is president and CEO of PPIC, where he holds the Arjay and Frances Fearing Miller Chair in Public Policy. He is founder of the PPIC Statewide Survey, which he has directed since PPIC is a private, nonprofit organization dedicated to informing and improving public policy in California through independent, objective, nonpartisan research on major economic, social, and political issues. The institute was established in 1994 with an endowment from William R. Hewlett. PPIC does not take or support positions on any ballot measure or on any local, state, or federal legislation, nor does it endorse, support, or oppose any political parties or candidates for public office. This report will appear on PPIC s website ( after 10 p.m. PDT on September 24. ### 6 PPIC Statewide Survey
11 NOVEMBER 2008 ELECTION KEY FINDINGS Among California s likely voters, the Democratic ticket of Barack Obama and Joe Biden leads the Republican ticket of John McCain and Sarah Palin (50% to 40%) in the presidential race a lead similar to last month, before running mates were chosen. Nearly two in three likely voters are satisfied with their choice of candidates in the presidential election, up sharply from last month, with independents the least satisfied with their choices. (page 8) Sixty-five percent of likely voters say they are more enthusiastic than usual about voting this year. Eight in 10 likely voters say candidates debate performances are important in deciding their vote in the presidential election (38% very, 41% somewhat). Among likely voters, the top debate issue is the economy. (pages 9, 10) Regardless of their choice for president, likely voters think Obama would do a better job of handling health care, jobs and the economy, and energy policy, but that McCain would better handle foreign policy. Likely voters are divided over who they think would do a better job handling immigration and the situation in Iraq. (pages 10, 11) Likely voters are more inclined to vote yes than no on Proposition 4, a constitutional amendment requiring parental notification before termination of a minor s pregnancy (48% yes, 41% no, 11% don t know). More would vote no than yes on Proposition 8, a constitutional amendment that would ban same-sex marriage (41% yes, 55% no, 4% don t know). Likely voters are divided, with many undecided, on Proposition 11, which would give redistricting authority to a citizens commission (38% yes, 33% no, 29% don t know). (pages 12 14) Presidential Election Percent likely voters Mar May Jul 08 Obama-Biden McCain-Palin Aug Sep 08 Percent Following News About Presidential Candidates "Very Closely" Percent likely voters Percent likely voters Percent Who Would Vote "Yes" on Propositions Mar May 08 Prop 4 Parental Notification 42 Jul Prop 8 Eliminating Same-Sex Marriage 39 Aug 08 August Sep 08 September 08 Prop 11 Redistricting 7
12 Californians and Their Government 2008 PRESIDENTIAL ELECTION In this year s presidential race, California s likely voters support the Obama-Biden Democratic ticket by a 10-point margin over the McCain-Palin Republican ticket (50% to 40%). The Democrats lead is nearly identical to that found in PPIC s August survey (48% Obama, 39% McCain), despite a flurry of campaign activity since that time including the national nominating conventions and the announcement of running mates. While registered voters in California give the edge to Obama-Biden, registered voters nationwide are more closely divided, according to several recent national surveys. California s likely voters are loyal to their parties in this race, with Democrats overwhelmingly supporting the Obama-Biden ticket (84%) and nearly the same percentage of Republicans backing McCain-Palin (83%). Support for the GOP ticket has increased 6 points among Republican likely voters since August. Among independent likely voters, Obama-Biden leads McCain-Palin by 18 points (53% to 35%). The announcement of Sarah Palin as John McCain s running mate seems to have had little effect on female likely voters in California. In August, women supported Obama over McCain by 21 points (53% to 32%) and today they support the Obama-Biden ticket over the McCain-Palin ticket by 20 points (56% to 36%). Among Latino likely voters today, Obama-Biden leads McCain-Palin (57% to 30%), but the Democratic advantage has dropped substantially since August, when Obama led McCain by a more than four-to-one margin (71% to 16%). Both male likely voters and white likely voters continue to be divided today. Among self-described evangelical Christians, 59 percent support the McCain-Palin ticket, an increase of 6 points since August. If the November 4 th presidential election were being held today, would you vote for the Democratic ticket of Barack Obama and Joe Biden or the Republican ticket of John McCain and Sarah Palin? Likely voters only Obama-Biden McCain-Palin Someone else Don t know All Likely Voters 50% 40% 3% 7% Democrat Republican Independent Gender Race/Ethnicity Men Women Latinos Whites While overall candidate preferences have changed little in the last month, voters satisfaction with their candidate choices has climbed (48% August to 64% today). The most dramatic shift in the last month occurred among Republicans. In August, just 35 percent of Republicans expressed satisfaction, while 64 percent were unhappy. Today, the reverse is true: 67 percent are satisfied and 31 percent are not. Meanwhile, independents are divided (49% satisfied, 47% not satisfied). Latino likely voters are much more likely to say they are satisfied today (64%) than they were in August (51%). In general, would you say you are satisfied or not satisfied with your choices of candidates in the election for U.S. President on November 4 th? Likely voters only All Likely Voters Dem Rep Ind Latinos Satisfied 64% 74% 67% 49% 64% Not satisfied Don t know PPIC Statewide Survey
13 November 2008 Election 2008 PRESIDENTIAL ELECTION (CONTINUED) California voters have been asked to go to the polls frequently in recent years the November 4 th election will mark the 11 th statewide election since Nevertheless, voters turned out in record numbers for February s presidential primary, and interest in the November 4 th election is high: In our current survey, two in three likely voters (65%) say they are more enthusiastic than usual about voting in this election. Just 20 percent are less enthusiastic and 14 percent volunteer that their enthusiasm is the same. Democratic likely voters (76%) are the most apt to say they are more enthusiastic than usual, followed by Republican (62%) and independent likely voters (53%). Likely voters supporting the Obama-Biden ticket (76%) are much more likely to express enthusiasm than those supporting the McCain-Palin ticket (59%). Sixty-three percent of both Latino and white likely voters say they are more enthusiastic about voting in this election, while women express more enthusiasm than men (69% to 60%). At least six in 10 likely voters across age groups and regions say they are more enthusiastic than usual about voting, with middle-aged voters (68%) and San Francisco Bay Area (70%) and Los Angeles (66%) voters the most likely to express this view. Thinking about the presidential election that will be held this November, are you more enthusiastic about voting than usual, or less enthusiastic? Likely voters only All Likely Voters Dem Rep Ind Latinos More enthusiastic 65% 76% 62% 53% 63% Less enthusiastic Same (volunteered) Don t know Between September 26 th and October 15 th, four national televised debates will be held three between presidential candidates John McCain and Barack Obama and one between vice-presidential candidates Sarah Palin and Joe Biden. Eight in 10 likely voters say the candidates performances will be very (38%) or somewhat important (41%) in deciding how they vote. Democrats (43%) are more likely than Republicans (36%) or independents (32%) to say that debate performances will be very important in their voting decision. Similarly, 43 percent of Obama-Biden voters consider the debates very important to them, compared to 35 percent of McCain-Palin voters. Latinos (54%) are far more likely than whites (33%) to hold this view. Women place more importance on the debates than men (43% to 33%). In deciding who to vote for in the November 4 th presidential election, how important to you are the candidates performances in public debates? Likely voters only All Likely Voters Dem Rep Ind Latinos Very important 38% 43% 36% 32% 54% Somewhat important Not too important Not at all important Don t know September
14 Californians and Their Government ISSUES AND CANDIDATE RANKINGS When it comes to the actual content of the presidential debates, in an open-ended question, four in 10 likely voters offer that they would most like to hear the candidates discuss the economy (40%). Far fewer name the war in Iraq (12%), immigration (7%), or health care (6%). In the 2004 presidential race, the economy also topped the list of issues voters wanted to hear about in debates, although fewer named it (30%). Then, voters more frequently mentioned the war in Iraq (19%) and health care (12%). The 2000 race between Republicans Bush-Cheney and Democrats Gore-Lieberman reflected better economic times. Then, likely voters most wanted to hear about schools and education (19%), followed by health care (15%), Social Security and Medicare (14%), and taxes (11%). Just 5 percent named the economy. Today, the economy tops the list across political groups (47% independents, 46% Democrats, 33% Republicans) and all demographic groups. In the debates, Democrats and independents are more likely than Republicans to want to hear about the war in Iraq, while Republicans are more likely to say immigration should be discussed. Obama-Biden voters are more likely than McCain-Palin voters to say candidates should debate economic issues (46% to 32%) and the Iraq war (16% to 8%), while McCain- Palin voters are more likely to want to hear about immigration (11% to 4%). Latinos are twice as likely as whites (12% to 6%) to say they are interested in hearing about immigration in the debates. Young voters (37%) are nearly as likely as others to mention the economy, but are more likely than others to say gay rights and same-sex marriage (9%) should be discussed in the debates. Which one issue would you most like to hear the presidential candidates talk about during the presidential debates? Top four issues mentioned Likely voters only All Likely Voters Dem Rep Ind Latinos Economy 40% 46% 33% 47% 39% War in Iraq Immigration, illegal immigration Health care, health costs When asked which presidential candidate would do a better job of handling these top issues, likely voters are more apt to name Barack Obama over John McCain on jobs and the economy (53% to 37%) and health care (57% to 29%). They are divided over who could better handle the war in Iraq (49% Obama, 44% McCain) and immigration (42% Obama, 40% McCain). On who would best handle jobs and the economy, most Democratic likely voters (83%) name Obama, while most Republicans (70%) back McCain. Independents are more likely to say Obama (50%) than McCain (39%). Of likely voters supporting the Obama-Biden ticket, 90 percent trust Obama to handle the economy; of those supporting the McCain-Palin ticket, 79 percent trust McCain. And of those who want the candidates to debate the economy, 59 percent believe Obama could better handle this issue. Women are more likely to pick Obama (58%), while men are more divided (47% Obama, 42% McCain). When it comes to handling the war in Iraq, a strong majority of Republican likely voters (84%) believe McCain is the candidate for the job; Democrats also fall along party lines (79% Obama). Independents are divided over this issue (48% Obama, 46% McCain). A vast majority of Obama-Biden voters (87%) name Obama and more than nine in 10 McCain-Palin voters (93%) name McCain. Men are divided (48% McCain, 46% Obama), while women favor Obama over McCain (51% Obama, 41% McCain). Likely voters are divided over who would best handle immigration, with 68 percent of Democrats saying Obama and 71 percent of Republicans naming McCain. Independents are split (40% Obama, 39% McCain). 10 PPIC Statewide Survey
15 November 2008 Election ISSUES AND CANDIDATE RANKINGS (CONTINUED) Three in four Obama-Biden voters (74%) say Obama would do the better job on immigration and three in four McCain-Palin voters (75%) say McCain would. Latinos are twice as likely to name Obama (53% to 26%). Obama has the largest lead over McCain on the issue of health care (57% to 29%). While most partisan voters support their party s candidate (82% of Democrats trust Obama, 60% of Republicans trust McCain), 23 percent of Republicans think Obama could do a better job than McCain on this issue. Independents think Obama would do a better job than McCain by a wide margin (59% to 25%). Eightyeight percent of Obama-Biden voters support Obama on health care, compared to the 66 percent of McCain-Palin voters who support McCain on this issue. Majorities of women and men pick Obama. "Regardless of your choice for president, which of these candidates would do a better job on? Likely Voters Dem Rep Ind Latinos John McCain 37% 10% 70% 39% 27% jobs and the economy Barack Obama Other Don't know John McCain the situation in Iraq Barack Obama Other Don't know John McCain immigration Barack Obama Other Don't know John McCain health care Barack Obama Other Don't know When it comes to handling energy policy, Obama has a 13-point edge over McCain (51% to 38%) among California s likely voters. Support falls along partisan lines: Most Democrats (77%) name Obama and most Republicans (74%) support McCain. Independents back Obama over McCain by 20 points (55% to 35%). Of six issues addressed, McCain only has an edge over Obama on handling foreign policy (51% to 43%). Eighty-eight percent of Republicans back McCain in this area, while 74 percent of Democrats support Obama. But 21 percent of Democrats think McCain could better handle foreign policy. Independents favor McCain over Obama by a wide margin (53% to 36%) on this issue. With the election just over a month away, nine in 10 voters are following news about the election very (52%) or somewhat closely (39%). The percentage following news very closely increased 13 points since our August survey (39%), just before the party conventions. More than half of Democrats (56%) and Republicans (52%) are following news very closely, compared to 44 percent of independents. The percentage following news very closely increases with age, education, and income. At least half of both Obama-Biden (56%) and McCain-Palin (51%) supporters are very closely following election news. September
16 Californians and Their Government PROPOSITION 4: PARENTAL NOTIFICATION Almost half of likely voters support Proposition 4 (48% yes, 41% no), a citizens initiative that would amend the state constitution to prohibit the termination of an unemancipated minor s pregnancy until 48 hours after the notification of her parent or guardian. One in 10 likely voters are undecided. In August, likely voters were more closely divided (47% yes, 44% no). In 2005 and 2006, California voters rejected similar propositions (2005: 47% yes, 53% no; 2006: 46% yes, 54% no). Across parties, Republicans (67%) are the most likely to favor this initiative, and their support has increased by 5 points since August. Fifty-three percent of Democrats are opposed, while independents are divided (48% yes, 44% no) findings similar to August. Among likely voters, a strong majority of evangelical Christians (69%) support Proposition 4, while others are more likely to oppose it (48% no, 40% yes). Likely voters with children aged 18 or younger (51% yes, 40% no) are more likely than those without children (46% yes, 42% no) to support Proposition 4. Women and men express similar levels of support, while Latinos are more likely than whites to say they would vote yes. Proposition 4 is called the Waiting Period and Parental Notification Before Termination of Minor s Pregnancy Initiative Constitutional Amendment. If the election were held today, would you vote yes or no on Proposition 4? * Likely voters only Yes No Don t know All Likely Voters 48% 41% 11% Democrat Republican Independent Gender Parents of children under 18 Race/Ethnicity Men Women Yes No Latinos Whites *For complete text of proposition question, see p. 29. As in August, eight in 10 likely voters including at least three in four across party groups say the outcome of the vote on Proposition 4 is important to them. Independents (42%) are less likely than Democrats (49%) and Republicans (50%) to call it very important. The outcome is more likely to be considered very important by supporters (54%) than opponents (44%). Among likely voters, women (56%) are much more likely than men (39%), Latinos (55%) are more likely than whites (44%), and those with children (56%) are more likely than those without children (43%) to say the outcome is very important. How important to you is the outcome of the vote on Proposition 4? Likely voters only All Likely Voters Vote on Proposition 4 Dem Rep Ind Yes No Very important 47% 49% 50% 42% 54% 44% Somewhat important Not too important Not at all important Don t know PPIC Statewide Survey
17 November 2008 Election PROPOSITION 8: SAME-SEX MARRIAGE A majority of California likely voters oppose Proposition 8 (55% no, 41% yes), which would amend the state constitution to eliminate the right of same-sex couples to marry, and would recognize marriage between a man and a woman only as valid in California. This is a turnaround from 2000, when California voters approved by a wide margin (61% to 39%) a ballot initiative that prevented the state from recognizing same-sex marriages. After a recent California Supreme Court decision that found the same-sex marriage ban unconstitutional, Proposition 8 qualified for the November ballot. Today, 62 percent of Republicans are in favor of Proposition 8, while seven in 10 Democrats (71%) and about half of independents (53%) are opposed. While overall support is similar to August (40% yes, 54% no), the no vote for Democrats has increased 5 points, and the yes vote for independents has increased 6 points. Self-described conservatives (67%) are far more likely than liberals (17%) to vote yes on Proposition 8, while moderates are more likely to say they would vote no (57%) than yes (35%). Less than half of voters across regions would vote yes, with support highest in the Other Southern California region (49%) and opposition highest in the San Francisco Bay Area (66%). Likely voters who have never been married (61% no) are more likely to oppose this initiative than those who are married (52% no). Opposition is greater among whites than Latinos (56% to 50%). Men and women are similar in their opposition. Evangelicals are as likely to vote yes (64%) as others are to vote no (63%). Proposition 8 is called the Eliminates Right of Same-Sex Couples to Marry Initiative Constitutional Amendment. If the election were held today, would you vote yes or no on Proposition 8? * Likely voters only Yes No Don t know All Likely Voters 41% 55% 4% Democrat Republican Independent Gender Race/Ethnicity Men Women Latinos Whites *For complete text of proposition question, see p. 30. Eight in 10 likely voters say the outcome of Proposition 8 is either very (54%) or somewhat (26%) important to them. More Republicans (57%) and Democrats (56%) than independents (44%) call it very important. Those who plan to vote yes (62%) are more likely than those who plan to vote no (51%) to say the outcome is very important. Since August, the proportion considering it very important has increased somewhat among likely voters (48% to 54%), Democrats and Republicans, and both yes and no voters. How important to you is the outcome of the vote on Proposition 8? Likely voters only All Likely Voters Vote on Proposition 8 Dem Rep Ind Yes No Very important 54% 56% 57% 44% 62% 51% Somewhat important Not too important Not at all important Don t know 1 3 September
18 Californians and Their Government PROPOSITION 11: REDISTRICTING California s likely voters today are divided on Proposition 11 (38% yes, 33% no, 29% undecided), an initiative constitutional amendment to take the authority to draw legislative districts away from elected officials and give it to a commission of registered voters. In 2005, a similar proposition, which would have given redistricting authority to a panel of retired judges, was rejected (40% yes, 60% no). While this proposition does not enjoy majority support within any political group today, Republicans (45%) are more likely than Democrats (36%) and independents (29%) to support it. Support today is similar to August (39% yes, 36% no), but the yes vote has increased by 5 points among Democrats and dropped by 10 points among independents. Fewer than half in all regions would vote yes. Whites (40%) are more likely than Latinos (34%) and men (42%) are more likely than women (35%) to say they would vote yes on Proposition 11. Support for Proposition 11 increases as age and education level rise. Proposition 11 is called the Redistricting Initiative Constitutional Amendment and Statute. If the election were held today, would you vote yes or no on Proposition 11? * Likely voters only Yes No Don t know All Likely Voters 38% 33% 29% Democrat Republican Independent Gender Race/Ethnicity Men Women Latinos Whites *For complete text of proposition question, see p. 30. About seven in 10 likely voters (69%) think the redistricting process is in need of major (43%) or minor (26%) changes. This perception is the same as last month (69%) and just 4 points lower than last September (73%). Strong majorities in all parties say change is needed. Sixty-five percent or more across regions hold this view. Latinos are more likely than whites (76% to 67%) and men more likely than women (74% to 63%) to say that major or minor changes are needed to the redistricting process. Six in 10 of those who would vote yes on Proposition 11 believe that major changes are needed, compared to three in 10 who would vote no. Another three in 10 no voters think the process is fine the way it is. Of those likely voters who say major changes are needed, 56 percent would vote yes on Proposition 11. Do you think the way the governor and legislature go about the redistricting process in California is in need of major changes, minor changes, or is it fine the way it is? Likely voters only All Likely Voters Vote on Proposition 11 Dem Rep Ind Yes No Major changes 43% 43% 43% 37% 62% 31% Minor changes Fine the way it is Don t know PPIC Statewide Survey
19 STATE AND NATIONAL ISSUES KEY FINDINGS A record percentage of Californians (44%) continue to name the economy as the most important issue facing the state. Nearly seven in 10 say the state is headed in the wrong direction, and that the next 12 months will bring bad economic times. Personally, 52 percent say the current housing situation will hurt their financial situation in the next year. (pages 16, 17) About four in 10 adults approve of the governor s job performance, one in five approve of the state legislature, and one in three approve of their own state legislators. About one in four approve of the president s job performance, and three in 10 approve of Congress. California s two senators, House Speaker Nancy Pelosi, and voters own representatives receive higher ratings. (pages 18, 19) About three in four adults say the state budget situation is a big problem and that major changes in the budget process are needed. Nearly half say that changing the vote requirement to pass a state budget from two-thirds to 55 percent is a good idea; six in 10 say strictly limiting state spending is a good idea. (page 20) Nearly two in three residents say changes are needed in the citizens initiative process (36% major, 28% minor); most agree there are too many propositions on the ballot and even more say the wording of initiatives is too complicated and confusing. (page 21) Most residents say there are important differences between the two major political parties; half say a major third party is needed. Strong majorities say they are more interested in politics this year than in 2004 and say it really matters who wins the 2008 presidential election. (pages 22, 23) Approval Ratings of State Elected Officials Percent all adults Jan Sep Jan Sep Mar Sep Mar Sep Governor Legislature Mar Sep Approval Ratings of Federal Elected Officials Percent all adults Percent all adults Jun Senator Boxer Change Budget Passage Vote from Two-thirds to 55 Percent 47 Jan May Senator Feinstein 48 May Sep 07 Good idea Bad idea May Speaker Pelosi Sep 08 15
20 Californians and Their Government OVERALL MOOD The economy is foremost on Californians minds today, as it has been throughout This month, a record high 44 percent name jobs and the economy as the most important issue facing the state. Similar to last month, only 9 percent say the state budget situation is the most important issue facing the state, despite a budget impasse of record duration. Fewer name education (6%), immigration (6%), gasoline prices (5%), or housing (5%). Since last September, mention of immigration has declined 12 points while mention of the economy has climbed 31 points. The economy is the top issue mentioned today across all political, regional, and demographic groups. Democrats (47%) and independents (44%) are more likely than Republicans (36%) to name jobs and the economy. Residents in Los Angeles (49%) are the most likely to name jobs and the economy, while those in the Central Valley (38%) are least likely. Latinos (56%) are far more likely than whites (37%) to name the economy, and mention of jobs and the economy decreases with increasing education and income. Whites (13%) are more likely than Latinos (3%) to name the state budget as the top issue, and the percentage naming the state budget increases with higher age, education, and income. Thinking about the state as a whole, what do you think is the most important issue facing people in California today? Top six issues mentioned All Adults Dem Rep Ind Likely Voters Jobs, economy 44% 47% 36% 44% 41% State budget, deficit, taxes Education, schools Immigration, illegal immigration Gasoline prices Housing costs, availability Californians continue to say that the state is headed in the wrong direction. Only one in five residents say California is going in the right direction, while 68 percent say it is going in the wrong direction. For a full year, at least half of Californians have said the state is headed in the wrong direction. This negative perception did not change from last month, but has increased 18 points since last September. Today, the view that the state is going in the wrong direction is widely held, and includes at least six in 10 across parties, regions, and demographic groups. Democrats (72%) and Republicans (68%) are somewhat more likely than independents (60%) to agree. Latinos are far more likely than whites (78% to 63%) and women are more likely than men (71% to 66%) to say the state is going in the wrong direction. Do you think things in California are generally going in the right direction or the wrong direction? All Adults Dem Rep Ind Likely Voters Right direction 21% 19% 22% 27% 21% Wrong direction Don t know PPIC Statewide Survey
21 State and National Issues ECONOMIC OUTLOOK With 44 percent of Californians saying the economy is the most important issue facing the state today, nearly seven in 10 residents (68%) say that they expect bad times financially during the next 12 months in California. The current negative outlook is similar to last month (71%) and 9 points higher than last September. Today, at least six in 10 across all parties, regions, and demographic groups think that during the next 12 months California can expect bad times financially. Democrats (75%) and independents (70%) are more likely than Republicans (62%) to hold this view. Renters and homeowners alike are equally pessimistic in their outlook for the state (69% each). The perception that bad times can be expected increases with higher income and education levels. Turning to economic conditions in California, do you think that during the next 12 months we will have good times financially or bad times? Good times Bad times Don't know All Adults 20% 68% 12% Homeownership Own Rent Central Valley Region San Francisco Bay Area Los Angeles Other Southern California Under $40, Annual income $40,000 to $79, $80,000 or more Likely Voters With the economy on Californians minds and with the credit crisis affecting many residents, do Californians think the current housing situation will hurt their personal financial situation in the next year or so? About half of Californians say the situation will hurt their financial situation a great deal (31%) or somewhat (21%), while 44 percent say it will not. These perceptions were similar in December 2007 (28% great deal, 24% somewhat, 45% no). While there is a shared pessimism across parties about many economic issues, housing is not one of them. Democrats (54%) and independents (53%) are far more likely than Republicans (37%) to say that the housing situation will hurt their financial situation. This perception is higher among renters than homeowners, and decreases with higher age, education, and income. Do you think the current housing situation in California will hurt your financial situation in the next year or so, or not? Annual Income Homeownership All Adults Under $40,000 to $80,000 or Own Rent $40,000 $79,999 more Yes, a great deal 31% 43% 28% 21% 26% 39% Yes, only somewhat No Don't know September
22 Californians and Their Government STATE ELECTED OFFICIALS APPROVAL RATINGS Californians pessimism about the direction of the state and its economy and their frustration over a late state budget are reflected in their ratings of state leadership. Governor Schwarzenegger s approval rating of 38 percent today holds steady from last month, but is 12 points lower than a year ago (50% approve, 38% disapprove). Across political parties, half of Republicans (53%) approve of the governor, while 61 percent of Democrats disapprove. Independents are divided (45% approve, 49% disapprove). Likely voters are slightly more approving than Californians overall in their assessment of the governor (42%). Across regions, residents in Los Angeles (64%) are the most likely to disapprove, followed by residents in the Other Southern California region (55%), San Francisco Bay Area (49%), and Central Valley (48%). Latinos (73%) are far more likely than whites (44%) to disapprove of the governor s job performance. Governor Schwarzenegger s approval ratings increase with higher age, education, and income. The state legislature fares much worse than the governor, recording a new low in its job approval rating, with just 21 percent of residents and 16 percent of likely voters approving of legislators job performance. In the past month, their approval rating has slid 5 points among residents (26% to 21%) and 4 points among likely voters (20% to 16%). The legislature has received majority disapproval ratings since the beginning of the year. Today, solid majorities across regional, political, and demographic groups disapprove of the legislature s job performance. Whites (73%) are much more likely to disapprove of the legislature than Latinos (59%) and men (71%) are somewhat more likely than women (63%) to disapprove. Overall, do you approve or disapprove of the way that All Adults Dem Rep Ind Likely Voters Arnold Schwarzenegger is handling his job as governor of California? the California Legislature is handling its job? Approve 38% 33% 53% 45% 42% Disapprove Don't know Approve Disapprove Don't know Half of residents (50%) and likely voters (52%) today disapprove of the job their own state senate and assembly representatives are doing, and about one in three residents (34%) and likely voters (35%) approve. Since March, their approval ratings have declined 8 points among both residents (42% to 34%) and likely voters (43% to 35%). In September 2007, Californians were evenly divided (41% approve, 40% disapprove) in their assessments of the job performance of their own state legislators. Across parties today, Republicans (57%) are more likely to disapprove than independents (50%) and Democrats (47%). Across regions, Central Valley residents (54%) are the most likely to disapprove, followed by residents in Los Angeles (50%), the San Francisco Bay Area, and the Other Southern California region (47% each). Overall, do you approve or disapprove of the job that the state legislators representing your assembly and senate districts are doing at this time? All Adults Dem Rep Ind Likely Voters Approve 34% 37% 29% 39% 35% Disapprove Don't know PPIC Statewide Survey
23 State and National Issues FEDERAL ELECTED OFFICIALS APPROVAL RATINGS President Bush reaches a new low job approval rating among Californians this month (23% approve, 74% disapprove). Likely voters (28%) are somewhat more approving of the president. Although 59 percent of Republicans approve of Bush s job performance, 80 percent of independents and 92 percent of Democrats disapprove. Californians today are only somewhat more negative in their assessments of the president than adults nationwide, according to a recent CBS News/New York Times poll (27% approve, 68% disapprove). Strong majorities across regions and demographic groups disapprove of the president s job performance, with San Francisco Bay Area residents (84%), Latinos (83%), and residents under 35 (85%) among the most likely to express disapproval. The U.S. Congress also receives low marks from residents this month (29% approve, 63% disapprove). Findings today are similar to last month s, but residents today are somewhat more disapproving than in March (33% approve, 55% disapprove) and last September (33% approve, 57% disapprove). Today across political parties, Republicans (77%) are much more disapproving of Congress than independents (64%) and Democrats (54%). At least six in 10 across regions disapprove of the job the U.S. Congress is doing, and whites (69%) and men (68%) are much more likely than Latinos (50%) and women (57%) to disapprove. Disapproval of the U.S. Congress increases with higher age, education, and income. Overall, do you approve or disapprove of the way All Adults Dem Rep Ind Likely Voters that George W. Bush is handling his job as president of the United States? the U.S. Congress is handling its job? Approve 23% 6% 59% 18% 28% Disapprove Don't know Approve Disapprove Don't know By comparison, the job approval ratings for Senators Dianne Feinstein (48%) and Barbara Boxer (44%) and for House Speaker Nancy Pelosi (40%) are higher than the overall approval for the U.S. Congress (29%). Californians also give their own House representatives higher approval ratings (49% approve, 31% disapprove); findings today are similar to those in March (47% approve, 30% disapprove) and last September (50% approve, 30% disapprove). Across parties today, Democrats (55%) and independents (54%) are more likely than Republicans (45%) to approve of their own House representatives. Across regions, residents in the San Francisco Bay Area (54%) and the Central Valley (50%) are the most approving of their own representatives, followed by residents in Los Angeles and the Other Southern California region (47% each). Latinos (54%) and women (52%) are somewhat more likely than whites (47%) and men (47%) to approve of their own representatives in the House. Overall, do you approve or disapprove of the way your own representative to the U.S. House of Representatives in Congress is handling his or her job? All Adults Dem Rep Ind Likely Voters Approve 49% 55% 45% 54% 52% Disapprove Don't know September
24 Californians and Their Government STATE BUDGET With a record-setting delay in the passage of a new state budget, Californians say the budget situation is a big problem (78%) a 5-point increase from last month (73%), and a 14-point increase since January (64%) when the governor first released his budget plan. Strong majorities across regional, political, and demographic groups say the budget situation is a big problem. Three in four residents also say major changes (76%) are needed in the budget process, while 17 percent say minor changes are needed, and just 4 percent say it is fine the way it is. The view that major changes are needed has increased 11 points since May (65%) when the governor released his revised budget. At least seven in 10 residents across regional, political, and demographic groups hold this view. Overall, do you think the state budget process in California, in terms of both revenues and spending, is in need of major changes, minor changes, or do you think it is fine the way it is? All Adults Dem Rep Ind Likely Voters Major changes 76% 79% 83% 76% 79% Minor changes Fine the way it is Don't know So how do Californians want to deal with the multibillion-dollar budget deficit facing the state? A plurality of residents (43%) and likely voters (48%) continue to favor a mix of spending cuts and tax increases, while fewer say the gap should be addressed mostly through spending cuts (36% adults, 37% likely voters). Far fewer still say they prefer tax increases alone (7%) or borrowing money and running a deficit (5%). Since January, most residents have said they prefer a mix of spending cuts and tax increases. Today, voters remain deeply divided along party lines in their preferences for a budget solution. With a record late budget agreement, how do Californians feel about changing the two-thirds vote requirement to a 55 percent majority for the legislature to pass a budget? A record percent of residents (49%) and likely voters (46%) think it would be a good idea. Democrats (54%) are more likely to say this is a good idea, while Republicans (50%) are more likely to say it is a bad idea, and independents are divided (46% good, 45% bad). A year ago, more adults (46%) and likely voters (56%) said this proposal to change the vote requirement was a bad idea. In addition, most residents think that strictly limiting the amount that state spending could increase each year is a good idea (62% good, 31% bad). Findings are similar among likely voters. Across parties, strong majorities of Republicans (77%) and independents (64%) say it is a good idea; half of Democrats (53%) also agree. Spending and tax reforms have been proposed to address structural issues in the state budget. Please say whether you think the proposal is a good idea or a bad idea. All Adults Dem Rep Ind Likely Voters How about replacing the twothirds Good idea 49% 54% 40% 46% 46% vote requirement with a 55 percent majority vote for the state legislature to pass a budget? Bad idea Don't know How about strictly limiting the amount of money that state spending could increase each year? Good idea Bad idea Don't know PPIC Statewide Survey
25 State and National Issues CITIZENS INITIATIVES Given the generally low level of approval that Californians give to their state elected officials today, what or whom would they prefer to have the most influence over public policy? Thirty-eight percent of residents say they would prefer initiatives on the state ballot to have the most influence, 32 percent would prefer the legislature, and 20 percent say the governor; likely voters express similar preferences. Initiatives are preferred somewhat more now than in September 2006 (33% initiatives, 32% legislature, 23% governor). But many Californians also view the initiative process as flawed, with 64 percent saying major (36%) or minor (28%) changes are needed, while 29 percent say it is fine the way it is. Findings today are similar to those of September 2006 (37% major, 31% minor, 25% fine). Today, strong majorities across parties agree that changes, major or minor, are needed in the initiative process. Latinos (49%) are the most likely to say major changes are needed. Even among residents who prefer initiatives to have the most influence over public policy, 60 percent say either major (30%) or minor (30%) changes are needed. Do you think the citizens initiative process in California is in need of major changes, minor changes, or that it is basically fine the way it is? All Adults Dem Rep Ind Likely Voters Major changes 36% 36% 28% 29% 30% Minor changes Fine the way it is Don't know This November, 12 propositions are on the state ballot, including 10 citizens initiatives. What do residents think about the number of propositions on state ballots in general? Six in 10 residents and likely voters (59% each) agree that there are too many propositions on the state ballot. In September 2006, when there were 13 propositions on the upcoming ballot, including eight citizens initiatives, a similar number of residents (59%) and likely voters (58%) agreed. An even more widely held complaint about the initiative process concerns the wording of initiatives: 78 percent of residents and 84 percent of likely voters agree that initiative wording is often too complicated and confusing for voters to understand what would happen if an initiative passed. Strong majorities across regions, parties, and demographic groups agree. For the following items, please say if you strongly agree, somewhat agree, somewhat disagree, or strongly disagree. All Adults Dem Rep Ind Likely Voters Strongly agree 29% 33% 26% 33% 30% There are too many propositions on the state ballot. Somewhat agree Somewhat disagree Strongly disagree Don't know Strongly agree The ballot wording for citizens initiatives is often too complicated and confusing for voters to understand what happens if the initiative passes. Somewhat agree Somewhat disagree Strongly disagree Don't know September
26 Californians and Their Government MAJOR POLITICAL PARTIES With all of the attention that Californians say they are paying to news about the presidential candidates, what do they think about the two major political parties? A solid 79 percent of residents and 81 percent of likely voters say there are important differences in what Republicans and Democrats stand for overall, while 18 percent of residents and likely voters say there are not important differences. In September 2004, 75 percent of residents said there were important differences and 21 percent said there were not. Across parties today, more than eight in 10 Democrats (85%) and Republicans (83%) agree there are important differences, while 69 percent of independents say the same. Men (78%) and women (81%), Latinos and whites (80% each), and evangelical Christians (81%) and others (79%) similarly agree that there are important differences between Republicans and Democrats. Of likely voters supporting either the Republican or Democratic ticket, both groups (86% Obama-Biden, 80% McCain-Palin) think there are important differences in what the Republicans and Democrats stand for. Overall, do you think there are any important differences in what the Republicans and Democrats stand for? All Adults Dem Rep Ind Likely Voters Yes, there are important differences 79% 85% 83% 69% 81% No, there are not important differences Don't know Despite 79 percent of Californians saying there are important differences between the two parties, a slim majority say they would like to see a third major party. Fifty-two percent of residents and likely voters say the Democratic and Republican parties do such a poor job of representing the American people that a third major party is needed, while 41 percent of residents and likely voters say the Republican and Democratic parties do an adequate job representing the American people. Not surprisingly, independents are the most likely to say a third major party is needed, while Democrats and Republicans give a more mixed assessment. The perception that the Republican and Democratic parties do an adequate job of representation is much higher among evangelical Christians than among others (49% to 38%). Compared to four years ago, Californians today are somewhat more likely to say a third major party is needed (2004: 48% adequate job, 46% third party needed). Findings among independents today are nearly identical to four years ago (2004: 34% adequate job, 62% third party needed). While Democrats are about as likely as they were four years ago to say the two major parties are doing an adequate job (51% in 2004 to 48% today), Republicans are much less likely than they were four years ago to say so (58% in 2004 to 44% today). In your view, do the Republican and Democratic parties do an adequate job representing the American people, or do they do such a poor job that a third major party is needed? All Adults Dem Rep Ind Likely Voters Adequate job 41% 48% 44% 35% 41% Third party is needed Don't know PPIC Statewide Survey
27 State and National Issues ELECTION IMPORTANCE How much interest is this presidential election generating with the public at large, including voting and nonvoting adults? Echoing likely voters, two in three Californians (67%) say they are more interested in politics this year than they were in 2004, the last presidential election year. Twelve percent of residents are less interested, and 21 percent volunteer that they are as interested as they were in In August 2004, findings were nearly identical (64% more interested, 12% less interested, 23% same amount of interest) when comparing interest in politics that year to interest in Today, more than six in 10 residents across regions, racial/ethnic, gender, age, education, and income groups say they are more interested this year than they were in Across voter groups, more than six in 10 Democrats (69%), independents (65%), and Republicans (64%) say they are more interested. Independents (17%) are somewhat more likely than Republicans (10%) and Democrats (8%) to say they are less interested this year than they were in Two in three likely voters supporting Obama-Biden and two in three supporting McCain-Palin say they are more interested in politics this time around. Are you more interested or less interested in politics this year than you were in 2004 the last presidential election year? All Adults Dem Rep Ind Likely Voters More interested 67% 69% 64% 65% 65% Less interested Same (volunteered) Don't know In terms of making progress on important issues facing the country, 75 percent of residents believe that it really matters who wins the 2008 presidential election. One in five residents (21%) say things will pretty much be the same regardless of who is elected president. In September 2004, 71 percent of residents said it really mattered who won, while 26 percent said things would pretty much be the same. More than two in three residents across regional and demographic groups today believe the election outcome really matters when it comes to making progress on important issues. Across parties, strong majorities believe the outcome will matter, although Democrats (85%) are more likely to hold this view than Republicans (76%) or independents (71%). Likely voters supporting Obama-Biden (88%) are somewhat more likely than those supporting McCain-Palin (77%) to say it really matters who wins the election. As far as making progress on the important issues facing the country is concerned, does it really matter who wins the 2008 presidential election, or will things pretty much be the same regardless of who is elected president? All Adults Dem Rep Ind Likely Voters Really matters 75% 85% 76% 71% 79% Things will be the same Other (volunteered) Don't know September

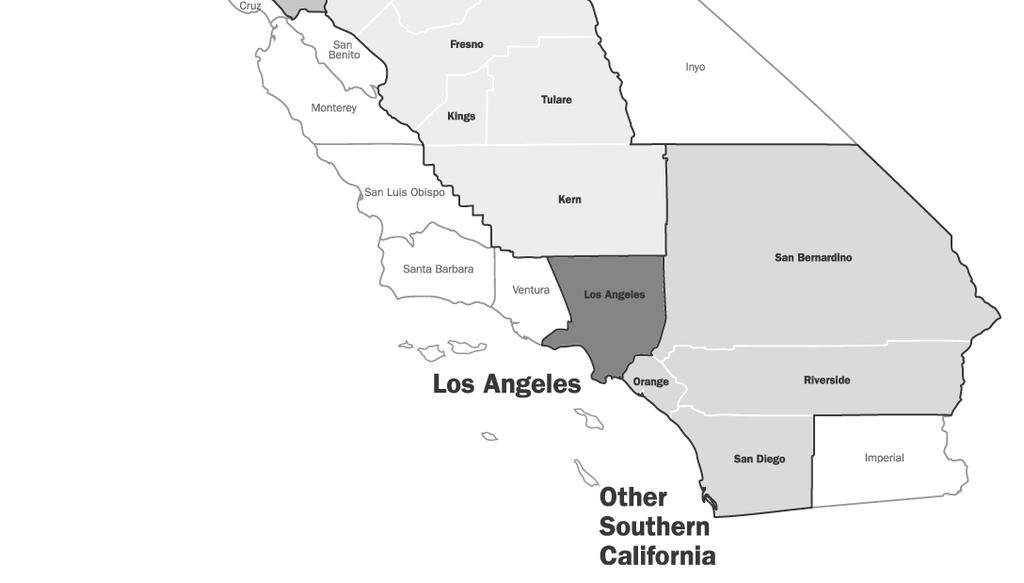
28 REGIONAL MAP 24
march 2009 Californians their government in collaboration with The James Irvine Foundation Mark Baldassare Dean Bonner Jennifer Paluch Sonja Petek
 march 2009 Californians & their government in collaboration with The James Irvine Foundation Mark Baldassare Dean Bonner Jennifer Paluch Sonja Petek The Public Policy Institute of California is dedicated
Californians. their government. ppic statewide survey DECEMBER in collaboration with The James Irvine Foundation CONTENTS
 ppic statewide survey DECEMBER 2010 Californians & their government Mark Baldassare Dean Bonner Sonja Petek Nicole Willcoxon CONTENTS About the Survey 2 Press Release 3 November 2010 Election 6 State and
Californians. their government. january in collaboration with The James Irvine Foundation
 january 2009 Californians & their government in collaboration with The James Irvine Foundation Mark Baldassare Dean Bonner Jennifer Paluch Sonja Petek The Public Policy Institute of California is dedicated
Mark Baldassare is President and Chief Executive Officer of PPIC. Thomas C. Sutton is Chair of the Board of Directors.
 MaY 2008 The Public Policy Institute of California is dedicated to informing and improving public policy in California through independent, objective, nonpartisan research on major economic, social, and
PPIC STATEWIDE SURVEY
 PPIC STATEWIDE SURVEY SEPTEMBER 2004 Californians and Their Government Public Policy Institute of California Mark Baldassare Research Director & Survey Director The Public Policy Institute of California
Californians. their government. ppic statewide survey SEPTEMBER in collaboration with The James Irvine Foundation CONTENTS
 ppic statewide survey SEPTEMBER 2010 Californians & their government Mark Baldassare Dean Bonner Sonja Petek Nicole Willcoxon CONTENTS About the Survey 2 Press Release 3 November 2010 Election 6 State
Californians. their government. ppic state wide surve y OCTOBER in collaboration with The James Irvine Foundation CONTENTS
 ppic state wide surve y OCTOBER 2012 Californians & their government Mark Baldassare Dean Bonner Sonja Petek Jui Shrestha CONTENTS About the Survey 2 Press Release 3 November 2012 Election 6 State and
As Budget Angst Grows, Californians Take Stock of Fiscal Options And Take Aim at Elected Leaders
 EMBARGOED: Do not publish or broadcast until 10:00 p.m. PDT on Wednesday, March 26. CONTACT: Andrew Hattori, 415/291-4417 Abby Cook, 415/291-4436 Para ver este comunicado de prensa en español, por favor
Californians. population issues. february in collaboration with The William and Flora Hewlett Foundation
 february 2009 Californians & population issues in collaboration with The William and Flora Hewlett Foundation Mark Baldassare Dean Bonner Jennifer Paluch Sonja Petek The Public Policy Institute of California
Californians. their government. ppic statewide sur vey. d e c e m b e r in collaboration with The James Irvine Foundation CONTENTS
 ppic statewide sur vey d e c e m b e r 2 0 0 9 Californians & their government Mark Baldassare Dean Bonner Jennifer Paluch Sonja Petek CONTENTS About the Survey 2 Press Release 3 2010 California Election
Californians. their government. ppic state wide surve y MARCH in collaboration with The James Irvine Foundation CONTENTS
 ppic state wide surve y MARCH 2012 Californians & their government Mark Baldassare Dean Bonner Sonja Petek Jui Shrestha CONTENTS About the Survey 2 Press Release 3 2012 Elections 6 State and National Issues
PUBLIC POLICY INSTITUTE OF CALIFORNIA 500 Washington Street, Suite 800 San Francisco, California phone: fax:
 PUBLIC POLICY INSTITUTE OF CALIFORNIA 500 Washington Street, Suite 800 San Francisco, California 94111 phone: 415.291.4400 fax: 415.291.4401 www.ppic.org survey@ppic.org TABLE OF CONTENTS About the Survey
Californians. their government. ppic state wide surve y SEPTEMBER in collaboration with The James Irvine Foundation
 ppic state wide surve y SEPTEMBER 2014 Californians & their government Mark Baldassare Dean Bonner Renatta DeFever Lunna Lopes Jui Shrestha CONTENTS About the Survey 2 Press Release 3 November 2014 Election
Californians. their government. ppic state wide surve y JANUARY in collaboration with The James Irvine Foundation CONTENTS
 ppic state wide surve y JANUARY 2013 Californians & their government Mark Baldassare Dean Bonner Sonja Petek Jui Shrestha CONTENTS About the Survey 2 Press Release 3 State Government 6 Federal Government
Californians. their government. ppic statewide sur vey J A N U A R Y in collaboration with The James Irvine Foundation CONTENTS
 ppic statewide sur vey J A N U A R Y 2 0 1 0 Californians & their government Mark Baldassare Dean Bonner Sonja Petek Nicole Willcoxon CONTENTS About the Survey 2 Press Release 3 2010 Election Context 6
Californians. their government. ppic state wide surve y SEPTEMBER supported with funding from The James Irvine Foundation CONTENTS
 ppic state wide surve y SEPTEMBER 2015 Californians & their government Mark Baldassare Dean Bonner David Kordus Lunna Lopes CONTENTS About the Survey 2 Press Release 3 State Government 6 Federal Government
Californians. their government. ppic state wide surve y MARCH in collaboration with The James Irvine Foundation CONTENTS
 ppic state wide surve y MARCH 2014 Californians & their government Mark Baldassare Dean Bonner Sonja Petek Jui Shrestha CONTENTS About the Survey 2 Press Release 3 State Government 6 Federal Government
PPIC STATEWIDE SURVEY
 PPIC STATEWIDE SURVEY OCTOBER OBER 2004 Californians and Their Government Public Policy Institute of California Mark Baldassare Research Director & Survey Director The Public Policy Institute of California
David W. Lyon is founding President and Chief Executive Officer of PPIC. Thomas C. Sutton is Chair of the Board of Directors.
 The Public Policy Institute of California (PPIC) is a private operating foundation established in 1994 with an endowment from William R. Hewlett. The Institute is dedicated to improving public policy in
TABLE OF CONTENTS. About the Survey 1. Press Release 3. State Issues 7. National Issues 15. Regional Map 24. Methodology 25
 TABLE OF CONTENTS About the Survey 1 Press Release 3 State Issues 7 National Issues 15 Regional Map 24 Methodology 25 Questionnaire and Results 27 ABOUT THE SURVEY The PPIC Statewide Survey provides policymakers,
David W. Lyon is founding President and Chief Executive Officer of PPIC. Thomas C. Sutton is Chair of the Board of Directors.
 The Public Policy Institute of California (PPIC) is a private operating foundation established in 1994 with an endowment from William R. Hewlett. The Institute is dedicated to improving public policy in
Californians. healthy communities. ppic statewide survey FEBRUARY in collaboration with The California Endowment CONTENTS
 ppic statewide survey FEBRUARY 2011 Californians & healthy communities Mark Baldassare Dean Bonner Sonja Petek Nicole Willcoxon CONTENTS About the Survey 2 Press Release 3 Residents Perceptions & Attitudes
Californians. their government. ppic state wide surve y JANUARY in collaboration with The James Irvine Foundation CONTENTS
 ppic state wide surve y JANUARY 2014 Californians & their government Mark Baldassare Dean Bonner Sonja Petek Jui Shrestha CONTENTS About the Survey 2 Press Release 3 State Government 6 Federal Government
PPIC STATEWIDE SURVEY
 PPIC STATEWIDE SURVEY SEPTEMBER 2005 Special Survey on Californians and the Initiative Process in collaboration with The James Irvine Foundation Public Policy Institute of California Mark Baldassare Research
Californians. their government. ppic state wide surve y MAY in collaboration with The James Irvine Foundation CONTENTS
 ppic state wide surve y MAY 2013 Californians & their government Mark Baldassare Dean Bonner Sonja Petek Jui Shrestha CONTENTS About the Survey 2 Press Release 3 State Government 6 Federal Government 16
Californians & Their Government
 Californians & Their Government Mark Baldassare Dean Bonner David Kordus Lunna Lopes CONTENTS Press Release 3 State Issues 6 Federal Issues 14 Regional Map 24 Methodology 25 Questionnaire and Results 27
Californians & Their Government
 PPIC STATEWIDE SURVEY DECEMBER 2018 Californians & Their Government Mark Baldassare Dean Bonner Alyssa Dykman Lunna Lopes CONTENTS Press Release State Post-Election Landscape Federal Post-Election Landscape
Californians. their government. ppic state wide surve y SEPTEMBER in collaboration with The James Irvine Foundation CONTENTS
 ppic state wide surve y SEPTEMBER 2013 Californians & their government Mark Baldassare Dean Bonner Sonja Petek Jui Shrestha CONTENTS About the Survey 2 Press Release 3 State Government 6 Federal Government
Californians & Their Government
 Californians & Their Government Mark Baldassare Dean Bonner Lunna Lopes CONTENTS Press Release 3 2018 California Election 6 State and National Issues 13 Regional Map 20 Methodology 21 Questionnaire and
Californians & Their Government
 Californians & Their Government Mark Baldassare Dean Bonner David Kordus Lunna Lopes CONTENTS Press Release 3 Federal Government 6 State Government 15 Regional Map 22 Methodology 23 Questionnaire and Results
PPIC STATEWIDE SURVEY
 PPIC STATEWIDE SURVEY J ANUAR ARY Y 2006 Special Survey on the California State Budget in collaboration with The James Irvine Foundation Public Policy Institute of California Mark Baldassare Research Director
Californians & Their Government
 Californians & Their Government Mark Baldassare Dean Bonner Alyssa Dykman CONTENTS Press Release 3 2018 California Election 6 State and National Issues 11 Regional Map 20 Methodology 21 Questionnaire and
PPIC STATEWIDE SURVEY
 PPIC STATEWIDE SURVEY FEBRU ARY 2006 Californians and the Environment in collaboration with The David and Lucile Packard Foundation Public Policy Institute of California Mark Baldassare Research Director
Californians & Their Government
 Californians & Their Government Mark Baldassare Dean Bonner Alyssa Dykman Lunna Lopes CONTENTS Press Release 3 2018 California Election 6 State and National Issues 12 Regional Map 20 Methodology 21 Questionnaire
PPIC Statewide Survey: Californians and Their Government
 PPIC Statewide Survey: Californians and Their Government Mark Baldassare Senior Fellow and Survey Director January 2001 Public Policy Institute of California Preface California is in the midst of tremendous
PPIC Statewide Survey: Californians and Their Government
 PPIC Statewide Survey: ns and Their Government Mark Baldassare Senior Fellow and Survey Director January 2000 Public Policy Institute of The Public Policy Institute of is a private, nonprofit research
Californians & the Environment
 Californians & the Environment Mark Baldassare Dean Bonner Alyssa Dykman Lunna Lopes CONTENTS Press Release 3 2018 Election and Environmental Issues 6 Public Perceptions and Policy Preferences 14 Regional
THE PRESIDENTIAL RACE AND THE DEBATES October 3-5, 2008
 CBS NEWS POLL For Release: Monday, October 6, 2008 6:30 pm (ET) THE PRESIDENTIAL RACE AND THE DEBATES October 3-5, 2008 The race for president has returned to about where it was before the first presidential
PPIC STATEWIDE SURVEY
 PPIC STATEWIDE SURVEY NOVEMBER 2003 Special Survey on Californians and the Environment in collaboration with The William and Flora Hewlett Foundation The James Irvine Foundation The David and Lucile Packard
PPIC Statewide Survey: Special Survey on Land Use part of the Growth, Land Use, and Environment Series
 PPIC Statewide Survey: Special Survey on Land Use part of the Growth, Land Use, and Environment Series in collaboration with the The William and Flora Hewlett Foundation The James Irvine Foundation The
PPIC STATEWIDE SURVEY J U N E
 PPIC STATEWIDE SURVEY J U N E 2 0 0 6 Special Survey of the Central in collaboration with the Great Center Public Policy Institute of California Mark Baldassare Research Director & Survey Director The
THE CANDIDATES FOR VICE PRESIDENT September 12-16, 2008
 CBS NEWS/NEW YORK TIMES POLL FOR RELEASE: Wednesday, September 17 th, 2008 6:30 PM (EDT) THE CANDIDATES FOR VICE PRESIDENT September 12-16, 2008 While Republican Vice Presidential nominee Sarah Palin remains
PPIC Statewide Survey: Californians and Their Government
 PPIC Statewide Survey: Californians and Their Government February 8, 18 Mark Baldassare, Dean Bonner, Alyssa Dykman, Lunna Lopes Supported with funding from the James Irvine Foundation, the California
The President, Congress and Deficit Battles April 15-20, 2011
 CBS NEWS/NEW YORK TIMES POLL For release: Thursday, April 21, 2011 6:30pm (EDT) The President, Congress and Deficit Battles April 15-20, 2011 With the possibility of more spending showdowns between President
2. Do you approve or disapprove of the job Congress is doing? Sep 08 17% 73 9 Democrats 28% Sep 08 23% 68 8 Republicans 10% 87 3
 18 March 2010 Polling was conducted by telephone March 16-17, 2010, in the evenings. The total sample is 900 registered voters nationwide with a margin of error of 3 percentage points. Results are of registered
THE 2004 NATIONAL SURVEY OF LATINOS: POLITICS AND CIVIC PARTICIPATION
 Summary and Chartpack Pew Hispanic Center/Kaiser Family Foundation THE 2004 NATIONAL SURVEY OF LATINOS: POLITICS AND CIVIC PARTICIPATION July 2004 Methodology The Pew Hispanic Center/Kaiser Family Foundation
Public Opinion on Health Care Issues October 2012
 Public Opinion on Health Care Issues October 2012 One week before the 2012 presidential election, health policy issues including Medicare and the Affordable Care Act (ACA) remain a factor in voters views
THE PRESIDENTIAL NOMINATION CONTESTS May 18-23, 2007
 CBS NEWS/NEW YORK TIMES POLL For release: Thursday, May 24, 2007 6:30 P.M. EDT THE PRESIDENTIAL NOMINATION CONTESTS May 18-23, 2007 The current front-runners for their party's Presidential nomination Senator
Frustrated with Congress, Americans See More Gridlock July 18-22, 2013
 CBS News Poll For release: Wednesday, July 24, 2013 6:30 PM ET Frustrated with Congress, Americans See More Gridlock July 18-22, 2013 76% of Americans now disapprove of Congress; 59% say they are frustrated
Rock the Vote September Democratic Strategic Analysis by Celinda Lake, Joshua E. Ulibarri, and Karen M. Emmerson
 Rock the Vote September 2008 Democratic Strategic Analysis by Celinda Lake, Joshua E. Ulibarri, and Karen M. Emmerson Rock the Vote s second Battleground poll shows that young people want change and believe
THE 2008 ELECTION: 1 DAY TO GO October 31 November 2, 2008
 CBS NEWS POLL For Release: Monday, November 3 rd, 2008 3:00 PM (EST) THE 2008 ELECTION: 1 DAY TO GO October 31 November 2, 2008 On the eve of the 2008 presidential election, the CBS News Poll finds the
Grim Views of the Economy, the President and Congress September 10-15, 2011
 CBS NEWS/NEW YORK TIMES POLL For release: Friday, September 16, 2011 6:30 PM EDT Grim Views of the Economy, the President and Congress September 10-15, 2011 72% of Americans think the country is off on
PPIC Statewide Survey: Special Survey on Growth
 PPIC Statewide Survey: Special Survey on Growth Mark Baldassare Senior Fellow and Survey Director May 2001 Part of the Growth, Land Use, and Environment Series In Collaboration with The William and Flora
Preface. The characteristics of groups that are shaping the state's elections and policy debates.
 Preface California is now in the midst of historic changes that will profoundly affect the future of the state. To improve understanding of these changes and their effect on the political status quo, PPIC
THE PRESIDENTIAL RACE HEADING INTO THE FIRST DEBATE September 21-24, 2008
 CBS NEWS/NEW YORK TIMES POLL For release: Thursday, September 25, 2008 6:30 pm (EDT) THE PRESIDENTIAL RACE HEADING INTO THE FIRST DEBATE September 21-24, 2008 There has been no change in the race for President
THE PRESIDENTIAL RACE: MIDSUMMER July 7-14, 2008
 CBS NEWS/NEW YORK TIMES POLL For release: Tuesday July 15, 2008 6:30 P.M. EDT THE PRESIDENTIAL RACE: MIDSUMMER July 7-14, 2008 Democrat Barack Obama now holds a six-point edge over his Republican rival
THE BUSH PRESIDENCY AND THE STATE OF THE UNION January 20-25, 2006
 CBS NEWS/NEW YORK TIMES POLL For release: January 26, 2005 6:30 P.M. THE BUSH PRESIDENCY AND THE STATE OF THE UNION January 20-25, 2006 For the first time in his presidency, George W. Bush will give a
NUMBERS, FACTS AND TRENDS SHAPING THE WORLD. FOR RELEASE September 12, 2014 FOR FURTHER INFORMATION ON THIS REPORT:
 NUMBERS, FACTS AND TRENDS SHAPING THE WORLD FOR RELEASE September 12, 2014 FOR FURTHER INFORMATION ON THIS REPORT: Carroll Doherty, Director of Political Research Jocelyn Kiley, Associate Director Rachel
GOP leads on economy, Democrats on health care, immigration
 FOR RELEASE JUNE 20, 2018 Voters More Focused on Control of Congress and the President Than in Past Midterms GOP leads on economy, Democrats on health care, immigration FOR MEDIA OR OTHER INQUIRIES: Carroll
RECOMMENDED CITATION: Pew Research Center, July, 2016, 2016 Campaign: Strong Interest, Widespread Dissatisfaction
 NUMBERS, FACTS AND TRENDS SHAPING THE WORLD FOR RELEASE JULY 07, 2016 FOR MEDIA OR OTHER INQUIRIES: Carroll Doherty, Director of Political Research Jocelyn Kiley, Associate Director, Research Bridget Johnson,
% LV
 14 October 2010 Polling was conducted by telephone October 11-13, 2010, in the evenings. The total sample is 1200 registered voters nationwide, including 687 likely voters. The sampling error for registered
WISCONSIN ECONOMIC SCORECARD
 RESEARCH BRIEF Q4 2013 Joseph Cera, PhD CUIR Survey Center University of Wisconsin Milwaukee WISCONSIN ECONOMIC SCORECARD The Wisconsin Economic Scorecard is a quarterly poll of Wisconsin residents conducted
These are the highlights of the latest Field Poll completed among a random sample of 997 California registered voters.
 THE FIELD POLL THE INDEPENDENT AND NON-PARTISAN SURVEY OF PUBLIC OPINION ESTABLISHED IN 1947 AS THE CALIFORNIA POLL BY MERVIN FIELD Field Research Corporation 601 California Street, Suite 900 San Francisco,
(READ AND RANDOMIZE LIST)
") 10 December 2009 Polling was conducted by telephone December 8-9, 2009, in the evenings. The total sample is 900 registered voters nationwide with a margin of error of ±3 percentage points. Results are
10 December 2009 Polling was conducted by telephone December 8-9, 2009, in the evenings. The total sample is 900 registered voters nationwide with a margin of error of ±3 percentage points. Results are
Partisans Dug in on Budget, Health Care Impasse
 OCTOBER 7, 2013 Is Debt Ceiling Fix Essential? 47% Yes, 39% No Partisans Dug in on Budget, Health Care Impasse FOR FURTHER INFORMATION CONTACT THE PEW RESEARCH CENTER FOR THE PEOPLE & THE PRESS Michael
2. Do you approve or disapprove of the job Barack Obama is doing on the economy? Approve Disapprove (Don t know) Sep 10 40% 56 Democrats 75%
 Sep 10 40% 56 Democrats 75%") 17 September 2010 Polling was conducted by telephone September 14-16, 2010, in the evenings. The total sample is 900 registered voters nationwide with a margin of sampling error of 3 percentage points.
17 September 2010 Polling was conducted by telephone September 14-16, 2010, in the evenings. The total sample is 900 registered voters nationwide with a margin of sampling error of 3 percentage points.
THE ECONOMY, THE DEFICIT, AND THE PRESIDENT July 24-28, 2009
 CBS NEWS/NEW YORK TIMES POLL For Release: Wednesday, July 29, 2009 6:30 pm (EDT) THE ECONOMY, THE DEFICIT, AND THE PRESIDENT July 24-28, 2009 The economy remains the top concern for Americans, but as the
Public Opinion on Health Care Issues October 2010
 Public Opinion on Health Care Issues October 2010 Kaiser s final Health Tracking Poll before the midterm elections finds few changes in the public s mindset toward health reform. While views on reform
CONGRESS, THE FOLEY FALLOUT AND THE NOVEMBER ELECTIONS October 5 8, 2006
 CBS NEWS/NEW YORK TIMES POLL For release: Monday, October 9, 2006 6:30 P.M. CONGRESS, THE FOLEY FALLOUT AND THE NOVEMBER ELECTIONS October 5 8, 2006 Americans give Republican Congressional leaders terrible
6. 9. How frustrated and upset are you with [ITEM] these days? (RANDOMIZE)
![6. 9. How frustrated and upset are you with [ITEM] these days? (RANDOMIZE)](/thumbs/82/85635278.jpg "6. 9. How frustrated and upset are you with [ITEM] these days? (RANDOMIZE)") 22 April 2010 Polling was conducted by telephone April 20-21, 2010, in the evenings. The total sample is 900 registered voters nationwide with a margin of error of 3 percentage points. Results are of registered
22 April 2010 Polling was conducted by telephone April 20-21, 2010, in the evenings. The total sample is 900 registered voters nationwide with a margin of error of 3 percentage points. Results are of registered
WHITE EVANGELICALS, THE ISSUES AND THE 2008 ELECTION October 12-16, 2007
 CBS NEWS POLL For release: Thursday, October 18, 2007 6:30 PM EDT WHITE EVANGELICALS, THE ISSUES AND THE 2008 ELECTION October 12-16, 2007 Evangelicals have become important supporters of the Republican
Coping with Homeland Security in California: Surveys of City Officials and State Residents
 Occasional Papers Coping with Homeland Security in California: Surveys of City Officials and State Residents Mark Baldassare Public Policy Institute of California Christopher Hoene National League of Cities
TWELVE DAYS TO GO: BARACK OBAMA MAINTAINS DOUBLE-DIGIT LEAD October 19-22, 2008
 CBS NEWS/NEW YORK TIMES POLL For Release: Thursday, October 23, 2008 6:30pm (ET) TWELVE DAYS TO GO: BARACK OBAMA MAINTAINS DOUBLE-DIGIT LEAD October 19-22, 2008 As Barack Obama opens a large lead in voter
Before the Storm: The Presidential Race October 25-28, 2012
 CBS NEWS/NEW YORK TIMES POLL For release: October 30, 2012 6:30 PM EDT Before the Storm: The Presidential Race October 25-28, 2012 In polling conducted before Hurricane Sandy hit the east coast, the presidential
Preface. The characteristics of groups that are shaping the state's elections and policy debates.
 Preface California is now in the midst of historic changes that will profoundly affect the future of the state. To improve understanding of these changes and their effect on the political status quo, PPIC
Obama Maintains Approval Advantage, But GOP Runs Even on Key Issues
 MAY 8, 2013 Two-Thirds Say Obama Fights Hard for His Policies Obama Maintains Approval Advantage, But GOP Runs Even on Key Issues FOR FURTHER INFORMATION CONTACT THE PEW RESEARCH CENTER FOR THE PEOPLE
McCain Pushes Back on Attributes But the Dynamic Holds for Obama
 ABC NEWS/WASHINGTON POST POLL: ELECTION TRACKING #1 EMBARGOED FOR RELEASE AFTER 5 p.m. Monday, Oct. 20, 2008 McCain Pushes Back on Attributes But the Dynamic Holds for Obama John McCain has climbed back
RECOMMENDED CITATION: Pew Research Center, December, 2016, Low Approval of Trump s Transition but Outlook for His Presidency Improves
 NUMBERS, FACTS AND TRENDS SHAPING THE WORLD FOR RELEASE DECEMBER 8, 2016 FOR MEDIA OR OTHER INQUIRIES: Carroll Doherty, Director of Political Research Jocelyn Kiley, Associate Director, Research Bridget
An in-depth examination of North Carolina voter attitudes in important current issues. Registered Voters in North Carolina
 An in-depth examination of North Carolina voter attitudes in important current issues Registered Voters in North Carolina January 21-25, 2018 Table of Contents Key Survey Insights... 3 Satisfaction with
CONTACT: TIM VERCELLOTTI, Ph.D., (732) , EXT. 285; (919) (cell) GIULIANI AND CLINTON LEAD IN NEW JERSEY, BUT DYNAMICS DEFY
 , EXT. 285; (919) (cell) GIULIANI AND CLINTON LEAD IN NEW JERSEY, BUT DYNAMICS DEFY") - Eagleton Poll EMBARGOED UNTIL 9 A.M. EDT AUG. 9, 2007 Aug. 9, 2007 (Release 162-1) CONTACT: TIM VERCELLOTTI, Ph.D., (732) 932-9384, EXT. 285; (919) 812-3452 (cell) GIULIANI AND CLINTON LEAD IN NEW JERSEY,
- Eagleton Poll EMBARGOED UNTIL 9 A.M. EDT AUG. 9, 2007 Aug. 9, 2007 (Release 162-1) CONTACT: TIM VERCELLOTTI, Ph.D., (732) 932-9384, EXT. 285; (919) 812-3452 (cell) GIULIANI AND CLINTON LEAD IN NEW JERSEY,
Instituted in 1911, the statewide initiative process was a Progressive Era reform that
 Public Policy Institute of California The California Initiative Process How Democratic Is It? Instituted in 1911, the statewide initiative process was a Progressive Era reform that allowed citizens to
Do you feel things in the country are going in the right direction, or do you feel things have gotten off on the wrong track? 67% 56% 51% 51% 49% 49%
 THE POLITICO-GW BATTLEGROUND POLL A national survey of 1,000 Registered Likely Voters Do you feel things in the country are going in the right direction, or do you feel things have gotten off on the wrong
PRESIDENT OBAMA AT THE 100-DAY MARK April 22-26, 2009
 CBS NEWS/NEW YORK TIMES POLL For release: Monday, April 27 th, 2009 6:30 p.m. EDT PRESIDENT OBAMA AT THE 100-DAY MARK April 22-26, 2009 President Barack Obama nears the 100 day mark in his presidency with
CALIFORNIA S POST-PARTISAN FUTURE 1 MARK BALDASSARE
 PPIC [ 1 ] CALIFORNIA S POST-PARTISAN FUTURE 1 MARK BALDASSARE In his second inaugural address, Governor Arnold Schwarzenegger surprised the state s partisan political establishment by declaring I believe
Public Preference for a GOP Congress Marks a New Low in Obama s Approval
 ABC NEWS/WASHINGTON POST POLL: Obama and 2014 Politics EMBARGOED FOR RELEASE AFTER 12:01 a.m. Tuesday, April 29, 2014 Public Preference for a GOP Congress Marks a New Low in Obama s Approval Weary of waiting
1. Do you approve or disapprove of the job Barack Obama is doing as president? Republicans 28% Democrats 84% 10 6
 29 October 2009 Polling was conducted by telephone October 27-28, 2009, in the evenings. The total sample is 900 registered voters nationwide with a margin of error of ±3 percentage points. Results are
BLISS INSTITUTE 2006 GENERAL ELECTION SURVEY
 BLISS INSTITUTE 2006 GENERAL ELECTION SURVEY Ray C. Bliss Institute of Applied Politics The University of Akron Executive Summary The Bliss Institute 2006 General Election Survey finds Democrat Ted Strickland
The Republican Race: Trump Remains on Top He ll Get Things Done February 12-16, 2016
 CBS NEWS POLL For release: Thursday, February 18, 2016 7:00 AM EST The Republican Race: Trump Remains on Top He ll Get Things Done February 12-16, 2016 Donald Trump (35%) continues to hold a commanding
RECOMMENDED CITATION: Pew Research Center, February, 2017, In Trump Era, What Partisans Want From Their Congressional Leaders
 NUMBERS, FACTS AND TRENDS SHAPING THE WORLD FOR RELEASE FEBRUARY 22, 2017 FOR MEDIA OR OTHER INQUIRIES: Carroll Doherty, Director of Political Research Jocelyn Kiley, Associate Director, Research Bridget
America s Pre-Inauguration Mood STRONG CONFIDENCE IN OBAMA - COUNTRY SEEN AS LESS POLITICALLY DIVIDED
 NEWS Release 1615 L Street, N.W., Suite 700 Washington, D.C. 20036 Tel (202) 419-4350 Fax (202) 419-4399 FOR IMMEDIATE RELEASE: THURSDAY, January 15, 2009 America s Pre-Inauguration Mood STRONG CONFIDENCE
NATIONALLY, THE RACE BETWEEN CLINTON AND OBAMA TIGHTENS January 30 February 2, 2008
 CBS NEWS POLL For Release: Sunday, February 3, 2008 6:00 PM EDT NATIONALLY, THE RACE BETWEEN CLINTON AND OBAMA TIGHTENS January 30 February 2, 2008 It s now neck and neck nationally between the two Democratic
THE START OF THE OBAMA PRESIDENCY January 11-15, 2009
 CBS NEWS/NEW YORK TIMES POLL For Release: Saturday, January 17, 2009 2:00 pm EST THE START OF THE OBAMA PRESIDENCY January 11-15, 2009 Amid an economic recession, two wars and with an unpopular outgoing
HART/McINTURFF Study # page 1. Interviews: 1000 adults, including 200 reached by cell phone Date: November 11-15, 2010
 HART/McINTURFF Study #101731--page 1 Interviews: 1000 adults, including 200 reached by cell phone Date: November 11-15, 2010 Study #101731 48 Male 52 Female Please note: all results are shown as percentages
SNL Appearance, Wardrobe Flap Register Widely PALIN FATIGUE NOW RIVALS OBAMA FATIGUE
 NEWS Release. 1615 L Street, N.W., Suite 700 Washington, D.C. 20036 Tel (202) 419-4350 Fax (202) 419-4399 FOR IMMEDIATE RELEASE: Wednesday October 29, 2008 FOR FURTHER INFORMATION: Andrew Kohut, Director
NEW HAMPSHIRE: CLINTON PULLS AHEAD OF SANDERS
 Please attribute this information to: Monmouth University Poll West Long Branch, NJ 07764 www.monmouth.edu/polling Follow on Twitter: @MonmouthPoll Released: Tuesday, 3, Contact: PATRICK MURRAY 732-979-6769
2016 GOP Nominating Contest
 2015 Texas Lyceum Poll Executive Summary 2016 Presidential Race, Job Approval & Economy A September 8-21, 2015 survey of adult Texans shows Donald Trump leading U.S. Sen. Ted Cruz 21-16, former U.S. Secretary
It's Still the Economy
 It's Still the Economy County Officials Views on the Economy in 2010 Richard L. Clark, Ph.D Prepared in cooperation with The National Association of Counties Carl Vinson Institute of Government University
RECOMMENDED CITATION: Pew Research Center, May, 2015, Negative Views of New Congress Cross Party Lines
 NUMBERS, FACTS AND TRENDS SHAPING THE WORLD FOR RELEASE MAY 21, 2015 FOR FURTHER INFORMATION ON THIS REPORT: Carroll Doherty, Director of Political Research Jocelyn Kiley, Associate Director, Research
Marist College Institute for Public Opinion Poughkeepsie, NY Phone Fax
 Marist College Institute for Public Opinion Poughkeepsie, NY 12601 Phone 845.575.5050 Fax 845.575.5111 www.maristpoll.marist.edu New Hampshire Presidential Primary EMBARGOED FOR RELEASE: Wednesday 6 p.m.
THE WMUR GRANITE STATE POLL THE UNIVERSITY OF NEW HAMPSHIRE SURVEY CENTER
 THE WMUR GRANITE STATE POLL THE UNIVERSITY OF NEW HAMPSHIRE SURVEY CENTER August 19, 2014 TIGHT RACES IN BOTH NH CONGRESSIONAL DISTRICTS By: Andrew E. Smith, Ph.D. Zachary S. Azem, M.A. UNH Survey Center