Voter and non-voter survey report
|
|
|
- Deirdre Hancock
- 5 years ago
- Views:
Transcription


1 Voter and non-voter survey report Proposal prepared for: Colmar Brunton contact The Electoral Commission Ian Binnie Date: 27 February 2012 Level 1, 6-10 The Strand PO Box Takapuna 0740 Auckland. Ph Level 9, Sybase House, Lambton Quay PO Box 3622, Wellington Ph:
2 Table of Contents Executive Summary... 6 Background and method... 6 Knowledge of the Referendum... 6 Voting behaviour... 7 EasyVote pack... 8 Advertising and information... 8 Getting to the polling place Polling place experience Rating the polling place Rating the Parliamentary voting paper Rating the Referendum voting paper Rating Election staff Overall satisfaction with the voting experience Election night results Non-voters Conclusions Background and Objectives Methodology Questionnaire Sample design and weighting for the survey with general public, and Sample design for and respondents Quota targets on key groups of interest Weighting Response rate, final sample sizes and margins of error Notes on reading this report Voting behaviour Was the first Election that people were eligible to vote in? Previous Election Past voting behaviour Advance voting Special voting Knowledge of the Referendum Awareness of the Referendum Confidence in making a decision in the Referendum Level of knowledge about the Referendum Page 2
3 Knowledge that Referendum would be held at the same time as the General Election Knowledge that the Referendum would ask about keeping MMP Knowledge that the Referendum would ask about a preferred voting system Knowledge of both Referendum questions (keeping MMP and preferred voting system) Knowledge of the voting systems that would be listed in the Referendum Knowledge about the consequence of a no-change vote Knowledge about the consequence of a vote for change General knowledge of different voting systems Referendum Advertising Referendum advertising/information awareness Message recall from Referendum information or advertising Satisfaction with Referendum information or advertising Electoral advertising Awareness of Electoral advertising Type of advertising recalled Unprompted message recall of electoral advertising message recall of electoral advertising Usefulness of different mediums of advertising Additional information that respondents would like to see Further analysis on those who wanted more information on the Referendum voting systems Yes I voted stickers Whether information came at the right time before the Election EasyVote pack Receiving the EasyVote pack Reading the EasyVote pack Ease of finding the EasyVote card Use of EasyVote card or CEO letter when voting Satisfaction with the EasyVote pack Getting to the polling place Voting away from the polling place Polling place location Accompaniment to the polling place Voted at same polling place as last Election? Non-voters awareness of a convenient polling place Source of information about polling place location Polling place experience Time of day voted at polling place Page 3
4 Queues at polling place Time taken at polling place Feelings on time taken at polling place Overview of how the polling place was rated by respondents Rating the convenience of location Rating the signage outside Rating the physical layout Rating where to place completed ballot paper Rating the access to exit Rating the equipment in booths Rating the signage inside Rating the sense of privacy Rating the ease of identifying Election staff Other aspects of the voting experience Overview of how the ballot paper was rated by voters Rating the ease of finding name of person and party Rating the clarity of instructions on how to cast vote Rating layout of ballot paper Overview of how the Referendum voting paper was rated by voters Rating the ease of finding the options Rating the layout Rating the clarity of instructions Referring to the Referendum information table Overview of how Election staff were rated by voters Rating pleasantness and politeness Rating staff efficiency Rating ability to answer questions Polling place problems Description of polling place issues Overall satisfaction of voting experience Election night results Watching results as they came in How were results followed? Timeliness of results Non-voters Possibility of voting in Election When decided not to vote Page 4
5 ision making process Reasons for not voting Factors that influence voting Appendix A: Overview tables Overview: Voters and non-voters Overview: voters and non-voters Overview: voters and non-voters Overview: voters and non-voters Overview: voters and non-voters Appendix B: Sample profile Page 5
6 Executive Summary Background and method The Electoral Commission commissioned Colmar Brunton to conduct a survey with voters and non-voters in. Similar surveys were conducted on behalf of the Chief Electoral Office in 2002, 2005, and. The primary objectives of the survey are to: ascertain voter satisfaction with the services the Electoral Commission provides, and to understand what the barriers to voting are, and how to address these for each identified population group. The survey also included a further objective which was to ascertain levels of understanding about the Referendum on the voting system. The research involved a telephone survey with voters and non-voters, with a boosted sample for those aged and. Face-to-face surveys were conducted to boost the number of interviews conducted with and respondents. A separate report will be produced for disabled respondents. 1,097 interviews were conducted with voters (giving a maximum margin of error of +/- 3.0%). 272 interviews were conducted with non-voters (giving a maximum margin of error of +/- 5.9%). Significant changes since are highlighted in this summary and the main report where relevant. Knowledge of the Referendum The Electoral Commission commissioned a separate survey about knowledge of the Referendum in before the Electoral Commission s Referendum information campaign was launched. Some of the same questions about knowledge of the Referendum were repeated in the post-election survey of voters and nonvoters (reported here). Although most of this report is divided into separate sections for voters and nonvoters, questions on the Referendum combine both voters and non-voters so that results can be compared with the survey. Awareness and confidence In total 87% of respondents were aware that the Referendum was going to occur. This compares with 45% of respondents in (before the Electoral Commission s Referendum information campaign began). Voters were more likely be aware of the Referendum (93%), whereas non-voters were less likely be aware of the Referendum (66%). 65% of those aware of the Referendum said they knew a lot or a moderate amount about the Referendum. This equates to 57% of the general public (including those who were unaware of the Referendum). Knowledge was higher among voters who were aware of the Referendum (72% vs. 32% of non-voters aware of the Referendum). 77% of those aware of the Referendum felt either very confident or fairly confident about making a decision in the Referendum. This equates to 67% of the general public (including those who were unaware of the Referendum). Voters who were aware of the Referendum were more likely to be very confident or fairly confident compared to non-voters who were aware of the Referendum (81% vs. 57%). Page 6
7 Knowledge of the Referendum questions and options Respondents who were aware of the Referendum were asked if they knew that the Referendum would ask about keeping the present MMP voting system or not. In total 82% of those aware of the Referendum said they knew this. This equates to 71% of the general public (including those who were unaware of the Referendum). Voters who were aware of the Referendum were more likely to say they knew this, compared to non-voters who were aware of the Referendum (84% vs. 67%). Respondents who were aware of the Referendum were asked if they knew that the Referendum would ask what voting system they prefer. In total 82% of those aware of the Referendum said they knew this. This equates to 72% of the general public (including those who were unaware of the Referendum). Voters who were aware of the Referendum were more likely to say they knew this, compared to non-voters who were aware of the Referendum (84% vs. 71%). Respondents who were aware of the Referendum were asked if they had heard what alternative voting systems would be listed in the Referendum. In total 58% of those aware of the Referendum (or 51% of the general public) could spontaneously mention at least one of the voting systems listed in the Referendum. Voters who were aware of the Referendum were more likely to be able to name one or more of the voting systems, compared to non-voters who were aware of the Referendum (65% vs. 26%). Knowledge of the consequences Respondents who were aware of the Referendum were asked if they knew that if most people voted to keep MMP, that there would be an independent review of the way it works. In total 60% of those aware of the Referendum said they knew this. This equates to 53% of the general public (including those who were unaware of the Referendum). Voters who were aware of the Referendum were more likely to say they knew this, compared to non-voters who were aware of the Referendum (63% vs. 45%). Respondents who were aware of the Referendum were asked if they knew that if most people voted for a change of system, Parliament would then decide if there would be another Referendum to choose between MMP and the most popular alternative. In total 76% of those aware of the Referendum said they knew this. This equates to 66% of the general public (including those who were unaware of the Referendum). Voters who were aware of the Referendum were more likely to say they knew this (81% vs. 52% of non-voters who were aware of the Referendum). Voting behaviour 9% of voters, and 22% of non-voters, said the General Election was the first one they had been eligible to vote in. Likewise, 74% of young voters, and 60% of young non-voters, said this was their first Election in which they could vote. The proportion of non-voters that were eligible to vote for the first time has increased since (from 15% to 22%). Nearly all (96%) voters in the General Election who were also eligible to vote in the General Election said they voted in both Elections. 60% of non-voters (in the Election) who were eligible to vote in the Election said they voted in the Election. The majority of voters said they vote in every General Election (76%), with the remainder voting in most (19%) or some (5%) General Elections. Conversely, 42% of non-voters said they vote in most General Elections, with 29% voting in some and 28% not having voted in any General Election. Page 7
8 16% of voters voted in advance of Election Day this has increased from 9% in 1. Around two-thirds (63%) of non-voters were aware that they could cast their vote before Election Day (this is similar to the finding). 59% of non-voters who were unaware of the option to vote in advance said they would have voted if they had known about this option (this is similar to the finding). 5% of voters cast a special vote 2. EasyVote pack Virtually all (96%) voters, and 77% of non-voters, recalled receiving the EasyVote pack. The proportion of voters who recall receiving the pack in is lower than in (when it was 98%). 76% of voters, and 49% of non-voters, who received the pack read all, most or some of the EasyVote pack. 24% of voters, and 50% of non-voters who received the pack only glanced at it or didn t read it. Young voters and voters who received the pack were less likely to read most of it or all of it (47% and 28% respectively, compared with 54% of all voters). Nearly all (96%) voters, and 81% of non-voters, who received the pack, and read it, said it was easy to find the EasyVote card. Use of the EasyVote card (86%) is similar to (when it was 88%). 88% of voters who received the EasyVote pack were satisfied with it (this is slightly lower than in when it was 92%). Satisfaction is notably lower among non-voters (compared with voters) at 58%. Advertising and information Referendum advertising 79% of voters were aware of advertising or information about the Referendum, awareness among nonvoters was only slightly lower (at 74%). (In total 78% of the public, including voters and non-voters, were aware). 89% of those aware of the Referendum advertising recall messages telling them that the Referendum was on, 71% recall messages telling them the two questions in the Referendum, 69% recall messages telling them the voting system options in the Referendum and 62% recall messages telling them what would happen as a result of the Referendum. Voters were more likely to recall all four messages (91%, 76%, 72% and 66% respectively). 51% of voters were satisfied with the Referendum information they received and 26% of non-voters were satisfied (46% of the public, including voters and non-voters, were satisfied). 1 The official proportion of all registered voters who voted in advance was found to be 14.2% in (whereas the survey estimate was higher at 16%). People may vote in advance for a number of reasons (including if they are away from home or going overseas). 2 The official proportion of special votes cast in the General Election was 11.6%. People may cast a special vote for a number of reasons (including if they are infirm or in hospital). As with previous voter and non-voter satisfaction surveys, the survey underrepresents those who cast special votes. This is likely due to the sample for this research being drawn from the electoral roll as at Writ Day. People listed on the Writ Day roll are able to cast an ordinary vote if they vote at a polling place or advance voting place within their own electorate, whereas those who enrol after Writ Day must cast a special vote. A separate piece of research was commissioned by the Electoral Commission to report on the experience of voters and non-voters with a disability. Page 8
9 Electoral advertising recall 64% of voters and 57% of non-voters recalled seeing or hearing advertising or information about the voting process in the lead up to the Election (this question was asked in the context of additional voting information beyond the Referendum although not everyone interpreted it this way). Recall of voting process advertising in was lower than in (when it was 81% and 74% respectively). Among voters, unprompted recall of advertising was highest for television (66%), followed by newspapers (35%), pamphlets and fliers (22%) and radio (18%). Since, there have been significant decreases in unprompted voter awareness of television advertising (down 23 points) and radio advertising (down 7 points). However, there have been significant increases in unprompted voter awareness of newspaper advertising (up 10 points), pamphlets or fliers (up 17 points), Internet advertising (up 8 points), and the EasyVote material (up six points). Unprompted recall among non-voters tended to be lower than among voters, but covers similar sources with 70% recalling television advertising, 18% recalling newspaper advertising, 18% recalling pamphlets or fliers, and 16% recalling radio advertising. Among non-voters who had seen or heard some advertising, there has been a significant decrease in television advertising awareness (down 14 points from ), but an increases in recall of pamphlets or flyers (up 16 points). Message take-out Among voters who had seen or heard the advertising, the most common messages recalled were telling us how to vote (35%), information about the Referendum (33%), and getting enrolled (18%). Since, there have been a number of significant changes in unprompted recall of the messages conveyed (among those aware of Electoral advertising). Recall of the messages about how to vote has gone up (up 17 points). Conversely, messages encouraging people to enrol and to use the EasyVote card have decreased (down 19 points and 8 points respectively). Message take-out was weaker among non-voters. However, the top messages recalled were similar. Without prompting, the most commonly recalled messages relate to telling people how to vote (32%) and the Referendum (16%). 11% also recalled candidate information. When prompted, recall of the key messages was higher among voters compared with non-voters: o o o Voting in advance if you re going away on Election Day (75% of voters and 54% of non-voters). Although recall of this message among non-voters is higher than the equivalent result in (when it was 45%). Using the EasyVote card when going to vote (75% of voters and 53% of non-voters). This is higher than the equivalent results in (which were 58% and 42% respectively). Voting close to home (65% of voters and 55% of non-voters). This is higher than the equivalent results in (which were 52% and 43% respectively). Perceived usefulness of sources Respondents were asked to rate the various sources of advertising on a scale of 1 to 5 where 1 was not useful at all and 5 was very useful. Of the sources reasonable numbers of voters were aware of, pamphlets or fliers and the Internet were regarded as the most useful (76% and 70% respectively rated these sources as a 4 or 5 out of 5). These have seen increases in the proportion of voters rating them as useful since (when the equivalent results were 52% for each source). Other useful information sources include radio (57%), the newspapers (57%), and television advertising (54%). Page 9
10 Non-voters were generally less likely to find advertising useful (compared with voters). Of the sources reasonable numbers of non-voters were aware of, television advertising (48%) and pamphlets or fliers (41%) were seen as being the most useful. Requests for additional information When asked whether there was any additional information about voting they would have liked, large proportions of voters (54%), and non-voters (39%), said they required no further information. However, the proportion that wanted additional information has significantly increased since (in the proportion not requesting further information was much higher at 79% and 65% respectively). The most common suggestion made by both voters and non-voters was for more information about the Referendum voting systems (26% of voters and 20% of non-voters requested this). 8% of voters and 13% of non-voters also wanted more information on the Referendum voting process. The main report contains more analysis on the respondents that requested more information about the Referendum voting systems (this analysis combines voters and non-voters to compare differences within the general population). Three key findings are that: o o o Those who had seen or heard general information or advertising about the Referendum, but had not heard the specific message about the voting system options were more likely to want more information about the voting systems (33%, compared with 23% of those who were not aware of any Referendum information and 17% of those who recalled messages about the Referendum voting system options). The likelihood to want to know more was also strongly associated with age and income (younger individuals and those from higher income were more likely to want more information). Those aged or were particularly likely to request more information about the voting systems (33% and 30% compared to 19% of all other age groups). Also those from higher income households were more likely to request more information (32% of respondents from households with an income of $100,000 or more, compared to 19% of those from lower income households). The extent to which someone read the EasyVote pack had no influence on someone s chances of requesting more information about the Referendum voting systems. Timing of information Most people felt that the advertising and information provided on the Referendum and the General Election came at the right time. In total 75% of people thought the advertising came at about the right time, 4% thought it was too early, 17% thought it was too close to the Election and 4% said don t know. Yes I voted stickers Around four in ten (37%) voters took Yes I voted stickers after they voted. 36% of voters thought that the Yes I voted sticker would prompt people to vote, this is lower than in when it was 51%. Only 13% of non-voters saw someone wearing a Yes I voted sticker on Election Day this is lower than in when it was 25%. Page 10
11 Getting to the polling place Most voters went to the polling place with other family members (63%). Just under a third of voters (32%) attended the polling place by themselves. Young voters were more likely than average to attend the polling place with non-family members. This finding is not different from the survey. Just over half (51%) of repeat voters voted in the same place as last Election. This finding is not different from the survey. As in, the most common source of knowledge about polling place location was the EasyVote pack or something received in the mail (45%). 27% said they knew from signs (up from 23% in 2007) and 26% said they knew the location because they had voted there in the past (similar to the equivalent proportion in ). and voters were more likely to find out about the location of the polling place from others, such as family, friends, or workmates (48% and 22% respectively). voters more likely to say they knew because they had voted there in the past (38%) or because they were driving/walking past (19%). voters were more likely to say they knew from their EasyVote pack / something in the mail (54%). Most (85%) non-voters knew the location of a polling place that was convenient for them (which is unchanged from ). Non-voters were most likely to find out about the location of the polling place through family, friends, or workmates (25%) and signs or signage (26%). Polling place experience 40% of people voted in the morning (i.e. up to, and including, noon), 50% of people voted in the afternoon (between noon and up to, and including, 5pm), and 9% voted after 5pm. Since there has been a decrease in the proportion voting in the morning, and an increase in the proportion voting in the afternoon (in 46% voted up until noon, 45% voted between noon and 5pm, and 8% voted after 5pm). Most voters who went to a polling place did not have to queue (89%) which is higher than the proportion in (when it was 79%). Voters who went to a polling place were asked how long they spent at the polling place in total. Most (63%) said they only spent up to five minutes. This is lower than the equivalent result from the survey (71%). This is interesting given that fewer voters perceived that they had to queue (see result above), and may reflect the time taken to complete a Parliamentary and Referendum voting paper (rather than the time taken in a queue). Voters were asked how they felt about the amount of time they had spent at the polling place. As in, nearly all (98%) felt that the time they had spent at the polling place was reasonable given what they had to do. Rating the polling place There has been an increase in the proportion giving positive ratings (a four or five out of five) for how obvious it was where to place completed voting papers (from 89% in to 92% in ). Other questions about the polling place show no significant differences between and in the proportion giving a four or five out of five. These include: o o o Convenience of polling place location (97% positive rating) Ease of access to exit after voting (97% positive rating) How well-equipped polling booth was with pens that worked etc. (97% positive rating) Page 11
12 o o o o o o How easy it was to identify Election staff (94% positive rating) Physical layout of polling place (93% positive rating) How obvious it was where to place completed ballot paper (92% positive rating) Privacy felt while casting votes (89% positive rating) Signs outside to indicate it was a polling place (89% positive rating) Signs inside directing you where to vote (88% positive rating). As in, younger voters were generally less likely to give excellent ratings (five out of five) for a number of polling place statements (including signs outside, signs inside, physical layout, privacy, booth equipment and ease of identifying staff - with a significant portion preferring to rate their experience as 4 out of 5 for these aspects). As in, the majority of voters (90%) did not experience any issues at the polling place. However, the proportion of voters that had problems or difficulties was larger in than in (6% vs. 2%). In particular the proportion of voters that had problems or difficulties was much larger (21% vs. 2%). Voters who did experience problems or difficulties, or had to ask for information or help were asked what happened. Two common issues were: needing help to understand the Referendum voting paper (21% of those who encountered problems or asked for help) and needing more information on Referendum voting systems (13%). Both of these answers were not relevant to when there was no Referendum. Other common issues include poor signage/directions (15%) and requesting information about how to vote (11%). Rating the Parliamentary voting paper Satisfaction with the Parliamentary voting paper remains similar to. Most voters were likely to rate the ballot paper as four or five out of five on the following statements: o o o Ease of finding name of person and party (95% positive rating) Clear instructions on how to cast vote (94% positive rating) Layout of ballot paper (91% positive rating). Rating the Referendum voting paper Satisfaction with the Referendum voting paper was slightly lower than satisfaction with the Parliamentary voting paper, but most voters were likely to rate the Referendum voting paper as four or five out of five on the following statements: o o o Ease of finding the options (90% positive rating) Layout (86% positive rating) Clear instructions (83% positive rating). Rating Election staff Satisfaction with Election staff remains very similar to. Most voters were likely to rate Election staff as four or five out of five on the following statements: o o o Pleasantness and politeness (98% positive rating) Efficiency (97% positive rating) Ability to answer questions (96% positive rating) Page 12
13 The majority of all of the key subgroups rated staff as excellent, however some were somewhat less likely to rate staff as excellent: o Although three-quarters of and voters rated the pleasantness of staff as excellent this was lower than average (76% and 75% respectively compared with 89% of all voters). o As in, young voters were less likely to rate the efficiency of Election staff as excellent (79% compared with 85% of all voters). In voters were less likely to rate the staff efficiency as excellent (76%). o and voters were less likely to rate staffs ability to answer questions as excellent (76% and 73% compared with 84% of all voters). Overall satisfaction with the voting experience 88% of voters were satisfied (35% gave a 4 out of 5 for satisfaction and 53% gave a 5 out of 5, or excellent, rating). voters were more likely to be satisfied overall (94% either scored 4 or 5 out of 5 compared with 88% on average). voters were less likely to be satisfied overall (70% vs. 88% average). Young voters were less likely to be very satisfied (36% scored 5 out of 5, compared to 53% on average). Similarly voters were less likely to be very satisfied (41%). Election night results 70% of voters followed the results as they came in on Election night, this is similar to (when it was 72%). As in, non-voters were less likely to follow the results (33% - which is significantly lower than in when 47% of non-voters watched). As in, nearly all voters who followed the results said they watched the results come in on television (93%). voters were less likely to say they saw the results on television (87%), whereas voters were more likely to follow the results on television (99%). Overall, most voters (87%) were either very satisfied (53%) or satisfied (35%) with the timeliness of the results. This level of satisfaction among voters (87% gave a 4 or 5 out of 5 for satisfaction with the timeliness of results) is not significantly different from the equivalent finding in (when 90% were satisfied). 77% of non-voters who followed the results were either very satisfied (51%) or satisfied (25%) with the timeliness of the results. This is lower than satisfaction among voters. Satisfaction is similar to (when 78% of non-voters were either very satisfied or satisfied). Non-voters Non-voters were asked if there was any time before the Election when they thought they might vote in this Election. Over two-thirds (64%) of non-voters had considered voting in this Election, this was higher for non-voters (83%). These figures are not significantly different from the equivalent figures in. Non-voters were asked at what time before Election Day they decided not to vote. Similar to, under half (43%) of non-voters decided on Election Day that they would not vote, this was higher for nonvoters (64%). Page 13
14 Non-voters were asked how much thought they put into their decision not to vote. 41% put just a little though into it, and 29% didn t think about it at all. These results are similar to. Young non-voters were more likely to say they put just a little thought into it (54%). and non-voters were more likely to not think about it at all (45% and 48% respectively). The main overall reasons for not voting were that they had other commitments (14%) or work commitments (9%), could not be bothered voting (14%), couldn t work out who to vote for (11%) and that their vote would not make a difference (8%). These results are similar to. Young non-voters were more likely to say they didn t know the candidates (10% vs. 4% for all non-voters). non-voters were more likely to say they had other commitments (25% vs. 14%). non-voters were more likely to say their vote did not make any difference (38% vs. 8%), they didn t know the candidates (19% vs. 4%), or that they forgot (26% vs. 5%). non-voters were more likely to say it was because they were away from home and overseas (19% vs. 6%). The factors that had the highest proportions of non-voters saying the impact was 4 or 5 out of 5 were I don t trust politicians (33% of all non-voters) and it was obvious who would win so why bother (31%), and I m just not interested in politics (29%). Since there has been an increase in the proportion of non-voters saying it was obvious who would win so why bother (from 19% to 31%). Conclusions The survey suggests continuing high satisfaction with the services provided by the Electoral Commission, with around nine in ten voters giving positive scores for the EasyVote pack, the polling place, Parliamentary voting papers, and Election staff. Only minor changes occurred between and, including: a slight reduction in satisfaction with the EasyVote pack, a slight increase in the proportion saying it was obvious where to place completed ballot papers. Ratings for the Referendum voting paper were lower than the equivalent ratings for the Parliamentary voting paper, particularly around the clarity of instructions. However, the majority (around 8 in 10) still gave positive ratings for the Referendum ballot paper. Although the majority were aware of the Referendum, and had a good level of understanding about what the Referendum entailed, a notable proportion of voters and non-voters wanted more information about the voting systems (a quarter of voters and a fifth of non-voters specifically requested this). Around one-in-ten also requested more information on the Referendum voting process. These people were more likely to rate the Referendum ballot paper negatively, and were also less satisfied with the information provided about the Referendum. This group contained a notable proportion of people from higher income households, and many of them were unaware of the campaign message about the voting system options (although often they were aware of other Referendum information). Although some voters were not satisfied with the Referendum information they received, and some did not rate the Referendum voting paper positively, this did not translate into negative sentiment about the core services provided by Electoral Commission at the polling place (as mentioned above there were no decreases in ratings for the service received at the polling place). The majority of voters and non-voters were aware of advertising about the Referendum. The majority also recalled advertising about the voting process, although awareness levels were significantly lower than in. Since there has been an increase in consumption, and satisfaction with, electoral information provided over the Internet, and a decrease in consumption, and satisfaction with, electoral information provided on the television. Page 14
15 Background and Objectives The Electoral Commission is responsible for the administration of parliamentary Elections and referenda, advising Ministers and Select Committees of Parliament on electoral matters, and supporting the Representation Commission in its determination of electoral boundaries. To ensure its service is appropriate to legal and political requirements, and to the electorate, the Electoral Commission undertakes a voter and non-voter survey following each General Election. The primary objectives of the survey are to: ascertain voter satisfaction with the services the Electoral Commission provides, and to understand what the barriers to voting are, and how to address these for each identified population group. The survey also included a further objective which was to ascertain levels of understanding about the Referendum on the voting system. The Electoral Commission commissioned Colmar Brunton to conduct a survey with voters and non-voters in. Similar surveys were conducted on behalf of the Chief Electoral Office in 2005, and. Where possible this report includes comparisons of the results against the 2005 and results. Some of the groups of particular interest to the Electoral Commission are those people who identify themselves primarily as: Those aged 18-24, and People with disabilities. This report includes results for all of these groups apart from people with disabilities (which will be covered in a separate report). Page 15
16 Methodology This research project comprised different parts, each designed to provide information about a particular subpopulation of interest. The different parts of the survey include: Element of the survey Core survey of voters and nonvoters booster survey Purpose Methodology Final unweighted sample size Representative of all eligible voters in New Zealand (including those who voted and did not vote at the General Election). Specifically designed to collect the views of voters and non-voters, so that, when combined with the core survey, a reasonable sample size of the population is available for analysis. CATI (Computer Assisted Telephone Interviewing) 1,369 CATI 302 booster survey Specifically designed to collect the views of year old voters and year old non-voters, so that, when combined with the core survey, a reasonable sample size of the population is available for analysis. CATI 387 booster survey Specifically designed to collect the views of voters and non-voters, so that, when combined with the core survey, a reasonable sample size of the population is available for analysis. F2F (Face to face interviewing) supplemented by respondents from the core survey from core survey=156 total booster survey Specifically designed to collect the views of voters and non-voters, so that, when combined with the core survey, a reasonable sample size of the population is available for analysis. F2F supplemented by respondents from the core survey from core survey= 141 total Disabled boost Specifically designed to collect the views of voters and non-voters with disabilities, so that, when combined with the core survey, a reasonable sample size of the disabled population is available for analysis. Information on the disabled boost will be included in a separate report. Online data collection through Colmar Brunton s online research panel supplemented by disabled respondents from the core survey Disabled report will outline the sample size for disabled respondents The core survey collected data for the general population of voters and non-voters. This survey was conducted using Computer Assisted Telephone Interviewing (CATI). The CATI survey also involved additional booster samples for the population and the year old population. Boosts for the and Page 16
17 populations were completed by face-to-face interviewing. Generally speaking, face to face interviewing is a more effective approach with these populations. Survey fieldwork commenced the day after the General Election on 27 November. All survey fieldwork was completed on 18 ember. Questionnaire Two questionnaires were developed to meet the research objectives, one for voters and one for non-voters. The questionnaire was based upon previous questionnaires used by the Chief Electoral Office for post-election surveys. A new section on awareness and understanding of the Referendum on voting systems was added in. The draft questionnaires were piloted with 30 respondents (including a mixture of voters and non-voters) in September. Some refinements were made to the design before the main stage of fieldwork. The final overall interview length was 17 minutes for voters and 14 minutes for non-voters. Sample design and weighting for the survey with general public, and Sample frame for core telephone survey This survey targeted voters and non-voters in the general public, and included boosters for young voters and non-voters (aged 18-24) and voters and non-voters. The electoral roll was used as a sample frame for the survey. It should be noted that the electoral roll contains people who have enrolled to vote. The following people are eligible to be on the electoral roll: those aged eighteen years or older, and are New Zealand citizens or permanent residents, and have lived in New Zealand for a year or more without leaving the country, and are not disqualified under the Electoral Act 1993 from enrolling. Potential respondents were randomly selected from the electoral roll (the General roll and the roll). Respondents for the boost were selected from those who identified themselves as being of descent on the General roll or the roll. Respondents for the boost were selected from those in the age bands and on the electoral roll. Due to broad age-bands being allocated to people on the roll (rather than exact ages), there was no way to specifically select those aged year olds at the sampling stage. Instead we over-selected all those aged at the sampling stage and asked those aged between 21 and 26 for their exact age in the questionnaire. This information was then used to allocate respondents to the boost (or not if they were too old). Survey weighting was applied to the final results to re-adjust for the booster sampling (see later in this section for details). Page 17
18 Potential respondents were then telematched to identify telephone numbers. The telematch success rate (i.e. numbers identified divided by all potential respondents selected) was 26%. This is broadly similar to other telephone matching exercises Colmar Brunton have completed recently. It should be noted that telephone match rates have declined in recent years mainly due to decreasing number of telephone numbers being published to lists, increasing numbers of people opting-out of phone lists, increased use of mobile phones in place of land-lines, and people taking their phone numbers with them when they move address. Pre-notification letters stage 6,603 potential respondents were then selected at random from the General and rolls and sent prenotification letters written by the Electoral Commission. In addition to this core survey sample, prenotification letters were also issued to 1,016 people identifying themselves as, and 1, year olds (see above for how we specifically identified year olds for the sample ). Letters were issued two weeks prior to fieldwork being conducted. This letter explained the purpose of the survey and described fieldwork dates. It also reassured respondents that the research was voluntary and conducted in complete confidence. An 0800 number was included for those who wanted to opt-out of the research. In total, Colmar Brunton received 441 opt-outs after letters were issued, this was taken into account in the response rate calculation (detailed shortly). Those who did not opt out formed the core survey sample which was made available for interviewers at the fieldwork stage. Sample design for and respondents Data on and respondents was gathered through the core telephone survey (described above), but supplemented by additional face-to-face interviews. Face-to-face interviews were conducted in areas with high density and populations. This involved interviewing in Meshblocks where the 2006 Census indicated a density of 20% or greater and population. Interviewers only sought data from those who were eligible to vote in the General Election. Data from the additional face-to-face interviews allows an increase in the robustness of the and sub-samples for purposes of comparison. However the additional data was not re-merged back into the core telephone survey data (which remains representative of the general public, and does include those and respondents who were contacted by telephone). Page 18
19 Quota targets on key groups of interest The survey was designed to ensure a minimum number of interviews from key groups. Therefore the following quota targets were established, to ensure the survey achieved a minimum of: 250 respondents 350 respondents 120 respondents 120 respondents 20% of all respondents to be non-voters. In all cases Colmar Brunton met, or exceeded, these quota targets. Appendix B contains a description of the sample profile, in terms of numbers of interviews conducted with key subgroups. Weighting Results were weighted using age-band and vs. non- status from the Electoral Roll. This weighting ensures that the booster populations ( and ) are not over-represented in the survey results. Further weighting by ethnicity (based on 2006 Census data) adjusted the ethnic composition of the final data set and ensured that the and respondents selected in the booster survey were not overrepresented in the final survey results. Questions on the Referendum on voting systems required data from voters and non-voters to be merged so that the data could be compared with a previous general public survey about the Referendum conducted in (before the General Election). For these questions the weighting scheme from the previous Referendum survey conducted in was re-used. This ensures that results are comparable between the pre-election Referendum surveys and the post-election Referendum questions contained in this current survey (and reassures us that differences are not a result of differences in the weighting regime). The weighting regime used for the Referendum questions re-adjusts the survey data so that it is representative of the New Zealand population by age, gender, ethnicity and whether or not the respondent voted in the General Election. Census 2006 data was used to set the weighting ratios for age, gender and ethnicity, whereas administrative data on voting turnout from the General Election survey was used to weight those who said they voted (or didn t vote) in the General Election. The reason for using voting turnout at the General Election as a weighting variable was that this information was available from respondents in the pre-election Referendum survey and also from respondents in the post-election survey (whereas whether or not the respondent had voted in was obviously not available prior to the General Election). Response rate, final sample sizes and margins of error In total the telephone survey achieved a response rate of 36%, the face-to-face survey with and respondents achieved a response rate of 65%. The main reason for non-response was refusal to participate, the remainder of non-response is accounted for by those who were not contactable after six or more phone calls (around 77% of non response related to refusals, and 21% related to non-contact). Page 19
20 As illustrated in the table below, the final sample size for the survey was 1,369. Sample sizes, and accompanying margins of error for other key sub-populations are also presented below. Each row displays the unweighted number of respondents. This represents the raw number of people interviewed in each category before weighting is applied, and is a useful indicator of the robustness of analysis for a particular subgroup. These numbers are used to calculate the margins of error for each group. Population Un-weighted sample size Margin of error* number of respondents 1,369 +/- 2.6% Voters 1,097 +/- 3.0% Non-voters 272 +/- 5.9% (18-24 year olds) 387 +/- 5.0% respondents 302 +/- 5.6% 141 +/- 8.3% 156 +/- 7.8% * These maximum margins of error are at the 95% confidence interval, and assume a 50/50 split within the population on the question of interest. Each variable has its own unique margin of error, margins decrease the closer the proportion of responses are to 0 or 100. Notes on reading this report Most of this report is divided into separate sections for voters and non-voters. Voters are survey respondents who say they voted in the General Election, and non-voters are respondents who were eligible to vote in the General Election, but told us they did not vote. Percentages reported are based on the weighted data. Base sizes in graphs represent the unweighted number of respondents answering that question (and give an indication of robustness of analysis for that particular question). Percentages do not always add up to 100% on single coded choice questions due to rounding. In tables - equates to zero (or no respondents), and * equates to less than 1% of respondents. When a cell in a table states N/A this means that the question was not asked in this way in and so a direct comparison with the response is not possible. Whenever results for are presented in this report, this is based upon all those who identified themselves as being in the survey (which may or may not correspond to how they were identified on the Electoral Roll). Whenever results for young voters are presented in this report, this is based upon all those aged (based upon data from the Electoral Roll) plus those who said they were 21, 22, 23 or 24 in the survey interview (i.e. young voters = year olds). Whenever results for or respondents are presented this represents all or respondents from the core telephone survey and the face-to-face booster surveys. Page 20
21 In general, analytical commentary on the proportion of voters, non-voters,,, and is found above each table. Additional subgroup analysis (for example analysis by income or gender) is then found underneath each table. If there is no subgroup analysis found underneath the table this is because there were no statistically significant differences between subgroups for that particular survey question. Results for the total population of voters surveyed, and total population of non-voters surveyed are often compared with the equivalent results from the survey. In cases where there is a significant difference between the results, the results, and the 2005 results, a commentary on the overall result from 2005 is also included so that possible long-term trends can be highlighted. Unless otherwise stated, all reported differences between proportions are statistically significant at the 95% confidence level or greater. Analysis by the Christchurch area In the Electoral Commission provided modified voting services in Christchurch due the earthquake. These services were provided and promoted in Christchurch Central, Christchurch East, Ilam, Port Hills, Selwyn, Waimakariri and Wigram (as well as to people enrolled in Te Tai Tonga electorate within the boundaries of those Christchurch General electorates). This report draws out any significant differences between this area and the national survey results (significant differences, where they exist, are listed underneath each table). Page 21
22 Voting behaviour Was the first Election that people were eligible to vote in? Voters Nine percent of voters said this was the first New Zealand General Election they had been eligible to vote in. This is not significantly different from the result (when it was 7%) This was the first General Election that 74% of young voters had been eligible to vote in. respondents were also more likely than other voters to say this was their first Election. The results are illustrated in the table below. First Election eligible to vote in? N= Yes 9% 7% 74% 55% 10% 8% 12% 18% 27% 28% No 91% 93% 26% 45% 90% 92% 88% 82% 72% 72% Don t know * % - The following types of voters were more likely to say this was the first General Election in which they could vote: Respondents aged up to 46 (20% compared to 1% of those aged 46 and over). Those not born in New Zealand (13% compared to 8% of those born in New Zealand). Those who cast a special vote (16% vs. 8% of those who cast an ordinary vote). Non-voters Non-voters were asked if the Election was the first Election in which they were eligible to vote. This was true for 22% of non-voters. The proportion was higher for young non-voters. Compared with, a higher proportion of non-voters said this was the first Election they were eligible to vote in (22% in vs. 15% in ). First Election eligible to vote in? Don t know / cannot remember N= Yes 22% 15% 60% 48% 17% 20% 19% 12% 32% 48% No 77% 85% 38% 50% 83% 79% 81% 88% 62% 52% 1% 1% 2% 3% - 1% - - 7% - Page 22
23 The following types of non-voters were more likely to say this was the first General Election in which they could vote: Respondents aged up to 46 (27% compared to 7% of those aged 46 and over). Previous Election Voters Voters (i.e. those who voted in the General Election) who were eligible to vote in were asked if they voted in the General Election. Nearly all (96%) did vote in. This is less often the case with young voters (there were no other significant variations among the key subgroups). Results are similar to the last post-election survey in. If you were eligible, did you vote in? Don t know / cannot remember N= Yes 96% 95% 81% 89% 92% 94% 91% 89% 91% 86% No 4% 4% 19% 11% 6% 5% 9% 10% 8% 12% * * - - 2% 1% - 1% 1% 1% The following voters (who were eligible to vote in ) were more likely to have voted in the General Election: Respondents aged 46 and over (98% compared to 91% of those aged up to 46). Non-voters Non-voters who were eligible to vote in the General Election, were asked if they voted in the General Election. 60% of non-voters who were eligible, said they voted in the General Election. This is not significantly different from the equivalent result in the last post-election survey (conducted in when 53% of non-voters said they voted in the 2005 Election). Young non-voters were less likely to have voted in. Results for and non-voters should be treated with caution due to the small base sizes. If you were eligible, did you vote in? Don t know / cannot remember N= Yes 60% 53% 32% 53% 66% 62% 76% 68% 57% 59% No 38% 40% 62% 44% 32% 32% 24% 23% 33% 41% 2% 6% 6% 2% 2% 6% - 9% 10% - Page 23
24 Past voting behaviour The survey asked all respondents who were eligible to vote in General Elections before whether they vote in most, some or no General Elections. Voters Just over three-quarters (76%) of all voters who were eligible in previous General Elections claim to have voted in every New Zealand General Election. This is similar to the survey when 73% of voters said they had voted in every New Zealand General Election. voters were less likely to say they voted in every General Election (56%). Past voting behaviour Voted in every New Zealand General Elections Voted in most New Zealand General Elections Voted in some New Zealand General Elections Don t know / cannot remember N= % 73% 77% 84% 70% 66% 56% 68% 71% 66% 19% 20% 5% 1% 22% 25% 31% 15% 19% 8% 5% 7% 18% 15% 8% 9% 12% 15% 10% 26% * - 1% 1% - - The following voters were more likely to say they had voted in every Election: Those aged 46 and over (82% compared to 67% of those aged up to 46). Non-voters Forty two per cent of non-voters who were eligible to vote in previous elections said they have voted in most General Elections. 29% said they have voted in some Elections and 28% said they have voted in no Elections. These findings are not significantly different from the survey. Predictably, young non-voters were much more likely to have never voted in a General Election (64%). (The table is overleaf, other analysis by type of non-voter follows after the table). Page 24
25 Past voting behaviour Voted in most New Zealand General Elections Voted in some New Zealand General Elections Vote in no New Zealand General Elections Don t know / cannot remember N= % 35% 11% 10% 51% 39% 45% 41% 34% 20% 29% 31% 21% 23% 26% 17% 42% 27% 33% 40% 28% 34% 64% 67% 21% 44% 13% 32% 33% 40% 1% - 4% - 2% - * The following non-voters were more likely to say they had voted in most Elections: Those aged 46 and over (61% compared to 34% of those aged up to 46). Non-voters who had considered voting at some point in the lead up to the Election (53% vs. 25% who had not considered it). Page 25
26 Advance voting Voters Voters were asked if they voted on or before Election Day. 3 The majority (84%) voted on Election Day, and 16% said they did so before Election Day. Since there has been an increase in the proportion of voters voting before Election Day (from 9% in to 16% in ). Voted on Election Day? Voted on Election Day Voted before Election Day N= % 91% 89% 91% 88% 91% 87% 92% 89% 91% 16% 9% 11% 9% 12% 9% 13% 8% 11% 9% The following groups of voters were more likely to have voted before Election Day: Those who were not eligible to vote before (i.e. was the first General Election that they were eligible to vote in) (91% vs. 83% of those who were eligible to vote in previous Elections). Non-voters Non-voters were asked if they knew that they could cast their vote before Election Day. 63% knew they could. There was no variation between the key subgroups. (Other analysis by type of non-voter is outlined following the table). There have been no significant changes in these results since. Did you know you could vote before Election Day? N= Yes 63% 64% 65% 56% 69% 49% 51% 56% 50% 62% No 37% 36% 35% 44% 31% 51% 49% 44% 50% 38% The following groups of non-voters were more likely to be aware of the advance voting option: Those living in Christchurch (80% vs. 63% for the national average). 3 The official proportion of all registered voters who voted in advance was found to be 14.2% in (whereas the survey estimate was higher at 16%). People may vote in advance for a number of reasons (including if they are away from home or going overseas). Page 26
27 Non-voters who were unaware of the advance voting option were then asked: if they had been aware, would they have voted in the Election? 59% of these non-voters thought they would have voted in the Election had they known about advance voting. The results are shown in the table below (the results are not significantly different from the survey). Results for and non-voters should be treated with caution due to the small base sizes. Had you been aware, would you have voted? N= Yes 59% 65% 57% 65% 55% 62% 76% 82% 61% 69% No 32% 31% 30% 31% 33% 28% 21% 18% 37% 25% Don t know 7% 4% 13% 4% 12% 9% 3% - 2% 6% The following groups of non-voters were more likely to be say they would have voted: Those who vote in most elections (87% vs. 47% of those who vote less often). Special voting As in, most voters cast an ordinary vote. Only 5% of voters in this survey said they cast a special vote (the same proportion as in ) 4. The proportion was higher for voters (17%). Type of vote Cast an ordinary vote Cast a special vote Don t know/can t remember N= % 95% 91% 90% 93% 96% 83% 82% 91% 86% 5% 5% 7% 9% 6% 4% 17% 16% 9% 13% 1% * 1% - 1% - - 2% - 1% The following groups of voters were more likely to have cast a special vote: Those who were not eligible to vote before (i.e. was the first General Election that they were eligible to vote in) (10% vs. 5% of those who were eligible to vote in previous Elections). 4 The official proportion of special votes cast in the General Election was 11.6%. People may cast a special vote for a number of reasons (including if they are infirm or in hospital). As with previous voter and non-voter satisfaction surveys, the survey underrepresents those who cast special votes. This is likely due to the sample for this research being drawn from the electoral roll as at Writ Day. People listed on the Writ Day roll are able to cast an ordinary vote if they vote at a polling place or advance voting place within their own electorate, whereas those who enrol after Writ Day must cast a special vote. A separate piece of research was commissioned by the Electoral Commission to report on the experience of voters and non-voters with a disability. Page 27
28 Knowledge of the Referendum This section contains findings about knowledge of the Referendum. Respondents were asked to think back to immediately prior to Election day and tell us about their level of knowledge at that point. The reason for doing so was to assess the effectiveness of Referendum information that was provided to the general public right up until the Election, but to exclude as far as possible what people learned on Election Day itself. Although all survey fieldwork was conducted within three weeks of Election Day, it is possible that some people may struggle to recollect their level of knowledge prior to Election Day. It is possible that the clarity of their recollection may be impacted by events on Election Day and thereafter. However, it was not practical to conduct a large sample survey about knowledge of the Referendum on the day before the Election, and so this post-election survey was the most suitable route for asking these questions. The Electoral Commission commissioned a similar survey about knowledge of the Referendum in before the Electoral Commission s Referendum information campaign was launched. Where possible we compare the results with the previous survey. Questions asked in the post-election survey used similar wording to the survey - but were phrased using the past tense (i.e. about recollection of knowledge on the day before the Election). The above discussions should be taken into account when interpreting the survey results contained within this section. At the beginning of each set of findings we examine the results for the general public (including voters and non-voters) before then describing the answers given by voters and non-voters separately. It should be noted that this approach differs from the rest of the report, which only presents results for voters and non-voters (i.e. the rest of the report does not contain findings for all of the general public). Awareness of the Referendum Respondents were asked if they were aware that there would be a Referendum about which voting system should be used in New Zealand s parliamentary elections. In total 87% of respondents were aware. This compares with 45% of respondents in (before the Electoral Commission s Referendum information campaign began). Young people, and respondents were less likely than average to be aware (this was similar to the findings). Awareness of Referendum * N= Yes 87% 45% 68% 13% 87% 42% 57% 27% 75% 23% No 12% 54% 31% 85% 12% 56% 38% 69% 21% 74% Don t know 1% 1% 1% 2% 1% 1% 4% 4% 4% 3% * The survey youth age-band was whereas the current survey youth age-band is This is unlikely to make much difference to the results because the views of 25 year olds in the post-election survey did not vary from the views of year olds in the current survey. Page 28
29 The following groups were more likely to be aware: Those aged 46 and over (96% compared to 78% of those aged up to 46). Those born in New Zealand (91% vs. 77% of those born outside New Zealand). Those with a higher income (95% of those with a household income of $75,000+ vs. 84% of those with a lower household income). Those with a University or postgraduate degree (92% vs. 86% of those with a lower qualification). Those who vote in every or most General Elections (93% vs. 71% of those who vote in some or no Elections). Those who read the EasyVote pack (94% vs. 77% of those who did not read it, or only glanced at it). The following groups were less likely to be aware: Those who cast a special vote (85% vs. 94% of those who cast an ordinary vote). Those who were not eligible to vote before (66% vs. 92% of those who were eligible to vote in previous Elections). Voters and non-voters Voters were more likely be aware of the Referendum (93%), whereas non-voters were less likely be aware of the Referendum (66%). Confidence in making a decision in the Referendum Respondents who were aware of the Referendum were asked how confident they felt about making a decision in the Referendum. In total 77% of those aware of the Referendum felt either very confident or fairly confident. This equates to 67% of the general public (including those who were unaware of the Referendum). There was no equivalent question in the survey. A broadly similar question asked whether respondents felt they knew enough to make a decision in the Referendum. In, 62% of those aware of the Referendum said they knew enough to make a decision in the Referendum (this equates to 28% of all people including those who were unaware of the Referendum). Young people were less likely to feel very confident. Confidence in making a decision N= Very confident 42% 25% 40% 40% 36% Fairly confident 35% 38% 38% 23% 36% Not very confident 17% 27% 18% 30% 22% Not at all confident 6% 10% 4% 8% 5% Don t know 1% Page 29
30 Among those who were aware of the Referendum, the following groups were more likely to feel very or fairly confident: Those aged 46 and over (86% compared to 65% of those aged up to 46). Males (82% vs. 72% of females). Those born in New Zealand (79% vs. 70% of those born outside New Zealand). Those with a higher income (81% of those with a household income of $75,000+ vs. 75% of those with a lower household income). Those who read the EasyVote pack (83% vs. 66% of those who did not read it, or only glanced at it). Those who vote in every, or most General Elections (82% vs. 59% of those who vote in some or no Elections). The following groups were less likely to feel very or fairly confident: Those who were not eligible to vote before (61% vs. 79% of those who were eligible to vote in previous Elections). Voters and non-voters Voters who were aware of the Referendum were more likely to be very confident or fairly confident compared to non-voters who were aware of the Referendum (81% vs. 57%). Level of knowledge about the Referendum Respondents who were aware of the Referendum were asked how much they knew about the Referendum. In total 65% of those aware of the Referendum said they knew a lot or a moderate amount. This equates to 57% of the general public (including those who were unaware of the Referendum). This is an increase from the equivalent question in, when 47% of those aware of the Referendum said they knew a lot or a moderate amount (this equates to 21% of the general public at that time). Young people, and respondents were less likely to say they knew a lot. Level of knowledge A moderate amount * N= A lot 24% 6% 16% - 23% 5% 13% 11% 11% 4% 42% 41% 32% 16% 40% 26% 29% 31% 40% 7% A little 27% 43% 40% 68% 29% 60% 45% 40% 42% 53% Nothing at all 5% 10% 12% 16% 7% 9% 12% 18% 7% 36% Don t know 2% - * - 1% * The survey youth age-band was whereas the current survey youth age-band is This is unlikely to make much difference to the results because the views of 25 year olds in the post-election survey did not vary from the views of year olds in the current survey. Page 30
31 Among those who were aware of the Referendum, the following groups were more likely to say they knew a lot or a moderate amount : Those aged 46 and over (76% compared to 51% of those aged up to 46). Those with a University or postgraduate degree (73% vs. 63% of those with a lower qualification). Those who vote in every or most General Elections (73% vs. 37% of those who vote in some or no Elections). Those who read the EasyVote pack (74% vs. 49% of those who did not read it, or only glanced at it). Those who voted before Election Day (83% - this compares with 70% of those who voted on Election Day and 32% of those who did not vote at all). The following groups were less likely to say they knew a lot or a moderate amount : Those who were not eligible to vote before (45% vs. 68% of those who were eligible to vote in previous Elections). Those who cast a special vote (56% vs. 73% of those who cast an ordinary vote). Voters and non-voters Voters who were aware of the Referendum were more likely to say they knew a lot or a moderate amount compared to non-voters who were aware of the Referendum (72% vs. 32%). Knowledge that Referendum would be held at the same time as the General Election Respondents who were aware of the Referendum were asked if they knew that the Referendum would be held at the same time as the General Election. In total 96% of those aware of the Referendum said they knew this. This equates to 84% of the general public (including those who were unaware of the Referendum). This is an increase from the equivalent question in, when 74% of those aware of the Referendum said they knew it would be held at the same time (this equates to 33% of the general public at that time)., and respondents were less likely to say they knew that the Referendum would be held at the same time as the General Election. Knowledge that Referendum would be held at same time * N= Yes 96% 74% 95% 41% 92% 58% 89% 52% 91% 33% No 3% 26% 4% 59% 7% 42% 11% 48% 6% 67% Don t know 1% - 1% % - Page 31
32 * (See table on previous page) - please note that the survey youth age-band was whereas the current survey youth age-band is This is unlikely to make much difference to the results because the views of 25 year olds in the post-election survey did not vary from the views of year olds in the current survey. Among those who were aware of the Referendum, the following groups were more likely to know that it would be held at the same time as the General Election: Those aged 46 and over (98% of those aged 46 and over compared to 94% of those aged up to 46). Those with a higher income (98% of those with a household income of $75,000+ vs. 94% of those with a lower household income). Those who vote in every, or most, General Elections (98% vs. 90% of those who vote in some or no Elections). Those who read the EasyVote pack (98% vs. 93% of those who did not read it, or only glanced at it). Voters and non-voters Voters who were aware of the Referendum were more likely to say they knew say they knew the Referendum would be held at the same time as the General Election, compared to non-voters who were aware of the Referendum (98% vs. 88%). Knowledge that the Referendum would ask about keeping MMP Respondents who were aware of the Referendum were asked if they knew that the Referendum would ask about keeping the present MMP voting system or not. In total 82% of those aware of the Referendum said they knew this. This equates to 71% of the general public (including those who were unaware of the Referendum). This is an increase from the equivalent question in, when 77% of those aware of the Referendum said they knew that the Referendum would contain this question (this equates to 35% of the general public at that time). Young people were less likely to say they knew that the Referendum would contain a question about keeping MMP. Knowledge that there would be a question about keeping MMP or not * N= Yes 82% 77% 76% 40% 78% 68% 79% 48% 85% 43% No 17% 22% 24% 60% 21% 29% 21% 47% 15% 49% Don t know 1% 1% - - 1% 3% - 5% 1% 7% * The survey youth age-band was whereas the current survey youth age-band is This is unlikely to make much difference to the results because the views of 25 year olds in the post-election survey did not vary from the views of year olds in the current survey. Page 32
33 Among those who were aware of the Referendum, the following groups were more likely to know that there would be a question about keeping MMP: Those aged 46 and over (98% compared to 94% of those aged up to 46). Those with a University or postgraduate degree (87% vs. 79% of those with a lower qualification). Those who vote in every, or most, General Elections (84% vs. 73% of those who vote in some or no Elections). Those who read the EasyVote pack (86% vs. 74% of those who did not read it, or only glanced at it). The following groups were less likely to know this: Those who cast a special vote (74% vs. 85% of those who cast an ordinary vote). Those with a health problem (72% vs. 83% of those without a health problem). Voters and non-voters Voters who were aware of the Referendum were more likely to say they knew that the Referendum would contain a question about keeping MMP or not, compared to non-voters who were aware of the Referendum (84% vs. 67%). Knowledge that the Referendum would ask about a preferred voting system Respondents who were aware of the Referendum were asked if they knew that the Referendum would ask what alternative voting system they prefer. In total 82% of those aware of the Referendum said they knew this. This equates to 72% of the general public (including those who were unaware of the Referendum). This is an increase from the equivalent question in, when 45% of those aware of the Referendum said they knew that the Referendum would contain this question (this equates to 20% of the general public at that time). respondents were less likely to say they knew that the Referendum would contain a question about the preferred voting system. Knowledge that there would be a question about preferred voting system * N= Yes 82% 45% 80% 18% 69% 43% 73% 27% 75% 36% No 17% 49% 20% 82% 29% 56% 27% 73% 24% 62% Don t know 1% 6% - - 2% 1% - - 2% 3% * The survey youth age-band was whereas the current survey youth age-band is This is unlikely to make much difference to the results because the views of 25 year olds in the post-election survey did not vary from the views of year olds in the current survey. Page 33
34 Among those who were aware of the Referendum, the following groups were more likely to know that there would be a question about the preferred voting system: Those with a higher income (88% of those with a household income of $75,000+ vs. 77% of those with a lower household income). Those who vote in every, or most, General Elections (84% vs. 74% of those who vote in some or no Elections). Those who voted before Election Day (92% vs. 83% of those who voted on Election Day). Those who read the EasyVote pack (88% vs. 71% of those who did not read it, or only glanced at it). Voters and non-voters Voters who were aware of the Referendum were more likely to say they knew that the Referendum would contain a question about the preferred voting system, compared to non-voters who were aware of the Referendum (84% vs. 71%). Knowledge of both Referendum questions (keeping MMP and preferred voting system) In total 75% of those who were aware of the Referendum knew about both questions in the Referendum (i.e. they knew that the Referendum would ask about keeping MMP and they knew that the Referendum would ask about the preferred voting system). respondents were less likely to say they knew about both questions (and were more likely to say they didn t know about either question). Knowledge of both Referendum questions Yes knew both questions Only knew about one of the two questions * N= % 41% 69% 18% 65% 43% 66% 17% 72% 25% 14% 40% 18% 22% 18% 25% 20% 41% 15% 29% Didn t know about either question 11% 19% 13% 60% 17% 32% 14% 42% 13% 46% * The survey youth age-band was whereas the current survey youth age-band is This is unlikely to make much difference to the results because the views of 25 year olds in the post-election survey did not vary from the views of year olds in the current survey. Voters and non-voters Voters who were aware of the Referendum were more likely to say they knew about both questions, compared to non-voters who were aware of the Referendum (80% vs. 62%). Page 34
35 Knowledge of the voting systems that would be listed in the Referendum Whether respondent could name one or more of the voting systems Respondents who were aware of the Referendum were asked if they had heard what alternative voting systems would be listed in the Referendum. In total 58% of those aware of the Referendum (or 51% of the general public) could spontaneously mention at least one of the voting systems listed in the Referendum. 57% of those aware of the Referendum named at least one of the four alternatives to MMP 5. There has been an increase in knowledge of at least one of the five voting systems included in the Referendum since, when only 19% of those aware of the Referendum could name one of the voting systems (equating to 8% of the general public at that time)., and respondents were less likely to be able to name one or more of the voting systems. Could name at least one of the voting systems in the Referendum * N= Yes 58% 19% 55% 11% 48% 6% 30% 5% 34% 3% No 42% 81% 45% 89% 52% 94% 70% 95% 66% 97% * The survey youth age-band was whereas the current survey youth age-band is This is unlikely to make much difference to the results because the views of 25 year olds in the post-election survey did not vary from the views of year olds in the current survey. Among those who were aware of the Referendum, the following groups were more likely to be able to spontaneously mention one of the voting systems in the Referendum: Those with a higher income (66% of those with a household income of $75,000+ vs. 52% of those with a lower household income). Those born in New Zealand (62% vs. 48% of those born outside New Zealand). Those living in Christchurch (72% vs. the national average of 58%). Those with a University or postgraduate degree (67% vs. 55% of those with a lower qualification). Those who vote in every, or most, General Elections (65% vs. 31% of those who vote in some or no Elections). Those who voted before Election Day (77% vs. 63% of those who voted on Election Day). Those who read the EasyVote pack (68% vs. 40% of those who did not read it, or only glanced at it). The following groups were less likely to name one or more of the voting systems: Those who cast a special vote (42% vs. 66% of those who cast an ordinary vote). Those with a health problem (45% vs. 58% of those without a health problem). 5 In other words they spontaneously mentioned First Past the Post, Supplementary Member, Preferential Vote or Single Transferable Vote. Page 35
36 Voters and non-voters Voters who were aware of the Referendum were more likely to be able to name one or more of the voting systems, compared to non-voters who were aware of the Referendum (65% vs. 26%). Voting systems named (unprompted) The Referendum ballot paper included a vote for, or against, keeping MMP, as well as asking for the preferred alternative to MMP (from four options). Survey interviewers invited respondents to name any voting systems they thought would be asked about in the Referendum. Respondents could tell the interviewer about one, or more than one, voting system (or they could tell the interviewer that they had not heard of any). The most common voting system that people could spontaneously name was First Past the Post (55% of those aware of the Referendum). This increased from the equivalent figure in the survey (17%). Around a fifth mentioned each of the other voting systems (although only 10% spontaneously mentioned Preferential voting). Spontaneous mentions of all of the voting systems increased since (see the table for details). As above,, and respondents were less likely to be able to name most of the individual voting systems. Young people were less likely to mention Single Transferable Vote or MMP. Systems named in the Referendum First Past the Post (FPP) Mixed Member Proportional (MMP) Single Transferable Vote (STV) Supplementary Member (SM) Preferential Vote (PV) * N= % 17% 54% - 44% 6% 22% 5% 28% 3% 24% 15% 10% 11% 20% 1% 17% - 19% 3% 19% 14% 13% - 16% 3% 8% - 6% 3% 18% * 17% - 13% - 3% - 4% - 10% 10% 8% - 8% - 5% - 6% - None of these mentioned specifically 42% 81% 46% 89% 53% 94% 70% 95% 66% 97% * The survey youth age-band was whereas the current survey youth age-band is This is unlikely to make much difference to the results because the views of 25 year olds in the post-election survey did not vary from the views of year olds in the current survey. Voters and non-voters Voters were more likely than non-voters to be able to name each of the voting systems included in the Referendum (see table overleaf). Page 36
37 Systems named in the Referendum Voters Non voters N= First Past the Post (FPP) 61% 25% Mixed Member Proportional (MMP) 25% 16% Single Transferable Vote (STV) 23% 3% Supplementary Member (SM) 22% 1% Preferential Vote (PV) 12% * None of these 36% 74% Number of specific voting systems named by respondents Respondents could spontaneously mention that they were aware that the Referendum contained either: First Past the Post, Supplementary Member, Preferential Vote, Single Transferable Vote, or MMP. The table below shows the number of systems named by members of the public, young people,, and respondents. The number of systems named was generally lower for youth,, and respondents (this was the case in see table below for details). Since there has been an increase in the number of systems named by those who are aware of the Referendum (for example, in only 3% of those aware of the Referendum could spontaneously name three or more of the systems, whereas this increased to 20% by ember ). Number of systems named None of the five systems named 1 system named 2 systems named 3 systems named 4 systems named 5 systems named * N= % 89% 45% 89% 52% 94% 70% 92% 66% 97% 15% 4% 23% 11% 13% 3% 12% 8% 15% - 24% 3% 18% - 20% 3% 11% - 13% - 17% 3% 11% - 12% 1% 6% - 6% 3% 3% * 2% - 2% - * - 1% - * * Page 37
38 Voters and non-voters Voters who were aware of the Referendum were more likely to name a larger number of systems compared to non-voters who were aware of the Referendum. For example, 24% of voters could name three or more systems, compared to 3% of non-voters (see table below for details). Number of systems named Voters Non-voters N= None of the five systems named 35% 74% 1 system named 16% 9% 2 systems named 25% 15% 3 systems named 20% 3% 4 systems named 4% - 5 systems named * - Number of the alternative voting systems named (excluding MMP) In this section we repeat the analysis conducted above, but exclude MMP. This analysis looks at the number of alternative (non-mmp) systems that respondents named. It is possible that respondents did not spontaneously name MMP because the voting system MMP was mentioned in an earlier question within the survey (when respondents were asked whether or not they had heard about the Referendum question on MMP). Therefore this analysis only looks at how many of the following alternative systems respondents identified: First Past the Post, Supplementary Member, Preferential Vote, or Single Transferable Vote. The number of alternative systems named was generally lower for youth,, and respondents (this was the case in see table below for details). Since there has been an increase in the number of systems named by those who are aware of the Referendum (for example, in less than one per cent of those aware of the Referendum could spontaneously name three or four of the alternative systems, whereas this increased to 12% by ember ). Number of alternative systems named None of the four alternative systems named 1 system named 2 systems named 3 systems named 4 systems named * N= % 92% 46% 100% 56% 94% 78% 92% 72% 97% 23% 3% 28% - 20% 3% 9% 8% 16% - 19% 5% 15% - 17% 3% 10% - 9% 3% 11% * 9% - 6% - 2% - 3% - 1% - 1% - 1% % - Page 38
39 Voters and non-voters Voters who were aware of the Referendum were more likely to name a larger number of systems compared to non-voters who were aware of the Referendum. For example, 14% of voters could name three or four systems, compared to less than one per cent of non-voters (see table below for details). Number of alternative systems named Voters Non-voters N= None of the four alternative systems named 39% 75% 1 system named 24% 21% 2 systems named 22% 4% 3 systems named 13% * 4 systems named 1% - Knowledge about the consequence of a no-change vote Respondents who were aware of the Referendum were asked if they knew that if most people voted to keep MMP, that there would be an independent review of the way it works. In total 60% of those aware of the Referendum said they knew this. This equates to 53% of the general public (including those who were unaware of the Referendum). This is an increase from the equivalent question in, when 6% of those aware of the Referendum said they knew about this consequence (this equates to 2% of the general public at that time). and respondents were less likely to say they knew that if most people voted to keep MMP, that there would be an independent review of the way it works. Knowledge about the consequence of a nochange vote * N= Yes 60% 6% 62% 6% 48% 8% 43% 7% 58% 16% No 39% 94% 37% 94% 52% 92% 57% 93% 36% 84% Don t know 1% - 1% % - * The survey youth age-band was whereas the current survey youth age-band is This is unlikely to make much difference to the results because the views of 25 year olds in the post-election survey did not vary from the views of year olds in the current survey. Among those who were aware of the Referendum, the following groups were more likely to know the consequences of a no-change vote: Those aged 46 and over (66% compared to 52% of those aged up to 46). Those who vote in every, or most, General Elections (63% vs. 51% of those who vote in some or no Elections). Males (67% vs. 54% of females). Those who read the EasyVote pack (66% vs. 48% of those who did not read it, or only glanced at it). Page 39
40 Voters and non-voters Voters who were aware of the Referendum were more likely to say they knew that if most people voted to keep MMP, that there would be an independent review of the way it works, compared to non-voters who were aware of the Referendum (63% vs. 45%). Knowledge about the consequence of a vote for change Respondents who were aware of the Referendum were asked if they knew that if most people voted for a change of system, Parliament would then decide if there would be another Referendum to choose between MMP and the most popular alternative. In total 76% of those aware of the Referendum said they knew this. This equates to 66% of the general public (including those who were unaware of the Referendum). This is an increase from the equivalent question in, when 17% of those aware of the Referendum said they knew about this consequence (this equates to 8% of the general public at that time). Young people, and respondents were less likely to say they knew that if most people voted for a change of system, Parliament would then decide if there would be another Referendum to choose between MMP and the most popular alternative. Knowledge about the consequence of a vote for change * N= Yes 76% 17% 67% 16% 68% 14% 61% 9% 70% 6% No 23% 74% 32% 80% 30% 75% 36% 83% 27% 84% Don t know 1% 9% 1% 4% 2% 11% 3% 8% 4% 9% * The survey youth age-band was whereas the current survey youth age-band is This is unlikely to make much difference to the results because the views of 25 year olds in the post-election survey did not vary from the views of year olds in the current survey. Among those who were aware of the Referendum, the following groups were more likely to know the consequences of a vote for change : Those aged 46 and over (83% compared to 66% of those aged up to 46). Those who vote in every, or most, General Elections (80% vs. 60% of those who vote in some or no Elections). Those who read the EasyVote pack (82% vs. 64% of those who did not read it, or only glanced at it). Those who cast a special vote were less likely to know about the consequences (58% vs. 82% of those who cast an ordinary vote). Page 40
41 Voters and non-voters Voters who were aware of the Referendum were more likely to say they knew that if most people voted for a change of system, Parliament would then decide if there would be another Referendum to choose between MMP and the most popular alternative (81% vs. 52% of non-voters who were aware of the Referendum). General knowledge of different voting systems All respondents, regardless of whether they knew about the Referendum or not, were asked whether they had heard of Mixed Member Proportional, First Past the Post, Single Transferable Vote, Preferential Vote and Supplementary Member. The proportion of people that had heard of each system has increased since, particularly for Single Transferable Vote, Preferential Vote, and Supplementary Member (see table below for details). As above, young people,, and respondents were less likely to have heard of each of these voting systems. Whether heard of this voting system before (% yes) Mixed Member Proportional (MMP) First Past the Post (FPP) Single Transferable Vote (STV) Preferential Vote (PV) Supplementary Member (SM) * N= % 78% 79% 41% 82% 83% 71% 53% 75% 64% 85% 74% 64% 29% 89% 81% 48% 35% 59% 39% 64% 35% 43% 11% 54% 20% 27% 8% 41% 11% 63% 40% 46% 8% 58% 41% 37% 15% 41% 27% 57% 17% 44% 3% 45% 13% 27% 11% 36% 3% The following significant differences among groups were observed: Respondents aged 46 and over were more likely to have heard of MMP, FPP, STV, PV and SM (89%, 96%, 77%, 74% and 68% respectively the equivalent proportions for those aged up to 46 were 84%, 73%, 51%, 51% and 46%). Those with a household income of $75,000 or more were more likely to have heard of MMP, FPP, STV, and SM (91%, 92%, 76%, and 66% respectively the equivalent proportions for households with an income up to $75,000 were: 85%, 83%, 58%, and 53%). Males were more likely to have heard of STV (71% vs. 59% of females) and SM (63% vs. 52% of females). Those with a University or postgraduate degree were more likely to have heard of STV and SM (74% and 67% respectively). Page 41
42 Those born in New Zealand were more likely to have heard of MMP, FPP, STV, PV and SM (89%, 92%, 70%, 67% and 61% respectively the equivalent proportions for those born outside New Zealand were 81%, 66%, 50%, 52%, and 46%). Those who vote in every, or most, General Elections were more likely to have heard of MMP, FPP, STV, PV and SM (91%, 92%, 71%, 70% and 63% respectively the equivalent proportions for those who vote in some, or no Elections, were 74%, 65%, 44%, 42% and 39%). Those who read their EasyVote pack were more likely to have heard of MMP, FPP, STV, PV and SM (91%, 92%, 74%, 72% and 68% respectively the equivalent proportions for those who did not read (or only glanced) at their EasyVote pack were 80%, 75%, 50%, 49% and 41%). Those who cast an ordinary vote were more likely to have heard of MMP, FPP, STV, PV and SM (92%, 92%, 73%, 71% and 65% respectively the equivalent proportions for those who cast a special vote were 82%, 77%, 43%, 48% and 44%). Christchurch respondents were more likely to have heard of Single Transferable Vote (74% compared with 64% of all respondents) and Preferential Voting (72% compared with 63% of all respondents). Voters and non-voters Voters were more likely than non-voters to have heard about all voting systems. Whether heard of this voting system before (% yes) Voters Non voters N= Mixed Member Proportional (MMP) 91% 71% First Past the Post (FPP) 91% 64% Single Transferable Vote (STV) 72% 38% Preferential Vote (PV) 70% 38% Supplementary Member (SM) 64% 33% Page 42
43 Referendum Advertising Respondents were asked if they remembered hearing or seeing information or advertising about the Referendum in the lead up to Election Day. It should be noted that this could cover a wide range of sources including Electoral Commission advertising, but also information provided by the media and lobby groups. As with the section entitled knowledge of the Referendum (above), this section combines voters and nonvoters. At the beginning of each set of findings we examine the results from the general public (including voters and non-voters) before then describing the answers given by voters and non-voters separately. Referendum advertising/information awareness All respondents were asked if they were aware of any information or advertising about the Referendum. In total 78% of respondents said they were aware. This compares with 16% of respondents in (before the Electoral Commission s Referendum information campaign began). In, young people and and respondents were less likely to be aware of advertising, whereas only and were less likely to be aware of advertising in ember. Awareness of info/advertising about the Referendum * N= Yes 78% 16% 77% 2% 71% 14% 50% 8% 71% 6% No 21% 84% 22% 98% 28% 86% 50% 92% 27% 94% Don t know 1% * 1% - 1% % * * The survey youth age-band was whereas the current survey youth age-band is This is unlikely to make much difference to the results because the views of 25 year olds in the post-election survey did not vary from the views of year olds in the current survey. The following groups were more likely to be aware of advertising: Those aged 46 and over (84% compared to 72% of those aged up to 46). Those with a higher income (83% of those with a household income of $75,000+ vs. 73% of those with a lower household income). Those living in Christchurch (86% vs. 78% national average). Those who vote in every or most General Elections (80% vs. 71% of those who vote in some or no Elections). Those who read the EasyVote pack (85% vs. 67% of those who did not read it, or only glanced at it). The following groups were less likely to be aware: Those who cast a special vote (61% vs. 80% of those who cast an ordinary vote). Page 43
44 Voters and non-voters Voters were more likely be aware of information or advertising about the Referendum (79%), whereas nonvoters were less likely be aware (74%). Message recall from Referendum information or advertising All those who were aware of information or advertising about the Referendum were asked whether they recalled a series of four key messages. The proportions recalling each one (i.e. % saying yes ) are outlined in the table below. Please note that this question was not asked in the survey (because the Electoral Commission s Referendum information campaign had not begun at that stage). Young people who were aware of advertising or information were less likely to recall all four messages. respondents who were aware of advertising or information were less likely to have heard something telling them about the voting system options in the Referendum. respondents were less likely to recall messages about the Referendum being on, the two questions, and what would happen as a result. respondents were less likely to recall messages about the Referendum being on, the two questions, and the voting system options in the Referendum. Whether heard of this key message during the campaign (% yes) Telling you that the Referendum was on Telling you the two questions in the Referendum Telling you the voting system options in the Referendum Telling you what would happen as a result of the Referendum N= % 84% 91% 82% 80% 71% 61% 67% 57% 60% 69% 62% 81% 63% 57% 62% 51% 62% 41% 56% The following significant differences among those who were aware of advertising were observed: Males were more likely to have heard the message about the Referendum being on (93% vs. 86% of females). Respondents aged 46 and over were more likely to be aware of all four messages (91% had heard about the message that the Referendum was on, 78% had heard about the two questions, 75% had heard about the voting system options and 69% had heard messages about what would happen as a result of the Referendum. The equivalent proportions for those aged up to 46 were 88%, 61%, 61% and 25%). Those living in Christchurch were more likely to be aware of the messages about the two questions (81% compared to the national average of 71%). Those who vote in all, or most, General Elections were more likely to be aware of all four messages (92% had heard about the message that the Referendum was on, 74% had heard about the two questions, 71% had heard about the voting system options and 65% had heard messages about what would happen as a Page 44
45 result of the Referendum. The equivalent proportions for those who vote in only some, or no, General Elections were 81%, 58%, 62% and 52%). Those born outside of New Zealand were less likely to be aware of all four messages (79% had heard about the message that the Referendum was on, 63% had heard about the two questions, 57% had heard about the voting system options and 59% had heard messages about what would happen as a result of the Referendum). Voters and non-voters Voters who were aware of advertising or information were more likely to recall all four messages, compared with non-voters who recall advertising or information. Results are detailed in the table below. Whether heard of this key message during the campaign (% yes) Voters Non-voters N= Telling you that the Referendum was on 91% 82% Telling you the two questions in the Referendum 76% 51% Telling you the voting system options in the Referendum Telling you what would happen as a result of the Referendum 72% 55% 66% 44% Satisfaction with Referendum information or advertising Those who were aware of information or advertising about the Referendum were asked how satisfied they were with it on a scale of 1 to 5, where 1 was very dissatisfied and 5 was very satisfied. This question was not asked in the survey. Just under half of people (46%) gave a score of either 4 or 5 for satisfaction. Young people and respondents were less likely to give a 4 or 5 for satisfaction. Satisfaction with Referendum information or advertising N= Very dissatisfied 4% 2% 6% 9% 4% 2 17% 18% 17% 17% 18% NET DISSATISFIED 21% 20% 22% 26% 22% 3 32% 40% 29% 36% 41% 4 27% 25% 24% 20% 24% 5 Very satisfied 20% 14% 22% 19% 10% NET SATISFIED 46% 39% 46% 38% 34% Don t know 1% 1% 2% - 4% Page 45
46 The following groups were more likely to be satisfied (4 or 5 out of 5): Those aged 46 and over (53% compared to 37% of those aged up to 46). Those who vote in every or most General Elections (50% vs. 34% of those who vote in some or no Elections). Those who read the EasyVote pack (54% vs. 31% of those who did not read it, or only glanced at it). The following groups were less likely to be satisfied: Those born outside New Zealand (38%). Those who cast a special vote (32% vs. 52% of those who cast an ordinary vote). Those who were not eligible to vote before (36% vs. 49% of those who were eligible to vote in previous Elections). Those who specifically wanted more information on the Referendum voting process (11%) or more information on the voting systems included in the Referendum (21%). Voters and non-voters Satisfaction (either 4 or 5 out of 5) was significantly higher among voters, compared to non-voters (51% vs. 26%) see the table below for details. Satisfaction with Referendum information or advertising Voters Non-voters N= Very dissatisfied 5% 3% 2 15% 25% NET DISSATISFIED 20% 28% 3 28% 45% 4 29% 18% 5 Very satisfied 22% 8% NET SATISFIED 51% 26% Don t know 1% 2% Page 46
47 Electoral advertising Awareness of Electoral advertising Respondents were asked if they had seen or heard any other advertising or information about voting in the lead up to the Election (i.e. additional voting information or advertising beyond the Referendum). It was made clear that this was advertising about the voting process, not advertising by political parties, candidates or lobby groups. As with the voter and non-voter satisfaction survey, this section reports the results for voters and non-voters separately. Voters The majority of voters (64%) recalled seeing or hearing electoral advertising prior to the Election. This is significantly lower than the equivalent result in (81%). By contrast 78% of voters were aware of Referendum information or advertising. There were no significant variations in awareness among the key subgroups. Recall of electoral advertising (not Referendum) Don t know / cannot remember N= Yes 64% 81% 61% 90% 62% 77% 63% 88% 58% 79% No 32% 16% 38% 8% 35% 21% 36% 11% 41% 20% 4% 2% 1% 1% 4% 3% 1% 1% 1% 1% Recall of the advertising was higher among the following groups of voters: Those living in Christchurch (74% vs. 64% national average). Those born in New Zealand (66% vs. 58% of those born outside New Zealand). Recall of the advertising was lower among the following groups of voters: Those who were not eligible to vote before (56% vs. 65% of those who were eligible to vote in previous Elections). Page 47
48 Non-voters Compared to voters, non-voters were less likely to recall electoral advertising (57% - which is lower than the result in 74%). non-voters were less likely to recall advertising. There were no other significant variations by the key subgroups. Recall of electoral advertising (not Referendum) Don t know / cannot remember N= Yes 57% 74% 53% 75% 43% 77% 42% 76% 53% 76% No 41% 24% 45% 24% 56% 23% 53% 24% 46% 21% 2% 2% 2% 1% 1% - 5% - 1% 2% Recall of the advertising was lower among the following groups of non-voters: Those with a health problem (31% vs. 59% of those without a health problem). Type of advertising recalled All respondents who had seen or heard electoral advertising were asked where they recalled seeing or hearing the advertising about voting. This was asked unprompted (i.e. a list was not read out to respondents). Voters Television advertising was the most frequently recalled medium by voters who had seen or heard advertising (66%), followed by newspapers (35%), pamphlets or fliers (22%) and radio (18%). Young people were less likely to recall newspapers or fliers (and more likely to say they recalled seeing something at a further/higher education institution). respondents were less likely to recall newspapers and more likely to recall word-of-mouth and signs. respondents were more likely to recall advertising on the Internet, word-of-mouth, signs, and the Electoral Commission s mailout. Other than this, results did not significantly vary by key group. There have been a number of significant changes since. These are as follows: Recall of television advertising was 66% (down from 89% in ). Recall of newspaper advertising was 35% (up from 25% in ). Recall of pamphlets or flyers was 22% (up from 5% in ). Recall of radio was 18% (down from 25% in ). Page 48
49 Recall of Internet advertising was 12% (up from 4% in ). Recall of other letters through the mail was 5% (up from 1% in ). Recall of bus shelter advertising was 1% (down from 3% in ). Source of advertising for voters who recalled electoral advertising N= Television 66% 89% 68% 91% 63% 90% 73% 93% 75% 84% Newspapers 35% 25% 15% 13% 32% 25% 17% 35% 46% 41% Pamphlets or flyers 22% 5% 11% 6% 16% 7% 31% 14% 26% 12% Radio 18% 25% 17% 42% 23% 24% 26% 44% 22% 44% Internet 12% 4% 14% 9% 7% 3% 7% 4% 29% 11% EasyVote pack* 6% n/a 4% n/a 10% n/a - n/a 10% n/a Other letters through mail 5% 1% 5% 2% 8% 4% 5% 4% 2% - Word-of-mouth 3% 2% 6% 4% 4% 1% 12% 8% 19% 9% Signs 3% 4% 4% 8% 2% 6% 17% 19% 12% 15% Shopping malls/supermarket 2% 1% 2% - 2% 1% 3% 1% 5% - Workplace meetings 1% % Bus shelters 1% 3% - 6% - - 4% 4% 4% 10% Billboards/posters/banners 1% 1% 2% 3% 2% 2% - 1% - 1% University/technical institute/training course 1% 1% 3% 4% 1% - - 2% - 1% Magazines 1% * Signs on buses * % Yes I voted sticker * % - Schools * * 1% 1% - - 1% Library * 1% - - 1% News media (non-specific) * - 1% - - Other 2% 1% 2% 1% 1% 1% 1% 5% - 2% Don t know / cannot remember 1% 1% 1% - 1% - - 1% - - * Please note that in this question was asked after the section on EasyVote packs, and therefore the question in specifically asked respondents to think of information other than the EasyVote pack (whereas in the question was asked differently and allowed respondents to include the EasyVote pack). Therefore this particular row is not comparable between and. Key subgroup differences are listed below: Those aged up to 46 were more likely to recall advertising on television (74% vs. 60% of those aged 46 and over) on radio (24% vs. 13%), or on the Internet (18% vs. 7%). However, they were less likely to recall advertising in newspapers (26% vs. 41%). Those born outside of New Zealand were more likely to hear through word-of-mouth (20% vs. 10% of those born in New Zealand). Those who voted before Election Day were more likely to recall newspaper advertising (45% vs. 33% of those who voted on Election Day). Those who cast a special vote were more likely to be aware of advertising in pamphlets or fliers (36% vs. 21% of those who cast an ordinary vote) or via word-of-mouth (11% vs. 3%). Those who were not eligible to vote before were more likely to be aware of advertising on signs (12% vs. 2% of those who were eligible before ), or via word-of-mouth (10% vs. 3%). Page 49
50 Non-voters While non-voters recalled electoral advertising in similar places to voters, they recalled fewer sources on average (1.5 sources compared to 1.9 sources among voters on average). Compared to voters, recall among non-voters who had seen or heard advertising was particularly low for newspapers (18% compared to 35% of voters who were aware of any source). It was also lower for the Internet (5% vs. 12%), and for specific mentions of the EasyVote pack (1% vs. 6%). non-voters were less likely to recall radio advertising and more likely to recall pamphlets or fliers. There were no other significant variations by the key subgroups. Results for and non-voters should be treated with caution due to the small base sizes. There have been a number of significant changes since. These are as follows: Recall of television advertising was 70% (down from 84% in ). Recall of pamphlets or flyers was 18% (up from 2% in ). Recall of letters through the mail was 5% (up from 1% in ). Source of advertising for non-voters who recalled electoral advertising N= Television 70% 84% 67% 85% 52% 90% 82% 95% 76% 69% Newspapers 18% 15% 10% 8% 19% 12% 11% 21% 8% 31% Pamphlets or fliers 18% 2% 9% 3% 39% 2% - 5% 20% 16% Radio 16% 19% 17% 27% - 26% - 37% 16% 19% Letters Through the Mail 5% 1% 6% 2% 6% Internet 5% 3% 4% 8% - 3% - 11% 7% 22% Signs 3% 5% 6% 7% 9% 2% 3% 32% 8% 12% Word-of-mouth 3% 2% 8% 4% 3% 3% 3% 26% 2% 16% Through work 2% % % - University/Technical Institute 2% 1% 7% 2% % 3% Billboards/Posters/Banners/ 1% 4% 5% 8% - 1% % Library 1% - 2% % EasyVote pack 1% n/a 2% n/a 2% n/a - n/a - n/a Public meetings - - * % Shopping malls/supermarket * 2% - 5% - 1% % Magazines - 1% Bus shelters - * - 2% % - - Other 2% 2% 2% 2% - 7% 22% 11% 13% 3% Don t know/can t remember 1% 1% 5% - - 1% Key subgroup differences are listed below: Respondents aged 46 and over were more likely to be aware of newspaper advertising (38% compared to 11% of those aged up to 46). Those who were not eligible to vote before were more likely to be aware of advertising on signs (12% vs. 1% of those who were eligible before ). Page 50
51 Unprompted message recall of electoral advertising All respondents who recalled the advertising were asked to state what the advertising was about. This was asked unprompted (i.e. a list was not read out to respondents). Despite the fact we were asking about advertising not including the Referendum, many respondents still mentioned that the advertising was about the Referendum. Voters As in, most respondents who recall advertising or information did not spontaneously mention one of the four key messages of the general Electoral campaign. The most commonly mentioned message was about using the EasyVote card when going to vote (9% of voters mentioned this message). Young people were more likely to recall advertising about how to vote, but were less likely to recall advertising about using the EasyVote card, and voting in advance. respondents were less likely to recall advertising about using the EasyVote card and voting in advance. and respondents were more likely to recall messages about using the EasyVote card, voting in advance, voting close to home and Yes I voted stickers. They were less likely to recall messages about how to vote. respondents were also less likely to recall messages about the Referendum and messages about the Election in general. Results for the key subgroups are available in the table overleaf. There have been some significant changes since the survey. These are as follows: 35% recalled general messages about how to vote (up from 18% in ). 33% recalled information about the Referendum (this was not a valid response in because there was no Referendum). 18% recalled messages about getting enrolled (down from 37% in ). 9% recalled messages about using the EasyVote card when voting (down from 17% in ). 9% recalled messages about the importance of voting (up from 2% in ). 8% recalled messages about candidates (up from 3% in ). 4% recalled messages about voting close to home (up from 2% in ). 4% recalled messages about how MMP works (down from 9% in ). Page 51
52 Message of advertising N= Telling us how to vote 35% 18% 40% 49% 35% 16% 11% 12% 14% 5% The Referendum 33% - 28% - 32% - 12% 21% - Get yourself enrolled 18% 37% 20% 48% 17% 29% 16% 18% 13% 17% About the General Election/general advertising 10% 7% 8% 7% 9% 7% - 10% 7% 4% Use The EasyVote Card when going to vote 9% 17% 6% 15% 2% 24% 26% 27% 25% 46% Importance of voting / have your say 8% 2% 7% 2% 11% 3% 16% 6% 5% - Candidate information 8% 3% 11% 1% 10% 5% 2% 7% 8% 7% Little Orange Man 6% 6% 9% 5% 3% 2% 8% 1% 3% - Vote in advance if you're going to be away on Election Day 4% 3% 2% 2% 1% 4% 19% 6% 16% 22% About MMP/how it works 4% 9% 1% 8% 5% 5% 4% 4% 2% 7% Vote close to home 3% 2% 1% 3% 1% 3% 14% 13% 13% 31% Yes, I voted (sticker) 1% - 1% % 5% 11% - Telephone number for new voters/being of age - - 1% - 1% - 2% Website/information on website 1% - 1% Other 4% 1% 3% 4% 6% 8% 6% 1% Don't know / can't remember 11% 12% 13% 8% 12% 13% 15% 10% 21% 9% Key subgroup differences are listed below: Those aged up to 46 were more likely to recall messages about using the EasyVote card (14% vs. 5% of those aged 46 and over) and enrolment (27% vs. 11%). Those with a household income of $75,000+ were more likely to recall messages encouraging people to vote (13% vs. 5% of those with a lower household income). Those born outside New Zealand were more likely to recall messages about using the EasyVote card (15% vs. 8% of those born in New Zealand), voting in advance (9% vs. 3%), and voting close to home (7% vs. 1%). Those who read the EasyVote pack were more likely to recall messages about the Referendum (38% vs. 17% of those who did not read it, or only glanced at it). Those who were not eligible to vote before were more likely to recall messages about the EasyVote card (18% vs. 9% of those who were eligible to vote in previous Elections) and messages about voting close to home (10% vs. 2%). Non-voters Message take-out was weaker among non-voters with higher proportions saying they did not know / could not remember the messages (30% vs. 11% of voters). There were no significant variations in unprompted message recall among the key subgroups of non-voters. There have been some significant changes since the survey. These are as follows: 32% recalled messages about how to vote (up from 12% in ). 16% recalled information about the Referendum (this was not a valid option in because there was no Referendum). 11% recalled messages about candidates (up from 5% in ). 6% recalled messages about getting enrolled (down from 16% in ). 5% recalled messages about using the EasyVote card when voting (down from 21% in ). Page 52
53 30% did not recall the message (i.e. said do not know / cannot remember ) (up from 22% in ). Results for, and non-voters should be treated with caution due to the small base sizes. Message of advertising N= Telling us how to vote 32% 12% 27% 20% 23% 11% 28% 21% 13% 9% The Referendum 16% - 18% - 17% - 6% - 22% - Candidate information 11% 5% 10% 7% 13% 4% 27% 16% 2% 3% Vote in advance if you re going away on Election Day 6% 9% 5% 7% - 6% % 16% About the General Election/general 6% 8% 7% 5% 8% 9% - 11% 3% - Get yourself enrolled 6% 16% 7% 24% - 14% - 26% 2% 16% Use The EasyVote Card when going to vote 5% 21% 3% 23% 2% 24% - 11% 20% 38% Importance of voting / have your say 4% 5% 9% - 3% 7% 3% 5% 2% 3% Little Orange Man 2% 4% 4% 10% - 6% - 11% - 3% Giving options/choices - non specific 2% Vote close to home 1% 8% - 4% - 5% - 5% 14% 19% Website/information on website 1% - 3% About MMP/how it works * 2% 1% 1% % 2% - Other (please specify) 2% - 5% - 3% Don t know/can t remember 30% 22% 27% 8% 47% 18% 39% - 48% 22% message recall of electoral advertising All respondents were then prompted with three key subjects in the electoral advertising and asked whether they recalled seeing or hearing any advertising containing these messages. The following results combine the unprompted and prompted recall for each message the results represent all respondents regardless of whether or not they initially claim to recall information or advertising about the voting process. Voters Most voters aware of the advertising recalled advertising about voting in advance if you are away on Election Day (75%, which is similar to ). Most also recalled advertising about using the EasyVote card (75% - which is higher than the equivalent result in when it was 58%). Almost two-thirds of voters recalled advertising about voting close to home (65% - which is higher than the equivalent result in when it was 52%). Just under one in ten (7%) could not recall any of these three messages. Young voters were significantly less likely to recall the message about using the EasyVote card. There were no other significant variations by the key subgroups. Page 53
54 recall of advertising about N= Use the EasyVote card when going to vote 75% 58% 66% 60% 74% 55% 73% 58% 67% 66% Vote in advance if you re going to be away 75% 73% 67% 62% 67% 69% 69% 55% 69% 68% on Election Day Vote close to home 65% 52% 62% 52% 60% 54% 74% 71% 70% 69% None of these messages 7% 12% 13% 13% 12% 12% 14% 9% 8% 13% Further subgroup analysis shows: Older respondents (aged 46 and over) were more likely to recall messages about using the EasyVote card (76% vs. 67% of younger respondents). Similarly they were more likely to recall the message about voting in advance (77% vs. 68%). They were also more likely to recall the message about voting close to home (68% vs. 61%). Those born in New Zealand were more likely to recall messages about using the EasyVote card (76% vs. 61% of those born outside New Zealand). Similarly they were more likely to recall the message about voting in advance (77% vs. 62%). Those who read the EasyVote pack were more likely to recall messages about using the EasyVote card (76% vs. 61% of those who did not read it, or only glanced at it). Similarly they were more likely to recall the message about voting in advance (77% vs. 64%). They were also more likely to recall the message about voting close to home (71% vs. 47%). Those who vote in all, or most, New Zealand General Elections were more likely to recall messages about using the EasyVote card (73% vs. 58% of those who vote in only some Elections). Those who voted before Election Day were more likely to be aware of messages about advance voting (82% vs. 72% of those who voted on Election Day). Those who were first eligible to vote in were less likely to be aware of messages about voting in advance (61% vs. 75% of those who could vote before ). Females were more likely to recall messages about voting close to home (69% vs. 60% of males). Non-voters Non-voters who were aware of advertising were less likely than voters to be aware of each of the three messages. Since message recall for using the EasyVote card, voting in advance, and voting close to home has increased among non-voters (see the table overleaf for details). Results for Results for, and respondents should be treated with caution due to their small base sizes. Page 54
55 recall of advertising about N= Use the EasyVote card when going to vote 53% 42% 56% 50% 42% 45% 51% 36% 37% 55% Vote in advance if you re going to be away 54% 45% 40% 39% 60% 43% 31% 36% 64% 36% on Election Day Vote close to home 55% 43% 44% 43% 34% 52% 52% 48% 67% 50% None of these messages 20% 27% 26% 25% 15% 28% 28% 24% 16% 24% Further subgroup analysis shows: Those who were first eligible to vote in were less likely to be aware of messages about voting in advance (39% vs. 55% of those who could vote before ). Those who read the EasyVote pack were more likely to recall messages about using the EasyVote card (70% vs. 35% of those who did not read it, or only glanced at it). Similarly they were more likely to recall the message about voting close to home (63% vs. 41%). Usefulness of different mediums of advertising All voters and non-voters who had seen advertising were asked to rate how useful the advertising was using a scale of 1 to 5, where 1 was not useful at all and 5 was very useful. All those who scored 4 or 5 out of 5 were combined and labeled as useful for graphing purposes. The results for different mediums are shown in the following graphs. Caution should be applied to interpreting these results due to some small base sizes. Voters Only five voters recalled seeing advertising in bus shelters in, so results for bus shelters have been excluded from the chart overleaf. The three most useful advertising sources for voters were pamphlets (76% rated these as 4 or 5 out of 5 in terms of usefulness which is higher than the equivalent result in which was 52%), the Internet (70% -significantly higher than the equivalent result in which was 52%), and radio (57% -significantly higher than the equivalent result in which was 51%). The perceived usefulness of television advertising has declined since (54% found it useful in compared with 62% in ). Page 55
.")
56 Subgroup analysis shows: Older respondents (aged 46 and over) were more likely to find newspapers useful (67% vs. 36% of those aged up to 46). Those with a health problem were less likely to find television useful (36% vs. 56% of those without a health problem). Those who vote in every, or most, General Elections were more likely to find the newspapers and radio useful (58% and 60% respectively, compared with 21% and 13% of those who only vote sometimes). Non-voters Non-voters were generally less likely to find advertising sources useful (compared with voters), although results for non-voters should be treated with caution due to the small base sizes involved. The Internet was perceived as the most useful source among non-voters (72% rating it a 4 or 5 for usefulness), the next most useful was television advertising (48%), and then pamphlets (41%). Since, there has been a decrease in the proportion of non-voters finding word-of-mouth useful (from 63% in to 17% in although this is based on a small sample size of 8 respondents so caution should be applied). Apart from that, there have been no other significant changes in perceptions about the usefulness of different advertising sources among non-voters (mainly due to the small base sizes involved). Page 56
, and beyond the Referendum and Electoral advertising. Voters Just over half of voters (54%) said they required no further information this proportion was higher in (79%).")
57 Additional information that respondents would like to see All respondents were asked if there was any additional voting information they would have liked, beyond the EasyVote pack (described in the next section), and beyond the Referendum and Electoral advertising. Voters Just over half of voters (54%) said they required no further information this proportion was higher in (79%). The proportion that didn t require further information did not vary by key subgroup. The most common suggestions relate to more information on Referendum voting systems (26% of voters) and more information about Referendum process (8%). These findings cannot be compared with the survey because the General Election did not involve a Referendum. There have been no significant increases or decreases in other types of additional information requested since the survey. Young voters were more likely to want information about the Referendum voting systems. voters were more likely to want more information on: the Referendum process, party policies, electoral candidates, an explanation of MMP, party lists, date and time of voting, and information in their own language. voters were more likely to want information about how to mark ballot papers. Other than that, there were no significant variations by the key subgroups. Page 57
58 Additional information respondents would like to see N= No, nothing 54% 79% 41% 69% 52% 79% 45% 70% 44% 70% Information about Referendum voting 26% n/a 32% n/a 20% n/a 26% n/a 27% n/a systems Information about Referendum process 8% n/a 5% n/a 8% n/a 16% n/a 8% n/a More information on party policies / 5% 3% 9% 6% 6% 2% 18% 11% 9% 6% candidates Electorate candidates 2% 2% 1% 1% 4% 1% 8% 3% 3% 5% Polling place locations 2% 4% 1% 9% 1% 4% - 6% 2% 12% Explanation on MMP 2% 3% 2% 3% 4% 3% 6% 3% 3% 5% Party lists 1% * 1% 1% 1% 2% 6% 7% - 2% How to mark ballot party papers 1% * 1% 1% 1% - 2% 3% 6% 3% Information in own language 1% % - 2% - Provide information earlier 1% - 1% % - Special/advance voting 1% 2% * 4% * - 2% 2% - 5% Date and time of voting * 2% - 2% 1% 1% 4% 5% 2% 6% Too much information * * 1% - - 1% 1% Information about EasyVote * 1% 1% - - 1% 3% 4% - 1% roll/ eligibility/ voting procedure * * - 1% 1% * Other 4% 3% 1% 2% 4% 2% 6% 2% 4% 2% Don t know/can t remember 6% 2% 11% 5% 10% 3% 7% 6% 10% 3% There were some variations within different groups of voters: Those aged up to 46 were more likely to want more information on the Referendum voting systems (32% vs. 21% of those aged 46 and over), and the Referendum process (12% vs. 5%). They were also more likely to want more information on party policies (7% vs. 3%). Those with a household income of $75,000+ were more likely to want more information on the Referendum voting systems (34% vs. 19% of those with a lower household income). Those with a University degree or postgraduate qualification were more likely to want more information on the Referendum voting systems (32% vs. 23% of those with a lower qualification). Those who cast a special vote were more likely to want more information on the Referendum voting systems (37% vs. 25% of those who cast an ordinary vote). Those who were not eligible to vote before were more likely to want information on how to mark ballot papers (4% vs. 1% of those who were eligible to vote in previous Elections) and were also more likely to want more information on party policies (9% vs. 4%). Those who only vote in some Elections were more likely to want an explanation on MMP (7% vs. 1% of those who vote in most, or all, Elections). Page 58
59 Non-voters Non-voters were more likely to make suggestions than voters 39% said they did not require further information (compared with 54% of voters). For the rest, the most common requests related to further information on the Referendum either about the voting systems in the Referendum (20%) or about the Referendum process (13%). These findings cannot be compared with the survey because the General Election did not involve a Referendum. Compared to, a higher proportion of non-voters requesting further information wanted information on party policies (up from 4% in to 8% in ), and an explanation of the voting system (up from 1% to 5%). However, a lower proportion requested information on polling place locations (from 8% in to 2% in ). Young non-voters were less likely to want more information on special or advance voting. non-voters were more likely to request additional information on how to mark ballot papers. There were no other significant variations within the key subgroups. Results for and non-voters should be treated with caution due to the small base sizes. Additional information respondents would like to see N= No, nothing 39% 65% 39% 55% 51% 59% 67% 60% 34% 43% Information about Referendum voting 20% n/a 17% n/a 10% n/a 14% n/a 9% n/a systems Information about Referendum process 13% n/a 8% n/a 5% n/a 14% n/a 4% n/a Special / advance voting 10% 7% 4% 7% 3% 5% 11% - 5% 7% Party policies 8% 4% 13% 3% 8% 4% 16% 8% - 10% Explanation of voting system (MMP) 5% 1% 2% % 4% - 2% How to mark ballot party papers 3% 1% 3% 1% 1% - 16% - 3% - Information about EasyVote 3% 1% * 2% 3% 1% 9% - 1% 4% Polling place locations 2% 8% 3% 11% 4% 5% 9% 4% 8% 21% Date and time of voting 1% 3% * 2% 3% 1% 2% 12% 4% 7% Party lists 1% * 2% 1% - 2% 9% 8% - 5% Electorate candidates 1% - 2% % 4% - - Information in own language * % Other 4% 1% 1% 6% 1% - 5% 12% 11% 7% Don t know / can t remember 15% 10% 19% 17% 22% 21% 5% 4% 32% 12% There were some variations within different groups of non-voters: Those aged up to 46 were more likely to request more information on the Referendum voting systems (27% vs. 3% of those aged 46 and over). Those with a household income of $75,000+ were more likely to request more information on advance or special voting (25% vs. 6% of those with a lower household income). Those who vote in most Elections were more likely to request more information on advance or special voting (21% vs. 5% of those who vote in some, or no, Elections). Page 59
60 Further analysis on those who wanted more information on the Referendum voting systems 26% of voters and 20% of non-voters wanted more information on the voting system options included in the Referendum. This section combines both voters and non-voters, using the same weighting regime that was used to combine them for the analysis about knowledge of the Referendum (the second section of this report). Subgroups within the combined total are examined throughout this section. Differences between key subgroups are illustrated in the chart overleaf. Subgroups indicated with an upwards arrow in the chart are statistically significantly more likely to want more information on the Referendum voting system options (compared with all respondents or if the subgroup only contains two categories, for example, gender then the test is conducted against the opposing category). (Likewise, subgroups with a downwards arrow are significantly less likely to want more information). Within the general population (including voters and non-voters), the following subgroups were more likely to want more information on the Referendum voting systems (see charts overleaf for details). Those aged Those with a household income of $100,000+. Those with a University or postgraduate qualification. Those who were not eligible to vote in previous General Elections. Those who vote in every, or most, Elections. Those who cast a special vote in. Those who recall Referendum information or advertising, but not any messages about the voting system options. Those who were aware of the questions that would be asked in the Referendum. Those who were dissatisfied with the information they saw or heard about the Referendum. Those were not confident (either not very confident, or not at all confident) about making a decision in the Referendum. It should be noted that the extent to which someone read the EasyVote pack (or whether they remember receiving it or not) did not affect the chances of wanting more information. Page 60
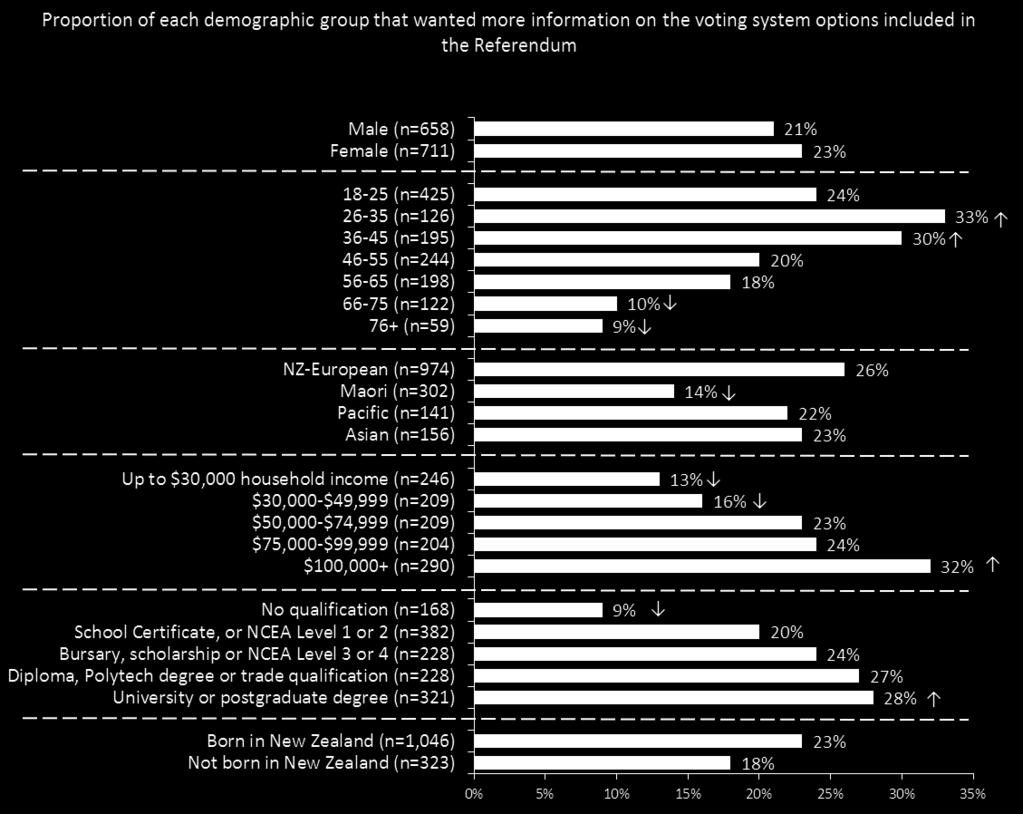
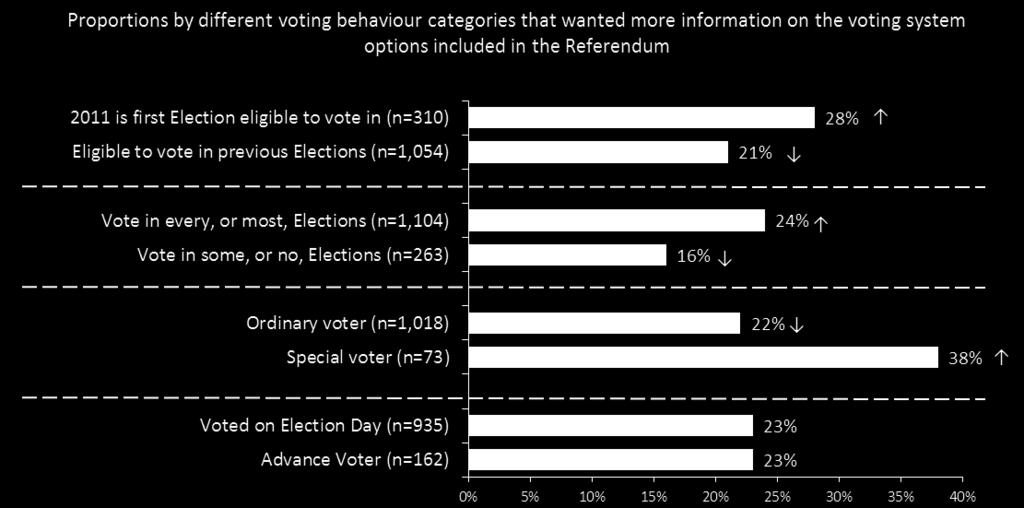
61 Page 61


62 * There were no significant differences by awareness of each of the two specific Referendum questions (i.e. no difference between those who were aware of the question on keeping MMP vs. those who were aware of the question on the preferred alternative). Page 62
63 Yes I voted stickers Proportion of voters taking Yes I voted stickers Over a third (37%) voters took Yes I voted stickers after they voted (this is similar to ). and voters were more likely to say they took a Yes I voted sticker. Did you take a Yes I voted sticker? Don t know / can t remember N= Yes 37% 39% 40% 39% 42% 43% 48% 56% 54% 51% No 62% 60% 60% 61% 57% 56% 52% 44% 45% 39% The following voters were more likely to take a sticker: 1% 1% - - 1% 1% - - 1% - Those who were not eligible to vote before (48% vs. 36% of those who were eligible to vote in previous Elections). Those aged up to 46 (43% vs. 33% of those aged 46 and over). Those with a University or postgraduate qualification (44% vs. 34% of those with a lower qualification). Those who voted on Election Day (41% vs. 17% of those who voted in advance). Stickers as a voting prompt Over a third (36%) voters thought that the Yes I voted sticker would prompt people to vote. This appears to be a downward trend on the perceived impact of the stickers (57% of voters thought the stickers would act as a prompt to vote in 2005, this fell to 51% in and is now 36% in ).,, and voters were more likely than average to say that the sticker would prompt them to vote. Yes I voted sticker as a voting prompt Don t know / can t remember N= Yes 36% 51% 59% 61% 44% 63% 67% 68% 52% 54% No 36% 35% 32% 36% 35% 25% 19% 18% 36% 30% 28% 14% 9% 4% 22% 12% 14% 14% 12% 16% The following voters were more likely to feel that the sticker would prompt people to vote: Those aged up to 46 (49% vs. 26% of those aged 46 and over). Those who were not eligible to vote before (61% vs. 33% of those who were eligible to vote in previous Elections). Those who vote in some Elections (58% vs. 35% of those who vote in every, or most, Elections). Those casting a special vote (52% vs. 35% of those who cast an ordinary vote). Page 63
64 Non-voters Only 13% of non-voters saw someone wearing a Yes I voted sticker on Election Day. This is significantly lower than in when it was 25% (in 2005 it was 28%). Young non-voters were more likely to see a Yes I voted sticker. There were no other significant variations by the key subgroups. Results for, and non-voters should be treated with caution due to the small base sizes. Yes I voted sticker as a voting prompt Don t know / can t remember N= Yes 13% 25% 25% 41% 19% 25% 4% 36% 20% 36% No 84% 74% 74% 59% 81% 73% 82% 64% 70% 57% 2% 1% 1% 1% - 2% 14% - 10% 7% The following non-voters were more likely to see Yes I voted stickers: Those with a household income of $75,000+ (25% vs. 10% of those with a lower household income). Those who were not eligible to vote before (24% vs. 10% of those who were eligible to vote in previous Elections). Those who vote in some Elections (or none) (18% vs. 4% of those who vote in most Elections). Whether information came at the right time before the Election All respondents were asked whether they felt the information or advertising that they encountered came at the right time before the Election (or whether it was too early or too close to the Election itself). Voters 78% of voters said the information was provided at about the right time. Young voters were more likely to say this, and voters were less likely to say this ( voters were more likely to say it was too close to the Election ). This question was not asked in. Timing of info/advertising N= About the right time 78% 84% 75% 61% 71% Too early 5% 3% 3% 5% 4% Too close to the Election 15% 12% 17% 30% 21% Don t know / can t remember 3% 1% 5% 4% 3% Page 64
65 The following voters were more likely to say the advertising or information was too close to the Election: Those with a health problem (11% vs. 4% of those without a health problem). Those who vote in some Elections (13% vs. 5% of those who vote in every, or most, Elections). Those who were born outside New Zealand were more likely to think the information came too early (8% vs. 4% of those who were born in New Zealand). Non-voters 58% of non-voters said the information was provided at about the right time (lower than the equivalent for voters, 78%). In contrast to voters, non-voters were more likely to say the advertising was too close to the Election (31% vs. 15% of voters). Young non-voters were more likely to say the information and advertising came at the right time. There were no other significant variations by the key subgroups. Results for and non-voters should be treated with caution due to the small base sizes. Timing of info/advertising N= About the right time 58% 70% 51% 76% 61% Too early 4% 2% 4% 7% - Too close to the Election 31% 23% 31% 17% 26% Don t know / can t remember 7% 5% 13% - 13% Voters and non-voters combined For further analysis of this question we combined voters and non-voters to get a picture of all New Zealanders who were aware of information or advertising. In total 75% of people thought the advertising came at about the right time, 4% thought it was too early, 17% thought it was too close to the Election and 4% said don t know. Page 65
66 EasyVote pack Receiving the EasyVote pack Voters In 96% of voters said they recalled receiving an EasyVote pack this is lower than the proportion in (98%). voters were less likely to say they received the EasyVote pack. There were no other significant differences by the key subgroups. Receive EasyVote pack? N= Yes 96% 98% 98% 98% 95% 97% 75% 90% 98% 95% No 3% 2% 1% 2% 4% 3% 25% 10% 2% 5% Don t know * * 1% 1% 1% 1% The following groups of voters were more likely to have received their EasyVote pack: Those who cast a special vote (81% vs. 97% of those who cast an ordinary vote). Those who were born in New Zealand (97% vs. 93% of those who were born outside New Zealand). Those who vote in every, or most, Elections (97% vs. 87% of those who vote in only some Elections). Non-voters Compared with voters, significantly fewer non-voters recalled receiving the EasyVote pack 77% of non-voters recalled receiving the pack. This is similar to. Results for and respondents should be treated with caution due to the small base sizes involved. Receive EasyVote pack? N= Yes 77% 79% 75% 76% 75% 84% 65% 60% 64% 60% No 21% 18% 18% 22% 20% 15% 34% 36% 36% 40% Don t know 2% 3% 7% 2% 5% 1% 1% 4% - - Page 66
67 Reading the EasyVote pack Respondents who recalled receiving the EasyVote pack were asked whether they had read it. Voters were more likely to read the EasyVote pack than non-voters. Voters In total 92% of voters who recalled receiving the EasyVote pack either glanced at or read at least part of it. This is a similar proportion as in and 2005 (88% for both years). In 2005, people were asked if they had read or glanced at it, and could only respond with yes or no. Therefore, it is not possible to track changes in the extent to which the EasyVote pack has been read over time. Fifty four per cent of voters who recalled receiving the EasyVote pack read most or all of it (this is similar to when it was 50%). Young voters were less likely than average to read most or all of the EasyVote pack as were voters. Receive EasyVote pack? Read most or all of it Read some of it Glanced at it Didn t read it N= % 50% 41% 39% 47% 47% 28% 49% 43% 41% 22% 21% 30% 26% 27% 18% 29% 28% 36% 32% 16% 17% 18% 21% 17% 20% 17% 7% 12% 16% 8% 11% 10% 15% 8% 15% 26% 15% 9% 11% Don t know - * % - - Voters who read all, most or some of the EasyVote pack were significantly more likely to be: Those aged 46 and over (59% vs. 46% of those aged up to 46). Those who were eligible to vote in the previous General Election (55% vs. 40% of those who were not eligible to vote before ). Those who have voted in every, or most, Elections (55% vs. 37% who only vote in some Elections). Page 67
68 Non-voters Seventy nine per cent of non-voters who received the EasyVote pack say they read it, this has increased since and 2005 (70% for both years). Compared with voters, non-voters are less likely to have read most of it (only 26% did, compared with 54% of voters). non-voters were more likely to say they didn t read it. There were no other significant variations by the key subgroups. Results for and non-voters should be treated with caution due to the small base sizes. Receive EasyVote pack? Read most or all of it Read some of it Glanced at it Didn t read it N= % 25% 15% 22% 17% 23% 9% 33% 13% 32% 24% 18% 28% 18% 15% 25% 40% 20% 46% 36% 30% 27% 35% 30% 26% 26% 36% 20% 36% 28% 21% 31% 21% 30% 43% 23% 16% 27% 4% 4% Don t know * 1% - 1% - 3% Ease of finding the EasyVote card Those who had read or glanced at the EasyVote pack were asked how easy it was to find the EasyVote card. Voters Nearly all voters who looked at the pack (96%) said it was easy to find the EasyVote card. This is similar to (98%). There were no significant variations among the key subgroups. Easy to find EasyVote card? Don t know / Cannot remember N= Yes 96% 98% 96% 98% 97% 99% 98% 99% 97% 99% No 2% 1% 3% 2% 2% - 2% 1% 3% 1% 2% 1% 1% - 1% Page 68
69 Non-voters More than four in five (81%) non-voters who looked at the pack said it was easy to find the EasyVote card. This is similar to the result in. There were no significant variations among the key subgroups. Results for and non-voters should be treated with caution due to the small base sizes. Easy to find EasyVote card? Don t know / Cannot remember N= Yes 81% 83% 81% 75% 83% 83% 72% 91% 97% 88% No 11% 11% 11% 17% 8% 9% 28% 9% 3% 4% 8% 7% 8% 8% 9% 8% % Use of EasyVote card or CEO letter when voting Most voters (86%) took the EasyVote card when they voted; this is similar to (88%). Six percent of voters took the letter from the Electoral Commission with them (this is the same as ). voters were less likely to take the EasyVote card and were more likely to say they brought neither. voters were also more likely to take the letter with them. Did you take the following when you voted? EasyVote card Letter from the Chief Electoral Officer N= % 88% 87% 86% 88% 84% 73% 64% 90% 85% 6% 6% 6% 2% 5% 8% 8% 13% 13% 22% Neither 14% 11% 12% 13% 11% 13% 28% 29% 10% 11% The following groups of voters were more likely to take the EasyVote card with them: Those who cast an ordinary vote (88% vs. 59% of those who cast a special vote). Those who have voted in every, or most, Elections (87% vs. 69% who only vote in some Elections). Those who were not eligible to vote in the previous General Election were more likely to bring the letter from the Chief Electoral Officer with them (10% vs. 5% of those who were eligible to vote before ). Page 69
70 Satisfaction with the EasyVote pack Those who glanced at or read the EasyVote pack were asked how satisfied they were with it on a scale of 1 to 5, where 1 was very dissatisfied and 5 was very satisfied. Voters were more likely to be satisfied with the pack than non-voters. Results are described below. Voters Most voters (88%) gave a score of either 4 or 5 for satisfaction. This is lower than when it was 92% - it was 93% in voters were less likely to be dissatisfied than average (less than 1% gave a rating of 1 or 2 out of 5). There were no other significant variations by the key subgroups. Satisfaction with EasyVote pack 1 -Very dissatisfied NET DISSATISFIED 5 Very satisfied NET SATISFIED N= % 1% 1% % 3% 2% - 2 2% 1% 1% - * - 3% 3% - 1% 3% 2% 2% - * - 5% 5% 2% 1% 3 8% 6% 6% 7% 7% 6% 10% 5% 6% 11% 4 27% 21% 33% 27% 30% 19% 35% 15% 25% 17% 62% 71% 58% 65% 61% 75% 50% 74% 66% 68% 88% 92% 91% 92% 92% 94% 85% 89% 91% 85% Don t know 1% 1% * - 1% % 2% The following groups of voters were more likely to be satisfied with the EasyVote pack (i.e. score a 4 or 5 out of 5): Those who read it (93% vs. 68% of those who only glanced at it). Those who vote in most, or all, General Elections (89% vs. 76% of those who only vote in some). Non-voters Satisfaction with the EasyVote pack is significantly lower among non-voters (58% compared with 88% of voters). There appears to be a downward trend in satisfaction with the EasyVote pack among non-voters who have seen the pack. The net satisfaction score was 77% in 2005, 66% in, and was 58% in. (Although the change in satisfaction between and is not statistically significant, the change in satisfaction between 2005 and is significant). Between and, there has been a significant increase in the proportion giving the EasyVote pack a neutral score of 3 out of 5. Page 70
71 There were no variations by any of the key subgroups. Results for and non-voters should be treated with caution due to the small base sizes. Satisfaction with EasyVote pack 1 -Very dissatisfied NET DISSATISFIED 5 Very satisfied NET SATISFIED N= % 2% 1% 5% - 8% 2% - - 4% 2 3% 7% 6% 8% 3% 4% 2% - 2% 8% 8% 9% 8% 13% 3% 12% 5% - 2% 12% 3 32% 17% 31% 24% 20% 24% 30% 27% 42% 38% 4 31% 31% 38% 30% 46% 33% 9% 27% 23% 12% 27% 35% 21% 21% 25% 25% 46% 45% 28% 29% 58% 66% 59% 52% 71% 57% 55% 73% 51% 42% Don t know 2% 8% 2% 12% 6% 7% 10% - 6% 8% The following non-voters were more likely to be satisfied with the EasyVote pack (i.e. score a 4 or 5 out of 5): Those who read it (76% vs. 28% of those who only glanced at it). Those who considered voting (66% vs. 36% of those who did not consider voting). Page 71
72 Getting to the polling place Voting away from the polling place Virtually all (99%) voters either cast their vote at an advance voting place or at a polling place on Election Day. One percent did not. Robust analysis of this population is not possible due to small numbers. However, the following can be stated for those who did not vote at an advance voting place or a polling place: The majority of them still voted at a place set up by electoral officials (78%), whereas 21% had voting papers brought or sent to them, and 1% said they voted another way. Polling place location Those who voted at a polling place were asked if they voted at a polling place that was close to their home. As in, the majority voted close to home (92%). voters were more likely to vote close to home. There were no other significant variations among the key subgroups. Polling place close to home? Don t know / can t remember N= , Yes 92% 93% 93% 91% 94% 95% 96% 94% 97% 94% No 8% 7% 7% 9% 6% 5% 4% 6% 3% 6% The following groups of voters were more likely than average to vote at a polling place close to home: Those aged up to 46 (95% vs. 91% of those aged 46 and over). Those who voted on Election Day (94% vs. 82% of those casting advance votes). Those who cast ordinary votes (95% vs. 50% of those who cast special votes). Accompaniment to the polling place Most voters actually went to the polling place with other family members (63%). Just under a third of voters (32%) attended the polling place by themselves. There were no significant differences in answers to this question between and. Young voters and voters were more likely to have attended with other people (not family). They were also both less likely to visit the polling place by themselves. Page 72
73 Accompaniment to polling place With other family members With other people (not family) N= , % 59% 55% 50% 68% 61% 61% 66% 65% 59% By myself 32% 36% 24% 36% 23% 36% 29% 31% 30% 33% 6% 5% 23% 14% 10% 5% 10% 3% 5% 8% Accompaniment to the polling place varied among some groups of voters: Those voting before Election Day were more likely to do so on their own (50% vs. 28% of those who voted on Election Day). Those casting special votes were more likely to do so with other people (not family) (22% vs. 5% of those who cast ordinary votes). Those who were eligible to vote in their first General Election in were more likely to do so with other people (not family) (19% vs. 4% of those who were eligible to vote in previous Elections). Voted at same polling place as last Election? All those who voted in a polling place, who had also voted in the General Election, were asked if they voted in the same polling place as the last Election. As in, just over half (51%) did. This did not vary by any of the key subgroups. (Other analysis by type of voter is included underneath the table). Vote in same polling place? Don t know / cannot remember N= Yes 51% 51% 41% 31% 51% 46% 50% 46% 56% 55% No 47% 48% 59% 69% 48% 54% 49% 54% 44% 45% 2% 1% - - 1% - 1% The following voters were more likely to vote in the same place as last Election: Those with a household income less than $75,000 (56% vs. 45% of those with a higher income). The following types of voters were less likely to vote in the same place as last Election: Those with a University or postgraduate degree (41% vs. 55% of those with a lower qualification). Those who voted before Election Day (9% vs. 59% of those who voted on Election Day). Those casting special votes (7% vs. 53% of those casting ordinary votes). Voters who did not vote in the same polling place were particularly likely to say this was because a different polling place was more convenient (34%), or because they had moved (29%) (See overleaf for details). These results are similar to. Page 73
74 and voters were more likely to say they didn t vote at the same place because they have moved since the last Election. There were no other significant differences by the key subgroups. Reason for not voting in same polling place as last time A different polling place was more convenient N= % 29% 53% 33% 37% 37% 32% 30% 27% 31% Moved since last Election 29% 39% 20% 59% 22% 33% 53% 49% 50% 41% The place I voted last time wasn t a polling place / was not open this time 17% 5% 20% 3% 17% 8% 7% - 12% 7% Advance voted this time 7% 5% 4% 3% 7% 2% Was not in my electorate on Election Day Was working on polling day Special voted this time Don t know / cannot remember 5% 6% - 1% 4% 2% % 4% 3% 5% 1% 3% 2% 6% 1% - 3% % - Other 4% 4% 3% 1% 6% 4% 1% 5% 4% 3% 2% 1% - - 1% 1% 4% 3% 3% 7% The reasons given by voters who did not vote at the same place varied among some groups: Those aged up to 46 were more likely not to vote at the same place because they had moved (45% vs. 19% of those aged 46 and over). Those casting special votes were more likely to say they it was because they were outside of their electorate (19% vs. 4% of those who cast ordinary votes). Those who voted before Election Day were more likely to say it was because the Advance Voting place was not in the same location as the previous polling place (20% vs. less than 1% of those who voted on Election Day). Non-voters awareness of a convenient polling place Most (85%) non-voters knew the location of a polling place that was convenient for them. Results do not differ significantly from. non-voters were less likely to be aware of a convenient polling place (there were no other significant differences by the key subgroups). Results for and respondents should be treated with caution due to the small base sizes involved. Aware of polling place? Don t know / cannot remember N= Yes 85% 83% 85% 83% 84% 81% 73% 88% 66% 74% No 15% 16% 15% 17% 15% 19% 27% 8% 33% 24% - 1% * - 1% - - 4% 1% 2% Page 74
75 Source of information about polling place location Voters Those who voted at a polling place were asked where they found out about the location of the polling place. This question was asked unprompted (i.e. a list was not read out to respondents). As in, the most common source was to read about it in the EasyVote pack or something they received in the mail (45%). 27% said they knew from signs (up from 23% in 2007) and 26% said they knew the location because they had voted there in the past (similar to the equivalent proportion in ). Young voters were more likely to know via family/friends but were less likely to know because they had voted there in the past, and less likely to know via local newspapers or general advertising. voters were more likely to say they expected to find it at a school or they knew because of family/friends. voters were less likely to say they read about it in the EasyVote pack/something in the mail, or a local newspaper, and more likely to say they heard about it on the radio, or it was because they had voted there in the past or because they were driving/walking past. voters were more likely to say they knew from their EasyVote pack / something in the mail, but less likely to say they knew via a local newspaper or signage. Source of information about polling place location N= , Read about it in EasyVote pack / something in mail 45% 48% 45% 53% 36% 43% 32% 45% 54% 67% Signs/signage 27% 23% 28% 29% 29% 32% 25% 28% 13% 13% I ve voted there in the past 26% 28% 5% 11% 23% 24% 38% 24% 29% 14% Family /friends /workmates, etc 16% 16% 48% 39% 22% 22% 21% 19% 13% 20% From information in the local newspaper 13% 15% 7% 5% 16% 12% 1% 6% 3% 2% Was driving /walking /going past 10% 10% 8% 9% 11% 11% 19% 11% 10% 14% Expected to find it at the school 9% 9% 7% 3% 13% 11% 7% 4% 2% 6% From advertising in general 4% 3% - 3% 4% 2% 1% 6% 2% 4% From the website / Internet 4% 2% 6% 2% 4% 1% 2% 3% 5% 2% My knowledge (it has always been there) 2% 1% 1% 1% 2% 1% * Information at local electorate offices/ 1% - 2% % - 2% - returning offices Was working at the Elections/polling place 1% 2% 1% 2% 3% 1% 1% Radio 1% 1% 1% - 1% 1% 4% 4% 2% 1% From political parties or candidates 1% % 2% - 2% Information from Iwi/Trust Board 1% * Information from Council Offices * % - Information from Citizen s Advice * 1% - 1% - 1% - - 1% - Other 3% 2% 1% 4% 7% 3% 5% 5% 2% 2% Don t know / can t remember * 1% 1% * - - 1% Page 75
76 The source of knowledge about polling place location varied among some groups of voters: Those aged 46 and over were more likely to say they had voted there in the past (20% vs. 13% of those aged up to 46) or that they knew from information in the newspaper (10% vs. 1% of those aged up to 46). Those aged up to 46 were more likely to say they went with friends/family/workmates (16% vs. 6% of those aged 46 and over). This was also the case for those who were not eligible vote before (30% vs. 8% of voters who were eligible to vote before ). Those who read the EasyVote pack were more likely to say they knew from the pack/something they received in the mail (40% vs. 16% of those who only glanced at the EasyVote pack or didn t read it). Those who voted before Election Day were more likely to say it was because they were walking, or driving, past (14% vs. 5% of those who voted on Election Day). Non-voters Non-voters who knew where their polling place was located were asked how they knew about its location. The three most common sources for non-voters were: signage (26%), family, friends, or workmates (25%), and the EasyVote pack/something in the mail (25%). 19% also said it was because they had voted there in the past. Younger non-voters were more likely to say they knew through family/friends, and less likely to say they knew via a local newspaper, and also less likely to say it was because they had voted there in the past. nonvoters were more likely to say they knew via signage and less likely to say it was because they had read about it in the EasyVote pack/something in the mail. non-voters were more likely to say it was because they had voted there in the past. Results for and non-voters should be treated with caution due to the small base sizes. (Other analysis by type of non-voter is included following the table). Source of information about polling place location N= Signs/signage 26% 22% 29% 32% 50% 31% 5% 50% 18% 23% Family /friends /workmates, etc 25% 26% 51% 39% 35% 33% 17% 41% 23% 45% Read about it in EasyVote pack / something in mail 25% 20% 31% 30% 11% 17% 11% 27% 43% 23% I ve voted there in the past 19% 24% 4% 3% 14% 9% 53% 5% 26% 3% Was driving /walking /going past 16% 16% 18% 12% 21% 19% 23% 9% 1% 16% From information in the local newspaper 14% 9% 3% 6% 4% 13% 2% 14% 1% 10% Expected to find it at the school 12% 9% 6% 6% 11% 11% 3% 9% 10% 10% From the website / Internet 7% 1% 4% 2% 2% % 6% My knowledge (it has always been there) 5% 2% - 1% 1% % From advertising in general 1% 3% 2% 3% 3% 14% - 5% - 6% Information at local electorate offices/ 1% 1% 1% 1% 3% 3% - 5% - - returning offices Radio 1% 1% 2% % Other 2% 3% 3% 3% 5% - - 5% 12% 6% Page 76
77 The source of knowledge about polling place location varied among some groups of non-voters: Females were more likely than males to say they expected to find it at a school (18% of female nonvoters who knew the location vs. 2% of males). Those who were not eligible vote before were more likely to say they knew of the location through family/friends/workmates (40% vs. 13% of non-voters who were eligible to vote before ). They were also more likely to say they read about it in the EasyVote pack (25% vs. 9% of those who were eligible to vote before ). Page 77
78 Polling place experience Time of day voted at polling place Forty percent of people voted in the morning (i.e. up to, and including, noon), 50% of people voted in the afternoon (between noon and up to, and including, 5pm), and 9% voted after 5pm. Since there has been a decrease in the proportion voting in the morning, and an increase in the proportion voting in the afternoon (in 46% voted up until noon, 45% voted between noon and 5pm, and 8% voted after 5pm). Young people were more likely to vote in the evening (14%) and less likely to vote in the morning (27%). voters were more likely than average to vote in the afternoon (64%) and less likely to vote in the morning (22%). Further subgroup analysis follows after the table. Time of day voted N= , am am 10% 14% 6% 9% 13% 14% 9% 9% 1% 10% 10.00am am 15% 16% 9% 10% 12% 15% 8% 16% 19% 8% 11.00am am 15% 16% 13% 19% 14% 14% 4% 6% 17% 14% 12.00am pm 12% 10% 17% 14% 11% 12% 14% 12% 14% 11% 1.00pm pm 11% 11% 12% 13% 14% 10% 14% 17% 7% 16% 2.00pm pm 12% 10% 12% 10% 10% 9% 20% 12% 14% 7% 3.00pm pm 7% 7% 8% 9% 8% 7% 13% 11% 3% 11% 4.00pm pm 8% 8% 9% 6% 9% 9% 3% 6% 14% 5% 5.00pm pm 5% 5% 8% 7% 5% 7% 10% 7% 8% 14% 6.00pm+ 4% 3% 6% 4% 5% 3% 3% 2% 3% 6% Don t know / can t remember * 1% * * - 1% - 2% * - Further subgroup analysis shows: Those aged up to 46 were more likely to vote in evening (13% vs. 7% of those aged 46 and over). Whereas those aged 46 and over were more likely to vote in the morning (47% vs. 32% of those aged up to 46). Those who voted before Election Day were more likely to vote in the afternoon (63% vs. 48% of those who voted on Election Day). Those who cast a special vote were more likely to vote in the afternoon (64% vs. 49% of those who cast an ordinary vote). Queues at polling place Most voters who went to a polling place did not have to queue (only 11% did, which is lower than the equivalent finding in 21%). Results were consistent across the key subgroups. Queued at polling place? Don t know / cannot remember N= , Yes 11% 21% 11% 21% 14% 17% 11% 26% 11% 22% No 89% 79% 89% 79% 85% 83% 89% 74% 89% 78% * % Page 78
79 Further subgroup analysis shows: Those who voted on Election Day were more likely to queue compared to those who voted before Election Day (13% vs. 4%). Those who voted in the morning were more likely to have to queue (15%, compared to 8% of those who voted in the afternoon and 14% of those who voted in the evening). Time taken at polling place Voters who went to a polling place were asked how long they spent at the polling place in total. Most (63%) said they only spent up to five minutes. This is lower than the equivalent result from the survey (71%). This is interesting given that fewer voters perceived that they had to queue (see result above), and may reflect the time taken to complete a Parliamentary and Referendum voting paper (rather than the time taken in a queue). In, 31% said they took between five and ten minutes, which is higher than the equivalent in (21%). This may relate to both a Parliamentary and Referendum voting paper being presented to voters for completion in. Time taken N= , Up to 5 minutes 63% 71% 63% 71% 63% 74% 50% 60% 61% 62% 5-10 minutes 31% 21% 31% 22% 28% 19% 43% 24% 31% 26% minutes 4% 4% 5% 5% 6% 4% 5% 6% 7% 6% minutes 1% 2% 1% 1% 3% 1% 2% 2% - 2% minutes * * - 1% - * - 1% - 1% minutes - 1% - 1% - 1% - 5% - 2% More than 30 minutes * * 1% * - * * 1% - 1% Don t know / can t remember * % - Those who voted in the morning (up to and including noon) were more likely to say they spent five minutes or longer at the polling place (42% compared to 34% of those who voted between noon and five pm, and 25% of those who voted after five pm). Those who cast a special vote were more likely to spend more than five minutes at the polling place (57% compared to 36% who cast an ordinary vote). Almost a fifth of those casting special votes spent 11 minutes or more at the polling place (18% did, compared to 5% of those who cast ordinary votes). Those with a health problem were more likely to spend 11 minutes or longer voting this was the case for those casting ordinary votes as well as those with health problems casting special votes (11% of those with health problems who cast an ordinary vote spent 11 minutes or longer and 55% of those with health problems who cast a special vote spent 11 minute or longer compared to 6% of all voters). There was no difference in time spent by those who voted in advance of Election Day (whereas in those who voted in advance tended to spend longer at the polling place compared to those who voted on Election Day). This may reflect the removal of the declaration requirement for advance ordinary voters. Those who attended the polling place with other people not family were more likely to spend 11 minutes or longer (12% vs. 6% of all voters). Page 79
80 To give an indication of overall queue times, the above table is broken down into those who say they had to queue and those who said they did not have to queue. It should be noted that the times given below are an indication of total time spent voting (including queuing, completing forms, and casting the vote). time at polling place All voters - Had to queue All voters - Did not have to queue N= Up to 5 minutes 37% 67% 5-10 minutes 46% 29% minutes 10% 3% minutes 5% 1% minutes 2% minutes - - More than 30 minutes * * Don t know / cannot remember 1% * This shows that 37% of those who had to queue only spent five minutes at the polling place, 46% spent between five and ten minutes, and 17% spent 11 minutes or longer at the polling place. Feelings on time taken at polling place Voters were asked how they felt about the amount of time they had spent at the polling place. As in, nearly all (98%) felt that the time they had spent at the polling place was reasonable given what they had to do. Only 1% felt it was too long. voters were more likely to say that it felt too long. There were no other significant variations among the key subgroups. Feelings on time taken at polling place N= , Reasonable amount of time given what you had 98% 98% 98% 99% 97% 98% 95% 96% 100% 97% to do Too long 1% 2% 2% 1% 3% 2% 5% 4% - 3% Don t know / cannot remember * % Three groups of voters were less likely to agree that it was a reasonable amount of time: Those casting a special vote (94% vs. 99% of those casting ordinary votes). Those who had to queue (96% vs. 99% of those who did not have to queue). Those who encountered a problem or difficulty at the poll (92% vs. 99% of those who did not encounter any problems or difficulties). Overview of how the polling place was rated by respondents Voters were asked to rate a number of factors about their polling place experience. A scale of 1 to 5 was used where 1 was poor and 5 was excellent. The graph overleaf shows the proportions that rated each aspect of their experience at 4 or 5 out of 5 (i.e. the top two responses). Page 80

.")
81 Since there has been an increase in the proportion saying that it was obvious where to place completed voting papers (from 89% in to 92% in ). All other changes in the proportions scoring a 4 or 5 out of 5 are not statistically significant. Rating the convenience of location Most of those who voted at a polling booth said the location was convenient 86% said the location was excellent (similar to ). There were no significant variations by the key subgroups. (Other analysis by type of voter is included underneath the table). Convenience of location N= , Excellent (5) 86% 88% 87% 86% 89% 91% 87% 86% 84% 81% 4 11% 10% 11% 12% 10% 7% 13% 10% 14% 14% 3 2% 2% 1% 1% 1% 1% - 4% 3% 4% 2 1% 1% * - - * % Poor (1) * 1% 1% - - 1% Don t know / cannot remember * Page 81
82 Rating the signage outside Most of those who voted at a polling place said the signage outside was excellent (71% - this is not significantly different from the result in ). As in, younger voters were less likely to rate the signage outside as excellent. There were no other significant variations by key subgroup. (Other analysis by type of voter is included underneath the table). Signs outside N= , Excellent (5) 71% 73% 59% 61% 71% 75% 71% 75% 66% 74% 4 18% 15% 23% 21% 17% 17% 14% 15% 23% 13% 3 7% 7% 10% 13% 8% 5% 9% 5% 6% 10% 2 2% 3% 5% 2% 2% 2% 3% 3% 3% 1% Poor (1) 1% 1% 2% 3% 1% 1% 4% 1% - 3% Don t know / cannot remember 2% 2% * - - 1% - - 3% - The following groups of voters were less likely to give an excellent rating: Males (63% vs. 77% of females). Those who were not eligible vote before (61% vs. 72% of those who could vote before ). Rating the physical layout Most of those who voted at a polling place said the physical layout (i.e. how easy it was to find your way around) was excellent (76% - this is similar to the equivalent finding in when it was 73%). As in, younger voters were less likely to rate the physical layout as excellent. In voters were less likely than average to rate the layout as excellent. There were no other significant variations by key subgroup. (Other analysis by type of voter is included underneath the table). Physical layout N= , Excellent (5) 76% 73% 69% 61% 74% 77% 77% 81% 64% 73% 4 17% 19% 22% 27% 19% 16% 16% 14% 28% 21% 3 5% 5% 5% 9% 3% 5% 6% 4% 5% 6% 2 1% 2% 3% 4% 3% 2% 2% 1% - 1% Poor (1) 1% 1% * - 1% 1% - - 2% - Don t know / cannot remember * * - - 1% % - The following groups of voters were less likely to give an excellent rating: Those aged up to 46 (70% vs. 81% of those aged 46 and over). Those who were not eligible vote before (70% vs. 77% of those who could vote before ). Page 82
83 Rating where to place completed ballot paper Almost three quarters (73%) rated the obviousness of where to place completed ballot papers as excellent (this is up from 69% in ). There was no significant variation among the key subgroups. (Other analysis by type of voter is included following the table). Obvious where to place completed ballot paper N= , Excellent (5) 73% 69% 71% 55% 72% 72% 79% 77% 72% 67% 4 19% 20% 23% 29% 21% 15% 11% 15% 18% 25% 3 5% 8% 5% 13% 4% 8% 4% 4% 5% 7% 2 3% 2% 2% 2% 1% 2% 3% 1% 2% 2% Poor (1) * 1% - 1% 1% 2% 2% 1% 2% - Don t know / cannot remember * * - - 1% 1% - 1% 2% - Voters who only vote in some Elections were less likely to give an excellent rating (58% vs. 74% of those who vote in every, or most, Elections). Rating the access to exit Most of those who voted at a polling place said the ease of access to the exit was excellent (88%). This is not significantly different from. Results did not significantly vary by any of the key subgroups (other analysis by type of voter is included underneath the table). Access to exit N= , Excellent (5) 88% 86% 89% 88% 83% 72% 86% 89% 82% 82% 4 10% 10% 7% 11% 14% 15% 10% 8% 16% 13% 3 2% 2% 2% 1% 1% 8% 1% 2% * 3% 2 * * 2% 1% 1% 2% * 1% - 1% Poor (1) - 1% % 2% - - 1% Don t know / cannot remember * 86% - - 1% 1% - - 2% - Those who had to queue were less likely to give an excellent rating (80% vs. 89% of those who did not). Page 83
84 Rating the equipment in booths Most of those who voted at a polling place rated the equipment at the booth as excellent (89% - this is the same as the result from ). Young voters and voters were less likely to rate the equipment as excellent. (Analysis by other types of voter follows after the table). Well equipped booth N= , Excellent (5) 89% 89% 84% 82% 86% 89% 81% 85% 87% 76% 4 8% 8% 10% 16% 11% 8% 10% 10% 8% 16% 3 2% 2% 6% 2% 2% 2% 7% 3% 3% 6% 2 * * 1% - - 1% 1% - - 2% Poor (1) * * - * - * * 1% - - Don t know / cannot remember * * - - 1% - - 1% 2% - The following groups of voters were less likely to give an excellent rating: Voters who only vote in some Elections (76% vs. 89% of those who vote in every, or most, Elections). Those who voted in the evening (78% vs. 89% of those who voted earlier). Rating the signage inside Almost three-quarters (74%) of those who voted at a polling place rated the signage inside as excellent (this is higher than the result from which was 68%). As in, younger voters were less likely to rate the signage inside as excellent. voters were more likely to rate the signage as excellent (a similar finding to ). There were no other significant variations by key subgroup. (Other analysis by type of voter is included underneath the table). Signs inside N= , Excellent (5) 74% 68% 60% 53% 71% 73% 84% 87% 69% 74% 4 14% 17% 24% 28% 20% 18% 8% 6% 17% 19% 3 6% 8% 10% 15% 6% 6% 5% 5% 7% 5% 2 3% 2% 4% 4% - 1% 3% - 2% 2% Poor (1) 1% 1% * - - 1% - - 3% 1% Don t know / cannot 2% 3% 1% remember * 3% 1% - 1% 3% - Those who were not eligible vote before were less likely to give an excellent rating (62% vs. 75% of those who could vote before ). Page 84
85 Rating the sense of privacy Seventy one per cent of those who voted at a polling place rated the privacy as excellent. This is not significantly different from (when it was 75%). As in, younger voters were less likely to rate the sense of privacy as excellent. voters were less likely to rate the privacy as excellent. There were no other significant variations by key subgroup. (Other analysis by type of voter is included underneath the table). Privacy N= , Excellent (5) 71% 75% 57% 54% 63% 73% 73% 83% 65% 66% 4 19% 16% 25% 32% 24% 12% 14% 12% 20% 23% 3 8% 7% 14% 10% 8% 12% 8% 5% 13% 10% 2 1% 2% 3% 3% 2% 3% 2% - 2% 2% Poor (1) * * 1% 1% 2% 1% 2% Don t know / cannot remember * * - - 1% - 1% - 1% - The following groups of voters were less likely to give an excellent rating: Those aged up to 46 (64% vs. 76% of those aged 46 and over). Males (65% vs. 75% of females). Voters who only vote in some Elections (48% vs. 72% of those who vote in every, or most, Elections). Those who were not eligible vote before (63% vs. 71% of those who were eligible to vote before ). (Please note that those with a health problem and those who cast special votes were no more, or less, likely to rate privacy as excellent). Rating the ease of identifying Election staff Eighty per cent of those who voted at a polling place rated the ease of identifying Election staff as excellent. This is not significantly different from the result in. Young voters were less likely to rate the ease of identifying Election staff as excellent. There were no other significant variations by key subgroup. (Other analysis by type of voter is included underneath the table). Ease of identifying Election staff N= , Excellent (5) 80% 77% 74% 69% 82% 82% 76% 85% 73% 72% 4 13% 16% 17% 21% 15% 10% 10% 10% 23% 18% 3 4% 4% 7% 10% 2% 6% 11% 3% 2% 9% 2 1% 2% 2% - 1% 1% 1% 1% * 1% Poor (1) - * * - - 1% 3% - * - Don t know / cannot remember 1% 1% - * 1% * - 1% 2% 1% Those who voted in the evening were less likely to give an excellent rating (73% vs. 81% of those who voted earlier). Page 85
86 Other aspects of the voting experience Overview of how the ballot paper was rated by voters Nearly all respondents rated the ballot paper statements as either 4 or 5 out of 5. The graph below shows the proportion of respondents rating 4 or 5 out of 5 for ballot paper experience statements. Since there have been no significant changes in the proportion of voters rating the ballot paper as a 4 or 5 out of 5 (across all three statements). Page 86
87 Rating the ease of finding name of person and party Most of those who voted at a polling place rated the ease of finding the name of the person and party on the ballot paper as excellent (78% - this is not significantly different from ). Results did not significantly vary among the key subgroups. (Further analysis by type of voter is found following the table). Ease of finding name of person and party N= , Excellent (5) 78% 79% 78% 73% 77% 79% 73% 80% 81% 77% 4 17% 17% 17% 18% 18% 16% 18% 12% 13% 15% 3 4% 3% 5% 6% 4% 5% 2% 7% 5% 7% 2 1% 1% * 2% 1% * 6% 1% 1% 1% Poor (1) * * % 1% Don t know / cannot remember The following voters were less likely to give an excellent rating: Voters who only vote in some Elections (65% vs. 78% of those who vote in every, or most, Elections). Those who cast an ordinary vote (77% vs. 91% of those who cast a special vote). Rating the clarity of instructions on how to cast vote Most of those who voted at a polling place rated the clarity of instructions on how to cast a vote as excellent (72% - which is similar to ). Results did not significantly vary among the key subgroups. (Further analysis by type of voter is found following the table). Clear instructions on how to cast vote N= , Excellent (5) 72% 73% 71% 68% 74% 80% 64% 80% 73% 73% 4 22% 19% 24% 23% 19% 13% 21% 16% 21% 13% 3 4% 4% 3% 6% 5% 5% 8% 4% 5% 13% 2 1% 1% 1% - * 1% 5% Poor (1) * * * 1% - - 2% Don t know / cannot remember 2% 2% - 2% 1% 1% 1% The following voters were less likely to give an excellent rating: Males (67% vs. 76% of females). Those who did not read an EasyVote pack (or only glanced at it) (64% vs. 75% of those who read it). Voters who only vote in some Elections (56% vs. 73% of those who vote in every, or most, Elections). Page 87
88 Rating layout of ballot paper Most of those who voted at a polling place rated the layout of the ballot paper as excellent (69% which is similar to the result when it was 72%). and voters were less likely to rate the layout as excellent. There were no other significant variations by key subgroup. (Further analysis by type of voter is found following the table). Layout of ballot paper N= , Excellent (5) 69% 72% 65% 67% 68% 75% 60% 79% 56% 69% 4 22% 21% 28% 25% 24% 17% 24% 14% 33% 19% 3 7% 5% 7% 5% 6% 6% 13% 6% 9% 11% 2 1% 2% - 3% 1% 1% 2% - 1% 2% Poor (1) 1% * - - * 1% 1% - 1% - Don t know / cannot remember - * - - * - 1% 1% - - The following voters were less likely to give an excellent rating: Those who were not eligible vote before (62% vs. 70% of those who were eligible to vote before ). Those who encountered problems or difficulties while voting (53% vs. 70% of those who didn t encounter any difficulties). Page 88
.")
89 Overview of how the Referendum voting paper was rated by voters Most voters (over 8 in 10) rated the Referendum voting paper positively. But the ratings were less positive than the equivalent ratings given to the Parliamentary ballot paper (see the chart below for details). Rating the ease of finding the options Most of those who voted at a polling place rated the ease of finding the Referendum options as excellent (73% - lower than the 78% who rated the ease of finding the person and party on the Parliamentary ballot paper as excellent ). voters were less likely to rate the ease of finding the options as excellent. There were no other significant variations by key subgroup. (Further analysis by type of voter is found following the table). Ease of finding the Referendum options N= Excellent (5) 73% 75% 70% 51% 72% 4 18% 19% 20% 13% 20% 3 5% 4% 7% 14% 5% 2 1% 1% 1% 3% * Poor (1) 2% 1% 1% 16% 4% Don t know / cannot remember 1% 1% 1% 3% - Page 89
90 The following voters were less likely to give an excellent rating: Those who did not read an EasyVote pack (or only glanced at it) (64% vs. 76% of those who read it). Those who cast an ordinary vote (72% vs. 87% of those who cast a special vote). Voters who only vote in some Elections (50% vs. 74% of those who vote in every, or most, Elections). Those who encountered problems or difficulties while voting (53% vs. 74% of those who didn t encounter any difficulties). Those who specifically wanted more information on the Referendum voting process (58%) or more information on the voting systems included in the Referendum (66%). Rating the layout Sixty one per cent rated the layout of the Referendum voting paper as excellent (this is lower than the 69% who rated the layout of the Parliamentary ballot paper as excellent ). respondents were less likely to rate the layout as excellent. There were no other significant variations by key subgroup. (Further analysis by type of voter is found following the table). The layout of the Referendum paper N= Excellent (5) 61% 63% 58% 42% 55% 4 25% 28% 29% 24% 25% 3 10% 5% 9% 22% 13% 2 2% 2% 3% 3% 3% Poor (1) 1% 1% * 8% 4% Don t know / cannot remember 1% * 1% 1% 1% Voters in Christchurch were more likely to give an excellent rating (72% vs. 61% national average). The following voters were less likely to give an excellent rating: Voters who only vote in some Elections (44% vs. 62% of those who vote in every, or most, Elections). Those who encountered problems or difficulties while voting (45% vs. 62% of those who didn t encounter any difficulties). Those who specifically wanted more information on the Referendum voting process (42%). Rating the clarity of instructions Almost two-thirds (63%) of those who voted at a polling place rated the clarity of instructions on how to vote in the Referendum as excellent (this is lower than the proportion who rated the Parliamentary voting paper instructions as excellent - 72%). voters were less likely to rate the instructions as excellent. There were no other significant variations by key subgroup. (Further analysis by type of voter is found following the table). Page 90
91 Clear instructions on how to vote in Referendum N= Excellent (5) 63% 64% 59% 45% 65% 4 20% 22% 25% 24% 20% 3 11% 10% 8% 13% 11% 2 2% 3% 5% 3% 2% Poor (1) 2% 2% 2% 14% 3% Don t know / cannot remember 1% - 1% 1% - Voters in Christchurch were more likely to give an excellent rating (74% vs. 63% national average). The following voters were less likely to give an excellent rating: Those who did not read an EasyVote pack (or only glanced at it) (52% vs. 67% of those who read it). Voters who only vote in some Elections (42% vs. 64% of those who vote in every, or most, Elections). Those who specifically wanted more information on the Referendum voting process (36%) or more information on the voting systems included in the Referendum (57%). Referring to the Referendum information table Voters were asked if they referred to the materials provided on the Referendum information table. Only 7% of voters said they did. This was higher among young voters and voters. There were no other significant variations by key subgroup. (Further analysis by type of voters is found following the table). Referring to the Referendum information table N= Yes 7% 14% 9% 19% 5% No 91% 84% 89% 81% 90% Don t know / cannot remember 2% 2% 1% - 5% The following type of voter was more likely to refer to the Referendum information table: Those who were not eligible vote before (13% vs. 6% of those who were eligible to vote before ). Those who encountered problems or difficulties while voting (17% vs. 6% of those who didn t encounter any difficulties). Page 91
92 Overview of how Election staff were rated by voters Nearly all respondents rated the service of Election Staff as either 4 or 5 out of 5. The graph below shows the proportion of respondents rating 4 or 5 out of 5 for the Election staff statements. Between and there have been no significant changes in the proportions of voters rating Election staff as 4 or 5 out of 5. Please note that those who did not meet staff or who did not know / cannot remember have been excluded from the calculations for the graph below. Page 92
93 Rating pleasantness and politeness Most of those who voted at a polling place rated the pleasantness and politeness of Election staff as excellent (89%). This is similar to the result in. and voters were less likely to rate the pleasantness of staff as excellent. There were no other significant variations by key subgroup. (Other analysis by type of voter is found underneath the table). Pleasantness and politeness N= Excellent (5) 89% 87% 86% 76% 88% 86% 76% 86% 75% 78% 4 9% 10% 9% 16% 10% 10% 15% 6% 22% 15% 3 1% 2% 3% 7% 2% 4% 5% 7% 1% 4% 2 1% * 1% * - - 3% - 2% - Poor (1) * * * * - 1% 1% - 1% 1% Don t know / cannot remember * * % The following groups of voters were less likely to give an excellent rating: Those aged up to 46 (85% vs. 91% of those aged 46 and over). Those who encountered a problem or difficulty while voting (79% vs. 89% of those who didn t encounter any difficulties). Rating staff efficiency Most of those who voted at a polling place rated the efficiency of Election staff as excellent (85%). This is not significantly different from (when it was 83%). As in, young voters were less likely to rate the efficiency of Election staff as excellent. In voters were less likely to rate the staff efficiency as excellent. There were no other significant variations by key subgroup. (Other analysis by type of voter is found underneath the table). Efficiency of staff N= Excellent (5) 85% 83% 79% 74% 86% 80% 78% 82% 76% 74% 4 11% 13% 17% 20% 11% 15% 14% 11% 17% 20% 3 2% 3% 3% 5% 2% 4% 3% 5% 4% 6% 2 1% 1% 1% 1% * * 2% - 1% - Poor (1) 1% * 1% - - * 2% 1% 1% - Don t know / cannot remember 1% * - - 1% - 1% 1% 2% - The following groups of voters were less likely to give an excellent rating: Voters who only vote in some Elections (73% vs. 86% of those who vote in every, or most, Elections). Those who encountered a problem or difficulty while voting (71% vs. 86% of those who didn t encounter any difficulties). Page 93
94 Rating ability to answer questions Respondents were asked to rate staff s ability to answer questions. A reasonably high proportion in said don t know or cannot remember and did not meet staff (20% gave one of these two answers). Those who said don t know or cannot remember or did not meet staff have been excluded from the analysis of the first table below. In total 84% of voters rated staff s ability to answer questions as excellent (this is not significantly different from the result which was 82%). and voters were less likely to rate staffs ability to answer questions as excellent. There were no other significant variations by the key subgroups. Ability to answer questions excluding Don t knows and Did not meet staff N= Excellent (5) 84% 82% 86% 80% 88% 85% 76% 81% 73% 77% 4 12% 13% 9% 16% 10% 11% 18% 8% 20% 20% 3 3% 4% 4% 4% 2% 3% 3% 8% 3% 3% 2 1% 1% * % 3% - Poor (1) 1% - * - * - 4% 1% 1% - The following voters were less likely to give an excellent rating: Voters who only vote in some Elections (73% vs. 85% of those who vote in every, or most, Elections). Those who had to queue (74% vs. 85% of those who didn t have to queue). Those who encountered a problem or difficulty while voting (70% vs. 85% of those who didn t encounter any difficulties). The second table below shows the proportions including those who said don t know/cannot remember or did not meet staff. Ability to answer questions N= , Excellent (5) 67% 62% 79% 70% 76% 71% 72% 73% 54% 68% 4 9% 10% 8% 14% 9% 9% 17% 7% 15% 18% 3 2% 3% 4% 4% 1% 3% 3% 7% 2% 3% 2 1% 1% - * % 2% - Poor (1) * * - - * - 3% 1% 1% - Don t know / cannot remember 17% 16% 4% 8% 9% 9% 4% 11% 25% 11% Did not meet staff 4% 8% 4% 4% 4% 8% 1% - - 1% Polling place problems Those who voted at a polling place were asked if they had any problems or difficulties, or had to ask for information or help. As in, the majority of voters (90%) did not experience any problems or difficulties, Page 94
95 and did not have to ask for information or help. However, the proportion of voters that had problems or difficulties was larger in than in (6% vs. 2%). In particular the proportion of voters that had problems or difficulties was much larger (21% vs. 2%). Young voters were more likely to ask for information or help, and voters were more likely to have problems or difficulties, and were also more likely than average to ask for information or help. Other significant differences by type of voter follows underneath the table. Issues at polling place N= , Had problems or difficulties 6% 2% 7% 2% 6% 1% 21% 2% 7% 3% Asked for information or help 5% 6% 12% 9% 7% 8% 13% 9% 7% 6% None of the above 90% 93% 83% 90% 89% 91% 73% 89% 87% 93% The following groups of voters were more likely to encounter problems or difficulties while voting: Those not born in New Zealand (9% vs. 4% of those born in New Zealand). Those who did not read (or only glanced at) the EasyVote pack (12% vs. 3% of those who read the pack). Those who cast a special vote (13% vs. 5% of those who cast an ordinary vote). Those who were not eligible vote before (11% vs. 5% of those who were eligible to vote before ). The following groups of voters were more likely to ask for information or help: Those living in Christchurch (10% vs. the national average of 5%). Those who cast a special vote (15% vs. 5% of those who cast an ordinary vote). Those who were not eligible vote before (11% vs. 4% of those who were eligible to vote before ). Those who encountered a problem or difficulty (21% vs. 4% of those who did not). This implies that most voters who encounter problems or difficulties do not ask for information or help. Page 95
96 Description of polling place issues Voters who did experience problems or difficulties, or had to ask for information or help were asked what happened. Answers were given unprompted (i.e. a set list of responses was not presented to respondents). Results are tabulated below. Two common issues were: needing help to understand the Referendum voting paper (21% of those who encountered problems or asked for help) and needing more information on Referendum voting systems (13%). Both of these answers were not relevant to when there was no Referendum. Other common issues include poor signage/directions (15%) and requesting information about how to vote (11%). Young voters seeking help or encountering issues were more likely to ask for information about how to vote. voters were more likely to need more help understanding the Referendum voting paper or more information on the Referendum voting systems, they were also more likely to ask for help on the EasyVote card. There were no other significant variations by the key subgroups. Results should be treated with caution due to small base sizes. What issue occurred at polling place? N= Needed help understanding the 21% n/a 24% n/a 28% n/a 40% n/a 23% n/a Referendum voting paper Poor signage/direction once inside polling place 15% 27% 8% 21% 4% 31% 22% 10% 29% 29% Needed more information on Referendum voting 13% n/a 8% n/a 17% n/a 35% n/a - n/a systems Needed information on how to vote 11% 22% 32% 43% 3% 12% 22% 10% 19% 43% Had questions about the EasyVote card 9% 8% - 6% - 5% 27% % Needed information on making a special vote 6% - 9% - 6% - 6% - 20% - General help pens not working, couldn t read 5% 10% - 6% 10% - 13% 10% - - paper etc. Staff were not helpful or were unable to answer 4% 4% 5% 3% - 6% 6% questions Made mistakes when completing ballot paper 4% 3% - 3% - 9% 6% Found the second question on voting systems in 3% n/a 3% n/a 6% n/a - n/a - n/a Referendum confusing Needed more information when party had no candidate/needed more 1% 2% 6% 6% - - 3% 10% - - information available on parties/candidates Not on General roll * - 3% % - 14% Don't know / cannot remember 2% 5% - 6% 3% 5% Other 26% 11% 15% 9% 34% 29% 14% 50% 18% 29% Page 96
97 The issues faced varied among some groups of voters: Those with a health problem were more likely to need help understanding the Referendum voting paper (49% vs. 19% of those without a health problem). Those who cast a special vote were more likely to need information on making a special vote (40% vs. 2% of those who cast an ordinary vote). Those who were not eligible vote before were more likely to need information on how to cast their vote (29% vs. 8% of those who were eligible to vote before ). Page 97
98 Overall satisfaction of voting experience In voters were asked overall how satisfied are you with the whole voting process including information before the Election and your experience of voting itself? (This question was not asked in ). 88% of voters were satisfied (35% gave a 4 out of 5 for satisfaction and 53% gave a 5 out of 5, or excellent, rating). voters were more likely to be satisfied overall (94% either scored 4 or 5 out of 5 compared with 88% on average). voters were less likely to be satisfied overall (70% vs. 88% average). Young voters were less likely to be very satisfied (36% scored 5 out of 5, compared to 53% on average). Similarly voters were less likely to be very satisfied (41%). The results are illustrated in the table below. Overall satisfaction with voting experience N= Very dissatisfied 1% * * 6% 1% 2 2% * 1% 10% - NET DISSATISFIED 2% 1% 2% 16% 1% 3 10% 11% 4% 14% 15% 4 35% 53% 38% 29% 34% 5 Very satisfied 53% 35% 56% 41% 50% NET SATISFIED 88% 89% 94% 70% 85% Don t know There were not many variations between groups of voters when it came to the proportion giving a positive rating of 4 or 5 (out of 5). However, there was some variation in the proportions that gave a very satisfied rating (i.e. 5 out of 5). The following groups of voters were less likely to give a rating of 5 out of 5: Those aged up to 46 (44% vs. 60% of those aged 46 and over). Those who did not read (or only glanced at) the EasyVote pack (48% vs. 55% of those who read the pack). Those who only vote in some General Elections (33% vs. 54% of those who vote in all, or most, Elections). Those who were not eligible vote before (41% vs. 54% of those who were eligible to vote in previous General Elections). Those who encountered a problem or difficulty while voting (28% vs. 53% of those who didn t encounter any difficulties). Those who voted in the evening (41% vs. 58% of those who voted in the morning and 51% of those who voted in the afternoon). Page 98
99 Election night results Watching results as they came in Voters and non-voters were asked if they followed the Election results as they came in on Election night. Voters Seventy per cent of voters followed the results as they came in on Election night, this is similar to (when it was 72%). However, the result is significantly lower than in 2005 (when 77% of voters followed the results on Election night). voters were less likely to follow the results. voters were more likely to follow the results. (Analysis by other groups of voters follows after the table). Followed Election results? N= Yes 70% 72% 70% 71% 63% 69% 73% 73% 79% 81% No 30% 28% 30% 29% 37% 31% 27% 27% 21% 19% The following types of voters were more likely to follow the results as they came in: Those with a University or postgraduate degree (78% vs. 66% of those with a lower qualification). Those who cast an ordinary vote (71% vs. 56% of those who cast special votes). Non-voters Non-voters were less likely to follow the results compared to voters (33% vs. 71%). The finding for non-voters is significantly lower than the survey (when 47% of non-voters watched the results). There were no significant variations among the key subgroups of non-voters. Results for and nonvoters should be treated with caution due to the small base sizes. Followed Election results? N= Yes 33% 47% 36% 52% 33% 43% 23% 48% 36% 62% No 67% 53% 64% 47% 67% 57% 77% 52% 64% 38%
100 How were results followed? Voters and non-voters who followed the Election results on Election night were asked how they followed the results. Voters Nearly all voters who followed the results said they watched the results come in on television (93%). Results are similar to. voters following the results were less likely to follow them on television, whereas voters were more likely to follow the results on television. There were no other significant variations by the key subgroups. (Further analysis by type of voter is found underneath the table). How voters followed Election results N= Television 93% 97% 94% 93% 95% 96% 99% 96% 87% 93% Radio 4% 4% 3% 5% 3% 3% 3% 4% 4% 7% Elections website 2% 2% 5% 6% 2% 2% 1% 1% 4% 5% Other website other sites, e.g. news 4% 2% 6% 3% 7% 2% 1% 1% 8% 4% Telephone * 1% - 2% - * - - 2% 1% 3G / smartphone 1% - 1% - 1% Text with family - * - 2% - 1% - 1% - 1% Newspapers - * % - 3% 2% 1% Word-of-mouth 1% - 1% % - Other * - 1% - * Don t know / cannot remember - * - 1% - 1% There were some differences in how different groups of voters followed the results: Those aged up to 46 were more likely to follow the results on the Elections website (5% vs. 1% of those aged 46 and over), other websites (9% vs. 1%), or on their 3G/smartphone (3% vs. 0%). They were less likely to follow the results on television (91% vs. 95%) or radio (2% vs. 6%). Males were more likely to follow the results on other websites (7% vs. 2% of females) or on their 3G/smartphones (3% vs. less than 1% of females). Males were less likely to follow the results on television (91% vs. 95% of females). Those with a University or postgraduate degree were more likely to follow the results on other websites (7% vs. 3% of those with lower qualifications). Those who cast a special vote were less likely to follow the results on television (82% vs. 94% of those who cast ordinary votes). Page 100
101 Non-voters Most non-voters who followed the results said they watched the results come in on television (83%), although other websites were also popular (8%). non-voters following the results were more likely to follow them on television. There were no other significant variations by the key subgroups. Results are not significantly different from. Results for, and non-voters should be treated with caution due to a small base size. How non-voters followed Election results N= Television 83% 84% 74% 85% 100% 96% 89% 83% 76% 85% Radio 4% 2% 2% % 28% 8% Elections website 3% 3% 10% 6% % 4% Other website other sites, e.g. news 9% 11% 14% 9% 8% 4% 6% 8% 3% 8% Telephone - 1% - 2% % Text with family * 3% 1% 1% - - 6% Newspapers 1% * 3% 1% % - Word-of-mouth 1% - 2% G / smartphone 3% Don t know / cannot remember - * - 1% Those who didn t consider voting in the Election were less likely to follow the results on television (62% vs. 91% of non-voters who considered voting). Timeliness of results All respondents who followed the results were asked how satisfied they were with the timeliness of the results. A scale of 1 to 5 was used, where 1 was very dissatisfied and 5 was very satisfied. Voters Overall, most voters (87%) were either very satisfied (53%) or satisfied (35%) with the timeliness of the results. This level of satisfaction among voters (87% gave a 4 or 5 out of 5 for satisfaction with the timeliness of results) is not significantly different from the equivalent finding in (when 90% were satisfied). Satisfaction was lower among voters. There were no other significant variations among the key subgroups. Page 101
102 Satisfaction with timeliness of results N= Very dissatisfied 1% 1% 1% 2% - 3% 4% 3% 3% 4% 2 1% 1% 1% 1% 2% 2% 7% 7% - 2% NET DISSATISFIED 2% 2% 2% 3% 2% 6% 11% 10% 3% 6% 3 9% 8% 11% 11% 12% 10% 22% 10% 9% 10% 4 35% 34% 32% 31% 27% 33% 40% 27% 36% 25% 5 Very satisfied 53% 56% 54% 55% 57% 52% 28% 53% 52% 59% NET SATISFIED 87% 90% 87% 86% 84% 84% 68% 80% 88% 84% Don t know 2% - 2% - - Those with a household income of $75,000 or more were more likely than average to score 4 or 5 out of 5 for satisfaction with the timeliness of results (93% vs. 84% of those with a lower household income). Non-voters Seventy seven per cent of non-voters who followed the results were either very satisfied (51%) or satisfied (25%) with the timeliness of the results. This is lower than satisfaction among voters. Satisfaction is similar to (when 78% of non-voters were either very satisfied or satisfied). Results did not significantly vary among the key subgroups. Results for, and non-voters should be treated with caution due to the small base sizes. Satisfaction with timeliness of results 1 -Very dissatisfied NET DISSATISFIED 5 Very satisfied NET SATISFIED N= % - 1% % - 4% 2 2% 3% 2% 5% 4% 3% - 8% 10% 4% 2% 4% 2% 6% 4% 3% - 33% 10% 8% 3 21% 16% 25% 22% 34% 17% 45% 17% 30% 15% 4 25% 27% 25% 35% 18% 44% 6% 8% 21% 38% 51% 51% 47% 37% 44% 29% 50% 42% 39% 38% 77% 78% 72% 71% 62% 73% 55% 50% 60% 77% Don t know - 1% % Page 102
103 Non-voters Possibility of voting in Election Non-voters were asked if there was any time before the Election when they thought they might vote in this Election. 64% had considered voting in this Election. This was higher among non-voters. Results did not significantly vary among the other key subgroups. The result is not significantly different from the equivalent figures in. Results for and non-voters should be treated with caution due to the small base sizes. (Other analysis by type of non-voter is found underneath the table). Possibility of voting? N= Yes 64% 69% 70% 73% 83% 73% 56% 76% 66% 74% No 35% 29% 29% 24% 16% 22% 44% 24% 34% 24% Don t know / cannot remember * 3% 1% 3% 1% 5% % The following types of non-voters were more likely than average to have considered the possibility of voting: Females (79% vs. 52% of males). Those who read the EasyVote pack - 86% vs. 51% of those who did not read it (or only glanced at it). Those not eligible to vote before (80% vs. 61% of those who were eligible to vote before this). Those who vote in most General Elections (76% vs. 59% of those who only vote in some Elections or no Elections). When decided not to vote Non-voters were asked at what time before Election Day they decided not to vote. Similar to, just under half (43%) of non-voters decided on Election Day that they would not vote. This was higher among nonvoters (results did not significantly vary among other key subgroups). Results for and non-voters should be treated with caution due to the small base sizes. (Other analysis by type of non-voter is found underneath the table). When decided not to vote N= On Election Day 43% 48% 44% 53% 64% 55% 44% 52% 43% 45% One week before Election Day 18% 16% 20% 15% 13% 8% 12% 24% 21% 26% Two weeks before 5% 3% 8% 5% - 1% 2% 4% 3% 10% About a month before 4% 8% 4% 8% 1% 4% 9% 4% 5% 2% More than a month ago 23% 19% 22% 14% 19% 19% 27% 16% 15% 10% Don t know/can t remember 6% 6% 3% 6% 4% 14% 5% - 12% 7% Page 103
104 Some groups of non-voters decided at different times: Females were more likely to decide on Election Day (52% vs. 35% of males). Whereas males were more likely to have decided more than a month before Election Day (30% vs. 16%). Those with a University Degree or postgraduate qualification were more likely to decide in the week before Election Day (32% vs. 16% of those with a lower qualification). Those with a health problem were more likely to decide in the week before Election Day (45% vs. 16% of those without a health problem). Those who did not read the EasyVote pack (or only glanced at it) were more likely to decide more than a month before Election Day (33% vs. 8% of those who read the EasyVote pack). Those who only vote in some, or no, General Elections were more likely to decide more than a month before Election Day (32% vs. 6% of those who vote in most Elections). Those who were eligible to vote before were more likely to decide more than a month before Election Day (27% vs. 13% of those who were eligible to vote for their first General Election in ). Those who considered voting were more likely to make their decision not to vote on Election Day itself (65% vs. 3% of those who never considered voting). ision making process Non-voters were asked how much thought they put into their decision not to vote. 30% percent put a lot of thought into it. 41% put just a little though into it, and 29% didn t think about it at all. These results are similar to. Young non-voters were more likely to say they put just a little thought into it. and non-voters were more likely to not think about it at all. Results for and non-voters should be treated with caution due to the small base sizes. (Other analysis by type of non-voter is found underneath the table). ision making process for non-voters N= Put a lot of thought into deciding whether or not 30% 33% 22% 13% 26% 31% 31% 48% 15% 21% to vote Put just a little thought into it 41% 36% 54% 50% 29% 31% 21% 32% 47% 48% Didn t think about it at all 29% 31% 24% 37% 45% 38% 48% 20% 38% 31% Some groups of non-voters put different levels of thought into their decision: Those with a health problem were more likely to have put a lot of thought into their decision (61% vs. 27% of those without health problems). Those who read their EasyVote pack were more likely to have put a lot of thought into their decision (41% vs. 23% of those who didn t read it, or only glanced at it). Those who vote in most General Elections were more likely to have put a lot thought into it (42% vs. 24% of those who only vote in some, or no, Elections). Those who considered voting were more likely to have put a lot of thought into it (36% vs. 19% of those who never considered voting). Page 104
105 Those who were not eligible vote before were more likely to have put a little thought into it (58% vs. 37% of those who were eligible to vote before ). Reasons for not voting Main reason for not voting Non-voters were asked what their main reason was for not voting. The question was asked un-prompted (i.e. a response list was not read out). The main reasons for not voting tended to be that people had other commitments (11%) or had work commitments (8%), couldn t be bothered voting (8%), or could not work out who to vote for (8%). Results are not significantly different from. non-voters were more likely to say it was because they were away from home and overseas. nonvoters were more likely to say it was because their vote did not make any difference. Young non-voters were less likely to say it was because their vote did not make any difference (they were also less likely to say they were away from home and overseas). Results for and non-voters should be treated with caution due to the small base sizes. (Other analysis by type of non-voter is found underneath the table). Page 105
106 Reason for not voting N= Had other commitments 11% 14% 10% 24% 14% 13% 17% 20% 17% 21% Had work commitments 8% 8% 11% 16% 5% 7% 12% 12% 10% 10% Can t be bothered voting 8% 5% 9% 8% 14% 9% 2% 12% 14% 5% Couldn t work out who to vote for 8% 5% 12% 6% 6% 7% 3% - 5% 7% Away from home and overseas 6% 8% 2% 1% 5% 7% 5% 4% 19% - Away from home but still in New Zealand 6% 5% 7% 4% 4% 4% - 8% 7% 5% My vote doesn t make any difference 6% 2% 2% 1% 5% 2% 28% - - 2% Religious day (ie, Sabbath, Holy Day) % Religious reasons - other 6% 7% 6% 2% 5% 4% - 8% - 2% Health reasons 5% 4% 4% 3% 4% 5% 9% 8% 1% 7% Can t be bothered with politics or politicians 5% 4% 6% 6% 5% 2% - 8% - 5% I forgot 4% 7% 1% 2% 5% 10% 9% - 3% 2% Didn t know the candidates 3% 4% 7% 4% 3% 1% - 4% 8% 5% Disagreed with the policies 3% 2% 1% - - Polling place too far away/no transport 2% 1% - - 5% Didn t get to the polling place on time 2% 2% 6% 1% 5% 1% 4% Did not know enough about the policies 2% 5% 1% - - Did not like any of the candidates 2% 1% 2% 5% - Makes no difference who the government is 1% 1% 2% 1% 1% 2% % It was a forgone conclusion 1% Makes no difference who the government is 1% 1% 2% 1% 1% 2% % Disability 1% 1% - 1% - 1% Didn t know how to vote * 1% 1% % - Didn t know when to vote * - * - - 2% - - 1% - Didn t know where to vote * - * % 2% Not important - 1% % - - Other 7% 16% 3% 18% 10% 15% 7% 12% 10% 19% No particular reason 1% 1% 2% 2% 1% 5% - - 1% 2% Don t know/can t remember * 2% 1% 1% % Refused 2% 1% * % - Page 106
107 Other reasons for not voting Non-voters were also asked if there were any additional reasons for not voting (unless they did not give any reason in the first place). Most (68%) did not have any additional reasons. There were no significant differences in this question since. Results for and non-voters should be treated with caution due to the small base sizes. (Other analysis by type of non-voter is found underneath the table). Other reasons for not voting N= No other reason 68% 71% 75% 64% 60% 67% 40% 52% 92% 68% Can t be bothered voting 7% 1% 5% 3% 13% 6% 19% 8% 1% - Did not know I could vote in advance 4% - 1% Couldn t work out who to vote for 3% - 4% 2% 3% - 1% 4% - - Had other commitments 3% 3% 1% 3% 11% 1% 1% 12% - 5% Can t be bothered with politics or politicians 2% 1% 2% 2% - 1% 12% 4% - - My vote doesn t make any difference 2% 1% 3% 1% - - 9% 4% 4% 2% I forgot 2% 2% 3% 4% 1% - 17% 4% - 2% Didn t know the candidates 2% 1% 3% 1% % - 1% 5% Didn t get to the polling place on time 2% 1% 1% 1% 1% - 1% - - 2% Didn t know how to vote 1% - 1% 1% 3% - 9% 4% - 8% Makes no difference who the government is 1% 2% 1% 1% % - 1% 2% Polling place too far away/no transport 1% 1% 1% 2% 1% 2% Didn t know when to vote 1% - 1% 1% % - - 2% Didn t know where to vote 1% - 1% 1% % - - 2% Health reasons 1% 1% - - 1% 1% - 4% - 2% Had work commitments 1% 3% 2% 3% 1% 5% - 4% 1% - Didn t know enough about the policies 1% - 3% - 3% % - Forgone conclusion 1% % Away from home but still in New Zealand * 1% - 1% - 2% % Not important * 1% % Religious reasons - other - 1% Disability % Other 4% 8% - 10% 4% 8% 9% 16% 1% 5% No particular reason - 1% - 2% - 5% Don t know/can t remember - 2% - 1% Refused - 1% Page 107
108 Overall reasons for not voting The main reasons for not voting were combined with the secondary reasons for not voting to provide results for all reasons given by non-voters (regardless of whether that option was chosen as the main or additional reason). Results are outlined in the table overleaf. The main overall reasons for not voting were that they had other commitments (14%) or work commitments (9%), could not be bothered voting (14%), couldn t work out who to vote for (11%) and that their vote would not make a difference (8%). Please see details in the table overleaf. There are no significant differences in this question since. Young non-voters were more likely to say they didn t know the candidates and were less likely to say they were away from home and overseas. non-voters were more likely to say they had other commitments. non-voters were more likely to say their vote did not make any difference, they didn t know the candidates, or that they forgot. non-voters were more likely to say it was because they were away from home and overseas. Results for and non-voters should be treated with caution due to the small base sizes. (Other analysis by type of non-voter is found underneath the table). Page 108
109 Overall reasons for not voting N= Had other commitments 14% 17% 12% 27% 25% 14% 18% 32% 17% 26% Can t be bothered voting 14% 6% 14% 11% 16% 15% 22% 20% 15% 5% Couldn t work out who to vote for 11% 6% 16% 7% 8% 7% 4% 4% 5% 7% Had work commitments 9% 10% 13% 17% 7% 12% 12% 16% 11% 10% My vote doesn t make any difference 8% 2% 4% 2% 5% 2% 38% 4% 3% 5% Can t be bothered with politics or politicians 7% 5% 8% 8% 5% 4% 12% 12% - 5% Away from home and overseas 6% 8% 2% 1% 5% 7% 5% 4% 19% - Health reasons 6% 5% 4% 3% 5% 6% 9% 12% 1% 7% Religious day (ie, Sabbath, Holy Day) % Religious reasons - other 6% 7% 6% 2% 5% 4% - 8% - 2% Away from home but still in New Zealand 6% 6% 7% 4% 4% 5% - 8% 7% 7% I forgot 5% 9% 3% 6% 6% 10% 26% 4% 3% 5% Didn t know the candidates 4% 4% 10% 6% 3% 1% 19% 4% 8% 10% Didn t get to the polling place on time 4% 2% 6% 2% 6% 1% 5% - - 2% Disagreed with the policies 3% - 2% - 1% Didn t know enough about the policies 3% - 8% - 4% % - Polling place too far away/no transport 3% 1% 1% 2% 6% 2% Did not know I could vote in advance 3% - 1% Makes no difference who the government is 2% 3% 3% 2% 1% 2% 19% - 1% 5% Did not like any of the candidates 2% - 1% - 2% - 5% Forgone conclusion 2% % Didn t know how to vote 1% 1% 2% 1% 3% - 9% 4% 1% 7% Didn t know when to vote 1% - 1% 1% - 2% 10% - 1% 2% Didn t know where to vote 1% - 1% 1% % - 1% 5% Disability 1% 1% - 1% - 1% Not important * 2% % - 4% - - Other 11% 24% 3% 27% 13% 24% 16% 20% 11% 19% No particular reason 1% 1% 2% 2% 1% 5% - - 1% - Don t know/can t remember * 2% 1% 1% % Refused 2% - * % - Page 109
110 Different groups of non-voters give different reasons for not voting: Those aged 46 and over were more likely to say it was because of health reasons (13% vs. 4% of those aged up to 46), because they were away from home and overseas (12% vs. 4%), or because the polling place was too far away (8% vs. 1%). Males were more likely to say they can t be bothered with politics (12% vs. 1% of females). Whereas women were more likely to say it was because they could not work out who to vote for (16% vs. 7% of males) or because they did not know the candidates (8% vs. 2%). Those with a University Degree or postgraduate qualification were more likely to say it was because they were away from home but still in New Zealand (17% vs. 3% of those with lower qualifications). Those with health problems were more likely to say it was because of health reasons (37% vs. 6% of those without health problems), but they were also more likely to say it was because their vote did not make a difference (23% vs. 8%). Those who didn t read the EasyVote pack (or only glanced at it) were more likely to say it was because they cannot be bothered voting (18% vs. 6% of those who read the pack) or they cannot be bothered with politics (10% vs. 2%). Those who vote in most General Elections were more likely to say it was because they were away from home and overseas (14% vs. 2% of those who only vote in some, or no, Elections) or away from home and still in New Zealand (12% vs. 3%), or because of health reasons (13% vs. 3%), or because they did not know they could vote in advance (10% vs. less than 1%), or because the polling place was too far away (7% vs. 1%). Those who were not eligible vote before were more likely to say it was because they had work commitments (18% vs. 7% of those who were eligible to vote before ) or because they did not know the candidates (10% vs. 2%). Those who never considered voting were more likely to say it was because they could not be bothered voting (23% vs. 8% of those who considered it), they could not be bothered with politics (16% vs. 2%), or because of religious reasons (15% vs. 1%). Factors that influence voting Non-voters were presented with a list of possible factors that may have influenced their decision not to vote and were asked to rate the impact of those factors on a scale of 1 to 5 with 1 being no influence at all and 5 being a lot of influence. This list was rotated so that the order of statements systematically varied from respondent-to-respondent. The factors that had the highest proportions of non-voters saying the impact was 4 or 5 out of 5 were I don t trust politicians (33% of all non-voters), it was obvious who would win so why bother (31%), and I m just not interested in politics (29%). Since there has been an increase in the proportion of non-voters saying it was obvious who would win so why bother (from 19% to 31%). non-voters were more likely to say that it was obvious who was going to win (59% compared to 31% of all non-voters), and were more likely to say their vote didn t make a difference (52% vs. 22% of all non-voters). They were also more likely to say they didn t like any of the personalities (46% vs. 19% of all non-voters) and that it makes no difference to their life who wins (49% vs. 28% of all non-voters). Young non-voters were more likely to say it was because they did not have enough information (33% vs. 22% of all non-voters). Young non-voters were less likely to say that they did not trust politicians (20% compared to Page 110
.")
111 33% for all non-voters). This was similar for non-voters (17% vs. 33% of all non-voters). nonvoters were less likely to say that they did not like any of the personalities (2% vs. 19% of all non-voters). Other analysis by type of non-voter follows underneath the chart. Page 111
This report is formatted for double-sided printing.
 Public Opinion Survey on the November 9, 2009 By-elections FINAL REPORT Prepared for Elections Canada February 2010 Phoenix SPI is a Gold Seal Certified Corporate Member of the MRIA 1678 Bank Street, Suite
Elections Alberta Survey of Voters and Non-Voters
 Elections Alberta Survey of Voters and Non-Voters RESEARCH REPORT July 17, 2008 460, 10055 106 St, Edmonton, Alberta T5J 2Y2 Tel: 780.423.0708 Fax: 780.425.0400 www.legermarketing.com 1 SUMMARY AND CONCLUSIONS
ONE News Colmar Brunton Poll
 ONE News Colmar Brunton Poll 22-27 July Attention: Television New Zealand Contact: (04) 913-3000 Release date: 30 July Level One, 6-10 The Strand PO Box 33690 Takapuna Auckland 0740 Ph: (09) 919-9200 Level
FINAL REPORT. Public Opinion Survey at the 39th General Election. Elections Canada. Prepared for: May MacLaren Street Ottawa, ON K2P 0M6
 FINAL REPORT Public Opinion Survey at the 39th General Election Prepared for: Elections Canada May 2006 336 MacLaren Street Ottawa, ON K2P 0M6 TABLE OF CONTENTS List of Exhibits Introduction...1 Executive
Community perceptions of migrants and immigration. D e c e m b e r
 Community perceptions of migrants and immigration D e c e m b e r 0 1 OBJECTIVES AND SUMMARY OBJECTIVES The purpose of this research is to build an evidence base and track community attitudes towards migrants
The Local Government New Zealand
 Attachment 1 to Report 05.3 11 Page 1 of47 The Local Government New Zealand 2004 Post-election Survey A survey of voters and non-voters in selected councils following the 2004 local outhority elections
QUALITY OF LIFE QUALITY OF LIFE SURVEY 2016 Executive Summary and Research Design
 QUALITY OF LIFE QUALITY OF LIFE SURVEY 2016 Executive Summary and Research Design Quality of Life Survey 2016 Executive Summary and Research Design A joint project between the following New Zealand councils
ONE News Colmar Brunton Poll
 ONE News Colmar Brunton Poll 1-5 July Attention: Television New Zealand Contact: (04) 913-3000 Release date: 9 July Level One, 6-10 The Strand PO Box 33690 Takapuna Auckland 0740 Ph: (09) 919-9200 Level
1 NEWS Colmar Brunton Poll
 1 NEWS Colmar Brunton Poll 29 November - 5 December Attention: Television New Zealand Contact: (04) 913-3000 Release date: 10 December Level One 46 Sale Street, Auckland CBD PO Box 33690 Takapuna Auckland
1 News Colmar Brunton Poll
 1 News Colmar Brunton Poll 12-16 Aug Attention: Television New Zealand Contact: (04) 913-3000 Release date: 17 August Level One, 6-10 The Strand PO Box 33690 Takapuna Auckland 0740 Ph: (09) 919-9200 Level
1 NEWS Colmar Brunton Poll
 1 NEWS Colmar Brunton Poll 10-14 February 2018 Attention: Television New Zealand Contact: (04) 913-3000 Release date: 19 February 2018 Level One 46 Sale Street, Auckland CBD PO Box 33690 Takapuna Auckland
1 NEWS Colmar Brunton Poll
 1 NEWS Colmar Brunton Poll 28 July 1 August Attention: Television New Zealand Contact: (04) 913-3000 Release date: 5 August Level One 46 Sale Street, Auckland CBD PO Box 33690 Takapuna Auckland 0740 Ph:
Standing for office in 2017
 Standing for office in 2017 Analysis of feedback from candidates standing for election to the Northern Ireland Assembly, Scottish council and UK Parliament November 2017 Other formats For information on
2016 Nova Scotia Culture Index
 2016 Nova Scotia Culture Index Final Report Prepared for: Communications Nova Scotia and Department of Communities, Culture and Heritage March 2016 www.cra.ca 1-888-414-1336 Table of Contents Page Introduction...
Motivations and Barriers: Exploring Voting Behaviour in British Columbia
 Motivations and Barriers: Exploring Voting Behaviour in British Columbia January 2010 BC STATS Page i Revised April 21st, 2010 Executive Summary Building on the Post-Election Voter/Non-Voter Satisfaction
Voter ID Pilot 2018 Public Opinion Survey Research. Prepared on behalf of: Bridget Williams, Alexandra Bogdan GfK Social and Strategic Research
 Voter ID Pilot 2018 Public Opinion Survey Research Prepared on behalf of: Prepared by: Issue: Bridget Williams, Alexandra Bogdan GfK Social and Strategic Research Final Date: 08 August 2018 Contents 1
Survey of Candidates of the 41 st Federal General Election
 Survey of Candidates of the 41 st Federal General Election FINAL REPORT Prepared for Elections Canada 2011 Phoenix SPI is a Gold Seal Certified Corporate Member of the MRIA 1678 Bank Street, Suite 2, Ottawa,
Vancouver Police Community Policing Assessment Report Residential Survey Results NRG Research Group
 Vancouver Police Community Policing Assessment Report Residential Survey Results 2017 NRG Research Group www.nrgresearchgroup.com April 2, 2018 1 Page 2 TABLE OF CONTENTS A. EXECUTIVE SUMMARY 3 B. SURVEY
Public opinion and the 2002 local elections
 Public opinion and the 2002 local elections In May 2002 NOP conducted two surveys for The Electoral Commission: Survey A in English areas with local elections in May 2002, designed to gauge attitudes to
Woking May 2018 voter identification pilot evaluation
 Woking May 2018 voter identification pilot evaluation Summary of key findings The voter identification pilot scheme in Woking required voters to produce one form of photographic identification or a Local
Post-election round-up: New Zealand voters attitudes to the current voting system
 MEDIA RELEASE 14 November 2017 Post-election round-up: New Zealand voters attitudes to the current voting system The topic: Following on from the recent general election, there has been much discussion
Awareness of and Attitudes Towards Voting in the 2016 Auckland Council Elections. June 2017 Technical Report 2017/013
 Awareness of and Attitudes Towards Voting in the 2016 Auckland Council Elections June 2017 Technical Report 2017/013 Awareness of and attitudes towards voting in the 2016 Auckland Council elections June
COMMUNITY PERCEPTIONS OF MIGRANTS AND IMMIGRATION
 COMMUNITY PERCEPTIONS OF MIGRANTS AND IMMIGRATION 3 1 EXECUTIVE SUMMARY 4 1.1 EXECUTIVE SUMMARY INTRODUCTION This report presents the findings from a Community survey designed to measure New Zealanders
41 st General Election Survey of Administrators Regarding the Use of the Voter Information Card as Proof of Address
 41 st General Election Survey of Administrators Regarding the Use of the Voter Information Card as Proof of Address FINAL REPORT Ce rapport est également disponible en français Submitted to Elections Canada
Committee for Economic Development: October Business Leader Study. Submitted to:
 ZOGBY INTERNATIONAL Committee for Economic Development: October Business Leader Study Submitted to: Mike Petro Vice President of Business and Government Policy and Chief of Staff Submitted by: Zogby International
Settling in New Zealand
 Settling in New Zealand Migrants perceptions of their experience 2015 Migrant Survey ISBN 978-1-98-851761-2 (online) May 2017 Disclaimer The Ministry of Business, Innovation and Employment has made every
City of Toronto Municipal Election 2014 Post Election Survey. Final Report February 2, 2015
 City of Toronto Municipal Election 2014 Post Election Survey Final Report February 2, 2015 Table of Contents Background and Research Objectives 3 Research Methodology 4 Executive Summary 7 Recommendations
An Assessment of Ranked-Choice Voting in the San Francisco 2005 Election. Final Report. July 2006
 Public Research Institute San Francisco State University 1600 Holloway Ave. San Francisco, CA 94132 Ph.415.338.2978, Fx.415.338.6099 http://pri.sfsu.edu An Assessment of Ranked-Choice Voting in the San
EMBARGOED NOT FOR RELEASE UNTIL: SUNDAY, OCTOBER 17, 1993 FLORIO MAINTAINS LEAD OVER WHITMAN; UNFAVORABLE IMPRESSIONS OF BOTH CANDIDATES INCREASE
 EMBARGOED NOT FOR RELEASE UNTIL: SUNDAY, OCTOBER 17, 1993 RELEASE INFORMATION A story based on the survey findings presented in this release and background memo will appear in Sunday's Star- Ledger. We
The Cook Political Report / LSU Manship School Midterm Election Poll
 The Cook Political Report / LSU Manship School Midterm Election Poll The Cook Political Report-LSU Manship School poll, a national survey with an oversample of voters in the most competitive U.S. House
for Mt Albert By-Election on 25 February 2017
 Information booklet for Mt Albert By-Election on 25 February 2017 Letter to Blind Foundation members (page 1) Information about the By-Election (page 4) Telephone Dictation Voting (page 9) Adapted in 2017
Voting and Elections
 Voting and Elections General Elections Voters have a chance to vote in two kinds of elections: primary and general In a Primary election, voters nominate candidates from their political party In a General
1. A Republican edge in terms of self-described interest in the election. 2. Lower levels of self-described interest among younger and Latino
 2 Academics use political polling as a measure about the viability of survey research can it accurately predict the result of a national election? The answer continues to be yes. There is compelling evidence
Bromley May 2018 voter identification pilot evaluation
 Bromley May 2018 voter identification pilot evaluation Summary of key findings In the Bromley voter identification pilot voters were required to show one form of photographic identification or two forms
HILLARY CLINTON LEADS 2016 DEMOCRATIC PRESIDENTIAL HOPEFULS; REPUBLICANS WITHOUT A CLEAR FRONTRUNNER
 For immediate release Tuesday, April 30, 2012 8 pp. Contact: Krista Jenkins 908.328.8967 kjenkins@fdu.edu HILLARY CLINTON LEADS 2016 DEMOCRATIC PRESIDENTIAL HOPEFULS; REPUBLICANS WITHOUT A CLEAR FRONTRUNNER
SURVEY ASSESSING BARRIERS TO WOMEN OBTAINING COMPUTERIZED NATIONAL IDENTITY CARDS (CNICs) February 2013
 February 2013") SURVEY ASSESSING BARRIERS TO WOMEN OBTAINING COMPUTERIZED NATIONAL IDENTITY CARDS (CNICs) February 2013 Survey Assessing Barriers to Women Obtaining Computerized National Identity Cards (CNICs) Survey
SURVEY ASSESSING BARRIERS TO WOMEN OBTAINING COMPUTERIZED NATIONAL IDENTITY CARDS (CNICs) February 2013 Survey Assessing Barriers to Women Obtaining Computerized National Identity Cards (CNICs) Survey
REPORT ON THE Evaluations of the 41st General Election
 REPORT ON THE Evaluations of the 41st General Election of May 2, 2011 Library and Archives Canada Cataloguing in Publication Elections Canada Report on the evaluations of the 41st general election of May
Vermonters Awareness of and Attitudes Toward Sprawl Development in 2002
 Vermonters Awareness of and Attitudes Toward Sprawl Development in 2002 Written by Thomas P. DeSisto, Data Research Specialist Introduction In recent years sprawl has been viewed by a number of Vermont
How Employers Recruit Their Workers into Politics And Why Political Scientists Should Care
 How Employers Recruit Their Workers into Politics And Why Political Scientists Should Care Alexander Hertel-Fernandez Harvard University ahertel@fas.harvard.edu www.hertelfernandez.com Supplementary Materials
Release #2337 Release Date and Time: 6:00 a.m., Friday, June 4, 2010
 THE FIELD POLL THE INDEPENDENT AND NON-PARTISAN SURVEY OF PUBLIC OPINION ESTABLISHED IN 1947 AS THE CALIFORNIA POLL BY MERVIN FIELD Field Research Corporation 601 California Street, Suite 900 San Francisco,
ANNUAL SURVEY REPORT: ARMENIA
 ANNUAL SURVEY REPORT: ARMENIA 2 nd Wave (Spring 2017) OPEN Neighbourhood Communicating for a stronger partnership: connecting with citizens across the Eastern Neighbourhood June 2017 ANNUAL SURVEY REPORT,
ANNUAL SURVEY REPORT: REGIONAL OVERVIEW
 ANNUAL SURVEY REPORT: REGIONAL OVERVIEW 2nd Wave (Spring 2017) OPEN Neighbourhood Communicating for a stronger partnership: connecting with citizens across the Eastern Neighbourhood June 2017 TABLE OF
Children's Referendum Poll
 Children's Referendum Poll 18 th Oct 2012 Prepared for the National Youth Council of Ireland Job No: 52012 (1) Methodology and Weighting 1003 interviews were conducted between the 15 th 17 th October among
PART 7. Electoral rolls. Code of Good Practice for the management of local authority elections and polls 2016
 Electoral rolls Code of Good Practice for the management of local authority elections and polls 2016 OBJECTIVE OF PART All electoral officers are familiar with the statutory requirements and recommended
The European emergency number 112
 Flash Eurobarometer The European emergency number 112 REPORT Fieldwork: December 2011 Publication: February 2012 Flash Eurobarometer TNS political & social This survey has been requested by the Directorate-General
The Republican Race: Trump Remains on Top He ll Get Things Done February 12-16, 2016
 CBS NEWS POLL For release: Thursday, February 18, 2016 7:00 AM EST The Republican Race: Trump Remains on Top He ll Get Things Done February 12-16, 2016 Donald Trump (35%) continues to hold a commanding
HOT WATER FOR MENENDEZ? OR NJ VOTERS SAY MENENDEZ IS GUILTY; GOOD NEWS IS EVERYONE ELSE IS TOO
 For immediate release Thursday, April 30 Contact: Krista Jenkins 973.443.8390; kjenkins@fdu.edu 7 pages HOT WATER FOR MENENDEZ? OR NJ VOTERS SAY MENENDEZ IS GUILTY; GOOD NEWS IS EVERYONE ELSE IS TOO Garden
POLL: CLINTON MAINTAINS BIG LEAD OVER TRUMP IN BAY STATE. As early voting nears, Democrat holds 32-point advantage in presidential race
 DATE: Oct. 6, FOR FURTHER INFORMATION, CONTACT: Brian Zelasko at 413-796-2261 (office) or 413 297-8237 (cell) David Stawasz at 413-796-2026 (office) or 413-214-8001 (cell) POLL: CLINTON MAINTAINS BIG LEAD
PPIC Statewide Survey Methodology
 PPIC Statewide Survey Methodology Updated February 7, 2018 The PPIC Statewide Survey was inaugurated in 1998 to provide a way for Californians to express their views on important public policy issues.
November 15-18, 2013 Open Government Survey
 November 15-18, 2013 Open Government Survey 1 Table of Contents EXECUTIVE SUMMARY... 3 TOPLINE... 6 DEMOGRAPHICS... 14 CROSS-TABULATIONS... 15 Trust: Federal Government... 15 Trust: State Government...
Media Kit 2014 GENERAL ELECTION. elections.org.nz
 Media Kit 2014 GENERAL ELECTION elections.org.nz 1 8 May 2014 2014 General Election Media Information The Electoral Commission provides this Media Information Kit to assist with coverage of the 2014 General
Voting and Non-Voting in Christchurch City
 Voting and Non-Voting in Christchurch City Territorial local Authority and District Health Board Elections October 2001 Voting and Non-Voting in Christchurch City An analysis of a survey on voter attitudes
INTRODUCTION OF THE EURO IN THE MORE RECENTLY ACCEDED MEMBER STATES
 Eurobarometer INTRODUCTION OF THE EURO IN THE MORE RECENTLY ACCEDED MEMBER STATES REPORT Fieldwork: April 2013 Publication: June 2013 This survey has been requested by the European Commission, Directorate-General
MEDICAID EXPANSION RECEIVES BROAD SUPPORT CHRISTIE POSITIONED WELL AMONG ELECTORATE IMPROVES UPON FAVORABLES AMONG DEMOCRATS
 For immediate release Tuesday, March 12, 2013 8 pp. Contact: Krista Jenkins Office: 973.443.8390 Cell: 908.328.8967 kjenkins@fdu.edu MEDICAID EXPANSION RECEIVES BROAD SUPPORT CHRISTIE POSITIONED WELL AMONG
Flash Eurobarometer 337 TNS political &social. This document of the authors.
 Flash Eurobarometer Croatia and the European Union REPORT Fieldwork: November 2011 Publication: February 2012 Flash Eurobarometer TNS political &social This survey has been requested by the Directorate-General
Public Awareness of the System for Complaints against the Police in Northern Ireland, 2004
 Research Report 02/2004 Public Awareness of the System for Complaints against the Police in Northern Ireland, 2004 Malcolm Ostermeyer Research Branch Office of the Police Ombudsman for Northern Ireland
The 2014 Ohio Judicial Elections Survey. Ray C. Bliss Institute of Applied Politics University of Akron. Executive Summary
 The 2014 Ohio Judicial Elections Survey Ray C. Bliss Institute of Applied Politics University of Akron Executive Summary The 2014 Ohio Judicial Elections Survey offers new findings on the participation
2010 Judicial Performance Survey Report 4th Judicial District
 State of Colorado Logo COMMISSION ON JUDICIAL PERFORMANCE The Honorable Deborah J. Grohs 4th Judicial District March 30, 2010 The Honorable Deborah J. Grohs El Paso County Judicial Complex P.O. Box 2980
Marist College Institute for Public Opinion Poughkeepsie, NY Phone Fax
 Marist College Institute for Public Opinion Poughkeepsie, NY 12601 Phone 845.575.5050 Fax 845.575.5111 www.maristpoll.marist.edu Cuomo Leads Paladino by 15 Percentage Points Among Likely Voters in Race
Job approval in North Carolina N=770 / +/-3.53%
 Elon University Poll of North Carolina residents April 5-9, 2013 Executive Summary and Demographic Crosstabs McCrory Obama Hagan Burr General Assembly Congress Job approval in North Carolina N=770 / +/-3.53%
ELITE AND MASS ATTITUDES ON HOW THE UK AND ITS PARTS ARE GOVERNED DEMOCRATIC ENGAGEMENT WITH THE PROCESS OF CONSTITUTIONAL CHANGE
 BRIEFING ELITE AND MASS ATTITUDES ON HOW THE UK AND ITS PARTS ARE GOVERNED DEMOCRATIC ENGAGEMENT WITH THE PROCESS OF CONSTITUTIONAL CHANGE Lindsay Paterson, Jan Eichhorn, Daniel Kenealy, Richard Parry
Police Firearms Survey
 Police Firearms Survey Final Report Prepared for: Scottish Police Authority Prepared by: TNS JN:127475 Police Firearms Survey TNS 09.12.2014 JN127475 Contents 1. Background and objectives 3 2. Methodology
Vancouver Police Community Policing Assessment Report
 Vancouver Police Community Policing Assessment Report Residential Survey Results FINAL DRAFT NRG Research Group Adam Di Paula & Richard Elias www.nrgresearchgroup.com 3/17/2009 VPD Community Policing Report
Equality Awareness in Northern Ireland: Employers and Service Providers
 Equality Awareness in Northern Ireland: Employers and Service Providers Equality Awareness Survey Employers and Service Providers 2016 Contents 1 INTRODUCTION... 1 ROLE OF THE EQUALITY COMMISSION... 1
Voters low view of Trump lifts Democratic candidates in governor s races in both New Jersey and Virginia
 October 18, 2017 Voters low view of Trump lifts ocratic candidates in governor s races in both New Jersey and Virginia Summary of Key Findings 1. In twin polls in New Jersey and Virginia, a significant
NEW ZEALAND'S ELECTORAL SYSTEM
 NEW ZEALAND'S ELECTORAL SYSTEM ABOUT THE ELECTORAL COMMISSION INDEPENDENT CROWN ENTITY RESPONSIBLE FOR: Administration of parliamentary elections and referenda Maintaining electoral rolls Promoting participation
Ipsos MORI November 2016 Political Monitor
 Ipsos MORI November 2016 Political Monitor Topline Results 15 November 2016 Fieldwork: 11 th 14 th November 2016 Technical Details Ipsos MORI interviewed a representative sample of 1,013 adults aged 18+
Report for the Associated Press: Illinois and Georgia Election Studies in November 2014
 Report for the Associated Press: Illinois and Georgia Election Studies in November 2014 Randall K. Thomas, Frances M. Barlas, Linda McPetrie, Annie Weber, Mansour Fahimi, & Robert Benford GfK Custom Research
FOURTH ANNUAL IDAHO PUBLIC POLICY SURVEY 2019
 FOURTH ANNUAL IDAHO PUBLIC POLICY SURVEY 2019 ABOUT THE SURVEY The Fourth Annual Idaho Public Policy Survey was conducted December 10th to January 8th and surveyed 1,004 adults currently living in the
Voter turnout in today's California presidential primary election will likely set a record for the lowest ever recorded in the modern era.
 THE FIELD POLL THE INDEPENDENT AND NON-PARTISAN SURVEY OF PUBLIC OPINION ESTABLISHED IN 1947 AS THE CALIFORNIA POLL BY MERVIN FIELD Field Research Corporation 601 California Street, Suite 900 San Francisco,
COLORADO LOTTERY 2014 IMAGE STUDY
 COLORADO LOTTERY 2014 IMAGE STUDY AUGUST 2014 Prepared By: 3220 S. Detroit Street Denver, Colorado 80210 303-296-8000 howellreserach@aol.com CONTENTS SUMMARY... 1 I. INTRODUCTION... 7 Research Objectives...
The National Citizen Survey
 CITY OF SARASOTA, FLORIDA 2008 3005 30th Street 777 North Capitol Street NE, Suite 500 Boulder, CO 80301 Washington, DC 20002 ww.n-r-c.com 303-444-7863 www.icma.org 202-289-ICMA P U B L I C S A F E T Y
R Eagleton Institute of Politics Center for Public Interest Polling
 2002 SURVEY OF NEW BRUNSWICK RESIDENTS Conducted for: Conducted by: R Eagleton Institute of Politics Center for Public Interest Polling Data Collection: May 2002 02-02 EXECUTIVE SUMMARY TABLE OF CONTENTS
Integrity programme. Data pack on public trust and confidence in the police. David Brown and Paul Quinton. College of Policing Limited
 Integrity programme Data pack on public trust and confidence in the police David Brown and Paul Quinton College of Policing Limited Scope of the data pack This data pack provides an overview of the published
Preliminary results. Fieldwork: June 2008 Report: June
 The Gallup Organization Flash EB N o 87 006 Innobarometer on Clusters Flash Eurobarometer European Commission Post-referendum survey in Ireland Fieldwork: 3-5 June 008 Report: June 8 008 Flash Eurobarometer
Ipsos MORI March 2017 Political Monitor
 Ipsos MORI March 2017 Political Monitor Topline Results 15 March 2017 Fieldwork: 10 th 14 th March 2017 Technical Details Ipsos MORI interviewed a representative sample of 1,032 adults aged 18+ across
San Diego 2nd City Council District Race 2018
 San Diego 2nd City Council District Race 2018 Submitted to: Bryan Pease Submitted by: Jonathan Zogby Chief Executive Officer Chad Bohnert Chief Marketing Officer Marc Penz Systems Administrator Zeljka
TIS THE SEASON TO DISLIKE WASHINGTON LEADERS, ESPECIALLY CONGRESS
 For Immediate Release Wednesday, December 18, 2013 6 pp. Contact: Krista Jenkins 908.328.8967 (cell) or 973.443.8390 (office) kjenkins@fdu.edu TIS THE SEASON TO DISLIKE WASHINGTON LEADERS, ESPECIALLY CONGRESS
PENNSYLVANIA: SMALL LEAD FOR SACCONE IN CD18
 Please attribute this information to: Monmouth University Poll West Long Branch, NJ 07764 www.monmouth.edu/polling Follow on Twitter: @MonmouthPoll Released: Thursday, 15, Contact: PATRICK MURRAY 732-979-6769
Equality Awareness in Northern Ireland: General Public
 Equality Awareness in Northern Ireland: General Public Equality Awareness Survey General Public 2016 Table of Contents 1. Introduction... 1 2. Social Attitudes and Perceptions of Equality... 11 3. Perception
UTS:IPPG Project Team. Project Director: Associate Professor Roberta Ryan, Director IPPG. Project Manager: Catherine Hastings, Research Officer
 IPPG Project Team Project Director: Associate Professor Roberta Ryan, Director IPPG Project Manager: Catherine Hastings, Research Officer Research Assistance: Theresa Alvarez, Research Assistant Acknowledgements
METHODOLOGY: Regional leaders are now left to come up with a new plan for the future of transportation in the Lower Mainland.
 Page 1 of 13 Metro Vancouver transit referendum: Who voted yes, who voted no, and what will it mean for the region? Despite their defeat, yes voters were more likely to say holding the transit plebiscite
A Study. Investigating Trends within the Jordanian Society regarding Political Parties and the Parliament
 A Study Post to 2013 Parliamentary Elections in Jordan Investigating Trends within the Jordanian Society regarding Political Parties and the Parliament Al-Hayat Center for Civil Society Development Researches
Before the Storm: The Presidential Race October 25-28, 2012
 CBS NEWS/NEW YORK TIMES POLL For release: October 30, 2012 6:30 PM EDT Before the Storm: The Presidential Race October 25-28, 2012 In polling conducted before Hurricane Sandy hit the east coast, the presidential
Retrospective Report on the 42nd General Election of October 19, 2015
 Retrospective Report on the 42nd General Election of October 19, 2015 September 2016 Retrospective Report on the 42nd General Election of October 19, 2015 For enquiries, please contact: Public Enquiries
Supporting Information for Do Perceptions of Ballot Secrecy Influence Turnout? Results from a Field Experiment
 Supporting Information for Do Perceptions of Ballot Secrecy Influence Turnout? Results from a Field Experiment Alan S. Gerber Yale University Professor Department of Political Science Institution for Social
A Survey of New Zealanders Perceptions of their National Identity (2018)
") A Survey of New Zealanders Perceptions of their National Identity (2018) Level 7, 45 Johnston St, PO Box 10 617, Wellington, New Zealand P 04 499 3088 F 04 499 3414 E info@researchnz.com W www.researchnz.com
A Survey of New Zealanders Perceptions of their National Identity (2018) Level 7, 45 Johnston St, PO Box 10 617, Wellington, New Zealand P 04 499 3088 F 04 499 3414 E info@researchnz.com W www.researchnz.com
General Election Opinion Poll
 General Election Opinion Poll 23 rd February 2016 Methodology and Weighting RED C interviewed a random sample of 1,002 adults aged 18+ by telephone between the 18 th 21 st February 2016. A random digit
GET READY AND VOTE. THE EASY GUIDE TO VOTING Whitmore St PO Box 3220 Wellington 6140
 You can find out more Info You can visit the elections website. The website is www.elections.org.nz. You can ring Freephone 0800 36 76 56. You can ask a friend, support person or family member. You can
ANNUAL SURVEY REPORT: BELARUS
 ANNUAL SURVEY REPORT: BELARUS 2 nd Wave (Spring 2017) OPEN Neighbourhood Communicating for a stronger partnership: connecting with citizens across the Eastern Neighbourhood June 2017 1/44 TABLE OF CONTENTS
Campaign and Research Strategies
 Campaign and Research Strategies Ben Patinkin Grove Insight Session agenda Introductions & session goal Survey research: when & how Use results to write ballot titles Know your voters Organize your campaign
RECOMMENDED CITATION: Pew Research Center, October, 2015, On Immigration Policy, Wider Partisan Divide Over Border Fence Than Path to Legal Status
 NUMBERS, FACTS AND TRENDS SHAPING THE WORLD FOR RELEASE OCTOBER 8, 2015 FOR FURTHER INFORMATION ON THIS REPORT: Carroll Doherty, Director of Political Research Rob Suls, Research Associate Bridget Jameson,
ALABAMA: TURNOUT BIG QUESTION IN SENATE RACE
 Please attribute this information to: Monmouth University Poll West Long Branch, NJ 07764 www.monmouth.edu/polling Follow on Twitter: @MonmouthPoll Released: Monday, 11, Contact: PATRICK MURRAY 732-979-6769
*Embargoed Until Monday, Nov. 7 th at 7am EST* The 2016 Election: A Lead for Clinton with One Day to Go November 2-6, 2016
 CBS NEWS POLL For release: Monday, November 7, 2016 7:00 am EST *Embargoed Until Monday, Nov. 7 th at 7am EST* The 2016 Election: A Lead for Clinton with One Day to Go November 2-6, 2016 With just one
THE GOVERNOR, THE PRESIDENT, AND SANDY GOOD NUMBERS IN THE DAYS AFTER THE STORM
 For release Monday, November 26, 2012 8 pp. Contact: Krista Jenkins Office: 973.443.8390 Cell: 908.328.8967 kjenkins@fdu.edu THE GOVERNOR, THE PRESIDENT, AND SANDY GOOD NUMBERS IN THE DAYS AFTER THE STORM
The City of Cape Coral, Florida
 PO Box 150027 Cape Coral, FL 33915 T: (239) 574-0447 F: (239) 574-0452 www.capegov.org The City of Cape Coral, Florida 2007 The National Citizen Survey National Research Center, Inc. 3005 30 th St. Boulder,
School Pupil s Awareness of the Office of the Police Ombudsman for Northern Ireland
 Research Report Office of the Police Ombudsman for Northern Ireland: School Pupil s Awareness of the Office of the Police Ombudsman for Northern Ireland Results from the 2013 Young Persons Behaviour &
Robert H. Prisuta, American Association of Retired Persons (AARP) 601 E Street, N.W., Washington, D.C
 601 E Street, N.W., Washington, D.C") A POST-ELECTION BANDWAGON EFFECT? COMPARING NATIONAL EXIT POLL DATA WITH A GENERAL POPULATION SURVEY Robert H. Prisuta, American Association of Retired Persons (AARP) 601 E Street, N.W., Washington, D.C.
A POST-ELECTION BANDWAGON EFFECT? COMPARING NATIONAL EXIT POLL DATA WITH A GENERAL POPULATION SURVEY Robert H. Prisuta, American Association of Retired Persons (AARP) 601 E Street, N.W., Washington, D.C.
Public opinion on the EU referendum question: a new approach. An experimental approach using a probability-based online and telephone panel
 Public opinion on the EU referendum question: a new An experimental using a probability-based online and telephone panel Authors: Pablo Cabrera-Alvarez, Curtis Jessop and Martin Wood Date: 20 June 2016
Ipsos MORI June 2016 Political Monitor
 Ipsos MORI June 2016 Political Monitor Topline Results 16 June 2016 Fieldwork: 11 h 14 th June 2016 Technical Details Ipsos MORI interviewed a representative sample of 1,257 adults aged 18+ across Great