PPIC STATEWIDE SURVEY
|
|
|
- Domenic Lewis
- 5 years ago
- Views:
Transcription

1 PPIC STATEWIDE SURVEY OCTOBER OBER 2004 Californians and Their Government Public Policy Institute of California Mark Baldassare Research Director & Survey Director
2 The Public Policy Institute of California (PPIC) is a private operating foundation established in 1994 with an endowment from William R. Hewlett. The Institute is dedicated to improving public policy in California through independent, objective, nonpartisan research. PPIC s research agenda focuses on three program areas: population, economy, and governance and public finance. Studies within these programs are examining the underlying forces shaping California s future, cutting across a wide range of public policy concerns, including education, health care, immigration, income distribution, welfare, urban growth, and state and local finance. PPIC was created because three concerned citizens William R. Hewlett, Roger W. Heyns, and Arjay Miller recognized the need for linking objective research to the realities of California public policy. Their goal was to help the state s leaders better understand the intricacies and implications of contemporary issues and make informed public policy decisions when confronted with challenges in the future. PPIC does not take or support positions on any ballot measure or on any local, state, or federal legislation, nor does it endorse, support, or oppose any political parties or candidates for public office. David W. Lyon is founding President and Chief Executive Officer of PPIC. Cheryl White Mason is Chair of the Board of Directors. 500 Washington Street, Suite 800 San Francisco, California Telephone: (415) Fax: (415) info@ppic.org
3 Preface The PPIC Statewide Survey series provides policymakers, the media, and the general public with objective, advocacy-free information on the perceptions, opinions, and public policy preferences of California residents. Inaugurated in April 1998, the survey series has generated a database that includes the responses of more than 104,000 Californians. The current survey is the nineteenth in our Californians and Their Government series, which is conducted on a periodic basis throughout the state s election cycles. The series is examining the social, economic, and political trends that underlie public policy preferences and ballot choices. The current survey focuses on the November 2 nd statewide election. It examines voters preferences in the presidential election, the U.S. Senate race, and on three state propositions on health policy issues that will also be on the ballot, as well as Californians attitudes toward the elected officials who represent them in Washington and Sacramento, and residents perceptions of elections and involvement in the political process. This report presents the responses of 2,018 adult residents throughout the state on a wide range of issues: The November 2 nd statewide election, including preferences in the presidential election, perceived influence of the presidential debates, most important issues for the candidates to address in the time remaining before the election, perceptions of which of the major party candidates will do a better job in handling issues such as the economy, the situation in Iraq, health care, and terrorism and homeland security; the U.S. Senate election, attention to news and awareness of commercials on the U.S. Senate race; and public support for, and attitudes related to, Proposition 63 (mental health services), Proposition 71 (stem cell research), and Proposition 72 (health care coverage requirements referendum). Political trends, including overall approval ratings of President Bush, the U.S. Congress, the two U.S. Senators from California, Governor Schwarzenegger, and the state legislature; assessments of local representation in the U.S. Congress and state legislature, and an evaluation of the recall process and its political impacts one year after the October 7, 2003, governor s recall election. Elections and the political process, including public support for the electoral college system, confidence in vote counts in California and the nation, preference for voting systems in California, perceptions of trends in political campaigns in California, political information sources (including the role of the Internet and talk radio shows), political involvement (including volunteering and financial contributions), and perceptions of political empowerment through voting in elections. The extent to which Californians differ in their ballot choices for the November election; political and economic attitudes toward the state; and attitudes toward national political issues by party affiliation, demographics, race/ethnicity, and region of residence. This is the 51 st PPIC Statewide Survey, which has included a number of special surveys on the Central Valley, Orange County, Los Angeles County, San Diego County, population growth, land use, the environment, the state budget, and California in the future. Copies of this report may be ordered by (order@ppic.org) or phone ( ). Copies of this and earlier reports are posted on the publications page of the PPIC web site ( For questions about the survey, please contact survey@ppic.org. - i -
4 - ii -
5 Contents Preface Press Release i v California 2004 Election 1 Political Trends 7 Elections and Political Process 13 Survey Methodology 19 Survey Questions and Results 21 Survey Advisory Committee 27 - iii -
6
7 Press Release Para ver este comunicado de prensa en español, por favor visite nuestra página de internet: CALIFORNIANS WANT POPULAR VOTE NOT ELECTORAL COLLEGE TO CHOOSE PRESIDENT Debates Change Few Minds in Presidential Contest; One Year Later: Californians More to Support a Recall SAN FRANCISCO, California, October 21, 2004 As President Bush and Senator Kerry hustle for the last undecided votes in swing states, California s neglected voters pine for a change in the electoral process that would make the state more relevant in close campaigns, according to a new survey released by the Public Policy Institute of California (PPIC). On the eve of what appears to be another nail-biter, 64 percent of all Californians and 64 percent of the state s likely voters say they would support altering the electoral process so that presidents are elected by popular vote rather than electoral college tally. And on this topic, California partisans find common ground: Majorities of Democrats (76%), independents (67%), and Republicans (52%) all support the idea. Although California is perceived by pundits to be a safe state for Democratic presidential candidates, residents here are watching the race with intense interest: 61 percent of likely voters say they are very closely following election news, up sharply from September (50%). Has their scrutiny of the campaigns changed the minds of any voters? Most (54%) say the recent debates helped them little or not at all in their decision, while 17 percent feel the debates helped a lot and 26 percent say they helped some. The Democratic ticket of Senators John Kerry and John Edwards holds a 12-point lead over the ticket of Republican President George W. Bush and Vice President Dick Cheney (51% to 39%) the same as one month ago. Kerry leads Bush among independent voters (55% to 30%) and Latinos (60% to 31%), while Bush is favored over Kerry by evangelical Christians (60% to 29%) and married people (47% to 43%). Asked which issue they would most like to hear the candidates address during the remainder of the campaign, likely voters name the economy, jobs, and unemployment (27%), followed by the war in Iraq (16%), health care (10%), and terrorism and homeland security (6%). California voters prefer Kerry to Bush on jobs and the economy (55% to 38%) and health care (56% to 32%). narrowly support Kerry over Bush on Iraq (48% to 45%) and choose Bush over Kerry on homeland security (49% to 43%). California s Recall Election: One Year Later While California may not be the epicenter of presidential campaign activity this year, it did capture the nation s attention one year ago during the recall of then-governor Gray Davis. How do Californians feel about the process today? Similar to their reaction last October (73%), most residents today (71%) consider the ability to recall elected officials a good thing. About half say the recall process is in need of major (28%) or minor (24%) reform however, there has been an 11-point increase from September 2003 in the percentage who believe that the system is okay the way it is. Californians today are also more likely to support a recall effort in the future: 30 percent say they are more likely to use the recall as a result of recent experience, compared to 18 percent who shared this view just prior to the recall election. Finally, more residents today say they feel better (33%) rather than worse (23%) about politics in California as a result of the recall election. - v -
8 Press Release Californians feel vindicated by the way the recall process ultimately worked and this has only strengthened their support for this check on government power, says PPIC Statewide Survey Director Mark Baldassare. But the reality is that much of the good feeling about the recall today may be the result of Governor Arnold Schwarzenegger s widespread popularity. Approval Ratings for State, Federal Leaders One year after Governor Schwarzenegger s historic election, Californians remain impressed with his performance. Eight in 10 say the governor has met (41%) or exceeded (40%) their expectations. are even more likely (46%) than state residents as a whole to describe the governor s first year in office as better than expected. Overall, support for the governor remains strong, with 61 percent of Californians approving of the way he is handling his job. Interestingly, Latinos are far less likely than whites to approve of his performance (36% to 73%). Ratings for the state legislature s performance are far lower than the governor s and have changed little in recent months (43% approve, 41% disapprove). However, a majority of Latinos (52%) say they approve of the performance of the legislature. When it comes to assessing their own member of the state assembly and senate, residents as a whole are more supportive: 49 percent say they approve of the job their local state legislators are doing, while 31 percent disapprove. At the federal level, 55 percent of Californians disapprove and 42 percent approve of how President Bush is handling his job overall, similar to his September ratings (54% disapprove, 43% approve). Majorities approve of the job performance of U.S. Senators Barbara Boxer (53% approve, 27% disapprove) and Dianne Feinstein (51% approve, 26% disapprove), with likely voters as supportive or more so than state residents generally (Boxer 54%, Feinstein 58%). However, the percentage of state residents who say Congress as a whole is doing an excellent or good job continues to decline, falling 5 points since February to 27 percent. Similar to their assessment of their local state legislators, Californians have a rosier view of their local members of Congress, with 39 percent giving their own congressperson positive ratings. Political Engagement Despite the tremendous interest in the presidential election and the fact that most state residents (69%) believe that having elections makes the government pay attention to what the people think relatively few Californians are actually involved in political campaigns. Only 5 percent of state residents and 7 percent of likely voters say they have worked for a political party, candidate, or initiative campaign in the past 12 months. However, higher percentages of both Californians generally (20%) and likely voters (29%) say they have contributed money to political causes in the past year. Where do Californians get their news and information about politics? State residents are more likely to get their political news from television (44%) than from newspapers (20%), radio (12%), or the Internet (9%). While the percentage of Californians seeking political information on-line has not increased since the last presidential election, more people today receive it via . The percentage of state residents who report being contacted by political causes or candidates has grown to 25 percent today, up from 11 percent in Proposition Roundup Proposition 63 a ballot measure that would fund expansion of mental health services by raising the personal income tax on those making over $1 million annually by 1 percent is backed by 62 percent of likely voters, nearly the same level of support found in August (66%). Support for this measure is driven by the fact that most voters (66%) believe that the current level of state funding for mental health services is inadequate. - vi -
9 Press Release Proposition 71 a proposal to fund stem cell research in California with a $3 billion state bond issue is favored by an 11-point margin and is supported by half of likely voters (50% to 39%). A majority of voters (53%) think the federal government spends too little on medical research involving embryonic stem cells. Proposition 72 a referendum on legislation passed last year requiring all large and medium employers in the state to provide health insurance for their employees remains short of the majority needed to approve the law (41% to 38%) and has lost some ground since September (45% to 34%). Still, most voters (64%) say it is very important that large and medium employers provide health care benefits for their employees. More Key Findings Boxer maintains lead in Senate race (page 3) Among likely voters, incumbent U.S. Senator Barbara Boxer has an 18-point lead over Republican challenger Bill Jones (53% to 35%). There has been little change in the race since September (54% to 36%). While 95 percent of voters say they are watching news of the presidential election at least somewhat closely, only 42 percent say the same about the Senate race. However, many voters (54%) report seeing advertisements for this race during the past month, with most (79%) recalling ads for Boxer rather than Jones (11%). Confidence in voting process not overwhelming (pages 13-14) A slim majority of Californians (51%) express substantial support for the way in which votes are cast and counted in the United States, but nearly half (47%) have only some, very little, or no confidence in the electoral system. Residents are more likely to prefer to cast their ballot electronically (36%) than by paper ballot (29%) or punchcards (24%). Residents slightly more pessimistic about state s direction, economic prospects (page 21) Californians are divided about the overall direction of the state (44% right direction, 44% wrong direction) and about the state s financial outlook for the coming year (42% good times, 43% bad times). One month ago, 47 percent of state residents thought the state was headed in the right direction and 46 percent saw good financial times ahead. About the Survey The purpose of the PPIC Statewide Survey is to develop an in-depth profile of the social, economic, and political forces affecting California elections and public policy preferences. Findings of this survey are based on a telephone survey of 2,018 California adult residents interviewed between October 10 and October 17, Interviews were conducted in English or Spanish. The sampling error for the total sample is +/- 2%. The sampling error for subgroups is larger. For more information, see page 19. Mark Baldassare is research director at PPIC, where he holds the Arjay and Frances Fearing Miller Chair in Public Policy. He is founder of the PPIC Statewide Survey, which he has directed since His recent book, A California State of Mind: The Conflicted Voter in a Changing World, is available at PPIC is a private, nonprofit organization dedicated to improving public policy through objective, nonpartisan research on the economic, social, and political issues that affect Californians. The institute was established in 1994 with an endowment from William R. Hewlett. PPIC does not take or support positions on any ballot measure or on any local, state, or federal legislation, nor does it endorse, support, or oppose any political parties or candidates for public office. This report will appear on PPIC s website ( on October 21. ### - vii -
10 2004 Presidential Race Attitudes Toward Electoral College System Percent Kerry/Edwards Bush/Cheney Other Don't know Percent Support change to popular vote Oppose change to popular vote Don't know 2004 U.S. Senate Race Proposition 63: Mental Health Services Expansion, Funding Percent Barbara Boxer Bill Jones Other Don't know Percent Yes No Don't know Percent "Yes" Proposition 71: Stem Cell Research Funding Bonds 50 All Dem Rep Ind Percent "Yes" Proposition 72: Health Care Coverage Requirements Referendum 41 All Dem Rep Ind
11 Presidential Election California 2004 Election The presidential and vice presidential debates had little effect on the political race in California: Democrats John Kerry and John Edwards still have a double-digit lead over Republicans George W. Bush and Dick Cheney. Among likely voters, Kerry now leads Bush by the same 12-point margin (51% to 39%) he had in September. Kerry led Bush by 16 points in August (54% to 38%) and 11 points in July (49% to 38%). In the current survey, only 7 percent of likely voters are undecided, a percentage that has remained virtually unchanged over the past three months. At this late stage, most national surveys show a tight race for both the popular vote and the Electoral College between Kerry and Bush. Eighty-six percent of Democrats back Kerry; 82 percent of Republicans back Bush. Kerry has a wide lead over Bush (55% to 30%) among independent voters. Across regions, Kerry has strong support in the San Francisco Bay Area and Los Angeles, Bush leads in the Central Valley, and the two are virtually tied in Other Southern California. Kerry s lead over Bush is larger among Latino likely voters (60% to 31%) than among white voters (48% to 42%). Kerry also holds a larger lead among women (55% to 36%) than among men (47% to 42%). Bush leads Kerry among evangelical Christians (60% to 29%) and among married people (47% to 43%). The two major party tickets are tied among voters age 55 and older (Bush 44%; Kerry 48%). If the 2004 presidential election were being held today, would you vote for... Results among likely voters July 2004 August 2004 September 2004 October 2004 John Kerry and John Edwards 49% 54% 51% 51% George W. Bush and Dick Cheney Other answer (specify) Don t know Results among likely voters Kerry / Edwards Bush / Cheney Other answer Don't know All 51% 39% 3% 7% Party registration Democrat Republican Independent Central Valley Region Race/Ethnicity Gender Marital status SF Bay Area Los Angeles Other Southern California Whites Latinos Male Female Married Other
12 California 2004 Election Ranking of Candidates on Issues Sixty-one percent of likely voters say they are very closely following the election news a much higher percentage than in August (48%) and September (50%) and the interest level is high today among both Democrats (62%) and Republicans (61%). Fifty-four percent of likely voters say the debates did not much or nothing to help them make their voting decisions or that their minds were already made up; 17 percent said the debates helped a lot and 26 percent said some. Kerry voters are more likely than Bush voters to say the debates helped them at least somewhat (50% to 35%) in deciding how to vote. When asked which issues they want the candidates to focus on most for the remainder of the presidential campaign, California voters put jobs and the economy at the top of the list (27%), followed by the war in Iraq (16%), health care (10%), and terrorism and homeland security (6%). When asked which of the two major candidates would do a better job on these issues, voters heavily favor Kerry over Bush on health care (56% to 32%) and jobs and the economy (55% to 38%) but more narrowly on handling Iraq (48% to 45%). Bush is seen as the stronger candidate on national security (49% to 43%). These rankings of the candidates on the issues have changed only marginally since September. Large percentages of Democrats believe Kerry would do a better job than Bush handling the economy (87%), health care (84%), Iraq (78%), and homeland security (75%). Large percentages of Republicans give Bush the nod on handling homeland security (90%), Iraq (85%), jobs and the economy (77%), and health care (65%). Independent voters rate Kerry significantly higher than Bush on handling health care (60% to 25%), Iraq (54% to 35%), and the economy (56% to 31%) but give Kerry only a slight edge on handling homeland security (43% to 41%). Regardless of your choice for president, which of these candidates would do the better job on each of these issues George W. Bush or John Kerry? Results among likely voters September 2004 October 2004 Bush 44% 45% The situation in Iraq Kerry Other answer 2 2 Don t know 6 5 Bush Health care Kerry Other answer 2 3 Don t know 9 9 Bush Jobs and the economy Kerry Other answer 2 2 Don t know 7 5 Bush Terrorism and homeland security Kerry Other answer 2 3 Don t know
13 U.S. Senate Election California 2004 Election In the U.S. Senate race, Democratic incumbent Barbara Boxer maintains an 18-point lead over Republican challenger Bill Jones among likely voters (53% to 35%), only 10 percent of whom are undecided. There has been little change in the U.S. Senate race since July. Boxer and Jones get significant support from their respective parties 84 percent of Democrats support Boxer and 75 percent of Republicans support Jones. However, independents favor Boxer over Jones (60% to 21%). Regionally, Boxer has a wide lead in the San Francisco Bay Area and Los Angeles County, Jones leads in the Central Valley, and the two are more evenly matched in Other Southern California. Boxer has a much wider lead over Jones among women (58% to 29%) than among men (47% to 40%). She also has a wider lead among Latinos (67% to 23%) than among whites (50% to 39%). Married voters are divided between Boxer and Jones (44% to 44%), but Boxer has a wide lead among those who are not married (63% to 23%). Only 42 percent of likely voters say they are following the U.S. Senate race very closely (12%) or fairly closely (30%). In contrast, 95 percent of likely voters are very closely (61%) or fairly closely (34%) following the presidential race. Fifty-four percent of likely voters say they have seen advertisements for the U.S. senate race in the past month. Among these voters, 79 percent say those ads have been mostly for Boxer, 11 percent say the ads have been mostly Jones ads, and 10 percent say they have seen both equally or are unsure of whose they have seen more. If the November election for the U.S. Senate were being held today, would you vote for Results among likely voters July 2004 August 2004 September 2004 October 2004 Barbara Boxer, the Democrat 52% 53% 54% 53% Bill Jones, the Republican Other answer (specify) Don't know Results among likely voters Barbara Boxer, the Democrat Bill Jones, the Republican Other answer Don't know All 53% 35% 2% 10% Party registration Region Democrat Republican Independent Central Valley SF Bay Area Los Angeles Other Southern California Race/Ethnicity Gender Marital status Whites Latinos Male Female Married Other October 2004
14 California 2004 Election State Proposition 63 Proposition 63 would fund the expansion of mental health services with an additional 1 percent income tax on Californians with taxable incomes above $1 million. A majority of Californians support this proposition by almost as large a margin now (62% yes; 24% no) as in August 2004 (66% yes; 26% no). Support for the measure today is much larger among Democratic likely voters (76%) and independent voters (67%) than among Republicans (46%). It is supported by majorities of likely voters in all regions and demographic groups. Latino likely voters are more likely than whites (72% to 60%) to back Proposition 63, as are women relative to men (67% to 57%). Two in three likely voters (66%) continue to think the current level of state funding for mental health services is too low, while 13 percent say there is just enough and only 5 percent think there is too much funding. In August, 63 percent of likely voters said that the current level of state funding for mental health programs was too low. Majorities or near majorities in all regions and demographic groups think that California s mental health funding is too low. Across partisan groups, however, the majority who believe it is too low is much higher among Democrats (79%) and independent voters (73%) than among Republicans (51%). Along ideological lines, liberals (81%) are more likely than moderates (71%) and conservatives (49%) to believe the funding is too low. Among all those who think the funding is inadequate, 77 percent support Proposition 63. Proposition 63 on the November 2 nd ballot is the Mental Health Services Expansion and Funding Initiative. If the election were held today, would you vote yes or no on Proposition 63? Region Results among likely voters Dem Rep Ind Central Valley SF Bay Area Los Angeles Other Southern California Latinos Yes 62% 76% 46% 67% 54% 68% 59% 64% 72% No Don't know Do you think that the current level of state funding for mental health programs is more than enough, just enough, or not enough? More than enough 5% Just enough 13 Not enough 66 Don't know
15 State Proposition 71 California 2004 Election Proposition 71 would fund stem cell research in California through a $3 billion state bond issue. In the final weeks before the November 2 nd election, 50 percent of likely voters say they plan to vote yes, while 39 percent say they would vote no and 11 are still undecided about the measure. Support for the measure is stronger among Democrats (65%) than among independents (52%) and Republicans (33%). Across regions, a majority of voters support Proposition 71 in the San Francisco Bay Area (56%) and Other Southern California (56%), but not in Los Angeles (48%) and the Central Valley (34%). It is strongly opposed by evangelical Christians (56% no; 33% yes). About half of Latinos (51%) and whites (50%) support Proposition 71; women are slightly more likely than men to favor it (54% to 46%). The measure is supported by a bare majority among voters age 55 and older (52%). About half of likely voters (53%) think the federal government spends too little on stem cell research, but opinions on this topic are strongly divided along partisan, ideological, and religious lines. Democrats (70%) are much more likely than independents (57%) and Republicans (30%) to think the federal government spends too little. Conservatives are less likely than liberals (28% to 73%), and evangelical Christians are less likely than others (32% to 55%), to believe federal support is too small. Among college graduates and voters with incomes of $80,000 or more, six in 10 say the government spends too little on stem cell research. perceptions of federal funding are correlated with their support for the state bond measure: Of those who think current federal funding levels are too low, 75 percent say they will vote yes on Proposition 71. Proposition 71 is the Stem Cell Research Funding Bonds Initiative Constitutional Amendment and Statute. If the election were held today, would you vote yes or no on Proposition 71? Region Results among likely voters Dem Rep Ind Central Valley SF Bay Area Los Angeles Other Southern California Latinos Yes 50% 65% 33% 52% 34% 56% 48% 56% 51% No Don't know Do you think the federal government spends too much, the right amount, or too little on medical research using embryonic stem cells? Too much 14% Right amount 14 Too little 53 Federal government should not fund stem cell research (volunteered) Don't know October 2004
16 California 2004 Election State Proposition 72 Proposition 72 is a referendum on legislation passed last year requiring all large and medium employers in the state to provide health insurance for their employees. At present, support for the referendum is below the 50 percent majority needed to approve it. Forty-one percent of likely voters now say they plan to vote yes on the measure, 38 percent are opposed, and 21 percent are undecided. In both August and September, voter support was at 45 percent, with 34 percent opposed and 21 percent undecided. Among likely voters, a majority of Democrats (53%) favor the proposition, a majority of Republicans oppose it (54%), and support falls below a majority among independent voters (47%). Since September, the percentage of Republicans who oppose Proposition 72 has increased by 6 points, Democratic support has remained about the same, and the percentage of independent voters who are undecided on the measure has increased by 3 points. Less than a majority of likely voters in all regions now back the measure. Support from Latino likely voters is at 44 percent today, compared to 53 percent in September. Support among white likely voters stands at 40 percent, about the same as last month. Support declines with age and household income and is somewhat lower among men than women (38% to 44%). About two in three likely voters (64%) say it is very important that employers provide health care benefits for their employees, and another 23 percent consider it somewhat important. The responses were similar in August. Today, Democrats are more likely than Republicans to say it is very important to them (76% to 51%). Women are more likely than men (72% to 56%), and Latinos are more likely than whites (73% to 62%), to consider it very important. Of the two in three who say it is very important that employers provide health coverage, 55 percent say they will vote yes on Proposition 72. Proposition 72 on the November ballot is the Health Care Coverage Requirements Referendum. If the election were held today, would you vote yes or no on Proposition 72? Region Results among likely voters Dem Rep Ind Central Valley SF Bay Area Los Angeles Other Southern California Latinos Yes 41% 53% 25% 47% 32% 46% 40% 42% 44% No Don't know How important is it to you that large and medium employers provide health care benefits for their employees? Very important 64% Somewhat important 23 Not too important 4 Not at all important 6 Don't know 3-6 -
17 President s Ratings Political Trends In California, President George W. Bush s overall job approval ratings have not changed significantly throughout the 2004 presidential campaign. Today, 42 percent of California adults approve of the way Bush is handling his job as president, while 55 percent disapprove. In September, 43 percent approved and 54 percent disapproved; and in August, 40 percent approved and 56 percent disapproved. Bush s approval rating has fallen sharply from its high point of 79 percent in December Recent national surveys show President s Bush s approval rating between the low and high 40 s among all Americans. In California, likely voters assessments of Bush s overall performance are similar to those of all adults (44% approve; 54% disapprove). The partisan gulf in Bush s approval ratings continues to be wide: Today, 84 percent of Republicans approve of his job performance and 81 percent of Democrats disapprove. In September, 80 percent of Republicans approved and 80 percent of Democrats disapproved. Among independent voters, 39 percent now approve and 58 percent disapprove of the way the president is handling his job. The president gets higher levels of support in the Central Valley (55%) and Other Southern California (50%) than in the San Francisco Bay Area (29%) and Los Angeles (35%). Evangelical Christians are much more likely than others to approve of the president s job performance (61% to 39%). Fewer than half of both whites (46%) and Latinos (40%) approve. Overall do you approve or disapprove of the way that George W. Bush is handling his job as president of the United States? Approve Disapprove Don't know All Adults 42% 55% 3% Party registration Democrat Republican Independent Central Valley Region Gender Religion SF Bay Area Los Angeles Other Southern California Male Female Evangelical Christian Other Results among all adults May 2001 Dec 2001 June 2002 Oct 2002 Feb 2003 Nov 2003 Feb 2004 Oct 2004 Approve 57% 79% 65% 60% 51% 48% 49% 42% Disapprove Don t know
18 Political Trends California U.S. Senators Ratings Incumbent Democratic U.S. Senator Barbara Boxer has an approval rating of 53 percent as she heads into the final weeks of her reelection campaign. Her approval rating among all Californians has gone up 5 points since February 2004 and is now the highest it has been since February 2002 (52%). The senator s disapproval rating, now at 27 percent, has held fairly steady over time. One in five Californians today has no opinion of Boxer. Among likely voters, 54 percent approve of Boxer s job performance. Along partisan lines, 79 percent of Democrats approve of her performance, while 58 percent of Republicans disapprove. Independents are more likely to approve than disapprove of Boxer s performance (54% to 20%), with one in four remaining uncertain. She is rated much more favorably by liberals (72%) than moderates (55%) and conservatives (34%). Boxer s approval rating is also higher among women than men (56% to 49%). Regionally, it is highest in the San Francisco Bay Area (65%) and higher in Los Angeles (54%) than in the Central Valley (46%) and Other Southern California (48%). Overall, do you approve or disapprove of the way that Barbara Boxer is handling her job as a U.S. Senator? All Adults Dem Rep Ind Approve 53% 79% 26% 54% 54% Disapprove Don't know How do Californians rate the job performance of their other U.S. Senator, reelected in 2002? Among all Californians, 51 percent approve of Dianne Feinstein s performance, while 26 percent disapprove and one in five has no opinion. Among likely voters, Feinstein s approval rises to 58 percent. Her ratings are up slightly from October 2002, when 49 percent gave her positive marks and 25 percent disapproved. However, they remain slightly lower than the peak of 57 percent approval she received in February Nearly three in four Democrats (72%) and 51 percent of independents approve of Feinstein s performance as a U.S. Senator, while 45 percent of Republicans disapprove. Feinstein gets positive job ratings from 62 percent of liberals, 54 percent of moderates, and 39 percent of conservatives. The senator s approval is highest in her San Francisco Bay Area home turf (62%), and higher in Los Angeles (51%) than in the Central Valley (45%) and Other Southern California (46%). Feinstein s approval ratings increase with age and education and are similar among men and women (50% to 51%), among whites and Latinos (51% to 50%), and across income groups. Overall, do you approve or disapprove of the way that Dianne Feinstein is handling her job as a U.S. Senator? All Adults Dem Rep Ind Approve 51% 72% 36% 51% 58% Disapprove Don't know
19 U.S. Congress Ratings Political Trends Fewer than three in 10 Californians think that the U.S. Congress is doing an excellent (3%) or good (24%) job at this time. Congress job ratings have dropped 5 points since February 2004 and, while they are similar to September 2003 (28% excellent or good), they are at a lower point today than they were at this late stage of the 2000 presidential election and the 2002 mid-term election (both 38% excellent or good). Today, 68 percent of Californians rate the job performance of Congress as only fair (46%) or poor (22%). Among likely voters, 25 percent say the U.S. Congress is doing an excellent or good job. Republicans (36%) are considerably more likely than Democrats (21%) or independent voters (24%) to say the U.S. Congress is doing a good or excellent job. Latinos (36%) are more positive than whites (25%). Ratings of Congress are lower in the San Francisco Bay Area (23%) than in Other Southern California (31%) and the Central Valley or Los Angeles (30% and 26%, respectively). Overall, how do you rate the job performance of the U.S. Congress at this time? Results among all adults Oct 2000 Dec 2001 Oct 2002 Feb 2003 Sep 2003 Feb 2004 Oct 2004 Excellent 5% 13% 4% 4% 3% 3% 3% Good Fair Poor Don't know Californians views of their own congressional representatives are more favorable than their views of the Congress overall: About four in 10 say their own congressperson is doing an excellent (7%) or good (32%) job. Fewer than half rate their own representative as fair (36%) or poor (10%). Nonetheless, the current favorable ratings (excellent or good) have dropped 3 points since February 2004 and are at a lower point than during the congressional elections that took place four years ago (October 2000: 44%) and two years ago (October 2002: 41%). Among likely voters today, 42 percent say their local representative is doing an excellent or good job. Democrats (43%) are somewhat more favorable than Republicans (41%) or independents (34%) toward their local member of Congress. Latinos (41%) and whites (41%) are equally likely to rate their congressional representative as excellent or good. Congressional job performance ratings are more positive in the San Francisco Bay Area (44%) than in the Central Valley (38%), Los Angeles (36%), and Other Southern California (37%). Ratings of members of Congress increase somewhat with age but do not vary significantly by education or income. Overall, at this time, how do you rate the job performance of the representative to the U.S. House of Representatives from your congressional district? Results among all adults Oct 2000 Dec 2001 Oct 2002 Feb 2003 Sep 2003 Feb 2004 Oct 2004 Excellent 8% 10% 6% 8% 7% 8% 7% Good Fair Poor Don't know October 2004
20 Political Trends Governor s Ratings Governor Arnold Schwarzenegger s ratings remain high. Six in 10 California adults and seven in 10 likely voters approve of the way he is handling his job. Schwarzenegger s approval ratings have remained in a similar positive range throughout The governor has solid approval among Republicans (90%) and independents (62%), and even Democrats are more inclined to approve than disapprove of his job performance (51% to 39%). Majorities in all regions approve of the governor. However, Latinos are far less likely than whites to approve (36% to 73%). Schwarzenegger s job approval is also lower among those with annual household incomes below $40,000 (47%), liberals (49%) and non-citizens (24%). Overall, do you approve or disapprove of the way that Arnold Schwarzenegger is handling his job as governor of California? Region All Adults Central Valley SF Bay Area Los Angeles Other Southern California Dem Rep Ind Approve 61% 64% 57% 57% 67% 51% 90% 62% 69% Disapprove Don't know Has the governor lived up to expectations? One year after his election, eight in 10 Californians say that Schwarzenegger has met (41%) or exceeded (40%) their expectations. voters are even more positive, with nearly half saying he has done better than they expected. Of those Californians who say the governor is performing about as they expected, 58 percent approve and 34 percent disapprove of the way he is doing his job today, and of those who say he is doing better than they expected, nine in 10 approve of his current job performance. Republicans are the most positive, with 53 percent saying the governor has exceeded their expectations, while 38 percent of independents agree. Democrats are about equally likely to say Schwarzenegger has met (42%) or exceeded (38%) their expectations. Assessments of the governor s first year in office are positive in all regions. Women are less likely than men (37% to 42%), and Latinos are less likely than whites (21% to 48%) to say Schwarzenegger has exceeded their expectations. Governor Schwarzenegger was elected in the recall election of October Overall, how would you describe his first year in office? Region All Adults Central Valley SF Bay Area Los Angeles Other Southern California Dem Rep Ind Better than expected 40% 40% 43% 37% 42% 38% 53% 38% 46% About the same as expected Worse than expected Don t know
21 State Legislature s Ratings Political Trends The California legislature s overall performance ratings are well below the governor s. Forty-three percent of all adults approve and 41 percent disapprove of the way the state legislature is doing its job. Among likely voters, 40 percent approve and 46 percent disapprove. Among both all adults and likely voters, ratings of the state legislature have been fairly consistent throughout 2004 with about four in 10 residents and likely voters approving of its overall performance. This is a lower rating than four years ago (September 2000: 56% approve, 31% disapprove) and comparable to two years ago (September 2002: 45% approve, 36% disapprove). However, it is higher than in August 2003 when the legislature s ratings were at a low point: Only 28 percent said they approved and 58 percent disapproved. Today, Democrats (46%) are more positive than Republicans (39%) and independents (42%) about the state legislature, and liberals (47%) and moderates (46%) are somewhat more favorable than conservatives (40%) in their overall evaluations. Ratings of the state legislature are more favorable among Latinos (52%) than whites (38%) and among 18 to 34 year olds (53%) than among residents ages 35 to 54 (41%) or those age 55 and older (34%). About four in 10 residents in each of the state s regions approve of the legislature s job performance. Overall, do you approve or disapprove of the way that the California legislature is handling its job? All Adults Central Valley SF Bay Area Region Los Angeles Other Southern California Dem Rep Ind Approve 43% 40% 44% 43% 45% 46% 39% 42% 40% Disapprove Don't know The public is more positive about the state representatives from their own Assembly and Senate districts: Forty-nine percent approve and only 31 percent disapprove of the job their legislators are doing. voters provide similar ratings. Three years ago (December 2001), in the wake of the September 11 th terrorist attacks, 61 percent of all adults approved and only 23 percent disapproved of their state legislators job performance. Approval ratings for local state legislators are similar across the state s regions. However, there are differences across partisan and other groups. Democrats (52%) are happier than Republicans (48%) and independent voters (46%) with their representatives to the State Assembly and Senate. Similarly, liberals are more positive (54%) than moderates (48%) or conservatives (46%). Latinos (60%) are more satisfied than whites (46%) with the state legislators from their districts. Overall, do you approve or disapprove of the job that the state legislators representing your assembly and state senate districts are doing at this time? All Adults Central Valley SF Bay Area Region Los Angeles Other Southern California Dem Rep Ind Approve 49% 48% 48% 48% 49% 52% 48% 46% 47% Disapprove Don't know October 2004
22 Political Trends The Recall Revisited One year after the first gubernatorial recall election in California history and given Governor Schwarzenegger s performance ratings how do Californians feel about the recall process? Nearly three in four residents think it is a good thing, and that is a nearly identical response to the question in our prerecall election survey in October A solid majority of Democrats, Republicans, and independent voters hold this view. At the same time, about half say the recall process needs major or minor changes. Since September 2003, there has been an 11-point increase in the percentage who are O.K. with the recall election process as it is. Today, only 18 percent of Californians say that last year s recall election would make them less likely to support another recall, including relatively low percentages of Democrats (27%), independents (22%), and Republicans (5%). In fact, 30 percent say the experience made them more likely to use the recall, compared to 18 percent in the pre-recall election survey who felt they would be more inclined to support another recall following the October 2003 special election. While 23 percent of all adults today say the governor s recall has made them feel worse about California elections, this is a sharp decline from the 40 percent who felt in October 2003 that the campaign to recall then-governor Gray Davis made them feel worse about the state s politics. Generally speaking, and regardless of how you felt about the recall election in October 2003, do you think it is a good thing or a bad thing that the California constitution provides a way to recall the state s elected officials, such as the governor? All Adults Dem Rep Ind Good thing 71% 62% 91% 74% 74% Bad thing Don't know Generally speaking, and regardless of how you felt about the recall election last October, do you think the recall election process is in need of major changes, minor changes, or is it basically okay the way it is? All Adults Dem Rep Ind Major changes 28% 38% 8% 28% 26% Minor changes Okay the way it is Don't know Overall, would you say the October 2003 recall election has made you feel better, worse, or no different about California politics? All Adults Dem Rep Ind Better 33% 20% 64% 31% 42% Worse No different Don't know
23 Electoral and Voting Systems Elections and Political Process California holds 55 of the 270 electoral votes needed to win the presidency by far the most of any state in this year s election but the major party candidates have spent little time or money campaigning in the state this year. California is perceived to be a safe Democratic stronghold; thus, the Bush and Kerry campaigns have invested their resources elsewhere in search of Electoral College votes. It appears that the 2004 presidential election will be a closely contested one perhaps repeating the high drama of the 2000 election, when the presidential candidate who received the most popular votes failed to garner enough electoral votes to win the presidency and the election was decided by a few hundred popular votes in Florida, which then gave all of its electoral votes to George W. Bush. Following the 2000 election, 63 percent of all Americans said they would support changing the system to one based on direct popular vote, 33 percent said they would not support this change (ABC News/Washington Post poll, December 2000). Now, on the eve of the 2004 election, 64 percent of both all Californians and the state s likely voters would support electing future presidents by direct popular vote. Only twenty-six percent of all adults, and 28 percent of likely voters, think that the Electoral College system should remain intact. Large majorities of California Democrats (76%) and independents (67%) support changing the electoral system, as do a bare majority of the state s Republicans (52%). In January 2001, just prior to Bush s inauguration, Californians said they favored changing the electoral system by a similarly large margin. For future presidential elections, would you support or oppose changing to a system in which the president is elected by direct popular vote, instead of by the Electoral College? All Adults Dem Rep Ind Would support change to popular vote 64% 76% 52% 67% 64% Would oppose change to popular vote Don't know Despite problems with hanging chads in the 2000 presidential election, Californians are relatively confident in the voting process. A slim majority (51%) express a great deal (26%) or quite a lot (25%) of confidence in the system by which votes are cast and counted in this country. Forty-seven percent say they have only some (28%), very little (17%), or no (2%) confidence in the voting system. Confidence is somewhat higher among the state s likely voters, 58 percent of whom express a great deal or quite a lot of confidence in the system (similar to the 58 percent of likely voters nationally who reported these levels of confidence in a July 2004 National Public Radio survey). In California, Democrats (54%) and independents (53%) are much more likely than Republicans (23%) to have only some, very little, or no confidence in how votes are cast and counted at the national level. How much confidence do you have in the system in which votes are cast and counted in this country? All Adults Dem Rep Ind Great deal 26% 20% 42% 23% 29% Quite a lot Some Very little / None Don't know
24 Elections and Political Process Voting in California Nine in 10 Californians are at least somewhat confident that their own vote will be properly and accurately counted on election day. A majority of Californians (52%) are very confident, and another 38 percent are somewhat confident, that their votes will be correctly tallied. Only one in 10 Californians is not very or not at all confident of an accurate count. Republicans, who were the most likely to have a great deal of confidence in the nation s voting system, are also the most likely to be very confident that their own votes will be properly tallied: Seven in 10 Republicans are very confident, compared to 47 percent of Democrats and 46 percent of independents. Ninety-three percent of California s likely voters are very confident (57%) or somewhat confident (36%) that their vote will be accurately counted. Thinking about your own vote, how much confidence do you have that your vote will be properly and accurately counted? All Adults Dem Rep Ind Very confident 52% 47% 69% 46% 57% Somewhat confident Not very confident Not at all confident Fifty-eight county election offices will administer the November 2 nd election in California. The counties use three primary types of voting systems touchscreens, optical scanning of paper ballots, and punch cards. In the November election, 10 counties will employ touchscreen machines, 36 will provide paper ballots, and 12 will use punchcards. Regardless of the system currently available to them, nearly four in 10 Californians would prefer to cast their votes electronically through touchscreen machines, 29 percent would prefer to mark paper ballots with pens, and 24 percent would prefer punchcards. Younger voters (ages 18 to 35) are much more likely than older voters (age 55 and older) to want to cast ballots electronically (42% to 24%). Electronic voting is preferred by 46 percent of those who live in counties that currently offer touchscreen voting, by 32 percent of those in counties using optical scanning of paper ballots, and by 26 percent of those in counties that currently use punchcard systems. In general, how would you prefer to cast your vote electronically on a touchscreen machine, by punch card, by paper ballot with a pen, or by some other method? All Adults Dem Rep Ind Electronically 36% 34% 39% 38% 35% Paper ballot Punch card All methods equally (volunteered) Other method (specify) Don't know
25 Political Information Sources Elections and Political Process And where do Californians go for news and information about politics? A plurality of residents (44%) say they turn to television as their primary source, while considerably fewer percentages rely on newspapers (20%), the radio (12%), the Internet (9%), and talking to other people (8%). Compared to two years ago, mention of newspapers as the main source of information has declined (30% to 20%), while mention of television has increased and also, nominally, mention of radio and the Internet. Democrats (28%) are more likely than Republicans (21%) and independents (19%) to cite newspapers as their main source of political information. Latinos are more likely than whites (62% to 37%) to get political information from television and less likely than whites to rely upon newspapers (11% to 25%). Reliance upon television as the primary source for political news declines sharply with education and income but does not vary by age. In contrast, reliance upon newspapers increases sharply with age, education, and income. How do you get most of your information about politics? All Adults Dem Rep Ind Television 44% 38% 42% 36% 37% Newspapers Radio Internet Talking to other people Magazines Other / Don t know Although only one in eight Californians relies upon the radio for most political information, half of all adults and 56 percent of likely voters regularly or sometimes listen to radio shows that invite people to call in to discuss current events, public issues, and politics. Republicans (38%) are much more likely than Democrats (23%) and independents (26%) to listen to call-in radio shows regularly. What types of shows are these listeners turning to? Forty-three percent listen to programs that tend to be conservative, and 42 percent to programs that tend to be liberal. Seven in 10 Republicans who listen to call-in radio shows favor programs that tend to be conservative. By contrast, 56 percent of Democratic listeners tune in to programs that tend to be liberal. Across the state s regions, Central Valley residents (57% conservative, 31% liberal) and San Francisco Bay Area residents (51% liberal, 29% conservative) are, respectively, the most right-leaning and left-leaning in their program preferences. How often, if ever, do you listen to radio shows that invite listeners to call in to discuss current events, public issues, and politics? All Adults Dem Rep Ind Regularly 27% 23% 38% 26% 33% Sometimes Rarely Never October 2004
26 Elections and Political Process Although only one in 10 Californians uses the Internet as the primary source for political information, about four in 10 residents throughout the state have gone on-line in the past few months to get news and information about the presidential election. Although the Internet has become an increasingly important tool of political campaigns, the percentage of Californians who say they have recently gone on-line for political news and information has remained virtually unchanged since January Whites are much more likely than Latinos to seek presidential election news and information online (44% to 23%). The percentage of respondents who say they use the Internet to gather news and information about the presidential election decreases with age and increases with education and income. In the past few months, have you gone on-line to get news and information about the presidential election? If yes: Did you do this often or only sometimes? All Adults Dem Rep Ind Yes, often 19% 21% 21% 25% 27% Yes, sometimes No / No access While the percentage of Californians seeking political information on-line has not increased since the last presidential election, more people are receiving on-line political information today. The percentage of adults who report being contacted by elected officials, political candidates, political parties, or political causes through has increased dramatically. In August 2000, only 11 percent of adults received political often (2%) or sometimes (9%); today, 25 percent of Californians say they receive political often (12%) or sometimes (13%). Democrats (33%) are more likely than Republicans (27%) to have received political during this election cycle. Do you ever receive messages from elected officials, political candidates, political parties, or political causes? If yes: Does this happen often or only sometimes? All Adults Dem Rep Ind Yes, often 12% 19% 9% 13% 17% Yes, sometimes No / No access
27 Political Involvement Elections and Political Process Despite high interest in the presidential election, relatively few Californians have been directly involved in campaigns. In our September 2004 survey, 71 percent of the state s residents told us that it really matters who wins the presidential race. However, only 5 percent of all adults and 7 percent of likely voters in this survey say they have worked for a political party, candidate, or initiative campaign in the past 12 months. Participation in the form of political work during this presidential election year is almost the same as it was in 2002, which was a non-presidential election year. The rates of political work are uniformly low across party lines, candidate preferences, regions, and age, education, and income groups. Campaign work increases with age and education. Californians are far more likely to have been politically involved over the past 12 months by giving money to a political party, candidate, or initiative campaign. Overall, 20 percent of adults and 29 percent of likely voters have contributed money to political causes or candidates. These percentages are also virtually the same as in Today, about one in four Democrats (28%) and Republicans (25%) have contributed money during the past year, compared to 13 percent of independents. There are also important demographic differences, with political donations increasing sharply with age, education, and income. As for racial/ethnic differences, 27 percent of whites say they have contributed money, compared to only 6 percent of Latinos. Interestingly, there is no difference between Kerry and Bush supporters in the likelihood of making political contributions. In the past 12 months, have you a political party, candidate, or initiative campaign? Worked for Given money to All Adults 5% 20% 7 29 Democrat 7 28 Party registration Republican 5 25 Independent 5 13 Presidential vote Race/Ethnicity Age Gender Education Household income Kerry 6 22 Bush 5 21 White 7 27 Latino years old years old years or older 8 33 Male 4 19 Female 6 20 High school only 2 10 Some college 4 16 College graduate 8 31 Under $40, $40,000 to $79, $80,000 or more October 2004
28 Elections and Political Process Political Empowerment Do elections influence politicians? Sixty-nine percent of California adults and 77 percent of likely voters think that holding elections makes the government pay at least a fair amount of attention to what people think. However, three in 10 Californians and about one in five likely voters think that the electoral process results in little or no increase in government attentiveness to the people. Across parties, Republicans (81%) are more likely than Democrats (73%) and independents (66%) to think that holding elections makes policymakers pay attention to the concerns of constituents. Among those who are not registered to vote, 53 percent think that elections make the government pay a great deal (23%) or a fair amount (30%) of attention to the people. Across demographic groups, the percentage of adults who think elections result in greater government attention to public concerns increases with age, education and income. Whites are more likely than Latinos to hold this view (73% to 62%). To what extent do you feel that having elections makes the government pay attention to what the people think? All Adults Dem Rep Ind Not Registered Great deal 27% 27% 34% 24% 23% 30% Fair amount Not too much None at all Don't know More generally, how much attention do Californians think the government grants them? Fiftyfive percent of likely voters and 48 percent of all adults think that the government pays at least a fair amount of attention to what people think when deciding what to do. Republicans (63%) are more likely than Democrats (47%) and independents (44%) to think that the government takes the people s interests to heart in the decisionmaking process. Californians who approve of the president are more likely than those who do not approve of his performance to feel that the government pays attention to what people think. Across demographic groups, whites are more likely than Latinos (51% to 40%) to say the government pays attention to what the people think, and this perception increases with age, education, and income. Among those who are not registered to vote, 32 percent think that the government pays a great deal (12%) or a fair amount (20%) of attention to the people. In general, how much attention do you feel the government pays to what people think when it decides what to do? All Adults Dem Rep Ind Not Registered Great deal 9% 7% 11% 9% 12% 9% Fair amount Not too much None at all Don't know
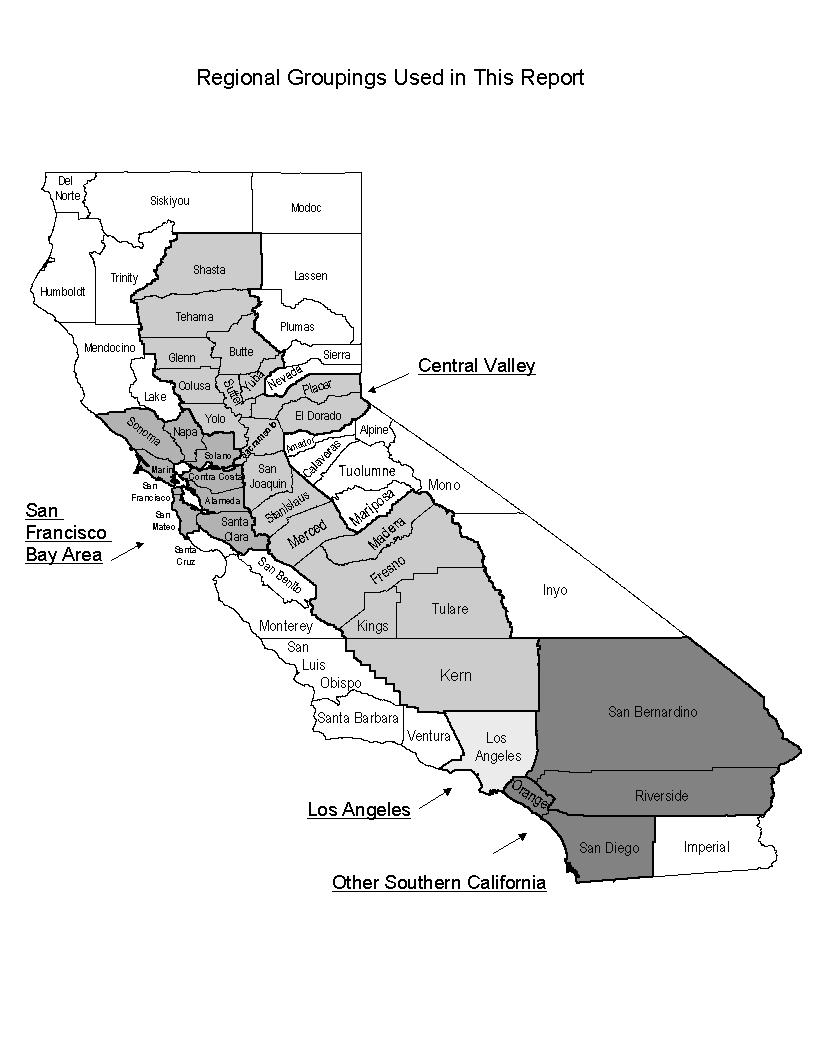
29 Survey Methodology The PPIC Statewide Survey is directed by Mark Baldassare, research director at the Public Policy Institute of California, with assistance in research and writing from Jon Cohen, associate survey director; Renatta DeFever and Kristy Michaud, survey research associates; and Kimberly Curry, survey intern. The findings of this survey are based on a telephone survey of 2,018 California adult residents interviewed between October 10 and October 17, Interviewing took place on weekday nights and weekend days, using a computer-generated random sample of telephone numbers that ensured that both listed and unlisted telephone numbers were called. All telephone exchanges in California were eligible for calling. Telephone numbers in the survey sample were called up to ten times to increase the likelihood of reaching eligible households. Once a household was reached, an adult respondent (age 18 or older) was randomly chosen for interviewing by using the last birthday method to avoid biases in age and gender. Each interview took an average of 20 minutes to complete. Interviewing was conducted in English or Spanish. Casa Hispana translated the survey into Spanish, and Schulman, Ronca & Bucuvalas, Inc. conducted the telephone interviewing. We used recent U.S. Census and state figures to compare the demographic characteristics of the survey sample with characteristics of California s adult population. The survey sample was closely comparable to the census and state figures. The survey data in this report were statistically weighted to account for any demographic differences. The sampling error for the total sample of 2,018 adults is +/- 2 percent at the 95 percent confidence level. This means that 95 times out of 100, the results will be within 2 percentage points of what they would be if all adults in California were interviewed. The sampling error for subgroups is larger. The sampling error for the 1,640 registered voters is +/- 2.5 percent, and the sampling error for the 1,170 likely voters is +/- 3 percent. Sampling error is only one type of error to which surveys are subject. Results may also be affected by factors such as question wording, question order, and survey timing. Throughout the report, we refer to four geographic regions. Central Valley includes Butte, Colusa, El Dorado, Fresno, Glenn, Kern, Kings, Madera, Merced, Placer, Sacramento, San Joaquin, Shasta, Stanislaus, Sutter, Tehama, Tulare, Yolo, and Yuba Counties. SF Bay Area includes Alameda, Contra Costa, Marin, Napa, San Francisco, San Mateo, Santa Clara, Solano, and Sonoma Counties. Los Angeles refers to Los Angeles County, and Other Southern California includes the mostly suburban regions of Orange, Riverside, San Bernardino, and San Diego Counties. These four regions are the major population centers of the state, accounting for approximately 90 percent of the state population. We present specific results for Latinos because they account for about 30 percent of the state s adult population and constitute one of the fastest growing voter groups. The sample sizes for the African American and Asian subgroups are not large enough for separate statistical analysis. We do contrast the opinions of registered Democrats, Republicans, and independents. The independents category includes only those who are registered to vote as decline to state. Information about the types of voting systems used by California s 58 counties comes from the California Secretary of State ( In some cases, we compare PPIC Statewide Survey responses to responses recorded in national surveys conducted by ABC News/Washington Post and National Public Radio. We use earlier PPIC Statewide Surveys to analyze trends over time in California
30
31 PPIC STATEWIDE SURVEY: CALIFORNIANS AND THEIR GOVERNMENT OCTOBER 10 OCTOBER 17, ,018 CALIFORNIA ADULT RESIDENTS; ENGLISH AND SPANISH MARGIN OF ERROR +/-2% AT 95% CONFIDENCE LEVEL FOR TOTAL SAMPLE 1. Do you think things in California are generally going in the right direction or the wrong direction? 44% right direction 44 wrong direction 12 don't know 2. Turning to economic conditions in California, do you think that during the next 12 months we will have good times financially or bad times? 42% good times 43 bad times 15 don't know [Responses recorded for questions 3 through 19 are from likely voters only. All other responses are from all adults, except where noted.] 3. If the November 2 nd presidential election were being held today, would you vote for: [rotate] the Republican ticket of George W. Bush and Dick Cheney [or] the Democratic ticket of John Kerry and John Edwards? 51% John Kerry and John Edwards 39 George W. Bush and Dick Cheney 3 other answer (specify) 7 don't know 4. How closely are you following news about candidates for the upcoming presidential election very closely, fairly closely, not too closely, or not at all closely? 61% very closely 34 fairly closely 4 not too closely 1 not at all closely 5a. Which one issue would you most like to hear the presidential candidates talk about between now and the November 2 nd general election? [code, don't read] 27% jobs; economy; unemployment 16 Iraq situation; war in Iraq 10 health care; health costs; Medicare 6 terrorism; security issues 6 education; schools 5 immigration; illegal immigration 4 federal budget; deficit; taxes 3 foreign policy in general 2 energy; oil prices; gasoline prices 2 environment; pollution 2 Social Security 1 abortion 1 crime; drugs 1 gay rights; same-sex marriages 1 family values; morals 5 other (specify) 8 don t know 5b. Is there another issue that you want to hear about almost as much? [code, don t read] 20% jobs; economy; unemployment 19 Iraq situation; war in Iraq 16 health care; health costs; Medicare 7 education; schools 5 terrorism; security issues 4 environment; pollution 4 federal budget; deficit; taxes 4 Social Security 3 foreign policy in general 3 immigration; illegal immigration 2 energy; oil prices; gasoline prices 2 government regulations 1 abortion 1 gay rights; same-sex marriages 1 family values; morals 1 population growth; too much development 7 other (specify)
32 6. The Democratic and Republican candidates are having a series of debates. Some people learn about the debates from news reports as well as seeing or hearing about them. So far, have the debates helped you a lot, some, or not much in deciding who to vote for in the presidential election? 17% a lot 26 some 37 not much 11 not at all [volunteered] 1 haven't seen, heard, read about debates [volunteered] 6 made up mind before debates [volunteered] 2 don't know Regardless of your choice for president, which of these candidates would do the better job on each of these issues George W. Bush or John Kerry? [rotate questions 7 to 10] 7. How about the situation in Iraq? 45% George W. Bush 48 John Kerry 2 other answer (specify) 5 don't know 8. How about health care? 32% George W. Bush 56 John Kerry 3 other answer (specify) 9 don't know 9. How about jobs and the economy? 38% George W. Bush 55 John Kerry 2 other answer (specify) 5 don't know 10. How about terrorism and homeland security? 49% George W. Bush 43 John Kerry 3 other answer (specify) 5 don't know 11. If the November election for the U.S. Senate were being held today, would you vote for: [rotate] Barbara Boxer, the Democrat [or] Bill Jones, the Republican? 53% Barbara Boxer 35 Bill Jones 2 other answer (specify) 10 don't know 12. How closely are you following news about candidates for the U.S. Senate election in California very closely, fairly closely, not too closely, or not at all closely? 12% very closely 30 fairly closely 39 not too closely 19 not at all closely 13. In the past month, have you seen any advertisements by the candidates for California's U.S. Senate election? 54% yes [ask q. 13a] 46 no [skip to q. 14] 13a.Whose ads have you seen the most Barbara Boxer's or Bill Jones'? 79% Barbara Boxer's ads 11 Bill Jones' ads 7 both equally 1 other (specify) 2 don't know 14. Proposition 63 on the November 2 nd ballot the Mental Health Services Expansion and Funding initiative establishes a 1 percent tax on taxable personal income above one million dollars to expand health services for mentally ill children, adults, and seniors. The fiscal impact includes additional state revenue of about 800 million dollars annually by , with comparable increases in state and county spending to expand mental health programs. If the election were held today, would you vote yes or no on Proposition 63? 62% yes 24 no 14 don't know 15. Do you think that the current level of state funding for mental health programs is more than enough, just enough, or not enough? 5% more than enough 13 just enough 66 not enough 16 don't know
33 16. Proposition 71 is the Stem Cell Research Funding Bonds Initiative Constitutional Amendment and Statute. This measure establishes the California Institute for Regenerative Medicine to regulate and fund stem cell research, the constitutional right to conduct such research, and an oversight committee. It prohibits funding of human reproductive cloning research. The expected fiscal impact is state costs of about 6 billion dollars over 30 years to pay off both the principal and interest on the bonds, with state payments averaging about 200 million dollars per year. If the election were held today, would you vote yes or no on Proposition 71? 50% yes 39 no 11 don't know 17. Do you think the federal government spends too much, the right amount, or too little on medical research using embryonic stem cells? 14% too much 14 the right amount 53 too little 3 federal government should not fund stem cell research 16 don't know 18. Proposition 72 on the November ballot is the Health Care Coverage Requirements Referendum. A Yes vote approves and a No vote rejects state legislation requiring health care coverage for employees working for large and medium employers. The fiscal impacts include significant state expenditures on private health insurance offset fully by significant employer health coverage costs, significant county health program savings, and significant net state revenue losses. If the election were held today, would you vote yes or no on Proposition 72? 41% yes 38 no 21 don't know 19. How important is it to you that large and medium employers provide health care benefits for their employees very important, somewhat important, not too important, or not at all important? 64% very important 23 somewhat important 4 not too important 6 not at all important 3 don't know 20. Changing topics, overall do you approve or disapprove of the way that George W. Bush is handling his job as president of the United States? 42% approve 55 disapprove 3 don't know [rotate questions 21 and 22] 21. Overall, do you approve or disapprove of the way that Dianne Feinstein is handling her job as U.S. Senator? 51% approve 26 disapprove 23 don't know 22. Overall, do you approve or disapprove of the way that Barbara Boxer is handling her job as U.S. Senator? 53% approve 27 disapprove 20 don't know [rotate questions 23 and 24] 23. Overall, how do you rate the job performance of the U.S. Congress at this time excellent, good, fair, or poor? 3% excellent 24 good 46 fair 22 poor 5 don't know 24. Overall, at this time, how do you rate the job performance of the representative to the U.S. House of Representatives from your congressional district excellent, good, fair, or poor? 7% excellent 32 good 36 fair 10 poor 15 don't know 25. Overall, do you approve or disapprove of the way that Arnold Schwarzenegger is handling his job as governor of California? 61% approve 33 disapprove 6 don't know October 2004
34 26. Governor Schwarzenegger was elected in the recall election of October Overall, how would you describe his first year in office has it been better than you expected, about the same as you expected, or worse than you expected? 40% better than expected 41 about the same as expected 17 worse than expected 2 don't know [rotate questions 27 and 28] 27. Overall, do you approve or disapprove of the way that the California legislature is handling its job? 43% approve 41 disapprove 16 don't know 28. Overall, do you approve or disapprove of the job that the state legislators representing your assembly and state senate districts are doing at this time? 49% approve 31 disapprove 20 don't know 29. Generally speaking, and regardless of how you felt about the recall election in October 2003, do you think it is a good thing or a bad thing that the California constitution provides a way to recall the state's elected officials, such as the governor? 71% good thing 24 bad thing 5 don't know 30. Comparing today to before the recall election last October, are you more likely or less likely to support a recall of a state elected official in the future, or has it made no difference? 30% more likely to support a recall 18 less likely to support a recall 46 no difference 1 other (specify) 5 don't know 31. Generally speaking, and regardless of how you felt about the recall election last October, do you think the recall election process is in need of major changes, minor changes, or is it basically okay the way it is? 28% major changes 24 minor changes 43 okay the way it is 5 don't know 32. Overall, would you say the October 2003 recall election has made you feel better, worse, or no different about California politics? 33% better 23 worse 41 no different 3 don't know 33. More generally, overall do you think that election campaigns in California have gotten better in the last 10 years, gotten worse, or stayed about the same? 14% gotten better 31 gotten worse 49 stayed about the same 6 don't know 34. On another topic, some people are registered to vote and others are not. Are you absolutely certain that you are registered to vote? 81% yes [ask q. 34a] 19 no [skip to q. 35] 34a. Are you registered as a Democrat, a Republican, an independent, or as another party? 42% Democrat 34 Republican 19 independent 5 another party (specify) 35. Regardless of your current voter registration status, generally speaking, do you usually think of yourself as a Democrat, a Republican, an independent, or what? 34% Democrat [ask q. 36b] 25 Republican [ask q. 36c] 32 independent [ask q. 36a] 6 other (specify) [ask q. 36a] 3 don't know [ask q. 36a] 36a.Do you think of yourself as closer to the Republican Party or Democratic Party? 29% Republican party 45 Democratic party 19 neither 7 don't know 36b.Would you call yourself a strong Democrat or not a very strong Democrat? 56% strong 42 not very strong 2 don't know
35 36c.Would you call yourself a strong Republican or not a very strong Republican? 63% strong 35 not very strong 2 don't know 37. On another topic, would you consider yourself to be politically 12% very liberal 22 somewhat liberal 28 middle-of-the-road 25 somewhat conservative 11 very conservative 2 don't know 38. Generally speaking, how much interest would you say you have in politics a great deal, a fair amount, only a little, or none? 30% great deal 44 fair amount 22 only a little 4 none 39. How do you get most of your information about politics from television, newspapers, radio, the Internet, magazines, or talking to other people? [if television: Would that be major network TV, local TV, or cable news stations such as CNN or MSNBC? 14% network television 12 local television 18 cable television 20 newspapers 12 radio 9 Internet 8 talking to other people 2 magazines 4 other (specify) 1 don't know 40. How often, if ever, do you listen to radio shows that invite listeners to call in to discuss current events, public issues, and politics regularly, sometimes, rarely, or never? 27% regularly 23 sometimes 21 rarely 29 never 41. Do the radio call-in shows you listen to tend to be more conservative or more liberal? 43% more conservative 42 more liberal 7 other answer (specify) 8 don't know 42. In the past few months, have you gone on-line to get news and information about the presidential election? If yes: Did you do this often or only sometimes? 19% yes, often 20 yes, sometimes 61 no 43. Do you ever receive messages from elected officials, political candidates, political parties, or political causes? If yes: Does this happen to you often or only sometimes? 12% yes, often 13 yes, sometimes 75 no [rotate questions 44 and 45] 44. In the past 12 months, have you worked for a political party, candidate, or initiative campaign? 5% yes 95 no 45. And in the past 12 months, have you given money to a political party, candidate, or initiative campaign? 20% yes 80 no [Responses recorded for questions 46 to 47a are from registered voters only] 46. How often would you say you vote always, nearly always, part of the time, seldom, or never? 68% always 18 nearly always 8 part of the time 3 seldom 3 never 47. Do you plan to vote in the general election on November 2 nd? 97% yes [ask q. 47a] 3 no [skip to q. 48] 47a.Will you vote at your local polling place or by absentee ballot? 69% local polling place 30 absentee ballot 1 don't know October 2004

36 48. Overall, how much confidence do you have in the system in which votes are cast and counted in this country a great deal, quite a lot, some, or very little? 26% great deal 25 quite a lot 28 some 17 very little 2 none [volunteered] 2 don t know 49. Thinking about your own vote, how much confidence do you have that your vote will be properly and accurately counted very confident, somewhat confident, not very confident, or not at all confident? 52% very confident 38 somewhat confident 7 not very confident 3 not at all confident 50. In general, how would you prefer to cast your vote electronically on a touchscreen machine, by punch card, by paper ballot with a pen, or by some other method? 36% electronically 29 paper ballot 24 punch card 4 prefer all methods equally [volunteered] 3 other method (specify) 4 don't know 51. For future presidential elections, would you support or oppose changing to a system in which the president is elected by direct popular vote, instead of by the Electoral College? 64% would support change to popular vote 26 would oppose change to popular vote 10 don't know 52. To what extent do you feel that having elections makes the government pay attention to what the people think a great deal, a fair amount, not too much, or none at all? 27% great deal 42 fair amount 23 not too much 6 none at all 2 don't know 53. In general, how much attention do you feel the government pays to what people think when it decides what to do a great deal, a fair amount, not too much, or none at all? 9% great deal 39 fair amount 40 not too much 10 none at all 2 don't know 54. On another topic, are you, yourself, now covered by any form of health insurance or health plan? 80% yes 20 no 55. Are you or is anyone in your immediate family a member of a labor union? If yes: Is that person you or another person in your family? 11% yes, respondent 10 yes, another person in family 2 yes, both 77 no [56-69: demographic questions]
PPIC STATEWIDE SURVEY
 PPIC STATEWIDE SURVEY SEPTEMBER 2004 Californians and Their Government Public Policy Institute of California Mark Baldassare Research Director & Survey Director The Public Policy Institute of California
David W. Lyon is founding President and Chief Executive Officer of PPIC. Thomas C. Sutton is Chair of the Board of Directors.
 The Public Policy Institute of California (PPIC) is a private operating foundation established in 1994 with an endowment from William R. Hewlett. The Institute is dedicated to improving public policy in
march 2009 Californians their government in collaboration with The James Irvine Foundation Mark Baldassare Dean Bonner Jennifer Paluch Sonja Petek
 march 2009 Californians & their government in collaboration with The James Irvine Foundation Mark Baldassare Dean Bonner Jennifer Paluch Sonja Petek The Public Policy Institute of California is dedicated
Californians. population issues. february in collaboration with The William and Flora Hewlett Foundation
 february 2009 Californians & population issues in collaboration with The William and Flora Hewlett Foundation Mark Baldassare Dean Bonner Jennifer Paluch Sonja Petek The Public Policy Institute of California
Californians. their government. september in collaboration with The James Irvine Foundation
 september 2008 Californians & their government in collaboration with The James Irvine Foundation Mark Baldassare Dean Bonner Jennifer Paluch Sonja Petek The Public Policy Institute of California is dedicated
Californians. their government. ppic statewide survey DECEMBER in collaboration with The James Irvine Foundation CONTENTS
 ppic statewide survey DECEMBER 2010 Californians & their government Mark Baldassare Dean Bonner Sonja Petek Nicole Willcoxon CONTENTS About the Survey 2 Press Release 3 November 2010 Election 6 State and
PPIC STATEWIDE SURVEY
 PPIC STATEWIDE SURVEY SEPTEMBER 2005 Special Survey on Californians and the Initiative Process in collaboration with The James Irvine Foundation Public Policy Institute of California Mark Baldassare Research
Californians. healthy communities. ppic statewide survey FEBRUARY in collaboration with The California Endowment CONTENTS
 ppic statewide survey FEBRUARY 2011 Californians & healthy communities Mark Baldassare Dean Bonner Sonja Petek Nicole Willcoxon CONTENTS About the Survey 2 Press Release 3 Residents Perceptions & Attitudes
Californians & Their Government
 Californians & Their Government Mark Baldassare Dean Bonner David Kordus Lunna Lopes CONTENTS Press Release 3 State Issues 6 Federal Issues 14 Regional Map 24 Methodology 25 Questionnaire and Results 27
Californians. their government. ppic state wide surve y SEPTEMBER supported with funding from The James Irvine Foundation CONTENTS
 ppic state wide surve y SEPTEMBER 2015 Californians & their government Mark Baldassare Dean Bonner David Kordus Lunna Lopes CONTENTS About the Survey 2 Press Release 3 State Government 6 Federal Government
Californians. their government. ppic state wide surve y SEPTEMBER in collaboration with The James Irvine Foundation
 ppic state wide surve y SEPTEMBER 2014 Californians & their government Mark Baldassare Dean Bonner Renatta DeFever Lunna Lopes Jui Shrestha CONTENTS About the Survey 2 Press Release 3 November 2014 Election
Californians. their government. ppic statewide survey SEPTEMBER in collaboration with The James Irvine Foundation CONTENTS
 ppic statewide survey SEPTEMBER 2010 Californians & their government Mark Baldassare Dean Bonner Sonja Petek Nicole Willcoxon CONTENTS About the Survey 2 Press Release 3 November 2010 Election 6 State
Californians. their government. ppic statewide sur vey J A N U A R Y in collaboration with The James Irvine Foundation CONTENTS
 ppic statewide sur vey J A N U A R Y 2 0 1 0 Californians & their government Mark Baldassare Dean Bonner Sonja Petek Nicole Willcoxon CONTENTS About the Survey 2 Press Release 3 2010 Election Context 6
Mark Baldassare is President and Chief Executive Officer of PPIC. Thomas C. Sutton is Chair of the Board of Directors.
 MaY 2008 The Public Policy Institute of California is dedicated to informing and improving public policy in California through independent, objective, nonpartisan research on major economic, social, and
Californians & Their Government
 Californians & Their Government Mark Baldassare Dean Bonner Lunna Lopes CONTENTS Press Release 3 2018 California Election 6 State and National Issues 13 Regional Map 20 Methodology 21 Questionnaire and
Californians. their government. january in collaboration with The James Irvine Foundation
 january 2009 Californians & their government in collaboration with The James Irvine Foundation Mark Baldassare Dean Bonner Jennifer Paluch Sonja Petek The Public Policy Institute of California is dedicated
Californians. their government. ppic state wide surve y OCTOBER in collaboration with The James Irvine Foundation CONTENTS
 ppic state wide surve y OCTOBER 2012 Californians & their government Mark Baldassare Dean Bonner Sonja Petek Jui Shrestha CONTENTS About the Survey 2 Press Release 3 November 2012 Election 6 State and
Californians. their government. ppic state wide surve y JANUARY in collaboration with The James Irvine Foundation CONTENTS
 ppic state wide surve y JANUARY 2013 Californians & their government Mark Baldassare Dean Bonner Sonja Petek Jui Shrestha CONTENTS About the Survey 2 Press Release 3 State Government 6 Federal Government
David W. Lyon is founding President and Chief Executive Officer of PPIC. Thomas C. Sutton is Chair of the Board of Directors.
 The Public Policy Institute of California (PPIC) is a private operating foundation established in 1994 with an endowment from William R. Hewlett. The Institute is dedicated to improving public policy in
Californians & Their Government
 PPIC STATEWIDE SURVEY DECEMBER 2018 Californians & Their Government Mark Baldassare Dean Bonner Alyssa Dykman Lunna Lopes CONTENTS Press Release State Post-Election Landscape Federal Post-Election Landscape
PPIC STATEWIDE SURVEY
 PPIC STATEWIDE SURVEY J ANUAR ARY Y 2006 Special Survey on the California State Budget in collaboration with The James Irvine Foundation Public Policy Institute of California Mark Baldassare Research Director
Californians. their government. ppic state wide surve y JANUARY in collaboration with The James Irvine Foundation CONTENTS
 ppic state wide surve y JANUARY 2014 Californians & their government Mark Baldassare Dean Bonner Sonja Petek Jui Shrestha CONTENTS About the Survey 2 Press Release 3 State Government 6 Federal Government
Californians. their government. ppic state wide surve y MARCH in collaboration with The James Irvine Foundation CONTENTS
 ppic state wide surve y MARCH 2014 Californians & their government Mark Baldassare Dean Bonner Sonja Petek Jui Shrestha CONTENTS About the Survey 2 Press Release 3 State Government 6 Federal Government
Californians. their government. ppic state wide surve y MARCH in collaboration with The James Irvine Foundation CONTENTS
 ppic state wide surve y MARCH 2012 Californians & their government Mark Baldassare Dean Bonner Sonja Petek Jui Shrestha CONTENTS About the Survey 2 Press Release 3 2012 Elections 6 State and National Issues
PUBLIC POLICY INSTITUTE OF CALIFORNIA 500 Washington Street, Suite 800 San Francisco, California phone: fax:
 PUBLIC POLICY INSTITUTE OF CALIFORNIA 500 Washington Street, Suite 800 San Francisco, California 94111 phone: 415.291.4400 fax: 415.291.4401 www.ppic.org survey@ppic.org TABLE OF CONTENTS About the Survey
As Budget Angst Grows, Californians Take Stock of Fiscal Options And Take Aim at Elected Leaders
 EMBARGOED: Do not publish or broadcast until 10:00 p.m. PDT on Wednesday, March 26. CONTACT: Andrew Hattori, 415/291-4417 Abby Cook, 415/291-4436 Para ver este comunicado de prensa en español, por favor
PPIC STATEWIDE SURVEY
 PPIC STATEWIDE SURVEY FEBRU ARY 2006 Californians and the Environment in collaboration with The David and Lucile Packard Foundation Public Policy Institute of California Mark Baldassare Research Director
Californians. their government. ppic state wide surve y SEPTEMBER in collaboration with The James Irvine Foundation CONTENTS
 ppic state wide surve y SEPTEMBER 2013 Californians & their government Mark Baldassare Dean Bonner Sonja Petek Jui Shrestha CONTENTS About the Survey 2 Press Release 3 State Government 6 Federal Government
PPIC Statewide Survey: Californians and Their Government
 PPIC Statewide Survey: Californians and Their Government Mark Baldassare Senior Fellow and Survey Director January 2001 Public Policy Institute of California Preface California is in the midst of tremendous
Californians. their government. ppic statewide sur vey. d e c e m b e r in collaboration with The James Irvine Foundation CONTENTS
 ppic statewide sur vey d e c e m b e r 2 0 0 9 Californians & their government Mark Baldassare Dean Bonner Jennifer Paluch Sonja Petek CONTENTS About the Survey 2 Press Release 3 2010 California Election
PPIC Statewide Survey: Californians and Their Government
 PPIC Statewide Survey: ns and Their Government Mark Baldassare Senior Fellow and Survey Director January 2000 Public Policy Institute of The Public Policy Institute of is a private, nonprofit research
Californians & Their Government
 Californians & Their Government Mark Baldassare Dean Bonner Alyssa Dykman CONTENTS Press Release 3 2018 California Election 6 State and National Issues 11 Regional Map 20 Methodology 21 Questionnaire and
TABLE OF CONTENTS. About the Survey 1. Press Release 3. State Issues 7. National Issues 15. Regional Map 24. Methodology 25
 TABLE OF CONTENTS About the Survey 1 Press Release 3 State Issues 7 National Issues 15 Regional Map 24 Methodology 25 Questionnaire and Results 27 ABOUT THE SURVEY The PPIC Statewide Survey provides policymakers,
Californians. their government. ppic state wide surve y MAY in collaboration with The James Irvine Foundation CONTENTS
 ppic state wide surve y MAY 2013 Californians & their government Mark Baldassare Dean Bonner Sonja Petek Jui Shrestha CONTENTS About the Survey 2 Press Release 3 State Government 6 Federal Government 16
Californians & Their Government
 Californians & Their Government Mark Baldassare Dean Bonner David Kordus Lunna Lopes CONTENTS Press Release 3 Federal Government 6 State Government 15 Regional Map 22 Methodology 23 Questionnaire and Results
Californians & Their Government
 Californians & Their Government Mark Baldassare Dean Bonner Alyssa Dykman Lunna Lopes CONTENTS Press Release 3 2018 California Election 6 State and National Issues 12 Regional Map 20 Methodology 21 Questionnaire
Californians & the Environment
 Californians & the Environment Mark Baldassare Dean Bonner Alyssa Dykman Lunna Lopes CONTENTS Press Release 3 2018 Election and Environmental Issues 6 Public Perceptions and Policy Preferences 14 Regional
PPIC Statewide Survey: Special Survey on Growth
 PPIC Statewide Survey: Special Survey on Growth Mark Baldassare Senior Fellow and Survey Director May 2001 Part of the Growth, Land Use, and Environment Series In Collaboration with The William and Flora
Coping with Homeland Security in California: Surveys of City Officials and State Residents
 Occasional Papers Coping with Homeland Security in California: Surveys of City Officials and State Residents Mark Baldassare Public Policy Institute of California Christopher Hoene National League of Cities
PPIC STATEWIDE SURVEY
 PPIC STATEWIDE SURVEY NOVEMBER 2003 Special Survey on Californians and the Environment in collaboration with The William and Flora Hewlett Foundation The James Irvine Foundation The David and Lucile Packard
PPIC Statewide Survey: Special Survey on Land Use part of the Growth, Land Use, and Environment Series
 PPIC Statewide Survey: Special Survey on Land Use part of the Growth, Land Use, and Environment Series in collaboration with the The William and Flora Hewlett Foundation The James Irvine Foundation The
Preface. The characteristics of groups that are shaping the state's elections and policy debates.
 Preface California is now in the midst of historic changes that will profoundly affect the future of the state. To improve understanding of these changes and their effect on the political status quo, PPIC
PPIC STATEWIDE SURVEY J U N E
 PPIC STATEWIDE SURVEY J U N E 2 0 0 6 Special Survey of the Central in collaboration with the Great Center Public Policy Institute of California Mark Baldassare Research Director & Survey Director The
These are the highlights of the latest Field Poll completed among a random sample of 997 California registered voters.
 THE FIELD POLL THE INDEPENDENT AND NON-PARTISAN SURVEY OF PUBLIC OPINION ESTABLISHED IN 1947 AS THE CALIFORNIA POLL BY MERVIN FIELD Field Research Corporation 601 California Street, Suite 900 San Francisco,
GOP leads on economy, Democrats on health care, immigration
 FOR RELEASE JUNE 20, 2018 Voters More Focused on Control of Congress and the President Than in Past Midterms GOP leads on economy, Democrats on health care, immigration FOR MEDIA OR OTHER INQUIRIES: Carroll
Two-to-one voter support for Marijuana Legalization (Prop. 64) and Gun Control (Prop. 63) initiatives.
 and Gun Control (Prop. 63) initiatives.") UC Berkeley IGS Poll Title Two-to-one voter support for Marijuana Legalization (Prop. 64) and Gun Control (Prop. 63) initiatives. Permalink https://escholarship.org/uc/item/51c1h00j Author DiCamillo, Mark
UC Berkeley IGS Poll Title Two-to-one voter support for Marijuana Legalization (Prop. 64) and Gun Control (Prop. 63) initiatives. Permalink https://escholarship.org/uc/item/51c1h00j Author DiCamillo, Mark
CONTACT: TIM VERCELLOTTI, Ph.D., (732) , EXT. 285; (919) (cell) CRANKY ELECTORATE STILL GIVES DEMOCRATS THE EDGE
 , EXT. 285; (919) (cell) CRANKY ELECTORATE STILL GIVES DEMOCRATS THE EDGE") - Eagleton Poll EMBARGOED UNTIL 9 A.M. EDT OCT. 25, 2007 Oct. 25, 2007 (Release 163-1) CONTACT: TIM VERCELLOTTI, Ph.D., (732) 932-9384, EXT. 285; (919) 812-3452 (cell) CRANKY ELECTORATE STILL GIVES DEMOCRATS
- Eagleton Poll EMBARGOED UNTIL 9 A.M. EDT OCT. 25, 2007 Oct. 25, 2007 (Release 163-1) CONTACT: TIM VERCELLOTTI, Ph.D., (732) 932-9384, EXT. 285; (919) 812-3452 (cell) CRANKY ELECTORATE STILL GIVES DEMOCRATS
NUMBERS, FACTS AND TRENDS SHAPING THE WORLD. FOR RELEASE September 12, 2014 FOR FURTHER INFORMATION ON THIS REPORT:
 NUMBERS, FACTS AND TRENDS SHAPING THE WORLD FOR RELEASE September 12, 2014 FOR FURTHER INFORMATION ON THIS REPORT: Carroll Doherty, Director of Political Research Jocelyn Kiley, Associate Director Rachel
THE FIELD POLL. UCB Contact
 Field Research Corporation 601 California Street, Suite 900, San Francisco, CA 94108-2814 415.392.5763 FAX: 415.434.2541 field.com/fieldpollonline THE FIELD POLL UNIVERSITY OF CALIFORNIA, BERKELEY BERKELEY
Release #2337 Release Date and Time: 6:00 a.m., Friday, June 4, 2010
 THE FIELD POLL THE INDEPENDENT AND NON-PARTISAN SURVEY OF PUBLIC OPINION ESTABLISHED IN 1947 AS THE CALIFORNIA POLL BY MERVIN FIELD Field Research Corporation 601 California Street, Suite 900 San Francisco,
PPIC Statewide Survey: Californians and Their Government
 PPIC Statewide Survey: Californians and Their Government February 8, 18 Mark Baldassare, Dean Bonner, Alyssa Dykman, Lunna Lopes Supported with funding from the James Irvine Foundation, the California
Rock the Vote September Democratic Strategic Analysis by Celinda Lake, Joshua E. Ulibarri, and Karen M. Emmerson
 Rock the Vote September 2008 Democratic Strategic Analysis by Celinda Lake, Joshua E. Ulibarri, and Karen M. Emmerson Rock the Vote s second Battleground poll shows that young people want change and believe
BLISS INSTITUTE 2006 GENERAL ELECTION SURVEY
 BLISS INSTITUTE 2006 GENERAL ELECTION SURVEY Ray C. Bliss Institute of Applied Politics The University of Akron Executive Summary The Bliss Institute 2006 General Election Survey finds Democrat Ted Strickland
Proposed gas tax repeal backed five to four. Support tied to voter views about the state s high gas prices rather than the condition of its roads
 Jack Citrin Center for Public Opinion Research Institute of Governmental Studies 124-126 Moses Hall University of California, Berkeley Berkeley, CA 94720 Tel: 510-642- 6835 Email: igs@berkeley.edu Release
It s Democrats +8 in Likely Voter Preference, With Trump and Health Care on Center Stage
 ABC NEWS/WASHINGTON POST POLL: The 2018 Midterm Elections EMBARGOED FOR RELEASE AFTER 12:00 a.m. Sunday, Nov. 4, 2018 It s Democrats +8 in Likely Voter Preference, With Trump and Health Care on Center
THE BUSH PRESIDENCY AND THE STATE OF THE UNION January 20-25, 2006
 CBS NEWS/NEW YORK TIMES POLL For release: January 26, 2005 6:30 P.M. THE BUSH PRESIDENCY AND THE STATE OF THE UNION January 20-25, 2006 For the first time in his presidency, George W. Bush will give a
THE 2004 NATIONAL SURVEY OF LATINOS: POLITICS AND CIVIC PARTICIPATION
 Summary and Chartpack Pew Hispanic Center/Kaiser Family Foundation THE 2004 NATIONAL SURVEY OF LATINOS: POLITICS AND CIVIC PARTICIPATION July 2004 Methodology The Pew Hispanic Center/Kaiser Family Foundation
Instituted in 1911, the statewide initiative process was a Progressive Era reform that
 Public Policy Institute of California The California Initiative Process How Democratic Is It? Instituted in 1911, the statewide initiative process was a Progressive Era reform that allowed citizens to
Economic Issues in Ohio Work to Kerry s Advantage
 ABC NEWS POLL: THE RACE IN OHIO 10/17/04 EMBARGOED FOR RELEASE AFTER 5 p.m. Tuesday, Oct. 19, 2004 Economic Issues in Ohio Work to Kerry s Advantage The economy and jobs dominate as the top issue in Ohio,
THE FIELD POLL. UCB Contact
 Field Research Corporation 601 California Street, Suite 900, San Francisco, CA 94108-2814 415.392.5763 FAX: 415.434.2541 field.com/fieldpollonline THE FIELD POLL UNIVERSITY OF CALIFORNIA, BERKELEY BERKELEY
RECOMMENDED CITATION: Pew Research Center, May, 2015, Free Trade Agreements Seen as Good for U.S., But Concerns Persist
 NUMBERS, FACTS AND TRENDS SHAPING THE WORLD FOR RELEASE MAY 27, 2015 FOR FURTHER INFORMATION ON THIS REPORT: Carroll Doherty, Director of Political Research Jocelyn Kiley, Associate Director, Research
FOR RELEASE NOVEMBER 07, 2017
 FOR RELEASE NOVEMBER 07, 2017 FOR MEDIA OR OTHER INQUIRIES: Carroll Doherty, Director of Political Research Jocelyn Kiley, Associate Director, Research Bridget Johnson, Communications Associate 202.419.4372
RECOMMENDED CITATION: Pew Research Center, December, 2016, Low Approval of Trump s Transition but Outlook for His Presidency Improves
 NUMBERS, FACTS AND TRENDS SHAPING THE WORLD FOR RELEASE DECEMBER 8, 2016 FOR MEDIA OR OTHER INQUIRIES: Carroll Doherty, Director of Political Research Jocelyn Kiley, Associate Director, Research Bridget
Marist College Institute for Public Opinion Poughkeepsie, NY Phone Fax
 Marist College Institute for Public Opinion Poughkeepsie, NY 12601 Phone 845.575.5050 Fax 845.575.5111 www.maristpoll.marist.edu New Hampshire Presidential Primary EMBARGOED FOR RELEASE: Wednesday 6 p.m.
Marist College Institute for Public Opinion Poughkeepsie, NY Phone Fax
 Marist College Institute for Public Opinion Poughkeepsie, NY 12601 Phone 845.575.5050 Fax 845.575.5111 www.maristpoll.marist.edu National Poll: The Candidates and the Campaign 2004 FOR IMMEDIATE RELEASE:
Hatch Opens Narrow Lead Over Pawlenty
 Hatch Opens Narrow Lead Over Pawlenty Lawrence R. Jacobs Director, Center for the Study of Politics and Governance Humphrey Institute of Public Affairs University of Minnesota Joanne M. Miller Research
Before the Storm: The Presidential Race October 25-28, 2012
 CBS NEWS/NEW YORK TIMES POLL For release: October 30, 2012 6:30 PM EDT Before the Storm: The Presidential Race October 25-28, 2012 In polling conducted before Hurricane Sandy hit the east coast, the presidential
Growing share of public says there is too little focus on race issues
 FOR RELEASE DECEMBER 19, 2017 Most Americans Say Trump s Election Has Led to Worse Race Relations in the U.S. Growing share of public says there is too little focus on race issues FOR MEDIA OR OTHER INQUIRIES:
234 Front Street San Francisco. CA (415) FAX (415)
 FAX (415)") THE FIELD POLL THE INDEPENDENT AND NON-PARTISAN SURVEY OF PUBLIC OPINION ESTABLISHED IN 147 AS THE CALIFORNIA POLL BY MERVIN FIELD 234 Front Street San Francisco. CA 4111 (4) 32-5763 FAX (4) 434-2541 COPYRIGHT
THE FIELD POLL THE INDEPENDENT AND NON-PARTISAN SURVEY OF PUBLIC OPINION ESTABLISHED IN 147 AS THE CALIFORNIA POLL BY MERVIN FIELD 234 Front Street San Francisco. CA 4111 (4) 32-5763 FAX (4) 434-2541 COPYRIGHT
Voter turnout in today's California presidential primary election will likely set a record for the lowest ever recorded in the modern era.
 THE FIELD POLL THE INDEPENDENT AND NON-PARTISAN SURVEY OF PUBLIC OPINION ESTABLISHED IN 1947 AS THE CALIFORNIA POLL BY MERVIN FIELD Field Research Corporation 601 California Street, Suite 900 San Francisco,
RECOMMENDED CITATION: Pew Research Center, May, 2015, Negative Views of New Congress Cross Party Lines
 NUMBERS, FACTS AND TRENDS SHAPING THE WORLD FOR RELEASE MAY 21, 2015 FOR FURTHER INFORMATION ON THIS REPORT: Carroll Doherty, Director of Political Research Jocelyn Kiley, Associate Director, Research
PEW RESEARCH CENTER. FOR RELEASE January 16, 2019 FOR MEDIA OR OTHER INQUIRIES:
 FOR RELEASE January 16, 2019 FOR MEDIA OR OTHER INQUIRIES: Carroll Doherty, Director of Political Research Jocelyn Kiley, Associate Director, Research Bridget Johnson, Communications Manager 202.419.4372
A Harsh Judgment on Davis Clears Schwarzenegger s Way
 CALIFORNIA EXIT POLL: THE RECALL 10/7/03 A Harsh Judgment on Davis Clears Schwarzenegger s Way In the end it was more about Gray Davis than about Arnold Schwarzenegger, and on Davis, the voters judgment
RECOMMENDED CITATION: Pew Research Center, July, 2015, Negative Views of Supreme Court at Record High, Driven by Republican Dissatisfaction
 NUMBERS, FACTS AND TRENDS SHAPING THE WORLD FOR RELEASE JULY 29, 2015 FOR FURTHER INFORMATION ON THIS REPORT: Carroll Doherty, Director of Political Research Bridget Jameson, Communications Associate 202.419.4372
Release # For Publication: Tuesday, September 19, 2017
 Jack Citrin Center for Public Opinion Research Institute of Governmental Studies 124-126 Moses Hall University of California Berkeley, CA 94720 Tel: 510-642- 6835 Email: igs@berkeley.edu Release #2017-16
PPIC Statewide Survey:
 Global California: PPIC Statewide Survey: Perspectives on U.S.-Japan Relations Mark Baldassare Senior Fellow and Survey Director September 2001 Public Policy Institute of California Contents Press Release
CHRISTIE JOB GRADE IMPROVES SLIGHTLY, RE-ELECTION SUPPORT DOES NOT
 Eagleton Institute of Politics Rutgers, The State University of New Jersey 191 Ryders Lane New Brunswick, New Jersey 08901-8557 www.eagleton.rutgers.edu eagleton@rci.rutgers.edu 732-932-9384 Fax: 732-932-6778
Swing Voters in Swing States Troubled By Iraq, Economy; Unimpressed With Bush and Kerry, Annenberg Data Show
 DATE: June 4, 2004 CONTACT: Adam Clymer at 202-879-6757 or 202 549-7161 (cell) VISIT: www.naes04.org Swing Voters in Swing States Troubled By Iraq, Economy; Unimpressed With Bush and Kerry, Annenberg Data
Release #2475 Release Date: Wednesday, July 2, 2014 WHILE CALIFORNIANS ARE DISSATISFIED
 THE FIELD POLL THE INDEPENDENT AND NON-PARTISAN SURVEY OF PUBLIC OPINION ESTABLISHED IN 1947 AS THE CALIFORNIA POLL BY MERVIN FIELD Field Research Corporation 601 California Street, Suite 210 San Francisco,
The Republican Race: Trump Remains on Top He ll Get Things Done February 12-16, 2016
 CBS NEWS POLL For release: Thursday, February 18, 2016 7:00 AM EST The Republican Race: Trump Remains on Top He ll Get Things Done February 12-16, 2016 Donald Trump (35%) continues to hold a commanding
Executive Summary of Economic Attitudes, Most Important Problems, Ratings of Top Political Figures, and an Early Look at the 2018 Texas Elections
 2017 of Economic Attitudes, Most Important Problems, Ratings of Top Political Figures, and an Early Look at the 2018 Texas Elections Summary of Findings The 2017 continues its long time-series assessing
FOR RELEASE MAY 10, 2018
 FOR RELEASE MAY 10, 2018 FOR MEDIA OR OTHER INQUIRIES: Carroll Doherty, Director of Political Research Jocelyn Kiley, Associate Director, Research Olivia O Hea, Communications Assistant 202.419.4372 RECOMMENDED
Release #2486 Release Date: Friday, September 12, 2014
 THE FIELD POLL THE INDEPENDENT AND NON-PARTISAN SURVEY OF PUBLIC OPINION ESTABLISHED IN 1947 AS THE CALIFORNIA POLL BY MERVIN FIELD Field Research Corporation 601 California Street, Suite 210 San Francisco,
The People, The Press & Politics. Campaign '92: The Bounce Begins
 FOR RELEASE: SATURDAY, JULY 11, 1992, A.M. The People, The Press & Politics Campaign '92: The Bounce Begins Survey IX FOR FURTHER INFORMATION CONTACT: Donald S. Kellermann, Director Andrew Kohut, Director
AARP Pre-First-Debate National Survey Miami, September 30, 2004
 AARP Pre-First-Debate National Survey Miami, September 30, 2004 September 2004 AARP Pre-First-Debate National Survey Miami, September 30, 2004 Report prepared by William E. Wright, Ph.D. and Curt Davies,
FOR RELEASE DECEMBER 14, 2017
 FOR RELEASE DECEMBER 14, 2017 FOR MEDIA OR OTHER INQUIRIES: Carroll Doherty, Director of Political Research Jocelyn Kiley, Associate Director, Research Olivia O Hea, Communications Assistant 202.419.4372
PRESIDENT BUSH GAINS ON TERRORISM, NOT ON IRAQ August 17-21, 2006
 CBS NEWS/NEW YORK TIMES POLL For release August 22, 2006 6:30 P.M. EDT PRESIDENT BUSH GAINS ON TERRORISM, NOT ON IRAQ August 17-21, 2006 Concerns about terrorism have risen, but there has been no change
THE ECONOMY, THE DEFICIT, AND THE PRESIDENT July 24-28, 2009
 CBS NEWS/NEW YORK TIMES POLL For Release: Wednesday, July 29, 2009 6:30 pm (EDT) THE ECONOMY, THE DEFICIT, AND THE PRESIDENT July 24-28, 2009 The economy remains the top concern for Americans, but as the
RECOMMENDED CITATION: Pew Research Center, July, 2016, 2016 Campaign: Strong Interest, Widespread Dissatisfaction
 NUMBERS, FACTS AND TRENDS SHAPING THE WORLD FOR RELEASE JULY 07, 2016 FOR MEDIA OR OTHER INQUIRIES: Carroll Doherty, Director of Political Research Jocelyn Kiley, Associate Director, Research Bridget Johnson,
MEDICAID EXPANSION RECEIVES BROAD SUPPORT CHRISTIE POSITIONED WELL AMONG ELECTORATE IMPROVES UPON FAVORABLES AMONG DEMOCRATS
 For immediate release Tuesday, March 12, 2013 8 pp. Contact: Krista Jenkins Office: 973.443.8390 Cell: 908.328.8967 kjenkins@fdu.edu MEDICAID EXPANSION RECEIVES BROAD SUPPORT CHRISTIE POSITIONED WELL AMONG
Obama and Immigration: What He Did vs. How He Did it
 ABC NEWS/WASHINGTON POST POLL: Immigration EMBARGOED FOR RELEASE AFTER 7 a.m. Wednesday, Dec. 17, 2014 Obama and Immigration: What He Did vs. How He Did it A slim majority of Americans support the immigration
Religion and Politics: The Ambivalent Majority
 THE PEW FORUM ON RELIGION AND PUBLIC LIFE FOR RELEASE: WEDNESDAY, SEPTEMBER 20, 2000, 10:00 A.M. Religion and Politics: The Ambivalent Majority Conducted In Association with: THE PEW FORUM ON RELIGION
CURRENT ISSUES: THE DEBATE OVER SCHIP AND THE WAR IN IRAQ October 12-16, 2007
 CBS NEWS POLL For release: Wednesday, October 17 th, 2007 6:30 P.M. EDT CURRENT ISSUES: THE DEBATE OVER SCHIP AND THE WAR IN IRAQ October 12-16, 2007 As Democratic leaders in Congress attempt to wrangle
CLINTON NARROWLY LEADS TRUMP IN FLORIDA -- GOP THIRD PARTY DEFECTIONS & HISPANIC VOTERS CREATING THE CURRENT GAP
 CLINTON NARROWLY LEADS TRUMP IN FLORIDA -- GOP THIRD PARTY DEFECTIONS & HISPANIC VOTERS CREATING THE CURRENT GAP Democratic front-runner Hillary Clinton currently holds a slight lead over Republican Donald
RECOMMENDED CITATION: Pew Research Center, February, 2015, Democrats Have More Positive Image, But GOP Runs Even or Ahead on Key Issues
 NUMBERS, FACTS AND TRENDS SHAPING THE WORLD FOR RELEASE FEBRUARY 26, 2015 FOR FURTHER INFORMATION ON THIS REPORT: Carroll Doherty, Director of Political Research Jocelyn Kiley, Associate Director, Research
Release #2345 Release Date: Tuesday, July 13, 2010
 THE FIELD POLL THE INDEPENDENT AND NON-PARTISAN SURVEY OF PUBLIC OPINION ESTABLISHED IN 1947 AS THE CALIFORNIA POLL BY MERVIN FIELD Field Research Corporation 601 California Street, Suite 900 San Francisco,
TWELVE DAYS TO GO: BARACK OBAMA MAINTAINS DOUBLE-DIGIT LEAD October 19-22, 2008
 CBS NEWS/NEW YORK TIMES POLL For Release: Thursday, October 23, 2008 6:30pm (ET) TWELVE DAYS TO GO: BARACK OBAMA MAINTAINS DOUBLE-DIGIT LEAD October 19-22, 2008 As Barack Obama opens a large lead in voter
Borders First a Dividing Line in Immigration Debate
 JUNE 23, 2013 More Say Legalization Would Benefit Economy than Cost Jobs Borders First a Dividing Line in Immigration Debate A Pew Research Center/USA TODAY Survey FOR FURTHER INFORMATION CONTACT THE PEW
THE PRESIDENTIAL RACE: MIDSUMMER July 7-14, 2008
 CBS NEWS/NEW YORK TIMES POLL For release: Tuesday July 15, 2008 6:30 P.M. EDT THE PRESIDENTIAL RACE: MIDSUMMER July 7-14, 2008 Democrat Barack Obama now holds a six-point edge over his Republican rival