PPIC STATEWIDE SURVEY
|
|
|
- Shona Leonard
- 5 years ago
- Views:
Transcription

1 PPIC STATEWIDE SURVEY SEPTEMBER 2004 Californians and Their Government Public Policy Institute of California Mark Baldassare Research Director & Survey Director
2 The Public Policy Institute of California (PPIC) is a private operating foundation established in 1994 with an endowment from William R. Hewlett. The Institute is dedicated to improving public policy in California through independent, objective, nonpartisan research. PPIC s research agenda focuses on three program areas: population, economy, and governance and public finance. Studies within these programs are examining the underlying forces shaping California s future, cutting across a wide range of public policy concerns, including education, health care, immigration, income distribution, welfare, urban growth, and state and local finance. PPIC was created because three concerned citizens William R. Hewlett, Roger W. Heyns, and Arjay Miller recognized the need for linking objective research to the realities of California public policy. Their goal was to help the state s leaders better understand the intricacies and implications of contemporary issues and make informed public policy decisions when confronted with challenges in the future. PPIC does not take or support positions on any ballot measure or on any local, state, or federal legislation, nor does it endorse, support, or oppose any political parties or candidates for public office. David W. Lyon is founding President and Chief Executive Officer of PPIC. Cheryl White Mason is Chair of the Board of Directors. 500 Washington Street, Suite 800 San Francisco, California Telephone: (415) Fax: (415) info@ppic.org
3 Preface The PPIC Statewide Survey series provides policymakers, the media, and the general public with objective, advocacy-free information on the perceptions, opinions, and public policy preferences of California residents. Inaugurated in April 1998, the survey series has generated a database that includes the responses of more than 102,000 Californians. The current survey is the eighteenth in our Californians and Their Government series, which is conducted on a periodic basis throughout the state s election cycles. The series is examining the social, economic, and political trends that underlie public policy preferences and ballot choices. The current survey focuses on the November 2 nd statewide election, including the presidential election. It examines voters preferences in the presidential election, the U.S. Senate race, and on three state propositions that will also be on the ballot, as well as Californians attitudes and perceptions toward state policies and national issues. This report presents the responses of 2,003 adult residents throughout the state on a wide range of issues: The November 2 nd statewide election, including preferences in the presidential election, most important issues for the candidates to address in the presidential debates, perceptions of which of the major party candidates will do a better job in handling issues such as the economy, the situation in Iraq, health care, and terrorism and homeland security; the U.S. Senate election, perceptions of the political profile of U.S. Senate candidates, and public support for, and attitudes related to, Proposition 60 (election rights of political parties), Proposition 62 (primaries initiative), and Proposition 72 (health care coverage requirements referendum). State policies, including overall approval ratings of Governor Schwarzenegger and the state legislature, ratings of the governor and legislature in representing the best interests of the people, and satisfaction with legislative term limits; support for legislative reforms such as convening a part-time legislature, election reforms such as campaign finance, and citizens initiative reforms. National policies, including overall approval ratings of President Bush and his handling of jobs and the economy; the public s evaluations of the overall direction of the country and the conditions of the U.S. economy; policy preferences with regard to government regulations and health care as they relate to national attitudes and California trends over time; and attitudes toward the workings of the two-party system and the strengths of the major political parties. The extent to which Californians may differ in their ballot choices for the November election; political and economic attitudes toward the state; and attitudes toward national political issues by party affiliation, demographics, race/ethnicity, and region of residence. This is the 50 th PPIC Statewide Survey, which has included a number of special editions: The Central Valley (11/99, 3/01, 4/02, 4/03, 4/04) Population Growth (5/01) San Diego County (7/02) Land Use (11/01, 11/02) Orange County (9/01, 12/02, 12/03) Environment (6/00, 6/02, 7/03, 7/04) Los Angeles County (3/03, 3/04) State Budget (6/03, 1/04, 5/04) Copies of this report may be ordered by (order@ppic.org) or phone ( ). Copies of this and earlier reports are posted on the publications page of the PPIC web site ( For questions about the survey, please contact survey@ppic.org. - i -
4 - ii -
5 Contents Preface Press Release i v California 2004 Election 1 State Policies 7 National Policies 13 Survey Methodology 19 Survey Questions and Results 21 Survey Advisory Committee 27 - iii -
6
7 Press Release Para ver este comunicado de prensa en español, por favor visite nuestra página de internet: THEY COULD CARE LESS: CALIFORNIANS MORE CONCERNED THAN AMERICANS GENERALLY ABOUT PRESIDENTIAL VOTE See Stark Differences Between Parties, Candidates; Term Limits Still Hot, Proposal for Part-Time Legislature Not SAN FRANCISCO, California, September 23, 2004 California s highly partisan voters can agree on one thing: It really matters who wins the presidential election. Despite finding themselves in the minority in recent national polls, state voters see more at stake in the outcome of the election than do voters nationally, according to a new survey released by the Public Policy Institute of California (PPIC). Seven in 10 Californians (71%) and 80 percent of likely state voters say it really does matter who wins the presidential race when it comes to making progress on the important issues facing the country, compared to 63 percent of Americans who hold this view. Democrats (78%) and Republicans (77%) are equally likely to say the outcome of the election is important, while independents (31%) are slightly more inclined to believe that things will be the same regardless of who is elected. Whites (78%) are far more likely than Latinos (61%) to say it matters who wins on November 2 nd. Widespread concern about the outcome of the election is driving high levels of interest in the campaign: Most voters (89%) say they are following presidential election news closely. Why the strong feelings? California voters see big differences in the platforms of the nation s major political parties: 83 percent believe there are important differences between Democrats and Republicans, including majorities of Democratic (86%), Republican (84%), and independent (77%) likely voters. Overall, voters view Democrats rather than Republicans as more likely to represent the concerns of people like them (58% to 32%) and to bring about the kind of changes the country needs (52% to 37%), while they are divided about which party will do a good job managing the federal government (44% to 43%). Despite the belief that the major parties offer starkly different choices, a significant number of state voters would still like to see the two-party system get an overhaul. While 48 percent of likely voters say the Democratic and Republican parties do an adequate job of representing the American people, an equal number (46%) think they do such a poor job that a third major party is needed. A majority of all independents (62%) believe a third party is required. California s independent voters are clearly looking for a more permanent home, and this should create some trepidation among the Democrats and Republicans who currently bank on their votes, says PPIC Statewide Survey Director Mark Baldassare. But what s most surprising is the substantial numbers of Democrats (43%) and Republicans (37%) who believe a third party is needed. Is it the major parties or just the current crop of candidates that these voters find so lacking? Prefer Kerry on Economy, Bush on Homeland Security Currently, the Democratic ticket of Senators John Kerry and John Edwards holds a 12-point lead over the ticket of Republican President George W. Bush and Vice President Dick Cheney (51% to 39%), down from a 16-point spread in August (54% to 38%). Kerry leads Bush among independent voters (54% to 29%) and Latinos (63% to 30%), while the two are locked in a statistical dead heat among white likely voters (47% to 44%). Evangelical Christians favor Bush over Kerry (60% to 30%), while Kerry leads among likely voters with other religious preferences (59% to 32%). Asked which issue they would most like to hear the candidates address during their debates this fall, likely voters name the economy, jobs, and unemployment (30%), followed by the war in Iraq (19%), - v -
8 Press Release health care (12%), and terrorism and national security (8%). California voters currently prefer Kerry to Bush on jobs and the economy (54% to 37%) and health care (57% to 32%). narrowly support Kerry over Bush on Iraq (48% to 44%) and choose Bush over Kerry on homeland security (48% to 43%). Support for Open Primary; Health Insurance Referendum Lags Despite Health Care Worries Proposition 62 the ballot measure designed to change the state s partisan primary system to an open primary format receives support from 49 percent of likely voters, while 33 percent oppose the initiative. Forty-six percent of voters believe Prop. 62 will result in candidates who more effectively represent their districts than do candidates today, while 31 percent disagree. Also up for a vote in November is Proposition 60, placed on the ballot by the legislature as a counter to the open primary initiative and intended to maintain the current partisan primary system. At present, more voters are undecided about this proposition than support or oppose it (42% undecided, 34% support, 24% oppose). Interestingly, a majority of voters (54%) say that the current system of partisan primaries generally produces candidates who effectively represent their districts. Proposition 72 a referendum on legislation passed last year requiring all large and medium employers in the state to provide health insurance for their employees remains short of the majority needed to approve the law (45% to 34%) and virtually unchanged since August. Most voters (65%) say Governor Arnold Schwarzenegger s opposition to the referendum will not sway their vote either way. Despite the lack of support for Proposition 72, health care remains a very real concern for most Californians. Three in four state residents (77%) and 71 percent of likely voters say they are at least somewhat concerned about being able to afford necessary health care. A slim majority of Californians (53%) say they would be willing to pay more either through higher health insurance premiums or higher taxes to increase the number of Americans who have health insurance. There is also a strong preference for a system of universal, government-administered health care (60%) as opposed to the current system in which most people get their health insurance from private employers (35%). Reform-Minded? Californians Like Some Legislative, Election Reforms but Reject Others Support for Governor Schwarzenegger remains strong, with 61 percent of Californians approving of the way he has handled his job. Ratings for the state legislature are far lower (40% approve, 46% disapprove). One reason for the difference? Nearly half of state residents (46%) say the governor does an excellent or good job working for their best interests, while only 22 percent say the same about the legislature. But despite their hard feelings towards many in government, residents and voters remain choosy and full of surprises when it comes to the types of legislative and election reforms they support: Term Limits: Legislative term limits remain popular, with 61 percent of Californians and 65 percent of likely voters calling them a good thing. However, Californians may be open to some changes: Nearly four in 10 voters (36%) think that expanding the time legislators could serve in office would make them more effective representatives. Twenty-eight percent of voters say such an extension would make legislators less effective and 31 percent see no difference. Part-Time Legislature: A majority of Californians (53%) and likely voters (54%) say it would be a bad idea to change the status of the California Legislature from full-time to part-time. Smaller Legislative Districts: State residents are slightly more likely to believe that having a greater number of state legislators serving smaller districts would not result in better representation for their part of the state (49% to 43%). voters also share this view (52% to 40%). Redistricting: Californians are divided about shifting the power to redraw legislative and congressional district lines from the state legislature to a new independent state commission (39% favor, 40% oppose). are more inclined to support such a proposal (44% favor, 38% oppose). Publicly Financed Campaigns: Majorities of state residents (57%) and likely voters (54%) are unwilling to spend even a few dollars a year to support public funding for state and legislative campaigns. - vi -
9 Press Release Initiative Process: Californians prefer that initiatives on the state ballot (37%) rather than the legislature (31%) or governor (23%) have the greatest influence over public policy in the state. However, strong majorities of state residents (68%) and likely voters (67%) also believe that the process is in need of at least minor changes. More Key Findings Boxer maintains lead in Senate race (page 3) Among likely voters, incumbent Senator Barbara Boxer has an 18-point lead over Republican challenger Bill Jones (54% to 36%). Fifty-nine percent of voters consider Boxer very liberal (30%) or somewhat liberal (29%), while 36 percent call Jones very conservative (11%) or somewhat conservative (25%) and 48 percent say they don t know enough about him to say. Approval ratings for President Bush remain low (page 13) Fifty-four percent of Californians disapprove and 43 percent approve of how President Bush is handling his job overall, similar to his August ratings (56% disapprove, 40% approve). Approval ratings for the president on the issue of jobs and the economy are also low with 56 percent saying they disapprove and are relatively unchanged since one year ago (52% disapprove, 42% approve). Residents don t like nation s direction, but see better economic times ahead (page 14) A majority of Californians (54%) believe the nation is headed in the wrong direction, while 42 percent think it is going in the right direction. However, they are somewhat more optimistic about the nation s economic future: 47 percent of state residents expect good times during the next year and 41 percent anticipate bad times ahead. These general trends have changed little from one year ago. More Californians today say regulation of business is necessary (page 15) More Californians today (54%) than four years ago (46%) say that government regulation of business is necessary to protect the public interest. Forty-two percent think government regulation of business does more harm than good, compared to 49 percent in Slight increase in support for new gun laws (page 15) A majority of residents (52%) believe that better enforcement of existing guns laws rather than new laws or restrictions (39%) is more likely to decrease gun violence. Support for new gun laws is higher among Latinos than whites (53% to 34%). Overall attitudes have changed slightly since 2000, when 56 percent of state residents advocated better enforcement and 34 percent supported new laws. About the Survey The purpose of the PPIC Statewide Survey is to develop an in-depth profile of the social, economic, and political forces affecting California elections and public policy preferences. Findings of this survey are based on a telephone survey of 2,003 California adult residents interviewed between September 12 and September 19, Interviews were conducted in English or Spanish. The sampling error for the total sample is +/- 2%. The sampling error for subgroups is larger. For more information, see page 19. Mark Baldassare is research director at PPIC, where he holds the Arjay and Frances Fearing Miller Chair in Public Policy. He is founder of the PPIC Statewide Survey, which he has directed since His recent book, A California State of Mind: The Conflicted Voter in a Changing World, is available at PPIC is a private, nonprofit organization dedicated to improving public policy through objective, nonpartisan research on the economic, social, and political issues that affect Californians. The institute was established in 1994 with an endowment from William R. Hewlett. PPIC does not take or support positions on any ballot measure or on any local, state, or federal legislation, nor does it endorse, support, or oppose any political parties or candidates for public office. This report will appear on PPIC s website ( on September 23. ### - vii -
10 2004 Presidential Race Top Four Issues for Presidential Debates Percent Kerry/Edwards Bush/Cheney Other Don't know 5 0 Economy Iraq Health Care Terrorism Percent Percent who believe that it really matters who wins the 2004 presidential election All Adults Dem Rep 80 Percent Percent who think that things in the U.S. are generally going in the right direction All Adults Dem Rep Proposition 72: "Health Care Coverage Requirements Referendum" U.S. Senate Race Yes No Don't know Barbara Boxer Bill Jones Other Don't know
11 Presidential Election California 2004 Election While many national polls reported a significant Bush bounce following the Republican National Convention in early September, the Democratic ticket of John Kerry and John Edwards continues to hold a double-digit lead over the Republican ticket of George W. Bush and Dick Cheney in California. Kerry led Bush by an 11-point margin in July (49% to 38%), a 16-point margin in August (54% to 38%), and Kerry now leads by a 12-point margin in September (51% to 39%). Only 7 percent of likely voters are undecided about their choice on November 2 nd (the percentage of undecided voters has remained virtually unchanged over the past three months). Kerry draws support from eight in 10 Democrats, and Bush has the support of eight in 10 Republicans; however, Kerry leads Bush by a large margin among independent voters (54% to 29%). Kerry has strong support in the San Francisco Bay Area and Los Angeles, while Bush leads in the Central Valley and Other Southern California by somewhat narrower margins. Kerry s lead over Bush is large among Latino likely voters (63% to 30%), while the two tickets are in a statistical dead heat among white likely voters (47% Kerry, 44% Bush). Kerry has a larger lead among women (55% to 36%) than among men (48% to 42%). Evangelical Christians favor Bush over Kerry (60% to 30%), while Kerry leads among likely voters with other religious preferences (59% to 32%). If the November 2 nd presidential election were being held today, would you vote for Results among likely voters July 2004 August 2004 September 2004 John Kerry and John Edwards 49% 54% 51% George W. Bush and Dick Cheney Other answer (specify) Don't know Results among likely voters Kerry / Edwards Bush / Cheney Other answer Don't know All 51% 39% 3% 7% Party registration Democrat Republican Independent Central Valley Region Race/Ethnicity Gender Religion SF Bay Area Los Angeles Other Southern California Whites Latinos Male Female Evangelical Christian Other
12 California 2004 Election Ranking of Candidates on Issues Bush and Kerry plan to face off in a series of presidential debates in September and October. What would California s likely voters like to hear the candidates talk about during these televised encounters? The top four issues are the economy and jobs (30%), the war in Iraq (19%), health care (12%), and terrorism and security issues (8%). Across the political spectrum, the number one issue is the economy and jobs (36% Democrats; 25% Republicans; 31% independents). The issues of Iraq, health care, and terrorism and security are found in the top tier of issues in all voter groups. Which of the candidates would do a better job on each of these four issues? California voters favor Kerry over Bush on jobs and the economy (54% to 37%) and health care (57% to 32%). More than eight in 10 Democrats support their party s candidate on these domestic issues, and independent voters also pick Kerry over Bush on jobs and the economy (55% to 34%) and health care (60% to 28%). Republican likely voters lend higher levels of support to their party s candidate on jobs and the economy (74%) than on health care (64%). voters are more divided when asked who would do a better job on the situation in Iraq and on terrorism and security. narrowly support Kerry over Bush on Iraq (48% to 44%) and favor Bush over Kerry on terrorism and security issues (48% to 43%). Republicans show overwhelming support for the president on the situation in Iraq (81%) and terrorism and security (84%). Independents lean toward Kerry over Bush on the handling of Iraq (49% to 38%) and are evenly split between Bush and Kerry when it comes to terrorism and security issues (44% Bush, 43% Kerry). Large majorities of Democrats favor Kerry when it comes to handling the situation in Iraq (75%) and terrorism and homeland security (69%). Regardless of your choice for president, which of these candidates would do the better job on each of these issues George W. Bush or John Kerry? Results among likely voters Democrat Republican Independent Bush 44% 17% 81% 38% The situation in Iraq Kerry Other answer Don't know Bush Health care Kerry Other answer Don't know Bush Jobs and the economy Kerry Other answer Don't know Bush Terrorism and homeland security Kerry Other answer Don't know
13 U.S. Senate Election California 2004 Election In November s U.S. Senate election, Democratic incumbent Barbara Boxer has an 18-point lead over Republican challenger Bill Jones among likely voters (54% to 36%), while 9 percent of likely voters remain undecided. There has been little change in the level of support for each of the candidates or the percentage of undecided voters. Boxer and Jones enjoy solid support within their political parties, while independents lean toward Boxer (54% to 29%). Boxer is strongly favored in the San Francisco Bay Area and Los Angeles, while Jones registers his highest levels of support in the Central Valley and Other Southern California. Boxer has a wider advantage over Jones among women (58% to 30%) than men (49% to 42%) and among Latinos (68% to 24%) than whites (49% to 40%). Evangelical Christians prefer Jones to Boxer by a wide margin (52% to 33%), while voters of other religious orientations strongly prefer Boxer (61% to 30%). Asked to define the candidates politics, 59 percent of California likely voters perceived Boxer as liberal, 19 percent as middle-of-the-road, and 5 percent as conservative (17 percent indicated that they did not know enough to say). In comparison, 36 percent of likely voters viewed Jones as conservative, 13 percent as middle-of-the-road, and 3 percent as liberal; a plurality (48%) said they did not know enough about Jones to identify his political bent. Thirty-five percent of likely voters define their own politics as liberal, 29 percent as middle-of-the-road, and 36 percent as conservative. If the 2004 U.S. Senate election were being held today, would you vote for Results among likely voters July 2004 August 2004 September 2004 Barbara Boxer, the Democrat 52% 53% 54% Bill Jones, the Republican Other answer Don't know Results among likely voters Barbara Boxer, the Democrat Bill Jones, the Republican Other answer Don't know All 54% 36% 1% 9% Party registration Democrat Republican Independent Central Valley Region Race/Ethnicity Gender Religion SF Bay Area Los Angeles Other Southern California Whites Latinos Male Female Evangelical Christian Other September 2004
14 California 2004 Election State Proposition 60 Proposition 60 is the Election Rights of Political Parties Legislative Constitutional Amendment. It was placed on the November ballot by the state legislature as a competing measure to Proposition 62, a citizens initiative that would change the state s primary election process from a closed, partisan system to an open, nonpartisan system. Proposition 60 would mirror the current system, in which the top primary vote-getter from each party is ensured a place on the general election ballot. If voters approve both Propositions 60 and 62, the one that receives the most votes will become law. When read the official ballot title and summary for Proposition 60, a large proportion of likely voters (42%) say they do not know how they would vote if the election were held today. At this stage in the campaign, 34 percent say they would vote yes and 24 percent say they would vote no. Support for Proposition 60 is well below 50 percent among Democrat, Republican, and independent likely voters, and it likewise falls far short of majority support in all regions of the state. Although support for Proposition 60 is higher among Latino likely voters than among whites (46% to 31%), support for the proposition comes in well below 50 percent among both men and women and across age, education, and income groups. Proposition 60 on the November ballot is the Election Rights of Political Parties Legislative Constitutional Amendment.... If the election were held today, would you vote yes or no on Proposition 60? Results among likely voters Dem Rep Ind Central Valley SF Bay Area Region Los Angeles Other Southern California Latinos Yes 34% 35% 29% 41% 27% 31% 39% 35% 46% No Don't know One of the factors that may help voters make up their minds on Propositions 60 and 62 is their perception of the current primary system. A majority of voters (54%) say that the state s partisan primaries generally produce candidates who effectively represent their districts, while 34 percent say that they are not effectively represented under the current system and 12 percent are undecided. Majorities of Democrats (57%), Republicans (55%), and whites (53%) and Latinos (61%) say that the current partisan system produces effective representatives for their districts. While independent voters are more evenly divided in their perceptions of the partisan primaries, a bare majority of them say that the current system produces effective representatives (50% to 39%). There are no significant differences across age and income groups. Overall, there does not seem to be widespread dissatisfaction with the partisan primary system at this stage of the election cycle. Do you think California's current system of partisan primaries generally produces candidates who effectively represent their districts? Yes, produces effective representatives No, does not produce effective representatives 54% 34 Don't know 12 For complete question wording, see Question 13 in the Survey Questionnaire, page
15 State Proposition 62 California 2004 Election Proposition 62 on the November ballot is the Elections, Primaries Initiative Constitutional Amendment and Statute. This open primary reform, which qualified as a citizens initiative, would change the current closed, partisan primary system it would require primary elections in which voters may vote for any state or federal candidate regardless of the voter s or candidate s party registration. The two primary election candidates receiving the most votes for an office whether they are candidates with no party affiliation or members of the same or of different parties would be listed on the general election ballot. As previously noted, the legislature placed Proposition 60 on the ballot to counter this effort. Should both Proposition 60 and 62 pass by majority vote, the ballot measure that receives more votes would become state law. When voters are read the official ballot label and summary of this initiative, 49 percent of likely voters say they would vote yes and 33 percent say they would vote no; only 18 percent are undecided. Thus, compared to the response to Proposition 60, Proposition 62 has more supporters, more opponents, and fewer undecided voters. Currently, there are higher levels of support for Proposition 62 among Democrats (49% to 32%) and independents (58% to 29%) than among Republicans (46% to 36%). Support for Proposition 62 declines with age; however, support is similar across income groups. Proposition 62 on the November ballot is the Elections, Primaries Initiative Constitutional Amendment.... If the election were held today, would you vote yes or no on Proposition 62? Results among likely voters Dem Rep Ind Central Valley SF Bay Area Region Los Angeles Other Southern California Latinos Yes 49% 49% 46% 58% 50% 50% 46% 53% 53% No Don't know Do voters think that Proposition 62 would make a positive difference in the primary election process? Residents throughout the state were asked if the passage of Proposition 62 would result in candidates who would more effectively represent their districts than candidates do today. While 46 percent of likely voters said that the proposition would offer them candidates more effective in their representation, 31 percent believed that the measure would not lead to better representation, and 23 percent were unsure. The belief that Proposition 62 would improve representation declines somewhat with age and household income. Latino likely voters (58%) are more likely than white likely voters (43%) to believe that Proposition 62 would lead to more effective representation. If Proposition 62 passes, do you think California would generally have candidates who more effectively represent their districts than candidates today? Yes 46% No 31 Don't know 23 For complete question wording, see Question 15 in the Survey Questionnaire, page September 2004
16 California 2004 Election State Proposition 72 The percentage of Californians who support Proposition 72 a referendum on legislation passed last year requiring all large and medium employers in the state to provide health insurance for their employees remains below the 50 percent majority needed to approve the measure. We have seen no change in support or opposition to Proposition 72 among likely voters since the August Statewide Survey. Forty-five percent of likely voters plan to vote yes on the measure, while 34 percent are opposed and 21 percent remain undecided. Among likely voters, a majority of Democrats (55%) and about half of independents (49%) favor the proposition, while a plurality of Republicans oppose it (48%). A majority in the San Francisco Bay Area (51%) support the measure, but support falls below 50 percent in the rest of the state. Support is higher among Latino likely voters than among white likely voters (53% to 42%). Support declines with age and household income but is not strongly related to either gender or education at this stage of the campaign. Immediately before this survey began, Governor Arnold Schwarzenegger announced that he planned to oppose Proposition 72 and endorse a no vote on the measure. Does the governor s stand on this referendum affect voter choices? Sixty-five percent of likely voters say that the governor s opposition to Proposition 72 will not affect their vote, while 14 percent say that it will make them more likely to oppose the measure and 16 percent say that it will make them more likely to support it. One in four Republicans say that the governor s stand on the issue makes them more likely to oppose it, while one in five Democrats say that if the governor is endorsing a no vote, they are more likely to favor the measure. Seventy-three percent of independent likely voters say that the governor s opposition to this referendum makes no difference to them, while 10 percent say that it will make them more likely to oppose the measure and 13 percent say that it will incline them to support it. Proposition 72 on the November ballot is the Health Care Coverage Requirements Referendum.... If the election were held today, would you vote yes or no on Proposition 72? Results among likely voters August 2004 September 2004 Yes 45% 45% No Don't know Results among likely voters Dem Rep Ind Central Valley SF Bay Area Region Los Angeles Other Southern California Latinos Yes 45% 55% 29% 49% 43% 51% 48% 39% 53% No Don't know For complete question wording, see Question 17 in the Survey Questionnaire, page
17 Governor s Approval Ratings State Policies Roughly six in 10 California adults (61%) and likely voters (64%) approve of the job Arnold Schwarzenegger is doing as governor of California. Schwarzenegger s approval ratings have been in this range throughout his first year in office and both before and after his appearance at the Republican National Convention in early September. The governor continues to have the overwhelming support of Republicans (88%) and a majority of independents (63%). Democrats are more evenly divided (47% approve; 44% disapprove). Nearly seven in 10 residents in the Central Valley (66%) and Other Southern California (69%) regions approve of the governor, as do more narrow majorities of residents in Los Angeles (54%) and the San Francisco Bay Area (52%). Although 71 percent of whites approve of Schwarzenegger s job performance, 51 percent of Latinos disapprove (42% approve). Overall, do you approve or disapprove of the way that Arnold Schwarzenegger is handling his job as governor of California? All Adults Dem Rep Ind Central Valley SF Bay Area Region Los Angeles Other Southern California Approve 61% 47% 88% 63% 66% 52% 54% 69% 64% Disapprove Don't know Beyond overall job performance, how does the public rate Governor Schwarzenegger when it comes to working for their best interests? About half of all California adults (46%) and likely voters (48%) rate the governor as excellent or good on this dimension. Three in 10 residents think the governor is doing a fair job in this regard, and two in 10 think he is doing a poor job. Again, there is a large partisan divide: Seventy-three percent of Republicans think Schwarzenegger is doing an excellent or good job working for their interests, compared to only 45 percent of independents and 29 percent of Democrats. While 56 percent of whites give the governor excellent or good ratings, only 27 percent of Latinos rate Schwarzenegger that highly when it comes to working for their best interests. How would you rate Governor Schwarzenegger when it comes to working for the best interests of people like you? Region All Adults Dem Rep Ind Central Valley SF Bay Area Los Angeles Other Southern California Excellent 13% 4% 27% 9% 14% 8% 9% 18% 15% Good Fair Poor Don't know
18 State Policies Approval Ratings for State Legislators The legislature gets much lower ratings than the governor: Forty percent of Californians approve and 46 percent disapprove of the way the state legislature is handling its job. Among the state s likely voters, 37 percent approve and 51 percent disapprove. Although Democrats control the legislature, there is virtually no partisan difference in ratings: Similar percentages of Democrats (41%), Republicans (38%), and independents (39%) approve of the job the legislature is doing. Approval also differs very little among liberals (43%), moderates (42%), and conservatives (37%). Forty-five percent of Latinos and 38 percent of whites give the legislature high marks. Nearly half of California adults ages 18 to 34 (47%) approve of the legislature, compared to only 32 percent of those age 55 and older. Californians overall approval of the state legislature has remained largely unchanged during 2004, but it is significantly higher today than it was leading up to last year s recall election (28% in August 2003). Overall, do you approve or disapprove of the way that the California legislature is handling its job? All Adults Dem Rep Ind Approve 40% 41% 38% 39% 37% Disapprove Don't know How does the public rate the state legislature when it comes to working for their best interests? Californians give the legislature considerably lower marks than they give the governor. Twenty-two percent of Californians think that the legislature as a whole is doing an excellent (3%) or good (19%) job working for the best interests of people like themselves. Democrats (24%), Republicans (20%), and independents (20%) all give the legislature lower ratings than they give the governor for doing an excellent or good job on this dimension. Californians who describe themselves as liberal (23%), moderate (23%), and conservative (22%) are all about as likely to rate the state legislature as excellent or good in terms of working for the best interests of people like themselves. Latinos are somewhat more likely than whites to say that the legislature deserves excellent or good ratings in this domain (27% to 21%). How would you rate the California legislature when it comes to working for the best interests of people like you? All Adults Dem Rep Ind Excellent 3% 3% 2% 2% 1% Good Fair Poor Don't know
19 Legislative Term Limits State Policies Legislative term limits, enacted by a citizens initiative in 1990, remain popular. Sixty-one percent of Californians think that legislative term limits are a good thing; only 17 percent think they are bad, and 18 percent think they don t make a difference. Republicans (75%) are more likely than Democrats (57%) and independents (59%) to say that legislative term limits are a good thing, but majorities of Californians of all political affiliations are positive about these limits. In October 1998, two years after the first state legislators were termed out of office, 68 percent of likely voters thought that term limits were a good thing for the state. In December 2001, reflecting general pro-government attitudes following the September 11 th terrorist attacks, support for term limits dropped to 49 percent. Today, as 26 state legislators conclude their terms at the end of the year, approval of term limits among likely voters has risen to 65 percent. The California legislature has operated under term limits since 1990, meaning that members of the state senate and state assembly are limited in the number of terms they can hold their elected office. Do you think that term limits are a good thing or a bad thing for California, or do they make no difference? All Adults Dem Rep Ind Good thing 61% 57% 75% 59% 65% Bad thing No difference Don't know Given the popularity of term limits, do Californians think there would be any virtue in allowing legislators to serve up to four years beyond the current term limits (three two-year terms for the state assembly and two four-year terms for the state senate). Nearly four in 10 adult residents (35%) and likely voters (36%) think more time would make legislators more effective representatives. However, 25 percent of Californians think it would make legislators less effective, and one-third say it would make no difference in how well their areas are represented in the legislature. Democrats (41%) are somewhat more likely than independents (34%) and Republicans (29%) to think that extended terms would make legislators more effective representatives. Across the ideological spectrum, 44 percent of liberals, 33 percent of moderates, and 29 percent of conservatives say their areas would be more effectively represented if their state legislators could serve up to four additional years beyond the current limits. What if your state legislators were allowed to serve up to four years beyond the current term limits of three two-year terms in the state assembly and two four-year terms in the state senate? Do you think they would be more effective or less effective in representing your area, or would there be no difference? All Adults Dem Rep Ind More effective 35% 41% 29% 34% 36% Less effective No difference Don't know September 2004
20 State Policies Legislative Reforms One of the initiatives in preparation for statewide circulation is a measure to shift the California legislature from full-time to part-time status. A majority of Californians (53%) say this would be a bad thing, about one in four (22%) say it would be a good thing, and about one in six (17%) say it would make no difference. Democrats (63%) are more likely than Republicans (47%) and independents (47%) to say this change would be bad. Solid majorities in the San Francisco Bay Area (57%) and Other Southern California (54%) regions, and about half of the residents in Los Angeles (51%) and the Central Valley (49%), believe that changing the legislature to part-time status would be a bad thing. Across the state s demographic and racial/ethnic groups, majorities share a negative opinion about this legislative reform proposal. The belief that having the legislature work part-time is a bad thing increases with education and income. Fifty-nine percent of those who approve of the way the legislature is handling its job say that changing the legislature s status to part-time would be a bad thing, as do 47 percent of those who disapprove of the legislature s job performance. There is a proposal to change the California legislature from full-time to part-time status. Do you think that having a part-time legislature would be a good thing or a bad thing for California, or would it make no difference? All Adults Dem Rep Ind Good thing 22% 14% 30% 27% 24% Bad thing No difference Don't know Does a state of nearly 36 million people, with 40 state senators and 80 members of the state assembly, need more districts? Californians are divided when asked if having more representatives serving smaller districts would result in better representation for their areas. Forty-three percent of Californians think a larger legislature would better represent their areas, while 49 percent say that it would not make a difference. Democrats (45%) are more likely than Republicans (37%) and independents (39%) to say this change would make their areas better represented in Sacramento. Whites are more likely than Latinos to say more representatives would be inconsequential (53% to 38%), and the belief that it would not matter increases with age, education, and income. Those who approve and those who disapprove of the way the legislature is handling its job today are nearly equally likely to say that more representatives serving smaller districts would make no difference. Currently, 40 state senators and 80 assembly members represent the people of California in the state legislature. Overall, do you think people in your area would be better represented in the state legislature if there were more representatives serving smaller districts, or would it not make a difference? All Adults Dem Rep Ind Area would be better represented 43% 45% 37% 39% 40% Would not make a difference Other (specify) Don't know
21 Electoral Reforms State Policies There have been proposals to change the way that legislative districts are drawn, largely in response to concerns that the involvement of the state s elected officials makes the redistricting process too political. Californians are closely divided on the issue of taking the power to redraw districts away from the state legislature and transferring it to a new, independent state commission. Thirty-nine percent of California residents favor the proposal, 40 percent oppose it, and one in five residents are undecided. voters support the idea of creating an independent commission to redraw district lines by a slight margin (44% favor, 38% oppose). Whites are more likely than Latinos to support the change (41% to 36%). Across demographic groups, support increases with education and household income; there are no significant differences by age. evaluations of the legislature play a role in support for this election reform. Among those who disapprove of the legislature s overall performance at this time, 44 percent favor the idea of shifting the responsibility of drawing district lines to an independent commission; among those who approve of the legislature s performance, support drops to 37 percent. Would you favor or oppose taking the power to redraw legislative and congressional district lines from the state legislature and shifting this responsibility to a new, independent state commission? All Adults Dem Rep Ind Favor 39% 41% 38% 48% 44% Oppose Don't know Californians often complain about the effects of political fundraising on candidates and elected officeholders, but are they willing to pay for publicly financed campaigns? Many state residents are not willing to spend even a few dollars a year for publicly funded state and legislative campaigns (57% opposed, 35% in favor). The response was similarly negative when we first asked this question in August 2000 (57% opposed, 38% in favor). In the wake of the November 2002 gubernatorial election, the response to public financing was more positive (50% in favor, 46% opposed). However, a year ago, prior to the recall election, a majority of Californians once again opposed this idea (53% opposed, 41% in favor). Today, Democrats (45%) are much more supportive than Republicans (24%) of public financing for political campaigns. Overall, majorities across racial/ethnic groups and demographic groups oppose having this type of system. Across regions, opposition is stronger in Other Southern California (64%) than in the Central Valley (56%), Los Angeles (55%), and the San Francisco Bay Area (47%). Generally speaking, would you favor or oppose having a system of public funding for state and legislative campaigns in California if it cost taxpayers a few dollars a year to run? All Adults Dem Rep Ind Favor 35% 45% 24% 38% 39% Oppose Don't know September 2004
22 State Policies Initiative Reforms Who or what would Californians prefer to have the most influence over state public policy? Their first preference is initiatives on the state ballot (37%). Then, despite the governor s much higher approval ratings, three in 10 (31%) name the legislature, and one in four (23%) name the governor. Preferences are similar among likely voters (38% for initiatives; 35% for the legislature; 20% for the governor). The responses were similar among all adults in a December 1999 survey (42% initiatives; 30% legislature; 21% governor). Today, Democratic and independent voters are about equally likely to prefer that the legislature and initiatives on the state ballot have the most influence over public policy, while Republicans much prefer initiatives (38%) over the legislature (22%). In the San Francisco Bay Area, a plurality of residents (41%) would prefer the legislature to have the most influence over public policy, compared to pluralities of residents elsewhere in the state who would prefer initiatives on the ballot to have the most influence over public policy. Latinos and whites are equally likely to say they prefer initiatives (both 37%). In California state government today, which of the following would you prefer to have the most influence over public policy? All Adults Dem Rep Ind Initiatives on the state ballot 37% 36% 38% 36% 38% The legislature The governor Other answer Don't know Although Californians express a preference for ballot box policymaking, nearly seven in 10 residents say that changes are needed in the California initiative process, and only one in five considers the current system just fine the way it is. Thirty-five percent would like to see major changes, and 33 percent believe only minor changes are needed. Democrats (75%) and independents (68%) are more likely than Republicans (62%), and Latinos (76%) are more likely than whites (64%), to say the initiative process is in need of change. Even among those who believe initiatives should have the most influence on public policy, two-thirds think the process needs major or minor changes. In October 2000, a similar 32 percent of Californians said that major changes were needed, while 43 percent called for minor changes in the initiative process. Do you think the citizens' initiative process in California is in need of major changes or minor changes or that it is basically fine the way it is at this time? All Adults Dem Rep Ind Major changes 35% 38% 28% 36% 33% Minor changes Fine the way it is Don't know
23 President s Ratings National Policies In California, President Bush s overall job approval ratings have changed very little since the GOP convention. Today, 43 percent of all California adults approve of the way Bush is handling his job as president, while 54 percent disapprove. In the August Statewide Survey, 40 percent approved and 56 percent disapproved. Today s ratings represent a considerable drop from the September 2003 survey, in which 51 percent approved of Bush s performance, and an even greater decline since the September 2002 survey, when 64 percent approved of the way he was handling his job. In a recent CBS News/New York Times poll, 50 percent of all Americans approved of the president s job performance and 42 percent disapproved. The partisan divide is dramatic: Eighty percent of Republicans approve and 80 percent of Democrats disapprove of Bush s performance. However, he has gained some ground among independent voters. In the August survey, only 30 percent of independents approved of his performance. Today, 40 percent approve, but 58 percent disapprove. voters views are similar to those of all adults (43% approve; 55% disapprove). Regionally, the president draws much higher approval ratings in the Central Valley (54%) and Other Southern California (57%) than in the San Francisco Bay Area (27%) or Los Angeles (34%). Whites (48%) are more likely than Latinos (40%) to approve of Bush s job performance. Overall, do you approve or disapprove of the way that George W. Bush is handling his job as president of the United States? Region All Adults Dem Rep Ind Central Valley SF Bay Area Los Angeles Other Southern California Approve 43% 18% 80% 40% 54% 27% 34% 57% 43% Disapprove Don't know How do Californians rate the president on the number-one campaign issue jobs and the economy? About the same as his overall job performance 56 percent of all adults and 58 percent of likely voters disapprove of his record on the economy. Regionally, disapproval is highest in the San Francisco Bay Area (73%) and Los Angeles (64%), but significant percentages in the Central Valley (47%) and Other Southern California (44%) also disapprove. About half of Latinos (56%) and whites (53%) disapprove of the president s performance on economic issues. Economic performance ratings were similar in the September 2003 survey, when 52 percent disapproved and 42 percent approved of Bush s handling of the economy. Overall, do you approve or disapprove of the way that President Bush is handling the issue of jobs and the economy? Region All Adults Dem Rep Ind Central Valley SF Bay Area Los Angeles Other Southern California Approve 39% 16% 71% 37% 47% 23% 31% 53% 39% Disapprove Don't know
24 National Policies Overall Direction As the November presidential election draws near, more Californians (54%) believe that, in general, the nation is headed in the wrong direction than in the right direction (42%). voters have similar views (56% wrong direction, 41% right direction). For all Californians, the outlook is about the same as in September 2003 (42% right direction, 51% wrong direction). Again, there is a sharp partisan divide: Seventy-four percent of Republicans say the country is headed in the right direction, and 77 percent of Democrats say it is headed in the wrong direction. Independents lean toward a negative assessment (57% wrong direction, 39% right direction). There is also a regional divide: A majority of residents in the San Francisco Bay Area and Los Angeles think things are going in the wrong direction; a majority in the Central Valley and Other Southern California think they are going in the right direction. Californians are more positive about the state of the state (47% right direction, 40% wrong direction) than about the state of the nation (54% wrong direction, 42% right direction). Do you think that things in the United States are generally going in the right direction or the wrong direction? Region All Adults Dem Rep Ind Central Valley SF Bay Area Los Angeles Other Southern California Right direction 42% 20% 74% 39% 52% 28% 33% 53% 41% Wrong direction Don't know When asked about the nation s economic future, Californians are somewhat more optimistic: Fortyseven percent expect good fiscal times in the next year; 41 percent see bad times ahead. Expectations are almost unchanged from the September 2003 survey, when 47 percent anticipated good economic times and 42 percent thought that the economy would not do well. Along partisan lines, a majority of Republicans (73%) and a near majority of independents (47%) think that good times lie ahead. In contrast, a majority of Democrats (55%) see bad economic times coming in the next year. San Francisco Bay Area residents have the most negative economic outlook across the state s regions. Californians have similar expectations for the national (47% good times, 41% bad times) and the state economies (46% good times, 40% bad times). Turning to economic conditions, do you think that during the next 12 months the United States will have good times financially or bad times? Region All Adults Dem Rep Ind Central Valley SF Bay Area Los Angeles Other Southern California Good times 47% 31% 73% 47% 51% 35% 41% 59% 47% Bad times Don't know
25 Government Regulations National Policies Over the last four years, Californians have become more convinced of the need for government regulation of business. Today, they are more likely to say that government is necessary to protect the public interest (54%) than that government regulation of business does more harm than good (42%). In the February 2000 survey, during the 2000 presidential campaign, state residents were somewhat more likely to think that regulations do more harm than good (49%) and less likely to say government regulation is necessary (46%). Although still large, the partisan gap in attitudes toward regulating business is actually slightly smaller now than in Today, there is a 19-point gap: Sixty-one percent of Democrats believe government regulation is necessary to protect the public interest, compared to 42 percent of Republicans. In 2000, there was a 25-point gap between Democrats and Republicans on the necessity of government regulations (56% to 31%). In 2000, 47 percent of independents thought government regulation of business was necessary to protect the public interest; today, six in 10 independents feel this way. Which statement comes closest to your views: February 2000 September 2004 Government regulation of business is necessary to protect the public interest Government regulation of business does more harm than good 46% 54% Don't know 5 4 All Adults Dem Rep Ind Government regulation of business is necessary to protect the public interest Government regulation of business does more harm than good 54% 61% 42% 59% 54% Don't know In the matter of government regulations on guns, there has been a slight change in attitudes over the last four years in the direction of support for passing more laws. When it comes to decreasing gun violence, 52 percent of residents now say that better enforcement of existing gun laws is the answer; 39 percent opt for passing more laws and restrictions on obtaining new guns. In the September 2000 survey, just before the presidential election, 56 percent were for better enforcement, 34 percent for more laws. Democrats are more supportive of new gun laws than Republicans. On this issue, the partisan divide has narrowed somewhat 15 points today (44% Democrats, 29% Republicans) compared to 20 points in 2000 (41% Democrats, 21% Republicans). There has been no change in opinion across other voter groups. Support for new gun laws is higher among Latinos than whites (53% to 34%) September 2004
26 National Policies Health Care Health care was identified in the August Statewide Survey as one of the top issues of the 2004 presidential campaign, and the current survey indicates that health care is one of the top four issues voters want to hear the candidates talk about during the presidential debates. National polls have also placed health care on the list of top concerns. Why is health care such a major issue this year? Half of California adults (57%) and likely voters (49%) say that they are very concerned about affording necessary health care when a family member gets sick. However, there are partisan and racial/ethnic differences: Democrats are more likely than Republicans (65% to 39%) and Latinos are more likely than whites (73% to 46%) to say they are very concerned about health care affordability. Concern is also high among lower income, less educated, and foreign-born residents. What type of health insurance system is preferred? Six in 10 Californians say they favor a universal health insurance program in which everyone is covered under a program like Medicare that s run by the government and financed by taxpayers rather than the current health insurance system in the United States. Republicans prefer the current health insurance system, while Democrats and independents would rather have a universal health insurance program. A national survey by ABC News/Washington Post in 2003 found similar results (62% universal health insurance, 32% current health insurance system). Which would you prefer: the current health insurance system in the United States, in which most people get their health insurance from private employers but some people have no insurance, or a universal health insurance program, in which everyone is covered under a program like Medicare that s run by the government and financed by taxpayers? All Adults Dem Rep Ind Universal health insurance system 60% 72% 37% 59% 54% Current system Don't know Would Californians be willing to pay more either in higher taxes or health insurance premiums to increase the number of Americans who have health insurance? Fifty-three percent say yes; 42 percent say no. On this question, the California results are similar to the results of a national survey by the Kaiser Family Foundation in February 2003 (52% willing to pay, 42% not willing to pay). Willingness to pay more varies by partisanship (65% Democrats, 60% independents, 39% Republicans) and race/ethnicity (56% white, 47% Latino). It declines with age and citizenship status and increases with higher education and higher income levels. Would you be willing to pay more either in higher health insurance premiums or higher taxes in order to increase the number of Americans who have health insurance, or not? All Adults Dem Rep Ind Yes, willing to pay more 53% 65% 39% 60% 55% No, not willing to pay more Don't know
27 Measures of Political Intensity National Policies Californians continue to be highly engaged in the 2004 presidential election: Seventy-six percent of all adults and 89 percent of likely voters are either very closely or fairly closely following the news about the candidates. Democrats (45%) and Republicans (44%) are equally likely to say they are following the very news closely. About half of college graduates, residents with incomes of $80,000 or more, residents age 55 and older, and whites are very closely following news about candidates. Californians are more likely than Americans generally to believe it really matters who wins the 2004 presidential election. In this survey, 71 percent of Californians express that belief, while 26 percent believe that things will be pretty much the same no matter who wins. In a Pew Research Center survey in July 2004, 63 percent of Americans said it really matters who wins, while 32 percent said that things will pretty much be the same whatever the outcome. Eight in 10 likely voters stress the importance of who wins for making progress on important issues, and Democrats and Republicans are about equally likely to hold this view. Although independents are more likely to say that things will be the same despite the outcome, a large majority (65%) believe that it matters who wins. Whites (78%) are more likely than Latinos (61%) to say the outcome matters. As far as making progress on the important issues facing the country is concerned, does it really matter who wins the 2004 presidential election, or will things pretty much be the same regardless of who is elected president? All Adults Dem Rep Ind Really matters who win 71% 78% 77% 65% 80% Things will be the same regardless Other answer Don't know A similar 75 percent of Californians believe there are important differences in what the Republicans and Democrats stand for, while only 21 percent believe there are no important differences. Even independent voters are much more likely than not to believe there are important differences between the major parties (66% to 29%). More than eight in 10 likely voters, Democrats, and Republicans believe there are big distinctions between the major political parties. The perception of major differences between the parties is nearly identical among evangelical Christians and others (76% to 75%). Do you think there are any important differences in what the Republicans and Democrats stand for? All Adults Dem Rep Ind Yes, important differences No, no important differences 75% 82% 80% 66% 83% Don't know September 2004
28 National Policies Perceptions of Major Political Parties Given that Californians think there are important differences between the Democrats and Republicans, which party do they think is more effective? Californians choose Democrats over Republicans when it comes to bringing about changes the country needs (51% to 36%) and being concerned with the needs of people like themselves (57% to 30%). In these areas, independents give Democrats higher points. When asked who can best manage the federal government, Californians are divided (42% Republicans, 42% Democrats). In this case, independents give Republicans the nod (44% to 36%). Which party do you think is better described by the phrase... All Adults Dem Rep Ind Republican Party 36% 11% 74% 32% 37% Can bring about the kind of changes the country needs Democratic Party Both equally Neither Don't know Republican Party Is concerned with the needs of people like me Democratic Party Both equally Neither Don't know Republican Party Able to manage the federal government well Democratic Party Both equally Neither Don't know Do the two major political parties do an adequate job of representing the American people or is a third party needed? Californians are evenly divided (48% adequate job, 46% third party needed). Republicans are the most likely to say that the major parties are doing an adequate job, Democrats give a mixed assessment, and most independents think that a third party is needed. A national Gallup Poll in 2003 found a much more positive view of the major parties among all Americans (56% adequate job, 40% third party needed). In your view, do the Republican and Democratic parties do an adequate job representing the American people, or do they do such a poor job that a third major party is needed? All Adults Dem Rep Ind Adequate job 48% 51% 58% 34% 48% Third party is needed Don't know
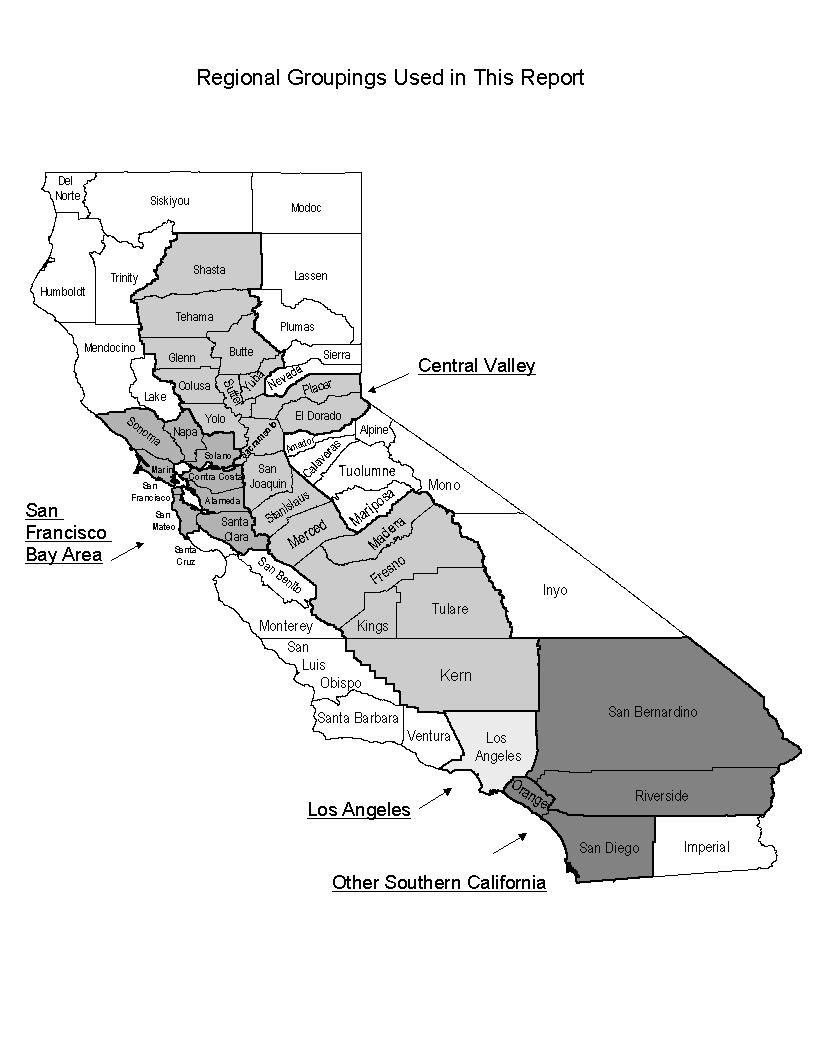
29 Survey Methodology The PPIC Statewide Survey is directed by Mark Baldassare, research director at the Public Policy Institute of California, with assistance in research and writing from Jon Cohen, associate survey director; Renatta DeFever and Kristy Michaud, survey research associates; and Kimberly Curry, survey intern. The findings of this survey are based on a telephone survey of 2,003 California adult residents interviewed between September 12 and September 19, Interviewing took place on weekday nights and weekend days, using a computer-generated random sample of telephone numbers that ensured that both listed and unlisted telephone numbers were called. All telephone exchanges in California were eligible for calling. Telephone numbers in the survey sample were called up to ten times to increase the likelihood of reaching eligible households. Once a household was reached, an adult respondent (age 18 or older) was randomly chosen for interviewing by using the last birthday method to avoid biases in age and gender. Each interview took an average of 20 minutes to complete. Interviewing was conducted in English or Spanish. Casa Hispana translated the survey into Spanish, and Schulman, Ronca & Bucuvalas, Inc. conducted the telephone interviewing. We used recent U.S. Census and state figures to compare the demographic characteristics of the survey sample with characteristics of California s adult population. The survey sample was closely comparable to the census and state figures. The survey data in this report were statistically weighted to account for any demographic differences. The sampling error for the total sample of 2,003 adults is +/- 2 percent at the 95 percent confidence level. This means that 95 times out of 100, the results will be within 2 percentage points of what they would be if all adults in California were interviewed. The sampling error for subgroups is larger. The sampling error for the 1,636 registered voters is +/- 2.5 percent, and the sampling error for the 1,151 likely voters is +/- 3 percent. Sampling error is only one type of error to which surveys are subject. Results may also be affected by factors such as question wording, question order, and survey timing. Throughout the report, we refer to four geographic regions. Central Valley includes Butte, Colusa, El Dorado, Fresno, Glenn, Kern, Kings, Madera, Merced, Placer, Sacramento, San Joaquin, Shasta, Stanislaus, Sutter, Tehama, Tulare, Yolo, and Yuba Counties. SF Bay Area includes Alameda, Contra Costa, Marin, Napa, San Francisco, San Mateo, Santa Clara, Solano, and Sonoma Counties. Los Angeles refers to Los Angeles County, and Other Southern California includes the mostly suburban regions of Orange, Riverside, San Bernardino, and San Diego Counties. These four regions are the major population centers of the state, accounting for approximately 90 percent of the state population. We present specific results for Latinos because they account for about 28 percent of the state s adult population and constitute one of the fastest growing voter groups. The sample sizes for the African American and Asian subgroups are not large enough for separate statistical analysis. We do contrast the opinions of registered Democrats, Republicans, and independents. The independents category includes only those who are registered to vote as decline to state. In some cases, we compare PPIC Statewide Survey responses to responses recorded in national surveys conducted by ABC News/Washington Post, CBS News/New York Times, the Pew Research Center, Fox News/Opinion Dynamics, the Gallup Organization, the National Election Studies (NES), and the Kaiser Family Foundation. We use earlier PPIC Statewide Surveys to analyze trends over time in California
30
31 PPIC STATEWIDE SURVEY: CALIFORNIANS AND THEIR GOVERNMENT SEPTEMBER 12 SEPTEMBER 19, ,003 CALIFORNIA ADULT RESIDENTS; ENGLISH AND SPANISH MARGIN OF ERROR +/-2% AT 95% CONFIDENCE LEVEL FOR TOTAL SAMPLE 1. Do you think things in California are generally going in the right direction or the wrong direction? 47% right direction 40 wrong direction 13 don't know 2. Turning to economic conditions in California, do you think that during the next 12 months we will have good times financially or bad times? 46% good times 40 bad times 14 don't know [Responses recorded for questions 3 through 19 are from likely voters only. All other responses are from all adults, except where noted.] 3. If the November 2 nd presidential election were being held today, would you vote for: [rotate] the Republican ticket of George W. Bush and Dick Cheney [or] the Democratic ticket of John Kerry and John Edwards? 51% John Kerry and John Edwards 39 George W. Bush and Dick Cheney 3 other answer [specify] 7 don't know 4. How closely are you following news about candidates for the upcoming presidential election very closely, fairly closely, not too closely, or not at all closely? 50% very closely 39 fairly closely 8 not too closely 3 not at all closely 5. There will be a series of presidential debates leading up to the November 2nd election. Which one issue would you most like to hear the presidential candidates talk about during the presidential debates? [code, don t read] 30% economy, jobs, unemployment 19 Iraq situation, war in Iraq 12 health care, health costs 8 terrorism, security issues 5 education, schools 4 immigration, illegal immigration 4 federal budget, deficit, taxes 2 foreign policy in general 2 crime, gangs 1 energy, oil/gasoline prices 1 environment, pollution 8 other (specify) 4 don t know 5a. Is there another issue that you want to hear about almost as much? [code, don t read] 22% economy, jobs, unemployment 20 Iraq situation, war in Iraq 16 health care, health costs 8 education, schools 7 terrorism, security issues 5 federal budget, deficit, taxes 3 foreign policy in general 3 immigration, illegal immigration 3 social security 2 environment, pollution 2 gay rights, gay marriages 1 abortion 1 guns, gun control 1 energy, oil/gasoline prices 1 government regulations 1 housing costs/availability 1 moral and family values 1 women s rights 2 other (specify)
32 Regardless of your choice for president, which of these candidates would do the better job on each of these issues George W. Bush or John Kerry? [rotate questions 6 to 9] 6. Which candidate would do a better job on the situation in Iraq? 44% George W. Bush 48 John Kerry 2 other answer (specify) 6 don't know 7. Which candidate would do a better job on health care? 32% George W. Bush 57 John Kerry 2 other answer (specify) 9 don't know 8. Which candidate would do a better job on jobs and the economy? 37% George W. Bush 54 John Kerry 2 other answer (specify) 7 don't know 9. Which candidate would do a better job on terrorism and homeland security? 48% George W. Bush 43 John Kerry 2 other answer (specify) 7 don't know 10. If the November election for the U.S. Senate were being held today, would you vote for: [rotate] Barbara Boxer, the Democrat, [or] Bill Jones, the Republican? 54% Barbara Boxer 36 Bill Jones 1 other answer (specify) 9 don't know [rotate questions 11 and 12] 11. Do you consider Barbara Boxer to be [rotate order] or don't you know enough to say? 30% very liberal 29 somewhat liberal 19 middle-of-the-road 4 somewhat conservative 1 very conservative 17 don't know enough to say 12. Do you consider Bill Jones to be [rotate order] or don't you know enough to say? 1% very liberal 2 somewhat liberal 13 middle-of-the-road 25 somewhat conservative 11 very conservative 48 don't know enough to say 13. Proposition 60 on the November ballot the Election Rights of Political Parties Legislative Constitutional Amendment requires that general election ballots include the candidate receiving the most votes among candidates of the same party for partisan office in the primary election. No significant fiscal impact is expected. If the election were held today, would you vote yes or no on Proposition 60? 34% yes 24 no 42 don't know 14. Do you think California's current system of partisan primaries generally produces candidates who effectively represent their districts? 54% yes, produces effective representatives 34 no, does not produce effective representatives 12 don't know 15. Proposition 62 on the November ballot the Elections, Primaries Initiative Constitutional Amendment, requires primary elections where voters may vote for any state or federal candidate regardless of the voter's or candidate s party registration. The two primary election candidates receiving the most votes for an office whether they are candidates with no party or members of the same or different party would be listed on the general election ballot. No significant fiscal impact is expected. If the election were held today, would you vote yes or no on Proposition 62? 49% yes 33 no 18 don't know
33 16. If Proposition 62 passes, do you think California would generally have candidates who more effectively represent their districts than candidates today? 46% yes 31 no 23 don't know 17. Proposition 72 on the November ballot is the Health Care Coverage Requirements Referendum. A yes vote approves and a no vote rejects state legislation requiring health care coverage for employees working for large and medium employers. The fiscal impacts include significant state expenditures on private health insurance offset fully by significant employer health coverage costs, significant county health program savings, and significant net state revenue losses. If the election were held today, would you vote yes or no on Proposition 72? 45% yes 34 no 21 don't know 18. How closely are you following news about Proposition 72, The Health Care Coverage Requirements Referendum very closely, fairly closely, not too closely, or not at all closely? 6% very closely 23 fairly closely 34 not too closely 34 not at all closely 3 don't know 19. Does knowing that Governor Arnold Schwarzenegger opposes this state proposition make you more likely to oppose it, more likely to support it, or does it make no difference to you? 14% more likely to oppose 16 more likely to support 65 no difference 5 don't know [rotate questions 20/21 and 22/23 as blocks] 20. Overall, do you approve or disapprove of the way that Arnold Schwarzenegger is handling his job as governor of California? 61% approve 31 disapprove 8 don't know 21. How would you rate Governor Schwarzenegger when it comes to working for the best interests of people like you excellent, good, fair, or poor? 13% excellent 33 good 31 fair 21 poor 2 don't know 22. Overall, do you approve or disapprove of the way that the California legislature is handling its job? 40% approve 46 disapprove 14 don't know 23. How would you rate the California legislature when it comes to working for the best interests of people like you excellent, good, fair, or poor? 3% excellent 19 good 43 fair 31 poor 4 don't know 24. In California state government today, which of the following would you prefer to have the most influence over public policy: [rotate list] 37% initiatives on the state ballot 31 the legislature 23 the governor 1 other answer (specify) 8 don't know 25. Do you think the citizens' initiative process in California is in need of major changes or minor changes or that it is basically fine the way it is at this time? 35% major changes 33 minor changes 21 fine the way it is 11 don't know 26. The California legislature has operated under term limits since 1990, meaning that members of the state senate and state assembly are limited in the number of terms they can hold their elected office. Do you think that term limits are a good thing or a bad thing for California, or do they make no difference? 61% good thing 17 bad thing 18 no difference 4 don't know September 2004
34 27. What if your state legislators were allowed to serve up to four years beyond the current term limits of three two-year terms in the state assembly and two four-year terms in the state senate? Do you think they would be more effective or less effective in representing your area, or would there be no difference? 35% more effective 25 less effective 34 no difference 6 don't know 28. There is a proposal to change the California legislature from full-time to part-time status. Do you think that having a part-time legislature would be a good thing or a bad thing for California, or would it make no difference? 22% good thing 53 bad thing 17 no difference 8 don't know 29. Currently, 40 state senators and 80 assembly members represent the people of California in the state legislature. Overall, do you think people in your area would be better represented in the state legislature if there were more representatives serving smaller districts, or would it not make a difference? 43% area would be better represented 49 would not make a difference 2 other (specify) 6 don't know 30. Would you favor or oppose taking the power to redraw legislative and congressional district lines from the state legislature and shifting this responsibility to a new, independent state commission? 39% favor 40 oppose 21 don't know 31. Generally speaking, would you favor or oppose having a system of public funding for state and legislative campaigns in California if it cost taxpayers a few dollars a year to run? 35% favor 57 oppose 8 don't know 32. Changing topics, overall do you approve or disapprove of the way that George W. Bush is handling his job as president of the United States? 43% approve 54 disapprove 3 don't know 33. Overall, do you approve or disapprove of the way that President Bush is handling the issue of jobs and the economy? 39% approve 56 disapprove 5 don't know 34. Do you think that things in the United States are generally going in the right direction or the wrong direction? 42% right direction 54 wrong direction 4 don't know 35. Turning to economic conditions, do you think during the next 12 months the United States will have good times financially or bad times? 47% good times 41 bad times 12 don't know I m going to read some pairs of statements. As I read each pair, tell me if the first statement or the second statement comes closest to your views even if neither is exactly right. [rotate questions 36 and 37] 36. [rotate] Government regulation of business is necessary to protect the public interest [or] Government regulation of business does more harm than good. 54% government regulation is necessary 42 government regulation does more harm than good 4 don't know 37. What do you think is more likely to decrease gun violence: [rotate] better enforcement of gun laws [or] more laws and restrictions on obtaining guns? 52% better enforcement 39 more laws 5 both 4 don't know
35 [rotate questions 38 and 39] 38. Which would you prefer: [rotate] the current health insurance system in the United States, in which most people get their health insurance from private employers but some people have no insurance [or] a universal health insurance program, in which everyone is covered under a program like Medicare that s run by the government and financed by taxpayers? 35% current system 60 universal health insurance system 5 don't know 39. Would you be willing to pay more either in higher health insurance premiums or higher taxes in order to increase the number of Americans who have health insurance, or not? 53% yes, willing to pay more 42 no, not willing to pay more 5 don't know 40. How concerned are you about being able to afford necessary health care when a family member gets sick very concerned, somewhat concerned, not very concerned, or not at all concerned? 57% very concerned 20 somewhat concerned 10 not very concerned 13 not at all concerned 41. On another topic, some people are registered to vote and others are not. Are you absolutely certain that you are registered to vote? 82% yes 18 no 41a.Are you registered as a Democrat, a Republican, another party, or as an independent? 42% Democrat 35 Republican 5 another party (specify) 18 independent 42. Regardless of your current voter registration status, generally speaking, do you usually think of yourself as a Democrat, a Republican, an independent, or what? 34% Democrat [ask q43b] 25 Republican [ask q43c] 31 Independent [ask q43a] 6 other (specify)[ask q43a] 4 don't know [ask q43a] 43a.Do you think of yourself as closer to the Republican Party or Democratic Party? 31% Republican Party 43 Democratic Party 20 neither 6 don't know [skip to Q44] 43b.Do you think of yourself as a strong Democrat or not a very strong Democrat? 58% strong 40 not very strong 2 don't know [skip to Q44] 43c.Do you think of yourself as a strong Republican or not a very strong Republican? 62% strong 36 not very strong 2 don't know [rotate questions 44/45 and 46/47/48 as blocks] 44. Overall, do you think there are any important differences in what the Republicans and Democrats stand for? 75% yes, important differences 21 no, no important differences 4 don't know 45. In your view, do the Republican and Democratic parties do an adequate job representing the American people, or do they do such a poor job that a third major party is needed? 48% adequate job 46 third party is needed 6 don't know I'm going to read you some phrases. Please tell me if you think each one better describes the Republican Party and its leaders or the Democratic Party and its leaders. First, which party do you think is better described by the phrase [rotate questions 46 to 48] 46. Can bring about the kind of changes the country needs 36% Republican Party 51 Democratic Party 3 both equally [volunteered] 6 neither [volunteered] 4 don't know September 2004
![47. Is concerned with the needs of people like me 30% Republican Party 57 Democratic Party 3 both equally [volunteered] 5 neither [volunteered] 5 don't know 48.](/docs-images/83/87694739/images/36-0.jpg "Able to manage the federal government well 42% Republican Party 42 Democratic Party 2 both equally [volunteered] 8 neither [volunteered] 6 don't know 49.")
36 47. Is concerned with the needs of people like me 30% Republican Party 57 Democratic Party 3 both equally [volunteered] 5 neither [volunteered] 5 don't know 48. Able to manage the federal government well 42% Republican Party 42 Democratic Party 2 both equally [volunteered] 8 neither [volunteered] 6 don't know 49. On another topic, would you consider yourself to be politically [rotate order] 11% very liberal 21 somewhat liberal 32 middle-of-the-road 24 somewhat conservative 10 very conservative 2 don't know 50. Generally speaking, how much interest would you say you have in politics a great deal, a fair amount, only a little, or none? 26% great deal 43 fair amount 25 only a little 6 none 51. As far as making progress on the important issues facing the country is concerned, does it really matter who wins the 2004 presidential election, or will things pretty much be the same regardless of who is elected president? 71% really matters who wins 26 things will pretty much be the same regardless 1 other (specify) 2 don't know [Responses recorded for questions 52 and 53 are from registered voters only] 52. How often would you say you vote always, nearly always, part of the time, seldom, or never? 70% always 19 nearly always 7 part of the time 2 seldom 2 never 53. Do you plan to vote in the general election on November 2 nd? If yes: Will you vote at your local polling place or by absentee ballot? 73% yes, local polling place 23 yes, absentee ballot 2 no, not planning to vote 2 don't know 54. On another topic, are you yourself now covered by any form of health insurance or health plan? 83% yes 17 no 55. Are you or is anyone in your immediate family a member of a labor union? If yes: Is that person you or another person in your family? 10% yes, respondent 10 yes, another person in family 2 yes, both 78 no [56-69: demographic questions]
PPIC STATEWIDE SURVEY
 PPIC STATEWIDE SURVEY OCTOBER OBER 2004 Californians and Their Government Public Policy Institute of California Mark Baldassare Research Director & Survey Director The Public Policy Institute of California
Californians. their government. ppic statewide survey DECEMBER in collaboration with The James Irvine Foundation CONTENTS
 ppic statewide survey DECEMBER 2010 Californians & their government Mark Baldassare Dean Bonner Sonja Petek Nicole Willcoxon CONTENTS About the Survey 2 Press Release 3 November 2010 Election 6 State and
David W. Lyon is founding President and Chief Executive Officer of PPIC. Thomas C. Sutton is Chair of the Board of Directors.
 The Public Policy Institute of California (PPIC) is a private operating foundation established in 1994 with an endowment from William R. Hewlett. The Institute is dedicated to improving public policy in
Californians. population issues. february in collaboration with The William and Flora Hewlett Foundation
 february 2009 Californians & population issues in collaboration with The William and Flora Hewlett Foundation Mark Baldassare Dean Bonner Jennifer Paluch Sonja Petek The Public Policy Institute of California
march 2009 Californians their government in collaboration with The James Irvine Foundation Mark Baldassare Dean Bonner Jennifer Paluch Sonja Petek
 march 2009 Californians & their government in collaboration with The James Irvine Foundation Mark Baldassare Dean Bonner Jennifer Paluch Sonja Petek The Public Policy Institute of California is dedicated
PPIC STATEWIDE SURVEY
 PPIC STATEWIDE SURVEY SEPTEMBER 2005 Special Survey on Californians and the Initiative Process in collaboration with The James Irvine Foundation Public Policy Institute of California Mark Baldassare Research
Mark Baldassare is President and Chief Executive Officer of PPIC. Thomas C. Sutton is Chair of the Board of Directors.
 MaY 2008 The Public Policy Institute of California is dedicated to informing and improving public policy in California through independent, objective, nonpartisan research on major economic, social, and
Californians. their government. september in collaboration with The James Irvine Foundation
 september 2008 Californians & their government in collaboration with The James Irvine Foundation Mark Baldassare Dean Bonner Jennifer Paluch Sonja Petek The Public Policy Institute of California is dedicated
Californians. healthy communities. ppic statewide survey FEBRUARY in collaboration with The California Endowment CONTENTS
 ppic statewide survey FEBRUARY 2011 Californians & healthy communities Mark Baldassare Dean Bonner Sonja Petek Nicole Willcoxon CONTENTS About the Survey 2 Press Release 3 Residents Perceptions & Attitudes
Californians & Their Government
 PPIC STATEWIDE SURVEY DECEMBER 2018 Californians & Their Government Mark Baldassare Dean Bonner Alyssa Dykman Lunna Lopes CONTENTS Press Release State Post-Election Landscape Federal Post-Election Landscape
Californians & Their Government
 Californians & Their Government Mark Baldassare Dean Bonner David Kordus Lunna Lopes CONTENTS Press Release 3 State Issues 6 Federal Issues 14 Regional Map 24 Methodology 25 Questionnaire and Results 27
Californians. their government. ppic state wide surve y SEPTEMBER in collaboration with The James Irvine Foundation
 ppic state wide surve y SEPTEMBER 2014 Californians & their government Mark Baldassare Dean Bonner Renatta DeFever Lunna Lopes Jui Shrestha CONTENTS About the Survey 2 Press Release 3 November 2014 Election
Californians. their government. ppic state wide surve y OCTOBER in collaboration with The James Irvine Foundation CONTENTS
 ppic state wide surve y OCTOBER 2012 Californians & their government Mark Baldassare Dean Bonner Sonja Petek Jui Shrestha CONTENTS About the Survey 2 Press Release 3 November 2012 Election 6 State and
Californians. their government. ppic statewide survey SEPTEMBER in collaboration with The James Irvine Foundation CONTENTS
 ppic statewide survey SEPTEMBER 2010 Californians & their government Mark Baldassare Dean Bonner Sonja Petek Nicole Willcoxon CONTENTS About the Survey 2 Press Release 3 November 2010 Election 6 State
Californians. their government. ppic state wide surve y MARCH in collaboration with The James Irvine Foundation CONTENTS
 ppic state wide surve y MARCH 2014 Californians & their government Mark Baldassare Dean Bonner Sonja Petek Jui Shrestha CONTENTS About the Survey 2 Press Release 3 State Government 6 Federal Government
Californians. their government. ppic state wide surve y SEPTEMBER supported with funding from The James Irvine Foundation CONTENTS
 ppic state wide surve y SEPTEMBER 2015 Californians & their government Mark Baldassare Dean Bonner David Kordus Lunna Lopes CONTENTS About the Survey 2 Press Release 3 State Government 6 Federal Government
Californians. their government. january in collaboration with The James Irvine Foundation
 january 2009 Californians & their government in collaboration with The James Irvine Foundation Mark Baldassare Dean Bonner Jennifer Paluch Sonja Petek The Public Policy Institute of California is dedicated
Californians & Their Government
 Californians & Their Government Mark Baldassare Dean Bonner Lunna Lopes CONTENTS Press Release 3 2018 California Election 6 State and National Issues 13 Regional Map 20 Methodology 21 Questionnaire and
David W. Lyon is founding President and Chief Executive Officer of PPIC. Thomas C. Sutton is Chair of the Board of Directors.
 The Public Policy Institute of California (PPIC) is a private operating foundation established in 1994 with an endowment from William R. Hewlett. The Institute is dedicated to improving public policy in
PPIC STATEWIDE SURVEY
 PPIC STATEWIDE SURVEY FEBRU ARY 2006 Californians and the Environment in collaboration with The David and Lucile Packard Foundation Public Policy Institute of California Mark Baldassare Research Director
Californians. their government. ppic state wide surve y JANUARY in collaboration with The James Irvine Foundation CONTENTS
 ppic state wide surve y JANUARY 2014 Californians & their government Mark Baldassare Dean Bonner Sonja Petek Jui Shrestha CONTENTS About the Survey 2 Press Release 3 State Government 6 Federal Government
PUBLIC POLICY INSTITUTE OF CALIFORNIA 500 Washington Street, Suite 800 San Francisco, California phone: fax:
 PUBLIC POLICY INSTITUTE OF CALIFORNIA 500 Washington Street, Suite 800 San Francisco, California 94111 phone: 415.291.4400 fax: 415.291.4401 www.ppic.org survey@ppic.org TABLE OF CONTENTS About the Survey
Californians. their government. ppic state wide surve y MARCH in collaboration with The James Irvine Foundation CONTENTS
 ppic state wide surve y MARCH 2012 Californians & their government Mark Baldassare Dean Bonner Sonja Petek Jui Shrestha CONTENTS About the Survey 2 Press Release 3 2012 Elections 6 State and National Issues
PPIC STATEWIDE SURVEY
 PPIC STATEWIDE SURVEY J ANUAR ARY Y 2006 Special Survey on the California State Budget in collaboration with The James Irvine Foundation Public Policy Institute of California Mark Baldassare Research Director
Californians. their government. ppic statewide sur vey J A N U A R Y in collaboration with The James Irvine Foundation CONTENTS
 ppic statewide sur vey J A N U A R Y 2 0 1 0 Californians & their government Mark Baldassare Dean Bonner Sonja Petek Nicole Willcoxon CONTENTS About the Survey 2 Press Release 3 2010 Election Context 6
Californians. their government. ppic state wide surve y JANUARY in collaboration with The James Irvine Foundation CONTENTS
 ppic state wide surve y JANUARY 2013 Californians & their government Mark Baldassare Dean Bonner Sonja Petek Jui Shrestha CONTENTS About the Survey 2 Press Release 3 State Government 6 Federal Government
As Budget Angst Grows, Californians Take Stock of Fiscal Options And Take Aim at Elected Leaders
 EMBARGOED: Do not publish or broadcast until 10:00 p.m. PDT on Wednesday, March 26. CONTACT: Andrew Hattori, 415/291-4417 Abby Cook, 415/291-4436 Para ver este comunicado de prensa en español, por favor
Californians & Their Government
 Californians & Their Government Mark Baldassare Dean Bonner Alyssa Dykman CONTENTS Press Release 3 2018 California Election 6 State and National Issues 11 Regional Map 20 Methodology 21 Questionnaire and
Californians & Their Government
 Californians & Their Government Mark Baldassare Dean Bonner David Kordus Lunna Lopes CONTENTS Press Release 3 Federal Government 6 State Government 15 Regional Map 22 Methodology 23 Questionnaire and Results
TABLE OF CONTENTS. About the Survey 1. Press Release 3. State Issues 7. National Issues 15. Regional Map 24. Methodology 25
 TABLE OF CONTENTS About the Survey 1 Press Release 3 State Issues 7 National Issues 15 Regional Map 24 Methodology 25 Questionnaire and Results 27 ABOUT THE SURVEY The PPIC Statewide Survey provides policymakers,
Californians. their government. ppic statewide sur vey. d e c e m b e r in collaboration with The James Irvine Foundation CONTENTS
 ppic statewide sur vey d e c e m b e r 2 0 0 9 Californians & their government Mark Baldassare Dean Bonner Jennifer Paluch Sonja Petek CONTENTS About the Survey 2 Press Release 3 2010 California Election
PPIC Statewide Survey: Californians and Their Government
 PPIC Statewide Survey: Californians and Their Government Mark Baldassare Senior Fellow and Survey Director January 2001 Public Policy Institute of California Preface California is in the midst of tremendous
Coping with Homeland Security in California: Surveys of City Officials and State Residents
 Occasional Papers Coping with Homeland Security in California: Surveys of City Officials and State Residents Mark Baldassare Public Policy Institute of California Christopher Hoene National League of Cities
Californians & Their Government
 Californians & Their Government Mark Baldassare Dean Bonner Alyssa Dykman Lunna Lopes CONTENTS Press Release 3 2018 California Election 6 State and National Issues 12 Regional Map 20 Methodology 21 Questionnaire
PPIC STATEWIDE SURVEY
 PPIC STATEWIDE SURVEY NOVEMBER 2003 Special Survey on Californians and the Environment in collaboration with The William and Flora Hewlett Foundation The James Irvine Foundation The David and Lucile Packard
PPIC Statewide Survey: Special Survey on Growth
 PPIC Statewide Survey: Special Survey on Growth Mark Baldassare Senior Fellow and Survey Director May 2001 Part of the Growth, Land Use, and Environment Series In Collaboration with The William and Flora
Californians & the Environment
 Californians & the Environment Mark Baldassare Dean Bonner Alyssa Dykman Lunna Lopes CONTENTS Press Release 3 2018 Election and Environmental Issues 6 Public Perceptions and Policy Preferences 14 Regional
Californians. their government. ppic state wide surve y MAY in collaboration with The James Irvine Foundation CONTENTS
 ppic state wide surve y MAY 2013 Californians & their government Mark Baldassare Dean Bonner Sonja Petek Jui Shrestha CONTENTS About the Survey 2 Press Release 3 State Government 6 Federal Government 16
Californians. their government. ppic state wide surve y SEPTEMBER in collaboration with The James Irvine Foundation CONTENTS
 ppic state wide surve y SEPTEMBER 2013 Californians & their government Mark Baldassare Dean Bonner Sonja Petek Jui Shrestha CONTENTS About the Survey 2 Press Release 3 State Government 6 Federal Government
PPIC STATEWIDE SURVEY J U N E
 PPIC STATEWIDE SURVEY J U N E 2 0 0 6 Special Survey of the Central in collaboration with the Great Center Public Policy Institute of California Mark Baldassare Research Director & Survey Director The
PPIC Statewide Survey: Californians and Their Government
 PPIC Statewide Survey: ns and Their Government Mark Baldassare Senior Fellow and Survey Director January 2000 Public Policy Institute of The Public Policy Institute of is a private, nonprofit research
Preface. The characteristics of groups that are shaping the state's elections and policy debates.
 Preface California is now in the midst of historic changes that will profoundly affect the future of the state. To improve understanding of these changes and their effect on the political status quo, PPIC
BLISS INSTITUTE 2006 GENERAL ELECTION SURVEY
 BLISS INSTITUTE 2006 GENERAL ELECTION SURVEY Ray C. Bliss Institute of Applied Politics The University of Akron Executive Summary The Bliss Institute 2006 General Election Survey finds Democrat Ted Strickland
THE 2004 NATIONAL SURVEY OF LATINOS: POLITICS AND CIVIC PARTICIPATION
 Summary and Chartpack Pew Hispanic Center/Kaiser Family Foundation THE 2004 NATIONAL SURVEY OF LATINOS: POLITICS AND CIVIC PARTICIPATION July 2004 Methodology The Pew Hispanic Center/Kaiser Family Foundation
PPIC Statewide Survey: Special Survey on Land Use part of the Growth, Land Use, and Environment Series
 PPIC Statewide Survey: Special Survey on Land Use part of the Growth, Land Use, and Environment Series in collaboration with the The William and Flora Hewlett Foundation The James Irvine Foundation The
These are the highlights of the latest Field Poll completed among a random sample of 997 California registered voters.
 THE FIELD POLL THE INDEPENDENT AND NON-PARTISAN SURVEY OF PUBLIC OPINION ESTABLISHED IN 1947 AS THE CALIFORNIA POLL BY MERVIN FIELD Field Research Corporation 601 California Street, Suite 900 San Francisco,
Release #2475 Release Date: Wednesday, July 2, 2014 WHILE CALIFORNIANS ARE DISSATISFIED
 THE FIELD POLL THE INDEPENDENT AND NON-PARTISAN SURVEY OF PUBLIC OPINION ESTABLISHED IN 1947 AS THE CALIFORNIA POLL BY MERVIN FIELD Field Research Corporation 601 California Street, Suite 210 San Francisco,
Two-to-one voter support for Marijuana Legalization (Prop. 64) and Gun Control (Prop. 63) initiatives.
 and Gun Control (Prop. 63) initiatives.") UC Berkeley IGS Poll Title Two-to-one voter support for Marijuana Legalization (Prop. 64) and Gun Control (Prop. 63) initiatives. Permalink https://escholarship.org/uc/item/51c1h00j Author DiCamillo, Mark
UC Berkeley IGS Poll Title Two-to-one voter support for Marijuana Legalization (Prop. 64) and Gun Control (Prop. 63) initiatives. Permalink https://escholarship.org/uc/item/51c1h00j Author DiCamillo, Mark
THE FIELD POLL. UCB Contact
 Field Research Corporation 601 California Street, Suite 900, San Francisco, CA 94108-2814 415.392.5763 FAX: 415.434.2541 field.com/fieldpollonline THE FIELD POLL UNIVERSITY OF CALIFORNIA, BERKELEY BERKELEY
PPIC Statewide Survey:
 Global California: PPIC Statewide Survey: Perspectives on U.S.-Japan Relations Mark Baldassare Senior Fellow and Survey Director September 2001 Public Policy Institute of California Contents Press Release
Preface. The characteristics of groups that are shaping the state's elections and policy debates.
 Preface California is now in the midst of historic changes that will profoundly affect the future of the state. To improve understanding of these changes and their effect on the political status quo, PPIC
Proposed gas tax repeal backed five to four. Support tied to voter views about the state s high gas prices rather than the condition of its roads
 Jack Citrin Center for Public Opinion Research Institute of Governmental Studies 124-126 Moses Hall University of California, Berkeley Berkeley, CA 94720 Tel: 510-642- 6835 Email: igs@berkeley.edu Release
The Republican Race: Trump Remains on Top He ll Get Things Done February 12-16, 2016
 CBS NEWS POLL For release: Thursday, February 18, 2016 7:00 AM EST The Republican Race: Trump Remains on Top He ll Get Things Done February 12-16, 2016 Donald Trump (35%) continues to hold a commanding
CONTACT: TIM VERCELLOTTI, Ph.D., (732) , EXT. 285; (919) (cell) CRANKY ELECTORATE STILL GIVES DEMOCRATS THE EDGE
 , EXT. 285; (919) (cell) CRANKY ELECTORATE STILL GIVES DEMOCRATS THE EDGE") - Eagleton Poll EMBARGOED UNTIL 9 A.M. EDT OCT. 25, 2007 Oct. 25, 2007 (Release 163-1) CONTACT: TIM VERCELLOTTI, Ph.D., (732) 932-9384, EXT. 285; (919) 812-3452 (cell) CRANKY ELECTORATE STILL GIVES DEMOCRATS
- Eagleton Poll EMBARGOED UNTIL 9 A.M. EDT OCT. 25, 2007 Oct. 25, 2007 (Release 163-1) CONTACT: TIM VERCELLOTTI, Ph.D., (732) 932-9384, EXT. 285; (919) 812-3452 (cell) CRANKY ELECTORATE STILL GIVES DEMOCRATS
CONGRESS, THE FOLEY FALLOUT AND THE NOVEMBER ELECTIONS October 5 8, 2006
 CBS NEWS/NEW YORK TIMES POLL For release: Monday, October 9, 2006 6:30 P.M. CONGRESS, THE FOLEY FALLOUT AND THE NOVEMBER ELECTIONS October 5 8, 2006 Americans give Republican Congressional leaders terrible
RECOMMENDED CITATION: Pew Research Center, July, 2016, 2016 Campaign: Strong Interest, Widespread Dissatisfaction
 NUMBERS, FACTS AND TRENDS SHAPING THE WORLD FOR RELEASE JULY 07, 2016 FOR MEDIA OR OTHER INQUIRIES: Carroll Doherty, Director of Political Research Jocelyn Kiley, Associate Director, Research Bridget Johnson,
Instituted in 1911, the statewide initiative process was a Progressive Era reform that
 Public Policy Institute of California The California Initiative Process How Democratic Is It? Instituted in 1911, the statewide initiative process was a Progressive Era reform that allowed citizens to
THE FIELD POLL. UCB Contact
 Field Research Corporation 601 California Street, Suite 900, San Francisco, CA 94108-2814 415.392.5763 FAX: 415.434.2541 field.com/fieldpollonline THE FIELD POLL UNIVERSITY OF CALIFORNIA, BERKELEY BERKELEY
It s Democrats +8 in Likely Voter Preference, With Trump and Health Care on Center Stage
 ABC NEWS/WASHINGTON POST POLL: The 2018 Midterm Elections EMBARGOED FOR RELEASE AFTER 12:00 a.m. Sunday, Nov. 4, 2018 It s Democrats +8 in Likely Voter Preference, With Trump and Health Care on Center
FOR RELEASE APRIL 26, 2018
 FOR RELEASE APRIL 26, 2018 FOR MEDIA OR OTHER INQUIRIES: Carroll Doherty, Director of Political Research Jocelyn Kiley, Associate Director, Research Bridget Johnson, Communications Associate 202.419.4372
2010 CONGRESSIONAL VOTE IN NEW JERSEY EIGHT MONTHS OUT; MOST INCUMBENTS IN GOOD SHAPE BUT MANY VOTERS UNDECIDED
 Eagleton Institute of Politics Rutgers, The State University of New Jersey 191 Ryders Lane New Brunswick, New Jersey 08901-8557 www.eagleton.rutgers.edu eagleton@rci.rutgers.edu 732-932-9384 Fax: 732-932-6778
Survey of Pennsylvanians on the Issue of Health Care Reform KEY FINDINGS REPORT
 The Morning Call/ Muhlenberg College Institute of Public Opinion Survey of Pennsylvanians on the Issue of Health Care Reform KEY FINDINGS REPORT Release Date November 17, 2009 KEY FINDINGS: 1. As the national
GOP leads on economy, Democrats on health care, immigration
 FOR RELEASE JUNE 20, 2018 Voters More Focused on Control of Congress and the President Than in Past Midterms GOP leads on economy, Democrats on health care, immigration FOR MEDIA OR OTHER INQUIRIES: Carroll
CALIFORNIA S POST-PARTISAN FUTURE 1 MARK BALDASSARE
 PPIC [ 1 ] CALIFORNIA S POST-PARTISAN FUTURE 1 MARK BALDASSARE In his second inaugural address, Governor Arnold Schwarzenegger surprised the state s partisan political establishment by declaring I believe
Release # For Publication: Tuesday, September 19, 2017
 Jack Citrin Center for Public Opinion Research Institute of Governmental Studies 124-126 Moses Hall University of California Berkeley, CA 94720 Tel: 510-642- 6835 Email: igs@berkeley.edu Release #2017-16
California Ballot Reform Panel Survey Page 1
 CALIFORNIA BALLOT RE FORM PANEL SURVEY 2011-2012 Interview Dates: Wave One: June 14-July 1, 2011 Wave Two: December 15-January 2, 2012 Sample size Wave One: (N=1555) Wave Two: (N=1064) Margin of error
Hispanic Attitudes on Economy and Global Warming June 2016
 Hispanic Attitudes on Economy and Global Warming June 2016 Final Results June May June M-M Y-Y 2016 2016 2015 Change Change Index of Consumer Sentiment 105.8 93.5 98.4 +12.3 +7.4 Current Economic Conditions
PEW RESEARCH CENTER. FOR RELEASE January 16, 2019 FOR MEDIA OR OTHER INQUIRIES:
 FOR RELEASE January 16, 2019 FOR MEDIA OR OTHER INQUIRIES: Carroll Doherty, Director of Political Research Jocelyn Kiley, Associate Director, Research Bridget Johnson, Communications Manager 202.419.4372
A Harsh Judgment on Davis Clears Schwarzenegger s Way
 CALIFORNIA EXIT POLL: THE RECALL 10/7/03 A Harsh Judgment on Davis Clears Schwarzenegger s Way In the end it was more about Gray Davis than about Arnold Schwarzenegger, and on Davis, the voters judgment
THE BUSH PRESIDENCY AND THE STATE OF THE UNION January 20-25, 2006
 CBS NEWS/NEW YORK TIMES POLL For release: January 26, 2005 6:30 P.M. THE BUSH PRESIDENCY AND THE STATE OF THE UNION January 20-25, 2006 For the first time in his presidency, George W. Bush will give a
Executive Summary of Economic Attitudes, Most Important Problems, Ratings of Top Political Figures, and an Early Look at the 2018 Texas Elections
 2017 of Economic Attitudes, Most Important Problems, Ratings of Top Political Figures, and an Early Look at the 2018 Texas Elections Summary of Findings The 2017 continues its long time-series assessing
PPIC Statewide Survey: Californians and Their Government
 PPIC Statewide Survey: Californians and Their Government February 8, 18 Mark Baldassare, Dean Bonner, Alyssa Dykman, Lunna Lopes Supported with funding from the James Irvine Foundation, the California
Hatch Opens Narrow Lead Over Pawlenty
 Hatch Opens Narrow Lead Over Pawlenty Lawrence R. Jacobs Director, Center for the Study of Politics and Governance Humphrey Institute of Public Affairs University of Minnesota Joanne M. Miller Research
2016 GOP Nominating Contest
 2015 Texas Lyceum Poll Executive Summary 2016 Presidential Race, Job Approval & Economy A September 8-21, 2015 survey of adult Texans shows Donald Trump leading U.S. Sen. Ted Cruz 21-16, former U.S. Secretary
RECOMMENDED CITATION: Pew Research Center, July, 2015, Negative Views of Supreme Court at Record High, Driven by Republican Dissatisfaction
 NUMBERS, FACTS AND TRENDS SHAPING THE WORLD FOR RELEASE JULY 29, 2015 FOR FURTHER INFORMATION ON THIS REPORT: Carroll Doherty, Director of Political Research Bridget Jameson, Communications Associate 202.419.4372
Wide and growing divides in views of racial discrimination
 FOR RELEASE MARCH 01, 2018 The Generation Gap in American Politics Wide and growing divides in views of racial discrimination FOR MEDIA OR OTHER INQUIRIES: Carroll Doherty, Director of Political Research
An in-depth examination of North Carolina voter attitudes in important current issues. Registered Voters in North Carolina
 An in-depth examination of North Carolina voter attitudes in important current issues Registered Voters in North Carolina January 21-25, 2018 Table of Contents Key Survey Insights... 3 Satisfaction with
CURRENT ISSUES: THE DEBATE OVER SCHIP AND THE WAR IN IRAQ October 12-16, 2007
 CBS NEWS POLL For release: Wednesday, October 17 th, 2007 6:30 P.M. EDT CURRENT ISSUES: THE DEBATE OVER SCHIP AND THE WAR IN IRAQ October 12-16, 2007 As Democratic leaders in Congress attempt to wrangle
Executive Summary of Texans Attitudes toward Immigrants, Immigration, Border Security, Trump s Policy Proposals, and the Political Environment
 2017 of Texans Attitudes toward Immigrants, Immigration, Border Security, Trump s Policy Proposals, and the Political Environment Immigration and Border Security regularly rank at or near the top of the
Release #2345 Release Date: Tuesday, July 13, 2010
 THE FIELD POLL THE INDEPENDENT AND NON-PARTISAN SURVEY OF PUBLIC OPINION ESTABLISHED IN 1947 AS THE CALIFORNIA POLL BY MERVIN FIELD Field Research Corporation 601 California Street, Suite 900 San Francisco,
Release #2337 Release Date and Time: 6:00 a.m., Friday, June 4, 2010
 THE FIELD POLL THE INDEPENDENT AND NON-PARTISAN SURVEY OF PUBLIC OPINION ESTABLISHED IN 1947 AS THE CALIFORNIA POLL BY MERVIN FIELD Field Research Corporation 601 California Street, Suite 900 San Francisco,
Economic Issues in Ohio Work to Kerry s Advantage
 ABC NEWS POLL: THE RACE IN OHIO 10/17/04 EMBARGOED FOR RELEASE AFTER 5 p.m. Tuesday, Oct. 19, 2004 Economic Issues in Ohio Work to Kerry s Advantage The economy and jobs dominate as the top issue in Ohio,
Marist College Institute for Public Opinion Poughkeepsie, NY Phone Fax
 Marist College Institute for Public Opinion Poughkeepsie, NY 12601 Phone 845.575.5050 Fax 845.575.5111 www.maristpoll.marist.edu National Poll: The Candidates and the Campaign 2004 FOR IMMEDIATE RELEASE:
Florida RV Survey. 800 Registered Voters Statewide + Oversample of 600 Registered Republican Voters October 23-29, FL RV + GOP OS October 2017
 Florida RV Survey 800 Registered Voters Statewide + Oversample of 600 Registered Republican Voters October 23-29, 2017 FL RV + GOP OS October 2017 1 Right on Crime funded this poll to show voters and legislators
Voter turnout in today's California presidential primary election will likely set a record for the lowest ever recorded in the modern era.
 THE FIELD POLL THE INDEPENDENT AND NON-PARTISAN SURVEY OF PUBLIC OPINION ESTABLISHED IN 1947 AS THE CALIFORNIA POLL BY MERVIN FIELD Field Research Corporation 601 California Street, Suite 900 San Francisco,
234 Front Street San Francisco. CA (415) FAX (415)
 FAX (415)") THE FIELD POLL THE INDEPENDENT AND NON-PARTISAN SURVEY OF PUBLIC OPINION ESTABLISHED IN 147 AS THE CALIFORNIA POLL BY MERVIN FIELD 234 Front Street San Francisco. CA 4111 (4) 32-5763 FAX (4) 434-2541 COPYRIGHT
THE FIELD POLL THE INDEPENDENT AND NON-PARTISAN SURVEY OF PUBLIC OPINION ESTABLISHED IN 147 AS THE CALIFORNIA POLL BY MERVIN FIELD 234 Front Street San Francisco. CA 4111 (4) 32-5763 FAX (4) 434-2541 COPYRIGHT
Young Voters in the 2010 Elections
 Young Voters in the 2010 Elections By CIRCLE Staff November 9, 2010 This CIRCLE fact sheet summarizes important findings from the 2010 National House Exit Polls conducted by Edison Research. The respondents
Release #2486 Release Date: Friday, September 12, 2014
 THE FIELD POLL THE INDEPENDENT AND NON-PARTISAN SURVEY OF PUBLIC OPINION ESTABLISHED IN 1947 AS THE CALIFORNIA POLL BY MERVIN FIELD Field Research Corporation 601 California Street, Suite 210 San Francisco,
CONTRADICTORY VIEWS ON NEW JERSEY SENATE RACE
 Contact: PATRICK MURRAY 732-263-5858 (office) 732-979-6769 (cell) pdmurray@monmouth.edu Released: Thursday, July 24, 2008 Please attribute this information to: Monmouth University/Gannett New Jersey Poll
Marist College Institute for Public Opinion Poughkeepsie, NY Phone Fax
 Marist College Institute for Public Opinion Poughkeepsie, NY 12601 Phone 845.575.5050 Fax 845.575.5111 www.maristpoll.marist.edu New Hampshire Presidential Primary EMBARGOED FOR RELEASE: Wednesday 6 p.m.
PPIC Statewide Survey Methodology
 PPIC Statewide Survey Methodology Updated February 7, 2018 The PPIC Statewide Survey was inaugurated in 1998 to provide a way for Californians to express their views on important public policy issues.
POLITICS AND THE PRESIDENT April 6-9, 2006
 CBS NEWS POLL For release: April 10, 2006 6:30 P.M. POLITICS AND THE PRESIDENT April 6-9, 2006 Although President Bush s approval ratings have stopped the downward slide that occurred earlier this year
NEW JERSEY: DEM MAINTAINS EDGE IN CD11
 Please attribute this information to: Monmouth University Poll West Long Branch, NJ 07764 www.monmouth.edu/polling Follow on Twitter: @MonmouthPoll Released: Tuesday, October 9, Contact: PATRICK MURRAY
RECOMMENDED CITATION: Pew Research Center, February, 2015, Growing Support for Campaign Against ISIS - and Possible Use of U.S.
 NUMBERS, FACTS AND TRENDS SHAPING THE WORLD FOR RELEASE FEBRUARY 24, 2015 FOR FURTHER INFORMATION ON THIS REPORT: Carroll Doherty, Director of Political Research Rachel Weisel, Communications Associate
These are the findings from the latest statewide Field Poll completed among 1,003 registered voters in early January.
 THE FIELD POLL THE INDEPENDENT AND NON-PARTISAN SURVEY OF PUBLIC OPINION ESTABLISHED IN 1947 AS THE CALIFORNIA POLL BY MERVIN FIELD Field Research Corporation 601 California Street, Suite 210 San Francisco,
THE FIELD POLL. UCB Contact
 Field Research Corporation 601 California Street, Suite 900, San Francisco, CA 94108-2814 415.392.5763 FAX: 415.434.2541 field.com/fieldpollonline THE FIELD POLL UNIVERSITY OF CALIFORNIA, BERKELEY BERKELEY
2018 Florida General Election Poll
 Florida Southern College Center for Polling and Policy Research 2018 Florida General Election Poll For media or other inquiries: Zachary Baumann, Ph.D. Assistant Professor of Political Science Director,
Support for Restoring U.S.-Cuba Relations March 11-15, 2016
 CBS NEWS/NEW YORK TIMES POLL For release: Monday, March 21, 2016 7:00 am EDT Support for Restoring U.S.-Cuba Relations March 11-15, 2016 Amid President Barack Obama s historic trip to Cuba, a majority
THE PRESIDENTIAL RACE: MIDSUMMER July 7-14, 2008
 CBS NEWS/NEW YORK TIMES POLL For release: Tuesday July 15, 2008 6:30 P.M. EDT THE PRESIDENTIAL RACE: MIDSUMMER July 7-14, 2008 Democrat Barack Obama now holds a six-point edge over his Republican rival
THE PEOPLE, THE PRESS & POLITICS 1990 After The Election
 FOR RELEASE: FRIDAY, NOVEMBER 16, 1990 THE PEOPLE, THE PRESS & POLITICS 1990 After The Election FOR FURTHER INFORMATION CONTACT: Donald S. Kellermann, Director Andrew Kohut, Director of Surveys Carol Bowman,