PPIC STATEWIDE SURVEY
|
|
|
- Susanna Hancock
- 6 years ago
- Views:
Transcription

1 PPIC STATEWIDE SURVEY J ANUAR ARY Y 2006 Special Survey on the California State Budget in collaboration with The James Irvine Foundation Public Policy Institute of California Mark Baldassare Research Director & Survey Director
2 The Public Policy Institute of California (PPIC) is a private operating foundation established in 1994 with an endowment from William R. Hewlett. The Institute is dedicated to improving public policy in California through independent, objective, nonpartisan research. PPIC s research agenda focuses on three program areas: population, economy, and governance and public finance. Studies within these programs are examining the underlying forces shaping California s future, cutting across a wide range of public policy concerns: the California economy, education, employment and income, immigration, infrastructure and urban growth, poverty and welfare, state and local finance, and the well-being of children and families. PPIC was created because three concerned citizens William R. Hewlett, Roger W. Heyns, and Arjay Miller recognized the need for linking objective research to the realities of California public policy. Their goal was to help the state s leaders better understand the intricacies and implications of contemporary issues and make informed public policy decisions when confronted with challenges in the future. PPIC does not take or support positions on any ballot measure or on any local, state, or federal legislation, nor does it endorse, support, or oppose any political parties or candidates for public office. David W. Lyon is founding President and Chief Executive Officer of PPIC. Thomas C. Sutton is Chair of the Board of Directors. Public Policy Institute of California 500 Washington Street, Suite 800 San Francisco, California Telephone: (415) Fax: (415) info@ppic.org
3 Preface The PPIC Statewide Survey series provides policymakers, the media, and the general public with objective, advocacy-free information on the perceptions, opinions, and public policy preferences of California residents. Inaugurated in April 1998, the survey series has generated a database that includes the responses of more than 130,000 Californians. The current survey is the sixth in a series of special surveys on the California State Budget, begun in June 2003 and conducted in collaboration with The James Irvine Foundation. At the same time that the state government faces the immediate challenge of addressing a persistent budget gap between state spending and state revenue, California is planning for a future that includes significant population growth. To cope with long-term issues involved in balancing the state budget and providing resources to expand and improve the state s public schools, roads, water systems, and other infrastructure, structural reforms of the state and local finance system have been considered. Public opinion surveys offer the state s lawmakers an opportunity to examine Californians views on various fiscal plans and on specific proposals for spending and taxes. Over the years, California voters have made significant fiscal decisions for the state at the ballot box. In 2006, the state s voters will again have an important impact on the state and local fiscal system, since they will decide on state bond measures and tax and spending initiatives. This survey series seeks to raise public awareness, inform decisionmakers, and stimulate public discussion about the current state budget and the underlying state and local finance system. This report presents the responses of 2,003 adult residents throughout the state on a wide range of issues: California state budget issues, including perceptions of the severity of the state budget situation and fiscal trends in the past two years, priorities for state spending, support for tax increases and for specific initiatives to earmark revenue increases for health and education, fiscal policy preferences, attitudes toward the governor s State of the State address and related policy proposals, and overall satisfaction with the governor s budget plan and related fiscal proposals. State issues, including perceptions of the most important problem in California, the general direction of the state, the outlook for the state s economy, overall approval ratings of Governor Schwarzenegger and the state legislature, and approval ratings for the governor on specific issues. In addition, this survey examines attitudes toward infrastructure, including spending priorities, support for proposed state bonds, and preferred funding approaches. National issues, including overall approval ratings for President Bush and for his handling of terrorism and homeland security, the situation in Iraq, U.S. immigration policy and border patrols. Also included are attitudes toward the poor and poverty programs, and public concerns about avian (or bird) flu. The extent to which Californians may differ with regard to attitudes toward spending and taxes by party affiliation, demographics, race/ethnicity, and region of residence. This is the 63 rd PPIC Statewide Survey, which has included a number of special editions on the Central Valley (11/99, 3/01, 4/02, 4/03, 4/04), Los Angeles County (3/03, 3/04, 3/05), Orange County (9/01, 12/02, 12/03, 12/04), San Diego County (7/02), population (5/01, 12/05), land use (11/01, 11/02), housing (11/04), the environment (6/00, 6/02, 7/03, 11/03, 7/04, 7/05), the California state budget (6/03, 1/04, 5/04, 1/05, 5/05), California s future (8/04), and California s initiative process (08/05, 09/05, 10/05, 11/05). Copies of this report may be ordered by (order@ppic.org) or phone ( ). Copies of this and earlier reports are posted on the publications page of the PPIC web site ( For questions about the survey, please contact survey@ppic.org. - i -
4 - ii -
5 Contents Preface Press Release i v California State Budget 1 State Issues 7 National Issues 13 Survey Methodology 19 Survey Questions and Results 21 Survey Advisory Committee 26 - iii -
6
7 Press Release Para ver este comunicado de prensa en español, por favor visite nuestra página de internet: SPECIAL SURVEY ON THE CALIFORNIA STATE BUDGET DESPITE HIGH MARKS FOR BUDGET, INFRASTRUCTURE PLAN, CALIFORNIANS ARE COOL TOWARD GOVERNOR S LEADERSHIP Pessimism About State Finances, Lack of Confidence in Government Lingers SAN FRANCISCO, California, January 26, 2006 Governor Arnold Schwarzenegger s approval ratings have turned upward following the release of his budget and there is widespread support for his ambitious proposal to rebuild the state s deteriorating infrastructure, according to a new survey released today by the Public Policy Institute of California (PPIC) with funding from The James Irvine Foundation. Still, Californians make it clear that their confidence in Schwarzenegger s leadership is far from restored. A positive sign for the governor is that a solid majority (60%) of residents say they are satisfied with the budget plan he released on January 10 th. This is a much more favorable response than last year, when only 38 percent were satisfied and over half (55%) were dissatisfied. Even better for the governor, support for this year s plan cuts across party lines, with majorities of Republicans (72%), independents (62%), and Democrats (51%) voicing approval. But there s a twist. Although Californians support the governor s budget proposal, only 18 percent prefer his approach when it comes to making tough choices about the budget; 39 percent prefer the Democrats approach, and 23 percent prefer the Republicans. Even among Republicans, a majority (53%) prefer that Republican lawmakers make the decisions rather than the governor (29%), and Democrats, not surprisingly, heavily favor Democratic lawmakers (70%) over the governor (10%). This is a striking example of just how cynical Californians have become toward government leadership when they simultaneously like what a leader is saying but doubt that he can carry it out, says PPIC statewide survey director Mark Baldassare. These past few years of budget and political crises have fatigued voters and worn down their faith in elected officials. Policy Bull s-eye? Infrastructure Plan, Minimum Wage Hike Hit the Mark A large majority (68%) of residents also support the central proposal of the governor s State of the State address spending $222 billion over 10 years to rebuild the state s infrastructure without raising taxes. And this proposal has even greater bipartisan support than his budget plan (Republicans 72%, independents 71%, Democrats 64%). A second proposal presented in the address to increase the state minimum wage from $6.75 to $7.75 by July 2007 is also overwhelmingly embraced by residents (81%) and by large majorities across political parties (Democrats 91%, independents 81%, Republicans 66%). How important are these successes and what do they mean politically? The favorable response to the infrastructure plan, even at this stage, is an auspicious sign, says Baldassare. The question is whether the governor has, or will have, the political clout to see this grand ambition through. The Ratings Game: Governor s Glass Is Half Full? Is the governor beginning to reconnect with residents and voters? Upticks in his job approval rating suggest he may be: Among all Californians, his overall rating climbed 7 points from October (33% to 40%), and his overall disapproval rating declined (58% to 52%). Among likely voters, approval also - v -
8 Press Release jumped by 7 points (38% to 45%) and disapproval dropped (57% to 48%). Not surprisingly, strong partisan divisions surface, with far fewer Democrats (20%) than Republicans (72%) or independents (40%) feeling favorable toward the governor. The improvement in his rating is modest, however, considering that the governor s overall approval stood at 60 percent one year ago. Perhaps even more important, when asked how he is doing on specific issues, residents give him low marks. In fact, the only issue for which he receives a rating equal to or higher than his overall rating is crime and punishment (54% approval). His approval ratings on K-12 education (30%), state budget and taxes (35%), transportation and traffic congestion (38%), and jobs and the economy (39%) are lower. However, although the governor s overall approval rating is much lower today than it was earlier in his term, he still does better than the legislature: Only 29 percent of all Californians and 25 percent of likely voters approve of the job the legislature is doing. Moreover, nearly half (48%) of state residents do not believe the governor and legislature will be able to work together and accomplish a lot in the coming year (43% say they will). Once Bitten, Twice Shy: Unexpected Revenue Surplus Leaves Residents Cold Despite a slightly better view of the governor, Californians general outlook has soured. Today, 56 percent of residents say the state is going in the wrong direction, compared to 41 percent a year ago. A striking example of residents pessimism? The state s recent revenue windfall has created the rosiest budget picture since 2001, yet has only mildly lightened Californians budgetary angst: 61 percent still say the budget situation is a big problem, compared to 70 percent one year ago. Perhaps even more telling, nearly three-fourths (72%) do not believe the budget situation has improved at all in the past two years, despite the recent revenue surge. Infrastructure Spending Priorities Clear; Strong Early Showing for Bond Measures Skepticism about the benefit of the state s revenue surplus aside, Californians often have different ideas about how the additional funding should be spent. Of the five types of public works programs outlined in Governor Schwarzenegger s infrastructure plan, more residents believe education facilities (48%) should be the top priority over transportation projects (25%), water systems (17%), jails and prisons (3%), or courts (2%). These views are consistent with general spending priorities: Majorities of Californians think the state should spend more on K-12 education (71%) and roads and infrastructure (58%), while about one-quarter (24%) want more spent on corrections and prisons. When it comes to transportation a major component of the governor s plan there is no consensus about the most important type of project: 38 percent of residents say freeways and highways, 29 percent say transit systems, and 24 percent say local streets and roads. Many of the differences are regional. For example, residents of the San Francisco Bay Area (33%) are less likely than residents in the Central Valley (41%) or Southern California (47%) to rate freeways as the top priority. Nevertheless, two infrastructure bonds proposed for next November s statewide ballot are enjoying widespread support. Fifty-seven percent of likely voters support the governor s $25 billion bond proposal to pay for school facilities and other infrastructure projects without new taxes. Even more (68%) support a $10 billion bond by Senate Pro Tem Don Perata, also for infrastructure projects and including no new taxes. With surplus revenues available, and bond proposals doing well, Californians have choices about how they d like the state to pay for large-scale infrastructure projects but there is no consensus about which method is best: voters are divided between using surplus funds only (29%), issuing state bonds (23%), increasing user fees (20%), and increasing taxes (15%). Tax Cigarettes and the Rich While most tax increases remain unpopular with residents, Californians favor raising cigarette taxes (71%) and taxes on high-income individuals (65%). Predictably, two citizen s initiatives that seek to raise these taxes and are headed for 2006 ballots, are enjoying strong early support. One would raise - vi -
9 Press Release taxes on personal income above $400,000 annually to pay for universal preschool and is supported by 63 percent of likely voters. The other would increase taxes on a single pack of cigarettes by $2.60 to pay for children s health insurance and other health programs and is supported by 64 percent of likely voters. It s never been very difficult to increase taxes for certain groups, such as smokers, says Baldassare. But sources of revenue based on small segments of the population will inevitably dry up. The difficult question is how to pay for the state s growing population and infrastructure needs using sustainable, fiscally sound methods. More Key Findings Bush and Iraq score low (pages 13 and 14) Large majorities (65%) of Californians disapprove of President Bush s handling of the situation in Iraq. Further, most say the effort is not going well (62%) and that it was not worth it to go to war (62%). Immigration Policy: Leave border patrolling to government (page 16) Far more residents want law enforcement, rather than citizen volunteers, to patrol U.S. borders (64% to 32%). Among Latinos, numbers are overwhelmingly in favor of law enforcement (84% to 12%). Poverty paradox (page 17) While majorities of Californians say poverty is a big problem (57%), and that it is government s responsibility to take care of people who can t take care of themselves (68%), only 39 percent believe the nation spends too little on assisting the poor. A majority (55%) say we spend the right amount or too much. Avian Flu: Confidence in Feds mixed; personal anxiety low (page 18) Residents are divided about whether or not the federal government can handle an outbreak of the avian flu (47% can, 49% cannot). But most (72%) are not worried about the disease affecting them. About the Survey This survey on the California state budget made possible by funding from The James Irvine Foundation is a special edition of the PPIC Statewide Survey. This is the sixth survey in a series intended to raise public awareness, inform decisionmakers, and stimulate public discussions about issues related to the California state budget and underlying fiscal system. Findings of this survey are based on a telephone survey of 2,003 California adult residents interviewed between January 11 th and January 18 th, Interviews were conducted in English and Spanish. The sampling error for the total sample is +/- 2%. The sampling error for subgroups is larger. For more information on methodology, see page 19. Mark Baldassare is research director at PPIC, where he holds the Arjay and Frances Fearing Miller Chair in Public Policy. He is founder of the PPIC Statewide Survey, which he has directed since His recent book, A California State of Mind: The Conflicted Voter in a Changing World, is available at PPIC is a private, nonprofit organization dedicated to improving public policy through objective, nonpartisan research on the economic, social, and political issues that affect Californians. The institute was established in 1994 with an endowment from William R. Hewlett. PPIC does not take or support positions on any ballot measure or on any local, state, or federal legislation, nor does it endorse, support, or oppose any political parties or candidates for public office. This report will appear on PPIC s website ( on January 26. ### - vii -
10 Governor's Infrastructure Plan 9 Percent Satisfied with Governor's Budget Plan Percent all adults Approve 10 Percent all adults Disapprove Don't know 0 30 Most Important Problem for Governor and Legislature to Work on in Infrastructure Funding Preferences Percent all adults Education, schools State budget, taxes Immigration Economy, jobs 25 Percent all adults Education facilities Surface transportation Water systems/flood control Jails and prisons Courts Other/Don't know Infrastructure Funding Sources Approval Ratings Percent all adults Percent all adults 24 Use only surplus funds Issue state bonds Increase user fees Increase taxes Other No increase/don't know 10 0 Governor State Legislature President
11 Fiscal Perceptions California State Budget Many Californians are still expressing concern about the state s budget situation even though the state has surplus funds this year due to an unexpected increase in tax revenues. After Governor Arnold Schwarzenegger released his fiscal budget plan on January 10 th, six in 10 adult residents, and 68 percent of likely voters say the gap between spending and revenues is a big problem for California. A somewhat higher proportion of adults, 70%, saw the state s budget situation as a big problem in January 2004 and in January 2005, when the state faced a multi-billion dollar gap between spending and revenues. Public concern about the state s budget gap between spending and revenues is high across all regions of the state today. Democrats (65%), independents (63%) and Republicans (63%) hold similar perceptions, as do those who approve (60%) and disapprove (63%) of the governor s job performance. Whites (66%) are more likely than Latinos (52%) to think the budget situation is a big problem, and concerns about the state s fiscal situation increase with age, education, and income. Do you think the state budget situation in California that is, the balance between government spending and revenues is a big problem, somewhat of a problem, or not a problem for the people of California today? Region Adults Central Valley SF Bay Area Los Angeles Other Southern California Big problem 61% 63% 63% 61% 59% 68% Somewhat of a problem Not a problem Don't know As further evidence of public concern about the state s fiscal health, the majority of Californians say there has been no improvement in the state s budget situation in the past two years. One in five adults says the state budget situation has improved, while seven in 10 say the situation is the same (39%) or worse (33%). voters hold similar views. Residents in Los Angeles and the San Francisco Bay Area are less likely than others to see improvement in state budget trends. Currently, 36 percent of Republicans say the budget has improved, compared to 14 percent of Democrats and 22 percent of independents. Those who approve of Schwarzenegger s job performance (39%) are far more inclined to see improvement since 2004 than those who disapprove of his performance in office (9%). In the past two years, do you think the state budget situation has improved, gotten worse, or stayed the same? Improved 21% 14% 36% 22% 24% Gotten worse Stayed the same Don't know
12 California State Budget Spending Priorities We also asked respondents if they think the state government should spend more money, less money, or the same amount of money on the four major categories of the state budget, as well as on roads and infrastructure, an issue that has been a focus of recent discussions by the governor and legislature. Where are Californians most willing to see the state spend more money, given their concerns about the state budget situation today? Seven in 10 adults, and 66 percent of likely voters, think that the state should spend more money for K-12 public schools. However, Democrats (83%) and independents (73%) are much more likely than Republicans (50%) to favor increased state spending for K-12 public schools. There is majority support for more spending on health and human services (61% adults, 55% likely voters) and higher education (56% adults, 51% likely voters). For these two categories, Democrats and independents are more supportive of increased spending than are Republicans. The only area in which the majority of adults, and voters in both parties, prefer to have either less or the same spending is prisons. About six in 10 Californians want the state government to spend more money on roads and infrastructure (58% adults, 59% likely voters). For this spending area, there is solid support among Democrats (60%), Republicans (60%) and independents (55%) and across geographic regions. When last asked about roads and infrastructure in February 2003, just 27 percent of adults preferred more spending. For each area, please tell me if you think that the state government should spend more money than it does now, the same amount as now, or less money than now... How about the K through 12 public education system? More money 71% 83% 50% 73% 66% Same amount of money Less money Don't know More money How about health and human services? How about roads and other infrastructure projects? How about public colleges and universities? How about the state's corrections system, including prisons? Same amount of money Less money Don t know More money Same amount of money Less money Don't know More money Same amount of money Less money Don't know More money Same amount of money Less money Don t know
13 Tax Preferences California State Budget Californians have often shown support for specific state tax increases in our surveys, especially if they are earmarked for purposes that they value, while they typically reject the types of state tax increases that would affect everyone. In the current survey, Californians strongly support tax increases aimed at those in the top tax bracket, and they also favor raising taxes on cigarette purchases, as ways to help pay for state spending. We also found strong support for raising taxes on high-income Californians in our January 2004 and January 2005 surveys (71%, 69%) and taxes for both alcohol and cigarette sales also had solid support (76%, 74%). In the same earlier surveys, Californians strongly objected to raising the state sales tax and vehicle license fees as ways to reduce the state s gap between spending and revenue. Today, as in earlier surveys, there is solid support among adults and likely voters for higher taxes on high-income residents (65%, 66%) and cigarette purchases (71%, 70%). Solid majorities across racial/ ethnic and socioeconomic categories, and regions, support raising these two types of state taxes. While solid majorities across voter groups favor increasing taxes on cigarette purchases, Republicans are much more likely than others to oppose increasing taxes on high-income residents. Tax and fee increases could be used to help pay for state spending. For each of the following, please say if you favor or oppose the proposal How about raising the top Favor 65% 79% 46% 67% 66% rate of the state income tax paid by the wealthiest Oppose Californians? Don't know How about increasing taxes on the purchase of cigarettes? Favor Oppose Don't know Californians also show considerable interest in raising spending for education and health programs. An initiative headed for the June 2006 ballot that would increase taxes for high-income residents to pay for voluntary public preschool currently enjoys solid support among adults (66%) and likely voters (63%), similar to the overall level of support for raising taxes on the wealthy. Another initiative that may qualify for the November 2006 ballot would raises taxes on cigarettes to pay for health programs, and it also has strong support (69% adults, 64% likely voters), similar to general support for raising cigarette taxes. For both tax initiatives, Republicans are less supportive than other voters. How would you vote on these tax and spending initiatives if an election were held today? How about increasing taxes by 1.7 percent on individual incomes above $400,000 dollars annually, and $800,000 dollars for couples, to pay for voluntary public preschool for all 4-year old children? How about increasing taxes on the purchase of cigarettes by $2.60 per pack to pay for children's health insurance, hospital emergency room care, and other health treatment and prevention programs? Yes 66% 77% 49% 66% 63% No Don't know Yes No Don't know January 2006
14 California State Budget Fiscal Policy Preferences While most Californians disapprove of the legislature s job performance, they nevertheless prefer the legislature to the governor when it comes to making choices on the state budget. Thirty-nine percent prefer the Democrats in the legislature, 23 percent prefer Republicans in the legislature, and 18 percent prefer Governor Schwarzenegger. In contrast, our January 2004 survey found the governor (33%) was favored over the Democrats in the legislature (27%) and the Republicans in the legislature (17%) in making budget choices. In our January and May 2005 surveys, the voters preferred the Democrats in the legislature over the governor in making decisions about taxes and state funding, but for the first time, the current survey shows Republican legislators slightly favored over the governor in budget decisions. Opinions about who should have the most say in budget decisions vary sharply across party lines. Democrats favor Democratic legislators over others by an overwhelming margin. Republican voters favor Republican legislators over Governor Schwarzenegger by a wide margin (53% to 29%), while they favored the governor in 2004 and 2005 surveys. Independents express no strong preference today, while they favored the governor over both Democratic and Republican legislators two years ago. Those who approve of Governor Schwarzenegger are mostly likely to want him to make the budget decisions (37%), while those who disapprove of him want the Democratic legislators to make fiscal choices (59%). When it comes to the tough choices involved in the state budget, both in deciding how much Californians should pay in taxes and how to fund state programs, whose approach do you most prefer? Governor Schwarzenegger 18% 10% 29% 20% 20% Democrats in the legislature Republicans in the legislature Other None (volunteered) Don't know Californians favor a state government with higher taxes and more services over lower taxes and fewer services by a 30-point margin today (61% to 31%). voters also prefer higher taxes and more services by a 20-point margin (56% to 36%). The differences across political groups on this issue are large today: The majority of Democrats (76%) and independents (61%) prefer to pay higher taxes and have more services, while Republicans strongly prefer lower taxes and fewer services (59%). Whites (52%) are much less likely than Latinos (79%) to prefer the higher tax and higher services choice. Which of the following statements do you agree with more I'd rather pay higher taxes and have a state government that provides more services, or I'd rather pay lower taxes and have a state government that provides fewer services? Higher taxes and more services 61% 76% 33% 61% 56% Lower taxes and fewer services Don't know
15 State of the State Address California State Budget Governor Schwarzenegger s third State of the State speech on January 5 th received mixed reviews overall. Thirty-four percent say they had a favorable impression and 34 percent an unfavorable impression of the speech, and one in three adults say they haven t heard enough about it (25%) or are undecided (7%). The governor s State of the State address in 2005 was more positively perceived by adults last January (44% favorable, 32% unfavorable) as was his 2004 speech two years ago (42% favorable, 18% unfavorable). Among likely voters this year, 39 percent are favorable and 32 percent are unfavorable toward the 2006 speech, and overall favorability varies strongly across party groups (55% Republicans, 38%, independents, 24% Democrats). Still, two of the specific proposals that the governor outlined in the speech are strongly supported by the public, and receive high levels of approval across party lines. The major theme of the State of the State address was the governor s plan to spend $222 billion over 10 years on roads and other infrastructure, without raising taxes. Solid majorities approve of his infrastructure plan (68% adults, 64% likely voters). Consensus is high across party groups, major regions, and demographic groups. Solid support for this plan is evident among those who approve and disapprove of the governor (77%, 62%). Do you approve or disapprove of the governor's plan to spend $222 billion over 10 years on infrastructure projects including surface transportation, education facilities, air quality, water and flood control, jails and prisons, and courts? Approve 68% 64% 72% 71% 64% Disapprove Don't know Moreover, the governor s proposal to increase the state s minimum wage from $6.75 to $7.75 by July 2007 is overwhelmingly supported by adults (81% approve) and likely voters (77% approve). Across party groups, there is solid support for a minimum wage increase (91% Democrats, 66% Republicans, 81% independents), and approval is very high across regions and demographic groups. Since the defeat of his package of reform initiatives in the November 2005 special election, Governor Schwarzenegger has said that he will seek to work together with the state legislature this year. After the election, three in four voters disapproved of the way the governor and legislature were working together. Today, Californians are divided when asked if the governor and legislature will be able to work together and accomplish a lot in the next year (43%, 48%). A minority of likely voters and of voters across political parties say the two sides will be able to find common ground in However, those who approve of Governor Schwarzenegger s job performance (55%) are more likely than those who disapprove (34%) to say that the two sides will be able to work together and accomplish a lot this year. Do you think that Governor Schwarzenegger and the state legislature will be able to work together and accomplish a lot in the next year, or not? Yes, will be able to work together 43% 41% 48% 39% 41% No, will not be able to work together Don't know January 2006
16 California State Budget Governor s Budget Proposal Governor Schwarzenegger released a budget plan for the fiscal year on January 10 th that includes increased state spending for K-12 public schools, for health and human services, for higher education, for corrections and prisons, and for transportation, without any new taxes. Californians respond favorably to this proposed budget, with 60 percent saying they are satisfied with it and 28 percent saying they are dissatisfied. Californians had much less favorable reactions to the governor s budget last January (38% satisfied, 55% dissatisfied) and similar responses to his budget plan in January 2004 (57% satisfied, 30% dissatisfied). Satisfaction today is higher among Republicans and independents than among Democrats. Still, Democrats are considerably more satisfied with the governor s budget plan than last January (51% to 21%). Overall, there is majority satisfaction with the budget plan across major regions and demographic groups. In general, are you satisfied or dissatisfied with the Governor s budget plan? * Satisfied 60% 51% 72% 62% 58% Dissatisfied Haven't heard anything about the budget (volunteered) Don't know An unexpected surge in revenues provides surplus funds for next year s budget. How should this additional money be spent? Californians look favorably on the governor s plans to use the money to increase K-12 public education funding (78%), and to roll back tuition fee increases by increasing state funding for public colleges and universities (63%). Additionally, Californians favor reducing the amount of state debt (76%). Increasing spending for all of these purposes is strongly supported across all regions of the state, racial/ethnic groups, and all demographic groups. However, Democrats are more supportive of increased spending for K-12 and higher education than are Republicans and independents, while all three voter groups strongly support the use of surplus revenues to reduce the amount of debt. Do you favor or oppose using some of this additional money to Increase K through 12 public education funding? Reduce the amount of state debt? Rollback tuition fee increases by increasing funding for public colleges and universities? Favor 78% 85% 63% 75% 73% Oppose Don't know Favor Oppose Don't know Favor Oppose Don't know * For complete question wording, see question 26 in the survey questionnaire, page
17 Most Important Problem in 2006 State Issues When Californians were asked to name the one issue that is most important for the governor and legislature to work on this year, their top concern is education and schools (25%), followed by the state budget (12%), immigration (11%), and jobs and the economy (10%). Fewer than one in 10 adults name any other single issue, including health care, crime and gangs, and roads and infrastructure. Compared to two years ago, when Governor Schwarzenegger was beginning his term in office, fewer residents today are naming as the top issue the state budget (31% to 12%) or the economy (21% to 10%), while more are mentioning education (15% to 25%). Similarly, one year ago, more residents mentioned fiscal or economic issues as the top priority, while a similar percentage last year and this year considered education the most important issue (22% to 25%). Education is considered the top issue by residents in the Central Valley, Los Angeles, and the San Francisco Bay Area, while an equal percentage of residents in the Other Southern California region name immigration and education as the principal issues to be addressed by the governor and legislature. Latinos (25%) and whites (23%) are similar in mentioning education and schools as the top issue, while whites (17%) are more likely than Latinos (6%) to point to the state budget. The ranking of issues by likely voters is similar to all adults. However, there are differences across political groups. Democrats are more likely than Republicans to mention education as the top priority (31% to 18%). In contrast, Republicans are more likely than Democrats to mention immigration as the most important issue (19% to 6%). Education is a top priority across all income groups and for those with and without children under eighteen years old. Mention of the state budget as the top policy priority for this year tends to increase with income, education, age, and homeownership. A majority of residents believe that the state is headed in the wrong direction (56%) rather than the right direction (37%). However, the percentage who say the state is headed in the wrong direction varies somewhat across parties (61% Democrats, 55% independents, 49% Republicans). One year ago, 46 percent of adults said the state was headed in the right direction while 41 percent thought it was going in the wrong direction, similar to January 2004 (43% right direction, 40% wrong direction). Still, perceptions about the state of the state are more positive today than in October (30% right direction, 60% wrong direction). Perceptions of the state s economy have also significantly improved (October: 32% good times, January: 48% good times). Which one issue facing California today do you think is the most important for the governor and state legislature to work on in 2006? Region Top seven mentions Adults Central Valley SF Bay Area Los Angeles Other Southern California Education, schools 25% 20% 34% 29% 18% 26% State budget, deficit, taxes Immigration, illegal immigration Economy, jobs, unemployment Health care, costs Crime, gangs, drugs Roads, infrastructure
18 State Issues Job Performance Ratings for State Officials The approval ratings for the legislature remain near historic lows: 29 percent of adults approve and 57 percent disapprove of the legislature s overall job performance. The percent approving is slightly higher than it was immediately prior to the special election (October: 25% approve, 56% disapprove, 19% don t know). One year ago, 37 percent approved and 50 percent disapproved of the legislature s performance, similar to the 36 percent who approved and 46 percent who disapproved in January Today, the approval ratings of the state legislature are somewhat lower among likely voters than among all adults. Democrats are the most approving, while Republicans are the most disapproving in their overall assessments of the legislature; majorities across all political groups disapprove of the way the legislature is doing its job. Across the state s regions, solid majorities disapprove of its performance. Approval ratings are higher among Latinos (33%) than among whites (26%). Overall, do you approve or disapprove of the way that the California legislature is handling its job? Region Central Valley SF Bay Area Los Angeles Other Southern California Approve 29% 31% 22% 28% 27% 29% 29% 28% 25% Disapprove Don't know Governor Schwarzenegger s approval ratings among all adults now stands at 40 percent approve and 52 percent disapprove, compared to 33 percent who approved and 58 percent who disapproved in our October survey. Among likely voters today, 45 percent approve and 48 percent disapprove of the way the governor is handling his job; among registered voters, 43 percent approve and 50 percent disapprove. The governor s approval rating among adults is still much lower now than it was in January 2005 (60%) and in January 2004 (59%). Sharp partisan differences are apparent in this month s approval ratings. Republicans (72%) overwhelmingly approve of the governor s job performance, while an equal proportion of Democrats disapprove (72%); independents are more divided (40% approve, 52% disapprove). Compared to the October survey, the governor s standing has improved in all voter groups (Democrats: 12% to 20%; independents 31% to 40%; Republicans 69% to 72%). We continue to see a significant racial/ethnic gap in the governor s ratings: Today, 51 percent of whites compared to 23 percent of Latinos approve of his performance in office. While a majority of residents in the San Francisco Bay Area and Los Angeles disapprove of the way the governor is handling his job, those in the Other Southern California region and the Central Valley are divided. Overall, do you approve or disapprove of the way that Arnold Schwarzenegger is handling his job as governor of California? Region Central Valley SF Bay Area Los Angeles Other Southern California Approve 40% 20% 72% 40% 46% 36% 32% 48% 45% Disapprove Don't know
19 Governor s Report Card State Issues Many Californians say they disapprove of the governor s job performance when it comes to the specific issues of K-12 public schools (55%), the state budget and taxes (53%), and jobs and the economy (47%) three of the top issues that Californians say they want their state s officials to work on in As for a topic that the governor stressed in his State of the State address traffic and transportation the governor receives mixed reviews (38% approve, 41% disapprove). Of the five issues that we asked about, the governor receives the highest grade for his handling of crime and punishment issues (54% approve). The governor s approval ratings have significantly declined in some areas since our January 2005 survey when we asked about his handling of jobs and the economy (56% to 39%) and the state budget and taxes (48% to 35%), while his approval ratings with respect to K-12 public schools and traffic and transportation have not changed much. We did not ask about crime and punishment last year. Since May 2005, the governor s ratings on schools and the budget have remained about the same, while approval with respect to his handling of transportation issues has increased by 10 points (28% to 38%). Democrats are more critical of the governor s handling of public schools than of his management of other issues. Across all party divisions, the governor receives his highest approval ratings on crime and punishment issues. San Francisco Bay Area and Los Angeles residents give the governor lower approval ratings than residents in the Central Valley and Other Southern California on all issues. Latinos give him lower approval ratings than whites on all issues. When Gray Davis was running for reelection, his approval ratings in early 2002 were higher than Schwarzenegger s approval ratings today on the economy, K-12 public schools, and the state budget. Davis s approval ratings among adults in January 2002 were: crime and punishment (52% approve, 29% disapprove), jobs and the economy (45% approve, 39% disapprove), state budget and taxes (42% approve, 46% disapprove), K-12 public schools (39% approve, 40% disapprove), and transportation and traffic congestion (39% approve, 45% disapprove). Do you approve or disapprove of the way that Governor Schwarzenegger is handling Crime and punishment issues The issue of jobs and the economy in California The issue of transportation and traffic congestion The issue of the state budget and taxes The state's K-12 public education system Approve 54% 43% 76% 56% 57% Disapprove Don't know Approve Disapprove Don't know Approve Disapprove Don't know Approve Disapprove Don't know Approve Disapprove Don't know January 2006
20 State Issues Infrastructure Priorities When asked which one of five types of public works projects in the governor s infrastructure plan should receive top priority, education facilities are mentioned by 48 percent of adults, followed by surface transportation (25%), water systems and flood control (17%), jails and prisons (3%), and courts (2%). In previous PPIC Statewide Surveys, Californians also named education facilities as their top priority when given somewhat different lists of public works projects (40% in June 2004, 48% in November 2002). Although the governor s infrastructure plan emphasizes spending on transportation, Californians in nearly all demographic groups rate education facilities as the top spending priority. Across party divisions, Republicans are more in line with Schwarzenegger s spending priorities (39% transportation, 36% education) than are Democrats (54% education, 19% transportation) or independents (52% education, 26% transportation). Which of the following do you think should have the top priority for additional state funding? Region Adults Central Valley SF Bay Area Los Angeles Other Southern California Education facilities 48% 35% 55% 51% 47% 44% Surface transportation Water systems and flood control Jails and prisons Courts Other Don't know Following trends in earlier PPIC Statewide Surveys, there is no consensus about the type of surface transportation project that should have top priority. While nearly four in ten adults (38%) say freeways and highways, over half name either public bus and transit systems (29%), local streets and roads (24%), or carpool lanes (7%). Freeways and highways are the top priority outside of the San Francisco Bay Area. Republicans are more likely than Democrats (51% to 33%), and whites are more likely than Latinos (41% to 34%) to name freeways and highways as the top priority. As income increases, residents are more likely to name freeways and highways, while mention of public buses and transit increases with education. Which of the following types of surface transportation projects do you think should have the top priority for additional state funding? Region Adults Central Valley SF Bay Area Los Angeles Other Southern California Freeways and highways 38% 41% 33% 34% 47% 40% Public bus and transit systems Local streets and roads Carpool lanes Other Don't know
21 Infrastructure Bonds State Issues Californians strongly support an infrastructure bond proposal of about $25 billion that has been proposed by Governor Schwarzenegger for the 2006 statewide ballot as part of his 10-year investment plan. About six in 10 adults (65%) and likely voters (57%) say they would vote yes on this bond measure if an election were held today. Some differences emerge across political and demographic groups. Interestingly, Democrats (66%) and independents (70%) are more likely than Republicans (57%) to endorse Schwarzenegger s proposal, while those who disapprove of the governor s job performance (66%) are about as likely as those who approve (62%) to favor the $25 billion bond. Support for this bond is greater in Los Angeles (68%) and Other Southern California (66%) than in the Central Valley or the San Francisco Bay Area (61% each). Latinos (78%) are much more likely than whites (57%) to say they would vote yes. Support declines with age, education, and income. Still, majorities in all political, regional, and demographic groups say they would vote yes on this state bond. If an election were held today, would you vote yes or no on a state bond of about 25 billion dollars for infrastructure projects such as education facilities, surface transportation, and water facilities to be paid through the state's general funds with no new taxes? Yes 65% 66% 57% 70% 57% No Don't know California Senate President Pro Tem Don Perata (D-Oakland) is proposing an infrastructure bond measure of approximately $10 billion. An even greater majority of Californians (73%) and likely voters (68%) say they would vote yes on a $10 billion infrastructure bond that would be paid through the general fund and that would include no new taxes. Large majorities of independents (78%), Democrats (74%), and Republicans (69%) would vote yes on this infrastructure bond if an election were held today. Across regions, more residents in Los Angeles (77%), the Other Southern California region (75%) and the San Francisco Bay Area (72%) would vote yes than in the Central Valley (66%). Majorities in all demographic groups would vote yes on this $10 billion bond measure. However, Latinos (80%) are more likely than whites (69%) to say they would vote yes. Support for this bond measure declines somewhat with age, homeownership, income, and education. Solid majorities would vote yes on this bond among both those who approve (74%) and disapprove (73%) of the governor and those who think the state is headed in the right direction (82%) and the wrong direction (68%). If an election were held today, would you vote yes or no on a state bond of about 10 billion dollars for infrastructure projects such as education facilities, surface transportation, and water facilities to be paid through the state's general fund with no new taxes? Yes 73% 74% 69% 78% 68% No Don't know January 2006
22 State Issues Infrastructure Funding How should the state government pay for more roads and other infrastructure projects? Despite considerable support for increasing spending on infrastructure, Californians are divided on how to pay for it. Three in ten adults (31%) and likely voters (29%) believe the state should use only surplus budget funds. Another 24 percent of adults (23% of likely voters) would prefer that the state issue bonds, and 17 percent (20% of likely voters) would prefer increasing user fees. Raising taxes to pay for more infrastructure is the least popular approach, favored by just 14 percent of adults and 15 percent of likely voters. No single infrastructure funding method receives majority support in any political or demographic group. Republicans (35%) are more likely than Democrats (30%) or independents (28%) to prefer that the state use only surplus budget funds, while about one in four in each of these voter groups supports issuing state bonds. Residents in the Other Southern California region and Los Angeles (34% each) are more likely than those in the Central Valley (29%) and the San Francisco Bay Area (27%) to believe the state should use only surplus budget funds. Latinos are more likely than whites (36% to 28%) to name surplus funds, while whites are more likely than Latinos to name user fees (21% to 11%). Fewer than one in four in all political, regional, and demographic groups favor an increase in user fees or taxes. How would you most prefer that the state government increase the level of current funding for roads and other infrastructure projects? Use only surplus budget funds 31% 30% 35% 28% 29% Issue state bonds Increase user fees Increase taxes Should not increase current level of funding (volunteered) Other Don't know Not only is increasing state taxes for funding more infrastructure unpopular, but so is the idea of changing the two-thirds majority to a 55 percent majority vote for passing a local sales tax for transportation projects. A majority of adults (53%) and likely voters (58%) would vote no, while four in ten adults (41%) and likely voters (37%) would vote yes. Republicans (62%) and independents (56%) are more likely to reject this proposal than Democrats (45%), and whites (59%) are more likely to vote no than Latinos (41%). Californians were more inclined to change the two-thirds vote in November 2002 (49% yes, 45% no). What if there was a state measure that would change the two-thirds majority to a 55 percent majority for passing local sales tax for transportation projects. Would you vote yes or no? Yes 41% 49% 34% 39% 37% No Don't know
23 President s Ratings National Issues Heading into his State of the Union address on January 31 st, President George W. Bush s overall job approval rating among Californians is at 38 percent; 60 percent disapprove of his performance. Among likely voters, Bush s approval rating is the same. The president s approval rating today is eight points lower than it was a year ago (46% approved, 52% disapproved), and similar to PPIC s October 2005 survey (36% approved, 60% disapproved). Since its high point of 79 percent in December 2001, the president s approval rating has fallen 41 points. Californians approval of the president today is slightly lower than in the nation as a whole, according to a recent Gallup Poll (43% approve, 53% disapprove). The president s ratings vary sharply by party, with 76 percent of Republicans approving, and 83 percent of Democrats and 71 percent of independents disapproving. A strong majority in the San Francisco Bay Area (71%) and Los Angeles (66%) disapprove of Bush s performance, while about half of Other Southern California and Central Valley residents approve (46% each). The president s ratings are higher for handling terrorism and homeland security issues (45% approve, 53% disapprove). voters ratings are similar. Bush s rating on this issue is virtually unchanged from PPIC s August 2005 survey (46% approved, 49% disapproved), but approval is down sharply from its high point of 85 percent in January Californians ratings are similar to the nation s, according to a November 2005 Newsweek Poll (45% approved, 49% disapproved). As with Bush s overall rating, a strong majority of Republicans (77%) approve of the president s handling of terrorism and homeland security, while a majority of Democrats (73%) and independents (63%) disapprove. Men are also somewhat more approving on this issue than are women (49% to 42%). Bush s ratings are much lower when it comes to his handling of the situation in Iraq (33% approve, 65% disapprove). Nationwide, 37 percent approve, according to a January 2006 CBS News Poll. Californians current sentiments on this issue are similar to a year ago (34% approved, 63% disapproved), but have declined since August 2003, when 50 percent approved of Bush s actions. Californians approval ratings on this matter again divide sharply along partisan lines: 72 percent of Republicans approve, while 84 percent of Democrats and 75 percent of independents disapprove. A majority in all regions, racial/ethnic groups, and demographic categories disapprove of the president s handling of Iraq, but approval is much higher among whites than Latinos (40% to 25%). Overall, do you approve or disapprove of the way that President Bush is handling? His job as president of the United States? Terrorism and homeland security issues? The situation in Iraq? Approve 38% 16% 76% 26% 38% Disapprove Don't know Approve Disapprove Don't know Approve Disapprove Don't know
24 National Issues U.S. Effort in Iraq Californians remain pessimistic about the U.S. effort in Iraq, with 62 percent saying things are not going too well (25%) or not going at all well (37%) and 35 percent saying things are going very (8%) or somewhat well (27%). voters views on the war are slightly more positive than the views of all Californians. A year ago, 30 percent of adults said things were going somewhat or very well, and 69 percent said not too well or not at all well. Today, the percentage of all adults who say things are not going at all well is only slightly lower than in August 2005 (40%), but is still significantly higher than in August 2003 (19%). Opinions on Iraq are divided along party lines, with an overwhelming majority of Democrats (81%) and independents (70%) saying things are not going too well or not going at all well, and most Republicans saying things are going at least somewhat well (70%). Fewer than half of the respondents in any region are positive about the Iraq situation, with four in 10 in the San Francisco Bay Area (40%) and Los Angeles (45%) saying things are not going at all well. Latinos are more likely to hold this negative view than whites (44% to 32%), and women more than men (40% to 33%). In general, how would you say things are going for the U.S. in Iraq very well, somewhat well, not too well, or not at all well? Very well 8% 3% 20% 6% 9% Somewhat well Not too well Not at all well Don't know A majority of California adults (62%) and likely voters (61%) continue to think it was not worth going to war in Iraq. These findings are similar to those in PPIC s August 2004 (61% not worth it) and August 2005 (64% not worth it) surveys. In the nation as a whole, feelings are somewhat different. According to a January CNN/USA Today/Gallup Poll, Americans nationwide (46%) are more likely than Californians (34%) to feel the war was worth it. Again, most Democrats (80%) and independents (68%) think it was not worth going to war, while a majority of Republicans (72%) say it was. Fewer than half of the respondents in any region think the war was worth it, with assessments especially negative in the San Francisco Bay Area and Los Angeles (70% each saying not worth it) compared to elsewhere in the state. Latinos are considerably more negative than whites (71% to 56%), as are younger people and women. in all, do you think it was worth going to war in Iraq, or not? Yes, worth it 34% 16% 72% 24% 35% No, not worth it Don't know
25 U.S. Homeland Security National Issues In the wake of news that the National Security Agency began a domestic spying program in 2002, Californians appear divided on the government s anti-terrorism policies. Forty percent are concerned that the government has not gone far enough to protect the country, while 45 percent are concerned that the government s anti-terrorism policies have gone too far in restricting the average person s civil liberties. Concern that the government has gone too far is up nine points from PPIC s August 2005 survey (36%). Californians are more worried than adults nationwide about the restriction of civil liberties. In a January Pew Research Center survey, 33 percent of adults nationwide expressed concern about this issue. California Republicans (62%) are much more likely than Democrats and independents (31% each) to be concerned that the government s policies have not gone far enough to protect the country. San Francisco Bay Area residents are most likely to say the government has gone too far (55%). Whites (45%) are much more likely than Latinos (33%) to worry that the government has not gone far enough; this view is also more prevalent among residents 55 and older and those with less than a college education. What concerns you more about the government's anti-terrorism policies that they have not gone far enough to protect the country or that they have gone too far in restricting the average person s civil liberties? Not gone far enough 40% 31% 62% 31% 42% Gone too far Neither (volunteered) Don't know Californians are also divided over whether it is necessary to give up some civil liberties in order to curb terrorism in this country (48% agree, 47% disagree). Californians are more likely than the nation as a whole to think that giving up civil liberties is necessary. According to a July 2005 Pew Research Center Survey, 40 percent nationwide believe this is necessary, while 53 percent do not. The view that some civil liberties must be sacrificed to combat terrorism divides along party lines: Seven in 10 Republicans agree with it, but only 41 percent of Democrats and 48 percent of independents do. Agreement with this view is highest in Other Southern California (55%) and lowest in the San Francisco Bay Area (44%). Whites are more likely than Latinos to support this idea (51% to 43%), as are older and more affluent residents. Of those who say giving up some civil liberties is necessary, 53 percent are concerned that the government has not gone far enough to protect the country, while of those who say it is not necessary, 61 percent believe that the government has already gone too far. In order to curb terrorism in this country, do you think it is necessary to give up some civil liberties, or not? Yes, it is necessary 48% 41% 70% 48% 50% No, it is not necessary Don't know January 2006
26 National Issues Immigration Policy Two important issues are emerging within the debate over immigration policy. One is the guest worker program proposed by President Bush. The other is related to the role that citizen volunteers, known as Minutemen, should play in patrolling the borders. Californians strongly favor allowing illegal immigrants who have jobs in the United States to live and work here legally if they register with the government as a temporary guest worker. Seven in 10 Californians would support this policy, while 26 percent would oppose it. California mirrors the nation on this issue a December 2005 Time Poll found 72 percent nationwide favor a guest worker program, with 24 percent opposed. Support for a guest worker program is high among all political groups and across all regions of the state. More than two-thirds in all demographic groups would favor such a program, but support is higher among Latinos than whites (79% to 69%) and among foreign-born than among U.S.-born respondents (76% to 69%). Would you favor or oppose a program that would allow illegal immigrants who have jobs in the United States to live and work legally in the United States for a fixed period of time if they registered with the government as temporary guest workers so the U.S. government could keep track of them? Latino Favor 71% 71% 68% 71% 79% Oppose Don't know What about border patrols? Most Californians (64%) want the job of keeping illegal immigrants from crossing the borders to be left to government law enforcement, rather than allowing citizen Minutemen to do it (32%). Again, California mirrors the nation on this issue an October 2005 CBS News Poll found that most Americans nationwide believe that the government (65%) rather than the Minutemen (31%) should patrol the border. While a majority of Republicans (53%) support allowing Minutemen to patrol some borders, solid majorities of Democrats (73%) and independents (64%) are opposed to this practice. A majority of residents across all regions think patrolling should be left to the government; this opinion is more widely held in the Los Angeles area (72%) than in the Other Southern California region (54%). Latinos are far more likely than whites (84% to 53%) and the foreign-born are more likely than U.S.-born (79% to 58%) to oppose Minutemen patrols. Although support for the Minutemen falls below 50 percent in all demographic groups, it is higher among men than women (36% to 28%), and increases with age and income. Recently, citizen volunteers known as Minutemen have been patrolling some borders to keep out illegal immigrants. Should citizen volunteers be allowed to patrol the borders, or should patrolling the borders be left to government law enforcement? Latino owed 32% 23% 53% 34% 12% Left to government Don't know
27 Poverty National Issues With Hurricane Katrina recently turning a spotlight on the issue of poverty, nearly nine in 10 Californians say that poverty is a big problem (57%) or somewhat of a problem (30%) in our society today. According to an October 2005 Kaiser Family Foundation survey, 58 percent of Americans nationwide said poverty was a big problem and 25 percent called it somewhat of a problem. While majorities in all political parties in California say poverty is at least somewhat of a problem, Democrats (71%) are far more likely than Republicans (42%) and independents (57%) to call it a big problem. Women are more likely than men to see it as a big problem (65% to 48%), but there is no difference between whites (55%) and Latinos (54%) or across education groups. Although concern about poverty declines with income, a majority in all income groups call it a big problem in society today. How big a problem is poverty in our society today? Big problem 57% 71% 42% 57% 58% Somewhat of a problem Small problem Not a problem at all Don't know Echoing their concerns about poverty, a majority of Californians agree (68%) that it is the responsibility of government to take care of those who can t take care of themselves. Similarly, in PPIC s February 2004 survey, 69 percent of Californians mostly or completely agreed with this idea. While Democrats (81%) and independents (65%) are most likely to hold this view, a majority of Republicans (51%) also agree with it. Solid majorities in all racial and demographic groups say the government should take care of the needy, with agreement greater among Latinos than whites (77% to 62%) and women than men (70% to 65%). Do you agree or disagree with the following statement: It is the responsibility of government to take care of people who can't take care of themselves? Mostly/completely agree 68% 81% 51% 65% 65% Mostly/completely disagree Don't know Californians are divided on the amount of money the nation spends on assisting the poor, with 39 percent saying we spend too little, 23 percent saying too much, and 32 percent saying about the right amount. These results are similar to a January 2001 Kaiser Family Foundation national survey (38% too little, 18% too much, 36% about right). Most Democrats (55%) say we spend too little, while 40 percent of independents and 18 percent of Republicans say this. When asked for their perceptions about poor people, 51 percent say they have hard lives because government benefits don t go far enough, while 34 percent say they have it easy due to government benefits. Similarly, 47 percent of adults nationwide expressed the view that the poor have hard lives in an October 2005 Kaiser Family Foundation survey. Democrats (62%) are more likely than Republicans (31%) or independents (52%) to hold this view January 2006
28 National Issues Avian Flu Californians express little confidence that that the federal government could handle an outbreak of avian flu. Nearly half (49%) are not too confident (27%) or not at all confident (22%) in the government, while 33 percent are somewhat confident. Only 14 percent are very confident. Views are similar across California s regions. Nationwide, 43 percent are not too confident or not at all confident in the government on this issue, while 56 percent are very or somewhat confident, a CNN/USA Today/Gallup Poll found in December Confidence on this issue is greater among Republicans (57% very or somewhat confident) than Democrats (42%) or independents (39%). Confidence decreases with income and education. Latinos (59%) are more likely than whites (43%) to be very or somewhat confident in the federal government s ability to handle a bird flu crisis. How confident are you that the federal government could handle an outbreak of bird flu or avian flu in this country very confident, somewhat confident, not too confident, or not at all confident? Region Adults Central Valley SF Bay Area Los Angeles Other Southern California Very confident 14% 12% 12% 18% 14% Somewhat confident Not too confident Not at all confident Don't know Despite uncertainty about the federal government s abilities in this area, an overwhelming majority (72%) say they are not worried that they or someone in their family will be a victim of the bird flu virus. Nationwide, a similar 78 percent are not personally worried, according to the December 2005 CNN/USA Today/Gallup Poll. More than two in three Californians in all regions and political groups say they are not worried about the virus, with Republicans (81%) even less concerned than Democrats (72%) or independents (73%). Fears are considerably greater among Latinos than whites (49% to 15%) and are higher among younger people and those with less education and income. Personal concerns about being the victim of avian flu are somewhat higher among Californians who have children at home than those who do not (29% to 23%). Are you worried that you or someone in your family will be the victim of the bird flu virus, or not? Region Adults Central Valley SF Bay Area Los Angeles Other Southern California Yes, worried 25% 25% 24% 31% 22% No, not worried Neither (volunteered) Don't know
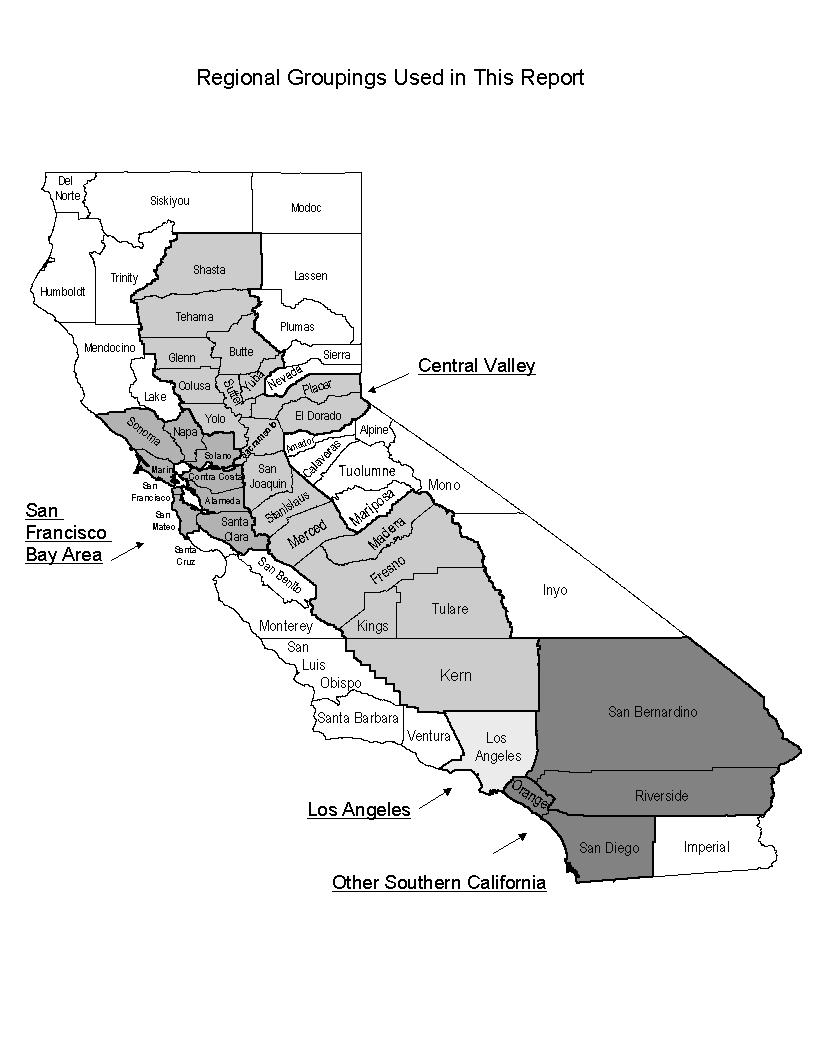
29 Survey Methodology The PPIC Statewide Survey is directed by Mark Baldassare, research director and survey director at the Public Policy Institute of California, with assistance in research and writing from Dean Bonner, project manager for this survey, and survey research associates Lunna Lopes, Jennifer Paluch, and Sonja Petek. The survey was conducted with funding from The James Irvine Foundation and benefited from discussions with Irvine staff and grantees, as well as regional focus groups with voters, funded by the foundation; however, the survey methods, questions, and content of the report were solely determined by Mark Baldassare. The findings of this survey are based on a telephone survey of 2,003 California adult residents interviewed between January 11 and January 18, Interviewing took place on weekday nights and weekend days, using a computer-generated random sample of telephone numbers that ensured that both listed and unlisted telephone numbers were called. telephone exchanges in California were eligible for calling. Telephone numbers in the survey sample were called up to six times to increase the likelihood of reaching eligible households. Once a household was reached, an adult respondent (age 18 or older) was randomly chosen for interviewing by using the last birthday method to avoid biases in age and gender. Each interview took an average of 20 minutes to complete. Interviewing was conducted in English or Spanish. Accent on Languages translated the survey into Spanish with assistance from Renatta DeFever. Schulman, Ronca & Bucuvalas, Inc. conducted the telephone interviewing. We used recent U.S. Census and state figures to compare the demographic characteristics of the survey sample with characteristics of California s adult population. The survey sample was closely comparable to the census and state figures. The survey data in this report were statistically weighted to account for any demographic differences. The sampling error for the total sample of 2,003 adults is +/- 2 percent at the 95 percent confidence level. This means that 95 times out of 100, the results will be within 2 percentage points of what they would be if all adults in California were interviewed. The sampling error for subgroups is larger. The sampling error for the 1,602 registered voters is +/- 2.5 percent. The sampling error for the 1,193 likely voters is +/- 3 percent. Sampling error is only one type of error to which surveys are subject. Results may also be affected by factors such as question wording, question order, and survey timing. Throughout the report, we refer to four geographic regions. Central Valley includes Butte, Colusa, El Dorado, Fresno, Glenn, Kern, Kings, Madera, Merced, Placer, Sacramento, San Joaquin, Shasta, Stanislaus, Sutter, Tehama, Tulare, Yolo, and Yuba Counties. SF Bay Area includes Alameda, Contra Costa, Marin, Napa, San Francisco, San Mateo, Santa Clara, Solano, and Sonoma Counties. Los Angeles refers to Los Angeles County, and Other Southern California includes the mostly suburban regions of Orange, Riverside, San Bernardino, and San Diego Counties. These four regions were chosen for analysis because they are the major population centers of the state, accounting for approximately 90 percent of the state population. We present specific results for Latinos because they account for about 30 percent of the state s adult population and constitute one of the fastest growing voter groups. The sample sizes for African Americans and Asians are not large enough for separate statistical analysis. We do compare the opinions of registered Democrats, Republicans, and independents. The independents category includes those who are registered to vote as decline to state. We also include the responses of likely voters those who are most likely to vote in the state s elections. We compare PPIC Statewide Survey responses earlier PPIC Statewide Surveys to analyze trends over time in California and to responses in national surveys conducted by ABC News/Washington Post, CBS News, CNN/USA Today/Gallup, Kaiser Family Foundation, Newsweek, Pew Research Center, and Time
30
31 PPIC STATEWIDE SURVEY: SPECIAL SURVEY ON THE CALIFORNIA STATE BUDGET JANUARY 11 18, ,003 CALIFORNIA ADULT RESIDENTS: ENGLISH AND SPANISH MARGIN OF ERROR +/-2% AT 95% CONFIDENCE LEVEL FOR TOTAL SAMPLE 1. First, which one issue facing California today do you think is the most important for the Governor and State Legislature to work on in 2006? [code, don t read] 25% education, schools 12 state budget, deficit, state spending, taxes 11 immigration, illegal immigration 10 economy, jobs, unemployment 5 health care, health insurance, health costs 5 crime, gangs, drugs 3 roads and infrastructure 2 electricity costs, supply/energy crisis 14 other (specify) 13 don t know 2. Overall, do you approve or disapprove of the way that Arnold Schwarzenegger is handling his job as Governor of California? 40% approve 52 disapprove 8 don't know [rotate questions 3 to7] 3. Do you approve or disapprove of the way that Governor Schwarzenegger is handling the issue of the state budget and taxes? 35% approve 53 disapprove 12 don't know 4. Do you approve or disapprove of the way that Governor Schwarzenegger is handling the state's kindergarten through twelfth grade public education system? 30% approve 55 disapprove 15 don't know 5. Do you approve or disapprove of the way that Governor Schwarzenegger is handling the issue of transportation and traffic congestion? 38% approve 41 disapprove 21 don't know 6. Do you approve or disapprove of the way that Governor Schwarzenegger is handling crime and punishment issues? 54% approve 30 disapprove 16 don't know 7. Do you approve or disapprove of the way that Governor Schwarzenegger is handling the issue of jobs and the economy in California? 39% approve 47 disapprove 14 don't know 8. Overall, do you approve or disapprove of the way that the California legislature is handling its job? 29% approve 57 disapprove 14 don't know 9. Do you think things in California are generally going in the right direction or the wrong direction? 37% right direction 56 wrong direction 7 don't know 10. Turning to economic conditions in California, do you think that during the next 12 months we will have good times financially or bad times? 48% good times 42 bad times 10 don't know 11. On another issue, do you think the state budget situation in California that is, the balance between government spending and revenues is a big problem, somewhat of a problem, or not a problem for the people of California today? 61% big problem 30 somewhat of a problem 4 not a problem 5 don't know
32 12. In the past two years, do you think the state budget situation has improved, gotten worse, or stayed the same? 21% improved 33 gotten worse 39 stayed the same 7 don't know Now, I am going to ask about specific areas where the State of California spends money. For each area, please tell me if you think that the state government should spend more money than it does now, the same amount as now, or less money than now. [rotate questions 13 to 17] 13. How about the state's corrections system, including prisons? 24% more money 37 same amount of money 32 less money 7 don't know 14. How about the K through 12 public education system? 71% more money 19 same amount of money 8 less money 2 don't know 15. How about public colleges and universities? 56% more money 30 same amount of money 9 less money 5 don't know 16. How about health and human services? 61% more money 25 same amount of money 11 less money 3 don't know 17. How about roads and other infrastructure projects? 58% more money 31 same amount of money 8 less money 3 don't know Tax and fee increases could be used to help pay for state spending. For each of the following, please say if you favor or oppose the proposal. [rotate questions 18 and 19] 18. How about raising the top rate of the state income tax paid by the wealthiest Californians? 65% favor 32 oppose 3 don't know 19. How about increasing taxes on the purchase of cigarettes? 71% favor 27 oppose 2 don't know Next, how would you vote on these tax initiatives if an election were held today? [rotate questions 20 and 21] 20. How about increasing taxes on the purchase of cigarettes by $2.60 per pack to pay for children's health insurance, hospital emergency room care, and other health treatment and prevention programs? Would you vote yes or no? 69% yes 30 no 1 don't know 21. How about increasing taxes by 1.7 percent on individual incomes above $400,000 annually, and $800,000 for couples, to pay for voluntary public preschool for all 4-year old children? Would you vote yes or no? 66% yes 31 no 3 don't know 22. When it comes to the tough choices involved in the state budget, both in deciding how much Californians should pay in taxes and how to fund state programs, whose approach do you most prefer [rotate] (1) Governor Schwarzenegger's, (2) the Democrats' in the legislature, [or] (3) the Republicans' in the legislature? 18% Governor Schwarzenegger's 39 Democrats' 23 Republicans' 1 other (specify) 4 none of them (volunteered) 15 don't know
33 23. And, in general, which of the following statements do you agree with more I'd rather pay higher taxes and have a state government that provides more services, or I'd rather pay lower taxes and have a state government that provides fewer services? 61% higher taxes and more services 31 lower taxes and fewer services 8 don't know 24. Overall, do you have a favorable or an unfavorable impression of the plans and policies for California that Governor Schwarzenegger presented in his recent "state of the state" speech? 34% favorable 34 unfavorable 25 haven't heard about the speech (volunteered) 7 don't know 25. Do you think that Governor Schwarzenegger and the state legislature will be able to work together and accomplish a lot in the next year, or not? 43% yes, will be able to work together 48 no, will not be able to work together 9 don't know 25a.Do you approve or disapprove of the governor's plan to spend $222 billion over 10 years on infrastructure projects including surface transportation, education facilities, air quality, water and flood control, jails and prisons, and courts? 68% approve 23 disapprove 9 don't know 25b.Do you approve or disapprove of raising the minimum wage in California from $6.75 an hour to $7.75 an hour by July 2007? 81% approve 18 disapprove 1 don't know 26. Recently, Governor Schwarzenegger proposed a budget plan for the next fiscal year that includes increased spending on K to 12 public education, health and human services, higher education, corrections and prisons, and transportation. The plan includes no new taxes. In general, are you satisfied or dissatisfied with the Governor's budget plan? 60% satisfied 28 dissatisfied 5 haven't heard anything about the budget (volunteered) 7 don't know The state will have somewhat more revenue this year than was expected. Do you favor or oppose the following proposals for how to use this year s additional money in next year s budget, which begins on July 1, 2006? [rotate questions 27 to 27b] 27. Do you favor or oppose using some of this additional money to reduce the amount of state debt? 76% favor 20 oppose 4 don't know 27a.Do you favor or oppose using some of this additional money to increase K through 12 public education funding? 78% favor 20 oppose 2 don't know 27b.Do you favor or oppose using some of this additional money to rollback tuition fee increases by increasing funding for public colleges and universities? 63% favor 32 oppose 5 don't know 28. Next, you may know the term "infrastructure" refers to a variety of public works projects. Which of the following do you think should have the top priority for additional state funding [rotate] surface transportation, education facilities, water systems and flood control, jails and prisons, [or] courts? 48% education facilities 25 surface transportation 17 water systems and flood control 3 jails and prisons 2 courts 1 other (specify) 4 don't know 29. Which of the following types of surface transportation projects do you think should have the top priority for additional state funding [rotate] freeways and highways, public bus and transit systems, carpool lanes, [or] local streets and roads? 38% freeways and highways 29 public bus and transit systems 24 local streets and roads 7 carpool lanes 1 other (specify) 1 don't know January 2006
![[rotate questions 30 and 31] 30.](/docs-images/78/78049925/images/34-0.jpg "If an election were held today, would you vote yes or no on a state bond of about $10 billion for infrastructure projects such as education facilities, surface transportation, and water facilities to")
34 [rotate questions 30 and 31] 30. If an election were held today, would you vote yes or no on a state bond of about $10 billion for infrastructure projects such as education facilities, surface transportation, and water facilities to be paid through the state's general fund with no new taxes? 73% yes 21 no 6 don't know 31. If an election were held today would you vote yes or no on a state bond of about $25 billion for infrastructure projects such as education facilities, surface transportation, and water facilities to be paid through the state's general funds with no new taxes? 65% yes 28 no 7 don't know 32. How would you most prefer that the state government increase the level of current funding for roads and other infrastructure projects [rotate] (1) increase taxes for all Californians; (2) increase user fees and charges; (3) issue state bonds paid for through the state's general fund [or] (4) use only surplus budget funds? 31% use only surplus budget funds 24 issue state bonds 17 increase user fees 14 increase taxes 2 should not increase current level of funding (volunteered) 2 other (specify) 10 don't know 33. The local sales tax that is collected by local governments is one of the major funding sources for local transportation projects, and state law requires that it must be approved by two-thirds of the voters in a local election. What if there was a state measure that would change the two-thirds majority to a 55 percent majority for passing local sales tax for transportation projects. Would you vote yes or no? 41% yes 53 no 6 don't know 34. Changing topics, overall, do you approve or disapprove of the way that George W. Bush is handling his job as president of the United States? 38% approve 60 disapprove 2 don't know [rotate questions 35 and 36] 35. Do you approve or disapprove of the way that President Bush is handling terrorism and homeland security issues? 45% approve 53 disapprove 2 don't know 36. Overall, do you approve or disapprove of the way that President Bush is handling the situation in Iraq? 33% approve 65 disapprove 2 don't know 37. In general, how would you say things are going for the U.S. in Iraq very well, somewhat well, not too well, or not at all well? 8% very well 27 somewhat well 25 not too well 37 not at all well 3 don't know 38. in all, do you think it was worth going to war in Iraq, or not? 34% yes, worth it 62 no, not worth it 4 don't know 39. What concerns you more about the government's antiterrorism policies [rotate] [1] that they have not gone far enough to protect the country [or] [2] that they have gone too far in restricting the average person's civil liberties? 40% not gone far enough 45 gone too far 9 neither (volunteered) 6 don't know 40. In order to curb terrorism in this country, do you think it is necessary to give up some civil liberties, or not? 48% yes, it is necessary 47 no, it is not necessary 5 don't know 41. On another topic, would you favor or oppose a program that would allow illegal immigrants who have jobs in the United States to live and work legally in the United States for a fixed period of time if they registered with the government as temporary guest workers so the U.S. government could keep track of them? 71% favor 26 oppose 3 don't know
David W. Lyon is founding President and Chief Executive Officer of PPIC. Thomas C. Sutton is Chair of the Board of Directors.
 The Public Policy Institute of California (PPIC) is a private operating foundation established in 1994 with an endowment from William R. Hewlett. The Institute is dedicated to improving public policy in
Mark Baldassare is President and Chief Executive Officer of PPIC. Thomas C. Sutton is Chair of the Board of Directors.
 MaY 2008 The Public Policy Institute of California is dedicated to informing and improving public policy in California through independent, objective, nonpartisan research on major economic, social, and
PPIC STATEWIDE SURVEY
 PPIC STATEWIDE SURVEY SEPTEMBER 2004 Californians and Their Government Public Policy Institute of California Mark Baldassare Research Director & Survey Director The Public Policy Institute of California
march 2009 Californians their government in collaboration with The James Irvine Foundation Mark Baldassare Dean Bonner Jennifer Paluch Sonja Petek
 march 2009 Californians & their government in collaboration with The James Irvine Foundation Mark Baldassare Dean Bonner Jennifer Paluch Sonja Petek The Public Policy Institute of California is dedicated
Californians. their government. january in collaboration with The James Irvine Foundation
 january 2009 Californians & their government in collaboration with The James Irvine Foundation Mark Baldassare Dean Bonner Jennifer Paluch Sonja Petek The Public Policy Institute of California is dedicated
Californians. population issues. february in collaboration with The William and Flora Hewlett Foundation
 february 2009 Californians & population issues in collaboration with The William and Flora Hewlett Foundation Mark Baldassare Dean Bonner Jennifer Paluch Sonja Petek The Public Policy Institute of California
PPIC STATEWIDE SURVEY
 PPIC STATEWIDE SURVEY SEPTEMBER 2005 Special Survey on Californians and the Initiative Process in collaboration with The James Irvine Foundation Public Policy Institute of California Mark Baldassare Research
PPIC STATEWIDE SURVEY
 PPIC STATEWIDE SURVEY OCTOBER OBER 2004 Californians and Their Government Public Policy Institute of California Mark Baldassare Research Director & Survey Director The Public Policy Institute of California
Californians & Their Government
 PPIC STATEWIDE SURVEY DECEMBER 2018 Californians & Their Government Mark Baldassare Dean Bonner Alyssa Dykman Lunna Lopes CONTENTS Press Release State Post-Election Landscape Federal Post-Election Landscape
David W. Lyon is founding President and Chief Executive Officer of PPIC. Thomas C. Sutton is Chair of the Board of Directors.
 The Public Policy Institute of California (PPIC) is a private operating foundation established in 1994 with an endowment from William R. Hewlett. The Institute is dedicated to improving public policy in
PPIC STATEWIDE SURVEY J U N E
 PPIC STATEWIDE SURVEY J U N E 2 0 0 6 Special Survey of the Central in collaboration with the Great Center Public Policy Institute of California Mark Baldassare Research Director & Survey Director The
Californians & Their Government
 Californians & Their Government Mark Baldassare Dean Bonner David Kordus Lunna Lopes CONTENTS Press Release 3 Federal Government 6 State Government 15 Regional Map 22 Methodology 23 Questionnaire and Results
Californians. their government. ppic state wide surve y JANUARY in collaboration with The James Irvine Foundation CONTENTS
 ppic state wide surve y JANUARY 2013 Californians & their government Mark Baldassare Dean Bonner Sonja Petek Jui Shrestha CONTENTS About the Survey 2 Press Release 3 State Government 6 Federal Government
Californians. their government. september in collaboration with The James Irvine Foundation
 september 2008 Californians & their government in collaboration with The James Irvine Foundation Mark Baldassare Dean Bonner Jennifer Paluch Sonja Petek The Public Policy Institute of California is dedicated
PPIC Statewide Survey: Californians and Their Government
 PPIC Statewide Survey: Californians and Their Government Mark Baldassare Senior Fellow and Survey Director January 2001 Public Policy Institute of California Preface California is in the midst of tremendous
PPIC STATEWIDE SURVEY
 PPIC STATEWIDE SURVEY FEBRU ARY 2006 Californians and the Environment in collaboration with The David and Lucile Packard Foundation Public Policy Institute of California Mark Baldassare Research Director
Californians. their government. ppic state wide surve y JANUARY in collaboration with The James Irvine Foundation CONTENTS
 ppic state wide surve y JANUARY 2014 Californians & their government Mark Baldassare Dean Bonner Sonja Petek Jui Shrestha CONTENTS About the Survey 2 Press Release 3 State Government 6 Federal Government
Californians. their government. ppic state wide surve y SEPTEMBER in collaboration with The James Irvine Foundation
 ppic state wide surve y SEPTEMBER 2014 Californians & their government Mark Baldassare Dean Bonner Renatta DeFever Lunna Lopes Jui Shrestha CONTENTS About the Survey 2 Press Release 3 November 2014 Election
As Budget Angst Grows, Californians Take Stock of Fiscal Options And Take Aim at Elected Leaders
 EMBARGOED: Do not publish or broadcast until 10:00 p.m. PDT on Wednesday, March 26. CONTACT: Andrew Hattori, 415/291-4417 Abby Cook, 415/291-4436 Para ver este comunicado de prensa en español, por favor
Californians. their government. ppic statewide sur vey J A N U A R Y in collaboration with The James Irvine Foundation CONTENTS
 ppic statewide sur vey J A N U A R Y 2 0 1 0 Californians & their government Mark Baldassare Dean Bonner Sonja Petek Nicole Willcoxon CONTENTS About the Survey 2 Press Release 3 2010 Election Context 6
PPIC Statewide Survey: Special Survey on Growth
 PPIC Statewide Survey: Special Survey on Growth Mark Baldassare Senior Fellow and Survey Director May 2001 Part of the Growth, Land Use, and Environment Series In Collaboration with The William and Flora
Californians. their government. ppic state wide surve y SEPTEMBER supported with funding from The James Irvine Foundation CONTENTS
 ppic state wide surve y SEPTEMBER 2015 Californians & their government Mark Baldassare Dean Bonner David Kordus Lunna Lopes CONTENTS About the Survey 2 Press Release 3 State Government 6 Federal Government
Californians. healthy communities. ppic statewide survey FEBRUARY in collaboration with The California Endowment CONTENTS
 ppic statewide survey FEBRUARY 2011 Californians & healthy communities Mark Baldassare Dean Bonner Sonja Petek Nicole Willcoxon CONTENTS About the Survey 2 Press Release 3 Residents Perceptions & Attitudes
Californians & Their Government
 Californians & Their Government Mark Baldassare Dean Bonner David Kordus Lunna Lopes CONTENTS Press Release 3 State Issues 6 Federal Issues 14 Regional Map 24 Methodology 25 Questionnaire and Results 27
Californians. their government. ppic statewide survey DECEMBER in collaboration with The James Irvine Foundation CONTENTS
 ppic statewide survey DECEMBER 2010 Californians & their government Mark Baldassare Dean Bonner Sonja Petek Nicole Willcoxon CONTENTS About the Survey 2 Press Release 3 November 2010 Election 6 State and
Californians. their government. ppic state wide surve y MARCH in collaboration with The James Irvine Foundation CONTENTS
 ppic state wide surve y MARCH 2014 Californians & their government Mark Baldassare Dean Bonner Sonja Petek Jui Shrestha CONTENTS About the Survey 2 Press Release 3 State Government 6 Federal Government
Californians. their government. ppic state wide surve y MARCH in collaboration with The James Irvine Foundation CONTENTS
 ppic state wide surve y MARCH 2012 Californians & their government Mark Baldassare Dean Bonner Sonja Petek Jui Shrestha CONTENTS About the Survey 2 Press Release 3 2012 Elections 6 State and National Issues
TABLE OF CONTENTS. About the Survey 1. Press Release 3. State Issues 7. National Issues 15. Regional Map 24. Methodology 25
 TABLE OF CONTENTS About the Survey 1 Press Release 3 State Issues 7 National Issues 15 Regional Map 24 Methodology 25 Questionnaire and Results 27 ABOUT THE SURVEY The PPIC Statewide Survey provides policymakers,
PUBLIC POLICY INSTITUTE OF CALIFORNIA 500 Washington Street, Suite 800 San Francisco, California phone: fax:
 PUBLIC POLICY INSTITUTE OF CALIFORNIA 500 Washington Street, Suite 800 San Francisco, California 94111 phone: 415.291.4400 fax: 415.291.4401 www.ppic.org survey@ppic.org TABLE OF CONTENTS About the Survey
Californians. their government. ppic state wide surve y SEPTEMBER in collaboration with The James Irvine Foundation CONTENTS
 ppic state wide surve y SEPTEMBER 2013 Californians & their government Mark Baldassare Dean Bonner Sonja Petek Jui Shrestha CONTENTS About the Survey 2 Press Release 3 State Government 6 Federal Government
Californians. their government. ppic state wide surve y OCTOBER in collaboration with The James Irvine Foundation CONTENTS
 ppic state wide surve y OCTOBER 2012 Californians & their government Mark Baldassare Dean Bonner Sonja Petek Jui Shrestha CONTENTS About the Survey 2 Press Release 3 November 2012 Election 6 State and
Californians. their government. ppic state wide surve y MAY in collaboration with The James Irvine Foundation CONTENTS
 ppic state wide surve y MAY 2013 Californians & their government Mark Baldassare Dean Bonner Sonja Petek Jui Shrestha CONTENTS About the Survey 2 Press Release 3 State Government 6 Federal Government 16
Californians & Their Government
 Californians & Their Government Mark Baldassare Dean Bonner Lunna Lopes CONTENTS Press Release 3 2018 California Election 6 State and National Issues 13 Regional Map 20 Methodology 21 Questionnaire and
Coping with Homeland Security in California: Surveys of City Officials and State Residents
 Occasional Papers Coping with Homeland Security in California: Surveys of City Officials and State Residents Mark Baldassare Public Policy Institute of California Christopher Hoene National League of Cities
Californians. their government. ppic statewide sur vey. d e c e m b e r in collaboration with The James Irvine Foundation CONTENTS
 ppic statewide sur vey d e c e m b e r 2 0 0 9 Californians & their government Mark Baldassare Dean Bonner Jennifer Paluch Sonja Petek CONTENTS About the Survey 2 Press Release 3 2010 California Election
Californians. their government. ppic statewide survey SEPTEMBER in collaboration with The James Irvine Foundation CONTENTS
 ppic statewide survey SEPTEMBER 2010 Californians & their government Mark Baldassare Dean Bonner Sonja Petek Nicole Willcoxon CONTENTS About the Survey 2 Press Release 3 November 2010 Election 6 State
PPIC Statewide Survey: Special Survey on Land Use part of the Growth, Land Use, and Environment Series
 PPIC Statewide Survey: Special Survey on Land Use part of the Growth, Land Use, and Environment Series in collaboration with the The William and Flora Hewlett Foundation The James Irvine Foundation The
PPIC STATEWIDE SURVEY
 PPIC STATEWIDE SURVEY NOVEMBER 2003 Special Survey on Californians and the Environment in collaboration with The William and Flora Hewlett Foundation The James Irvine Foundation The David and Lucile Packard
Californians & Their Government
 Californians & Their Government Mark Baldassare Dean Bonner Alyssa Dykman Lunna Lopes CONTENTS Press Release 3 2018 California Election 6 State and National Issues 12 Regional Map 20 Methodology 21 Questionnaire
PPIC Statewide Survey: Californians and Their Government
 PPIC Statewide Survey: ns and Their Government Mark Baldassare Senior Fellow and Survey Director January 2000 Public Policy Institute of The Public Policy Institute of is a private, nonprofit research
Preface. The characteristics of groups that are shaping the state's elections and policy debates.
 Preface California is now in the midst of historic changes that will profoundly affect the future of the state. To improve understanding of these changes and their effect on the political status quo, PPIC
Californians & Their Government
 Californians & Their Government Mark Baldassare Dean Bonner Alyssa Dykman CONTENTS Press Release 3 2018 California Election 6 State and National Issues 11 Regional Map 20 Methodology 21 Questionnaire and
Californians & the Environment
 Californians & the Environment Mark Baldassare Dean Bonner Alyssa Dykman Lunna Lopes CONTENTS Press Release 3 2018 Election and Environmental Issues 6 Public Perceptions and Policy Preferences 14 Regional
THE BUSH PRESIDENCY AND THE STATE OF THE UNION January 20-25, 2006
 CBS NEWS/NEW YORK TIMES POLL For release: January 26, 2005 6:30 P.M. THE BUSH PRESIDENCY AND THE STATE OF THE UNION January 20-25, 2006 For the first time in his presidency, George W. Bush will give a
PPIC Statewide Survey: Californians and Their Government
 PPIC Statewide Survey: Californians and Their Government February 8, 18 Mark Baldassare, Dean Bonner, Alyssa Dykman, Lunna Lopes Supported with funding from the James Irvine Foundation, the California
Preface. The characteristics of groups that are shaping the state's elections and policy debates.
 Preface California is now in the midst of historic changes that will profoundly affect the future of the state. To improve understanding of these changes and their effect on the political status quo, PPIC
Release # For Publication: Tuesday, September 19, 2017
 Jack Citrin Center for Public Opinion Research Institute of Governmental Studies 124-126 Moses Hall University of California Berkeley, CA 94720 Tel: 510-642- 6835 Email: igs@berkeley.edu Release #2017-16
PPIC Statewide Survey:
 Global California: PPIC Statewide Survey: Perspectives on U.S.-Japan Relations Mark Baldassare Senior Fellow and Survey Director September 2001 Public Policy Institute of California Contents Press Release
THE ECONOMY, THE DEFICIT, AND THE PRESIDENT July 24-28, 2009
 CBS NEWS/NEW YORK TIMES POLL For Release: Wednesday, July 29, 2009 6:30 pm (EDT) THE ECONOMY, THE DEFICIT, AND THE PRESIDENT July 24-28, 2009 The economy remains the top concern for Americans, but as the
These are the highlights of the latest Field Poll completed among a random sample of 997 California registered voters.
 THE FIELD POLL THE INDEPENDENT AND NON-PARTISAN SURVEY OF PUBLIC OPINION ESTABLISHED IN 1947 AS THE CALIFORNIA POLL BY MERVIN FIELD Field Research Corporation 601 California Street, Suite 900 San Francisco,
Grim Views of the Economy, the President and Congress September 10-15, 2011
 CBS NEWS/NEW YORK TIMES POLL For release: Friday, September 16, 2011 6:30 PM EDT Grim Views of the Economy, the President and Congress September 10-15, 2011 72% of Americans think the country is off on
Release #2475 Release Date: Wednesday, July 2, 2014 WHILE CALIFORNIANS ARE DISSATISFIED
 THE FIELD POLL THE INDEPENDENT AND NON-PARTISAN SURVEY OF PUBLIC OPINION ESTABLISHED IN 1947 AS THE CALIFORNIA POLL BY MERVIN FIELD Field Research Corporation 601 California Street, Suite 210 San Francisco,
THE FIELD POLL. UCB Contact
 Field Research Corporation 601 California St., Ste 900, San Francisco, CA 94108-2814 (415) 392-5763 FAX: (415) 434-2541 field.com/fieldpollonline THE FIELD POLL UNIVERSITY OF CALIFORNIA, BERKELEY BERKELEY
POLITICS AND THE PRESIDENT April 6-9, 2006
 CBS NEWS POLL For release: April 10, 2006 6:30 P.M. POLITICS AND THE PRESIDENT April 6-9, 2006 Although President Bush s approval ratings have stopped the downward slide that occurred earlier this year
A Harsh Judgment on Davis Clears Schwarzenegger s Way
 CALIFORNIA EXIT POLL: THE RECALL 10/7/03 A Harsh Judgment on Davis Clears Schwarzenegger s Way In the end it was more about Gray Davis than about Arnold Schwarzenegger, and on Davis, the voters judgment
Two-to-one voter support for Marijuana Legalization (Prop. 64) and Gun Control (Prop. 63) initiatives.
 and Gun Control (Prop. 63) initiatives.") UC Berkeley IGS Poll Title Two-to-one voter support for Marijuana Legalization (Prop. 64) and Gun Control (Prop. 63) initiatives. Permalink https://escholarship.org/uc/item/51c1h00j Author DiCamillo, Mark
UC Berkeley IGS Poll Title Two-to-one voter support for Marijuana Legalization (Prop. 64) and Gun Control (Prop. 63) initiatives. Permalink https://escholarship.org/uc/item/51c1h00j Author DiCamillo, Mark
Instituted in 1911, the statewide initiative process was a Progressive Era reform that
 Public Policy Institute of California The California Initiative Process How Democratic Is It? Instituted in 1911, the statewide initiative process was a Progressive Era reform that allowed citizens to
Institute for Public Policy
 Institute for Public Policy 2018 Gubernatorial Race Report of Findings Table of Contents SECTION ONE About the Poll SECTION TWO Project Overview SECTION THREE Key Findings & Headlines SECTION FOUR Detailed
Proposed gas tax repeal backed five to four. Support tied to voter views about the state s high gas prices rather than the condition of its roads
 Jack Citrin Center for Public Opinion Research Institute of Governmental Studies 124-126 Moses Hall University of California, Berkeley Berkeley, CA 94720 Tel: 510-642- 6835 Email: igs@berkeley.edu Release
THE 2004 NATIONAL SURVEY OF LATINOS: POLITICS AND CIVIC PARTICIPATION
 Summary and Chartpack Pew Hispanic Center/Kaiser Family Foundation THE 2004 NATIONAL SURVEY OF LATINOS: POLITICS AND CIVIC PARTICIPATION July 2004 Methodology The Pew Hispanic Center/Kaiser Family Foundation
THE PRESIDENT, THE STATE OF THE UNION AND THE TROOP INCREASE January 18-21, 2007
 For release: January 22, 2007 6:30 P.M. EST THE PRESIDENT, THE STATE OF THE UNION AND THE TROOP INCREASE January 18-21, 2007 President George W. Bush will make his 2007 State of the Union message to a
These are the findings from the latest statewide Field Poll completed among 1,003 registered voters in early January.
 THE FIELD POLL THE INDEPENDENT AND NON-PARTISAN SURVEY OF PUBLIC OPINION ESTABLISHED IN 1947 AS THE CALIFORNIA POLL BY MERVIN FIELD Field Research Corporation 601 California Street, Suite 210 San Francisco,
Telephone Survey of Mill Valley Voters Municipal Services Tax Measure Survey Report June 2016
 Telephone Survey of Mill Valley Voters Municipal Services Tax Measure Survey Report June 2016 Presented to: City Council of Mill Valley June 6, 2016 Methodology Live telephone survey of a representative
PPIC Statewide Survey Methodology
 PPIC Statewide Survey Methodology Updated February 7, 2018 The PPIC Statewide Survey was inaugurated in 1998 to provide a way for Californians to express their views on important public policy issues.
Constitutional Reform in California: The Surprising Divides
 Constitutional Reform in California: The Surprising Divides Mike Binder Bill Lane Center for the American West, Stanford University University of California, San Diego Tammy M. Frisby Hoover Institution
Release #2345 Release Date: Tuesday, July 13, 2010
 THE FIELD POLL THE INDEPENDENT AND NON-PARTISAN SURVEY OF PUBLIC OPINION ESTABLISHED IN 1947 AS THE CALIFORNIA POLL BY MERVIN FIELD Field Research Corporation 601 California Street, Suite 900 San Francisco,
THE FIELD POLL. By Mark DiCamillo, Director, The Field Poll
 THE FIELD POLL THE INDEPENDENT AND NON-PARTISAN SURVEY OF PUBLIC OPINION ESTABLISHED IN 1947 AS THE CALIFORNIA POLL BY MERVIN FIELD Field Research Corporation 601 California Street, Suite 210 San Francisco,
THE FIELD POLL. UCB Contact
 Field Research Corporation 601 California Street, Suite 900, San Francisco, CA 94108-2814 415.392.5763 FAX: 415.434.2541 field.com/fieldpollonline THE FIELD POLL UNIVERSITY OF CALIFORNIA, BERKELEY BERKELEY
Critical Insights on Maine TM Tracking Survey ~ Fall 2017 ~
 Critical Insights on Maine TM Tracking Survey ~ Fall 2017 ~ Voters Views on the Economy, Ballot Initiatives, and Other Issues Facing the State of Maine 172 Commercial Street Portland, Maine 04101 Telephone:
Demographic, Social, and Economic Trends for Young Children in California
 Occasional Papers Demographic, Social, and Economic Trends for Young Children in California Deborah Reed Sonya M. Tafoya Prepared for presentation to the California Children and Families Commission October
One Year Later: Still Divided on the War in Iraq, Less Support for President Bush
 One Year Later: Still Divided on the War in Iraq, Less Support for President Bush Amy Qiaoming Liu, Ph. D Brenda Hofer California State University, Sacramento On March 19, 2003, the United States started
PPIC Statewide Survey: Special Survey on Campaign Ethics
 PPIC STATEWIDE SURVEY: Special Survey on Campaign Ethics OCTOBER 28 NOVEMBER 4, 2002 MARK BALDASSARE, SURVEY DIRECTOR 2,000 CALIFORNIA ADULT RESIDENTS; ENGLISH AND SPANISH [LIKELY VOTERS IN BRACKETS; 1,025
Hatch Opens Narrow Lead Over Pawlenty
 Hatch Opens Narrow Lead Over Pawlenty Lawrence R. Jacobs Director, Center for the Study of Politics and Governance Humphrey Institute of Public Affairs University of Minnesota Joanne M. Miller Research
BUSH APPROVAL RATING PLUMMETS, TIMES MIRROR SURVEY FINDS
 BUSH APPROVAL RATING PLUMMETS, TIMES MIRROR SURVEY FINDS WASHINGTON, D. C. -- As the debate about the federal budget rages and the prospect of higher gasoline taxes looms, George Bush's standing with the
The California Civic Engagement Project Issue Brief
 Increasing Proportions of Vote-by-Mail Ballots In Millions 14 12 10 8 6 4 2 0 1. VBM Use Rates by Sub-Group Youth and Older Voters: Disparities in VBM Use Only voters age 55 and older use VBM at a rate
RECOMMENDED CITATION: Pew Research Center, July, 2016, 2016 Campaign: Strong Interest, Widespread Dissatisfaction
 NUMBERS, FACTS AND TRENDS SHAPING THE WORLD FOR RELEASE JULY 07, 2016 FOR MEDIA OR OTHER INQUIRIES: Carroll Doherty, Director of Political Research Jocelyn Kiley, Associate Director, Research Bridget Johnson,
Institute for Public Policy
 Institute for Public Policy 2018 Gubernatorial Race Report of Findings October 2018 Table of Contents SECTION ONE About the Poll SECTION TWO Project Overview SECTION THREE Key Findings & Headlines SECTION
Public Opinion on Health Care Issues October 2010
 Public Opinion on Health Care Issues October 2010 Kaiser s final Health Tracking Poll before the midterm elections finds few changes in the public s mindset toward health reform. While views on reform
AMERICANS ARE OPTIMISTIC ABOUT BARACK OBAMA S PRESIDENCY AND CABINET CHOICES December 4-8, 2008
 CBS NEWS POLL For release: Tuesday, December 9, 2008 6:30 PM (EST) AMERICANS ARE OPTIMISTIC ABOUT BARACK OBAMA S PRESIDENCY AND CABINET CHOICES December 4-8, 2008 Nine in ten Americans think the U.S. economy
Ben Tulchin, Corey O Neil and Kiel Brunner; Tulchin Research
 August 26, 2015 To: From: Re: Interested Parties Ben Tulchin, Corey O Neil and Kiel Brunner; Tulchin Research California Statewide Survey Finds Voters Demand More Transparency in Police Misconduct Cases
The President, Congress and Deficit Battles April 15-20, 2011
 CBS NEWS/NEW YORK TIMES POLL For release: Thursday, April 21, 2011 6:30pm (EDT) The President, Congress and Deficit Battles April 15-20, 2011 With the possibility of more spending showdowns between President
THE FIELD POLL. UCB Contact
 Field Research Corporation 601 California Street, Suite 900, San Francisco, CA 94108-2814 415.392.5763 FAX: 415.434.2541 field.com/fieldpollonline THE FIELD POLL UNIVERSITY OF CALIFORNIA, BERKELEY BERKELEY
FOURTH ANNUAL IDAHO PUBLIC POLICY SURVEY 2019
 FOURTH ANNUAL IDAHO PUBLIC POLICY SURVEY 2019 ABOUT THE SURVEY The Fourth Annual Idaho Public Policy Survey was conducted December 10th to January 8th and surveyed 1,004 adults currently living in the
Executive Summary of Texans Attitudes toward Immigrants, Immigration, Border Security, Trump s Policy Proposals, and the Political Environment
 2017 of Texans Attitudes toward Immigrants, Immigration, Border Security, Trump s Policy Proposals, and the Political Environment Immigration and Border Security regularly rank at or near the top of the
THE PRESIDENTIAL RACE: MIDSUMMER July 7-14, 2008
 CBS NEWS/NEW YORK TIMES POLL For release: Tuesday July 15, 2008 6:30 P.M. EDT THE PRESIDENTIAL RACE: MIDSUMMER July 7-14, 2008 Democrat Barack Obama now holds a six-point edge over his Republican rival
THE FIELD POLL. UCB Contact
 Field Research Corporation 601 California Street, Suite 900, San Francisco, CA 94108-2814 415.392.5763 FAX: 415.434.2541 field.com/fieldpollonline THE FIELD POLL UNIVERSITY OF CALIFORNIA, BERKELEY BERKELEY
CONTACT: TIM VERCELLOTTI, Ph.D., (732) , EXT. 285; (919) (cell) CRANKY ELECTORATE STILL GIVES DEMOCRATS THE EDGE
 , EXT. 285; (919) (cell) CRANKY ELECTORATE STILL GIVES DEMOCRATS THE EDGE") - Eagleton Poll EMBARGOED UNTIL 9 A.M. EDT OCT. 25, 2007 Oct. 25, 2007 (Release 163-1) CONTACT: TIM VERCELLOTTI, Ph.D., (732) 932-9384, EXT. 285; (919) 812-3452 (cell) CRANKY ELECTORATE STILL GIVES DEMOCRATS
- Eagleton Poll EMBARGOED UNTIL 9 A.M. EDT OCT. 25, 2007 Oct. 25, 2007 (Release 163-1) CONTACT: TIM VERCELLOTTI, Ph.D., (732) 932-9384, EXT. 285; (919) 812-3452 (cell) CRANKY ELECTORATE STILL GIVES DEMOCRATS
THE PRESIDENT, CONGRESS, AND THE WAR IN IRAQ June 26-28, 2007
 CBS NEWS POLL For release: Friday, June 29, 2007 6:30 P.M. EDT THE PRESIDENT, CONGRESS, AND THE WAR IN IRAQ June 26-28, 2007 With three quarters of Americans saying that the war in Iraq is going badly,
Executive Summary of Economic Attitudes, Most Important Problems, Ratings of Top Political Figures, and an Early Look at the 2018 Texas Elections
 2017 of Economic Attitudes, Most Important Problems, Ratings of Top Political Figures, and an Early Look at the 2018 Texas Elections Summary of Findings The 2017 continues its long time-series assessing
Survey of US Voters Issues and Attitudes June 2014
 Survey of US Voters Issues and Attitudes June 2014 Methodology Three surveys of U.S. voters conducted in late 2013 Two online surveys of voters, respondents reached using recruit-only online panel of adults
Release #2486 Release Date: Friday, September 12, 2014
 THE FIELD POLL THE INDEPENDENT AND NON-PARTISAN SURVEY OF PUBLIC OPINION ESTABLISHED IN 1947 AS THE CALIFORNIA POLL BY MERVIN FIELD Field Research Corporation 601 California Street, Suite 210 San Francisco,
April 29, NW 13 th Ave., #205 Portland, OR
 239 NW 13 th Ave., #205 Portland, OR 97209 503.220.0575 www.dhmresearch.com @DHMresearch April 29, 2013 Davis, Hibbitts & Midghall, Inc. (DHM Research) conducted a statewide telephone survey for Fox12
WHERE AMERICA STANDS: ECONOMIC WORRIES PERSIST; DISSATISFACTION WITH WASHINGTON RUNS HIGH May 20-24, 2010
 CBS NEWS POLL For release: May 25, 2010 6:30 PM EDT WHERE AMERICA STANDS: ECONOMIC WORRIES PERSIST; DISSATISFACTION WITH WASHINGTON RUNS HIGH May 20-24, 2010 The latest CBS News Poll finds Americans in
Institute for Public Policy
 Institute for Public Policy 2018 Gubernatorial Race Report of Findings November 2018 Table of Contents SECTION ONE About the Poll SECTION TWO Project Overview SECTION THREE Key Findings & Headlines SECTION
THE WAR IN IRAQ, THE PRESIDENT AND THE COUNTRY S INFRASTRUCTURE August 8-12, 2007
 CBS NEWS POLL For release: Monday, August 13, 2007 6:30 P.M. EDT THE WAR IN IRAQ, THE PRESIDENT AND THE COUNTRY S INFRASTRUCTURE August 8-12, 2007 Americans today are more willing to credit the surge of
CHRISTIE JOB GRADE IMPROVES SLIGHTLY, RE-ELECTION SUPPORT DOES NOT
 Eagleton Institute of Politics Rutgers, The State University of New Jersey 191 Ryders Lane New Brunswick, New Jersey 08901-8557 www.eagleton.rutgers.edu eagleton@rci.rutgers.edu 732-932-9384 Fax: 732-932-6778
California Ballot Reform Panel Survey Page 1
 CALIFORNIA BALLOT RE FORM PANEL SURVEY 2011-2012 Interview Dates: Wave One: June 14-July 1, 2011 Wave Two: December 15-January 2, 2012 Sample size Wave One: (N=1555) Wave Two: (N=1064) Margin of error
R Eagleton Institute of Politics Center for Public Interest Polling
 2002 SURVEY OF NEW BRUNSWICK RESIDENTS Conducted for: Conducted by: R Eagleton Institute of Politics Center for Public Interest Polling Data Collection: May 2002 02-02 EXECUTIVE SUMMARY TABLE OF CONTENTS
RECOMMENDED CITATION: Pew Research Center, December, 2016, Low Approval of Trump s Transition but Outlook for His Presidency Improves
 NUMBERS, FACTS AND TRENDS SHAPING THE WORLD FOR RELEASE DECEMBER 8, 2016 FOR MEDIA OR OTHER INQUIRIES: Carroll Doherty, Director of Political Research Jocelyn Kiley, Associate Director, Research Bridget
Rural Pulse 2019 RURAL PULSE RESEARCH. Rural/Urban Findings March 2019
 Rural Pulse 2019 RURAL PULSE RESEARCH Rural/Urban Findings March 2019 Contents Executive Summary 3 Project Goals and Objectives 9 Methodology 10 Demographics 12 Detailed Research Findings 18 Appendix Prepared