Unit 1: Basic Economic Concepts and the Supply and Demand Model. Chapters: 1 and 2
|
|
|
- Jerome Norton
- 6 years ago
- Views:
Transcription
1 Unit 1: Basic Economic Concepts and the Supply and Demand Model Chapters: 1 and 2


2 The Factors of Production Entrepreneurs +Land + Labor + Capital = goods and services Entrepreneurs = risk takers who combine land, labor and capital into new products. Land = gifts of nature /natural resources Soil, minerals, water, forest, wind, plants, animals, solar energy, etc. Labor = physical effort Physical Capital = tools, equipment, machinery, and factories used in the production of goods and services. Human Capital = people with their skills, knowledge and experience.
3 Basic Economic Questions What to produce? What should be made using available resources? How to produce? What combination of resources should be used? Who will consume? Who will get those goods and services? How do we distribute goods and services? Economic System a system managing the factors of production answers the three basic questions of WHAT, HOW, and FOR WHOM.


4 Command/Centrally Planned Economy A central authority makes the most of the WHAT, HOW, and FOR WHOM decisions. The government determines the needs, sets quotas for major industries and usually provides for the basic needs of the people. Examples: Cuba North Korea Soviet Union China under Mao Zedong


5 Market Economy People and firms act in their own best interest to decide the WHAT, HOW, and FOR WHOM. Buyers and sellers come together in order to exchange goods and services. Good and services are determined by supply and demand. Hong Kong Singapore

6 Mixed Economy Market-based system in which the government plays a limited role. United States
7 Economic Systems Pure command economy Pure market economy NO economic freedom Socialism Capitalism TOTAL economic freedom Mixed economies

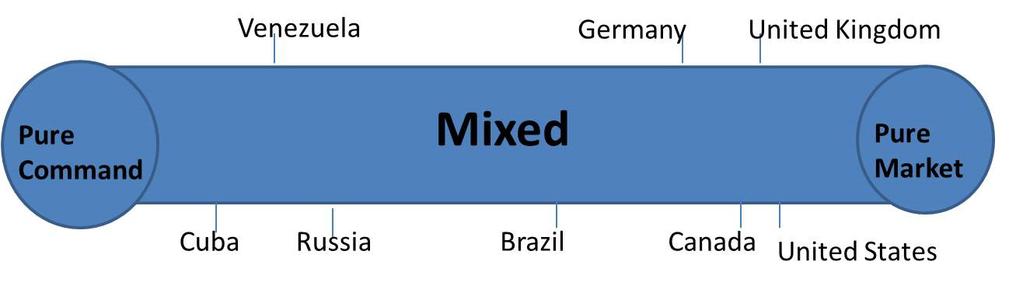
8 Economic Systems


9 Is America Number One? Command vs Market vs Mixed Economies - watch up t0 24:00
10 Is America Number One Video Argument?
 $40 billion (2013 est.) GDP per capita $34,600 (2013 est.) $1,800 (2013 est.) Real GDP Growth 2.9% (2013 est.) 1% (2013 est.) Unemployment 3.")
11 How do you explain why the GDP per capita is $1,800 in North Korea, while just across the DMZ, the GDP per capita is $34,600? S. Korea vs N. Korea GDP $1.744 trillion (2013 est.) $40 billion (2013 est.) GDP per capita $34,600 (2013 est.) $1,800 (2013 est.) Real GDP Growth 2.9% (2013 est.) 1% (2013 est.) Unemployment 3.5% (2014 est.) 25.6% (2013 est.)

12 What are the key determinants of economic growth? Read Why Nations Fail, pages Why did the South Korean economy prosper and the North Korean economy falter after the Korean War? There will be a reading quiz you can use handwritten notes. Why Nations Fail book excerpt.pdf

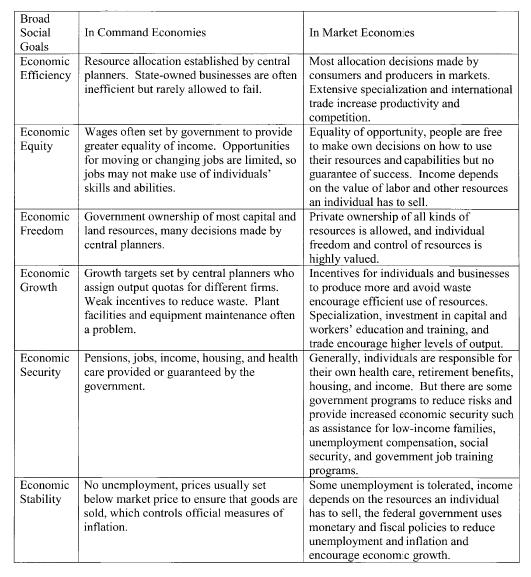
13 Given what you learned from the video, Why Nations Fail and your personal opinion, how would you prioritize the following economic and social goals?
14

15 Why is it important for countries to have economic growth?
16 Economic growth increases the standard of living. Correlation between GDP per capita and life expectancy and literacy The rate of economic growth depends largely on increasing productivity. ata/reports.aspx?source=worlddevelopment-indicators# 2014 Educational Educational attainment, attainment, at Adult at least least literacy Bachelor's or completed GDP per GDP per Life rate, equivalent, postsecondary, Labor force capita capita expectancy Mortality population population with (constant growth at birth, rate, infant 15+ years, 25+, total population secondary 2010 (annual total (per 1,000 both sexes (%) 25+, total (%) education Country Name US$) %) (y ears) live births) (%) (cumulative) (cumulative) (% of total) Macao SAR, China $71, A u stralia $54, Sweden $53, Si n gapore $51, Un i ted States $50, Can ada $49, Germ any $44, Japan $44, Fran ce $41, N ew Zealand $36, Hon g Kon g SAR, China $35, Korea, Rep. $24, Greece $22, Saudi Arabia $21, Venezuela, RB $13, Tu rkey $11, Mexi co $9, Sou th Africa $7, China $6, Iran, Islamic Rep. $5, Philippines $2, India $1, Zimbabwe $ Malawi $ Korea, Dem. People s Rep
17 AP Microeconomics Essential Questions How do we achieve economic efficiency and economic growth? What role should government play in promoting economic efficiency and economic growth?
European Economic Growth Factors
 European Economic Growth Factors European Economic Growth Factors Essential Question: What factors influence a country's economic growth? Economic Check Point Economics is the study of how a market makes,
Eagle s Landing Middle School 7 th Grade Social Studies Pacing Guide
 Getting to Know You/ Establishing Procedures July 30 th August 3rd Fundamentals of Economics and Government August 6 th -August 20 th SS7E1a-b, SS7E4a-b, SS6E7a-b Analyze different economic systems. Terminology
Lecture III South Korean Economy today
 Lecture III South Korean Economy today Lecture 3: South Korean Economy - Current Status and Issues in the future South Korean Economy: Current Status 1 Korean Economy with Numbers GDP (PPP based) S. Korea
Share of Countries over 1/3 Urbanized, by GDP per Capita (2012 $) 1960 and 2010
 1960 and 2010") Share of Countries over 1/3 Urbanized, by GDP per Capita (2012 $) 1960 and 2010 Share Urbanized 0.2.4.6.8 1 $0-1000 $1000-2000 $2000-3000 $3000-4000 $4000-5000 1960 2010 Source: World Bank Welfare Economics
Share of Countries over 1/3 Urbanized, by GDP per Capita (2012 $) 1960 and 2010 Share Urbanized 0.2.4.6.8 1 $0-1000 $1000-2000 $2000-3000 $3000-4000 $4000-5000 1960 2010 Source: World Bank Welfare Economics
Victoria A City in Capital Regional District
 Produced by Stats for Global Non-Response Rate: 24.6 Population Total Immigrants Change in Change in Immigrants Population Number Percent Population Number Percent 1991 71,228 14,665 20.6 1991 to 1996
North Okanagan A Regional District in British Columbia
 Population Total Immigrants Change in Change in Immigrants Population Number Percent Population Number Percent 1991 61,744 7,855 12.7 1991 to 1996 9,863 685 8.7 1996 71,67 8,54 11.9 1996 to 1 1,6-28 -
Washington County School District Social Studies Pacing Guide
 Grade: Course: Date(s) # of Days Unit Themes / Selections Priority Standards July 4 Days Pre Planning 30-August 2 August 3 1 Day Introduction to the Class, Rules, Books, Other Information August 4 Days
Cherokee County School District Student Performance Standards Unit Guides - Social Studies: Seventh Grade
 Unit The Modern Middle East SS7H2. SS7G5. SS7G7. SS7G8. The student will analyze continuity and change in Southwest Asia (Middle East) leading to the 21st century. b) Explain the historical reasons for
East Kootenay A Regional District in British Columbia
 Produced by Stats for Global Non-Response Rate: 35.5 Population Total Immigrants Change in Change in Immigrants Population Number Percent Population Number Percent 1991 52,368 5,9 11.3 1991 to 1996 3,998-55
ECONOMIC SYSTEMS AND DECISION MAKING. Understanding Economics - Chapter 2
 ECONOMIC SYSTEMS AND DECISION MAKING Understanding Economics - Chapter 2 ECONOMIC SYSTEMS Chapter 2, Lesson 1 ECONOMIC SYSTEMS Traditional Market Command Mixed! Economic System organized way a society
Saanich A District Municipality in Capital Regional District
 Produced by Stats for Population Total Immigrants Change in Change in Immigrants Population Number Percent Population Number Percent 1991 95,583 20,285 21.2 1991 to 1996 5,805 755 3.7 1996 101,388 21,040
Nanaimo A City in Nanaimo Regional District
 A City in Regional District Produced by Stats for Population Total Immigrants Change in Change in Immigrants Population Number Percent Population Number Percent 1991 6,129 8,885 14.8 1991 to 1996,1 2,44
Strathcona A Regional District in British Columbia
 Produced by Stats for Population Total Immigrants Change in Change in Immigrants Population Number Percent Population Number Percent 1991 - - - 1991 to 1996 - - - 1996 - - - 1996 to 1 - - - 1 - - - 1 to
Harrison Hot Springs A Village in Fraser Valley Regional District
 Global NonResponse Rate: 42.4 Population Total Immigrants Change in Change in Immigrants Population Number Percent Population Number Percent 1991 655 17 26. 1991 to 1996 243 3 17.6 1996 898 2 22.3 1996
Port McNeill A Town in Mount Waddington Regional District
 Produced by Stats for Global NonResponse Rate: 35.1 Population Total Immigrants Change in Change in Immigrants Population Number Percent Population Number Percent 1991 2,641 225 8.5 1991 to 1996 284 5
Creston A Town in Central Kootenay Regional District
 Produced by Stats for Global NonResponse Rate: 32.4 Population Total Immigrants Change in Change in Immigrants Population Number Percent Population Number Percent 1991 4,27 655 15.6 1991 to 1996 69 175
POLITICAL LITERACY. Unit 1
 POLITICAL LITERACY Unit 1 STATE, NATION, REGIME State = Country (must meet 4 criteria or conditions) Permanent population Defined territory Organized government Sovereignty ultimate political authority
Nelson A City in Central Kootenay Regional District
 Produced by Stats for Global NonResponse Rate: 28.3 Population Total Immigrants Change in Change in Immigrants Population Number Percent Population Number Percent 1991 8,849 1,175 13.3 1991 to 1996 736
Round 1. This House would ban the use of zero-hour contracts. Proposition v. Opposition
 Round 1 This House would ban the use of zero-hour contracts New Zealand Bermuda Wales Romania Greece Estonia USA Scotland Slovakia Philippines Qatar Ireland Hungary Australia Japan Canada Sri Lanka Sweden
Enderby A City in North Okanagan Regional District
 Produced by Stats for Global NonResponse Rate: 44.3 Population Total Immigrants Change in Change in Immigrants Population Number Percent Population Number Percent 1991 2,128 23.8 1991 to 1996 626 3 13.
Part 1: The Global Gender Gap and its Implications
 the region s top performers on Estimated earned income, and has also closed the gender gap on Professional and technical workers. Botswana is among the best climbers Health and Survival subindex compared
GDP Per Capita. Constant 2000 US$
 GDP Per Capita Constant 2000 US$ Country US$ Japan 38,609 United States 36,655 United Kingdom 26,363 Canada 24,688 Germany 23,705 France 23,432 Mexico 5,968 Russian Federation 2,286 China 1,323 India 538
Economies in Transition Part I
 Economies in Transition Part I The most important single central fact about a free market is that no exchange takes place unless both parties benefit. -Milton Friedman TYPES OF ECONOMIC SYSTEMS 2 Economic
24. INTERNATIONAL STATISTICS IRAN STATISTICAL YEARBOOK 1394
 IRAN STATISTICAL YEARBOOK 1394 24. INTERNATIONAL STATISTICS Introduction his chapter is to provide proper round for a statistical comparison between Iran and other countries. Sources of the presented statistics
Kaslo A Village in Central Kootenay Regional District
 Produced by Stats for Global NonResponse Rate: 46.8 Population Total Immigrants Change in Change in Immigrants Population Number Percent Population Number Percent 1991 863 15 17.4 1991 to 1996 2 15 1.
Castlegar A City in Central Kootenay Regional District
 Produced by Stats for Population Total Immigrants Change in Change in Immigrants Population Number Percent Population Number Percent 1991 6,579 885 13.5 1991 to 1996 448 45 5.1 1996 7,27 93 13.2 1996 to
Grand Forks A City in Kootenay-Boundary Regional District
 A City in KootenayBoundary Regional District Produced by Stats for Global NonResponse Rate: 45.8 Population Total Immigrants Change in Change in Immigrants Population Number Percent Population Number Percent
Cache Creek A Village in Thompson-Nicola Regional District
 A Village in ThompsonNicola Regional District Produced by Stats for Global NonResponse Rate: 39.1 Population Total Immigrants Change in Change in Immigrants Population Number Percent Population Number
Parksville A City in Nanaimo Regional District
 Produced by Stats for Global NonResponse Rate: 2.3 Population Total Immigrants Change in Change in Immigrants Population Number Percent Population Number Percent 1991 7,381 1,27 17.2 1991 to 1996 2,91
Chapter 18 Development and Globalization
 Chapter 18 Development and Globalization 1. Levels of Development 2. Issues in Development 3. Economies in Transition 4. Challenges of Globalization Do the benefits of economic development outweigh the
The Multidimensional Financial Inclusion MIFI 1
 2016 Report Tracking Financial Inclusion The Multidimensional Financial Inclusion MIFI 1 Financial Inclusion Financial inclusion is an essential ingredient of economic development and poverty reduction
North Vancouver, City of A City in Greater Vancouver Regional District
 Global Non-Response Rate: 25.8 Population Total Immigrants Change in Change in Immigrants Population Number Percent Population Number Percent 1991 38,436,8 28.2 1991 to 1996 3,39 2,46 22.7 1996 41,475
New York County Lawyers Association Continuing Legal Education Institute 14 Vesey Street, New York, N.Y (212)
") New York County Lawyers Association Continuing Legal Education Institute 14 Vesey Street, New York, N.Y. 10007 (212) 267-6646 Who is Who in the Global Economy And Why it Matters June 20, 2014; 6:00 PM-6:50
New York County Lawyers Association Continuing Legal Education Institute 14 Vesey Street, New York, N.Y. 10007 (212) 267-6646 Who is Who in the Global Economy And Why it Matters June 20, 2014; 6:00 PM-6:50
WHY SHOULD I STUDY ENGLISH?
 WHY SHOULD I STUDY ENGLISH? WAIFS recommend that all students seriously consider taking an certificate course before entering their principal course of study at WAIFS. Many students simply consider this
Burnaby A City in Greater Vancouver Regional District
 Produced by Stats for Global Non-Response Rate: 23.6 Population Total Change in Change in Population Number Percent Population Number Percent 1991 158,858 49,5 31.2 1991 to 1996,351 24,5 49.1 1996 179,9
View Royal A Town in Capital Regional District
 Produced by Stats for Global NonResponse Rate: 18.4 Population Total Immigrants Change in Change in Immigrants Population Number Percent Population Number Percent 1991 5,996 9 15.6 1991 to 1996 445 315
Salmon Arm A City in Columbia-Shuswap Regional District
 Produced by Stats for Global NonResponse Rate: 22.8 Population Total Change in Change in Population Number Percent Population Number Percent 1991 12,115 1,365 11.3 1991 to 1996 2,549 25 18.3 1996 14,664
Contents. Mini Almanac Primary Sources Library...988
 Contents.............................983 Primary Sources Library....................988 Honoring America: Flag Etiquette, The Star-Spangled Banner, The Pledge of Allegiance...................2 Glossary.................................3
Chapter 18: Development and Globalization Section 1
 Chapter 18: Development and Globalization Section 1 Objectives 1. Understand what is meant by developed nations and less developed countries. 2. Identify the tools used to measure levels of development.
9.1 Human Development Index Development improving the material conditions diffusion of knowledge and technology Measure by HDI
 9: Development 9.1 Human Development Index Development improving the material conditions diffusion of knowledge and technology Measure by HDI Standard of living Access to knowledge Life expectancy 9.1
Lake Cowichan A Town in Cowichan Valley Regional District
 Global NonResponse Rate: 28 Population Total Change in Change in Population Number Percent Population Number Percent 1991 2,241 295 13.2 1991 to 1996 615 15 5.1 1996 2,856 28 9.8 1996 to 21 29 2 7.1 21
Highlands A District Municipality in Capital Regional District
 Produced by Stats for Global NonResponse Rate: 33 Population Total Immigrants Change in Change in Immigrants Population Number Percent Population Number Percent 1991 1,94 1991 to 1996 329 1996 1,423 21
38% 38% NEW AMERICANS IN SAN JOSE AND SANTA CLARA COUNTY POPULATION GROWTH A SNAPSHOT OF THE DEMOGRAPHIC AND ECONOMIC CONTRIBUTIONS OF IMMIGRANTS
 NEW AMERICANS IN SAN JOSE AND SANTA CLARA COUNTY A SNAPSHOT OF THE DEMOGRAPHIC AND ECONOMIC CONTRIBUTIONS OF S POPULATION GROWTH In 2014, the population of San José reached more than one million people
Logan Lake A District Municipality in Thompson-Nicola Regional District
 A District Municipality in ThompsonNicola Regional District Produced by Stats for Global NonResponse Rate: 48.9 Population Total Immigrants Change in Change in Immigrants Population Number Percent Population
Spallumcheen A District Municipality in North Okanagan Regional District
 Produced by Stats for Global NonResponse Rate: 45.4 Population Total Immigrants Change in Change in Immigrants Population Number Percent Population Number Percent 1991 4,717 66 14. 1991 to 1996 65 155
Brazil, Cuba & Mexico
 Brazil, Cuba & Mexico Standards SS6E1 Analyze different economic systems. a. Compare how traditional, command, and market economies answer the economic questions of 1-what to produce, 2- how to produce,
Rankings: Universities vs. National Higher Education Systems. Benoit Millot
 Rankings: Universities vs. National Higher Education Systems Benoit Millot Outline 1. Background 2. Methodology 3. Results 4. Discussion 11/8/ 2 1. Background 11/8/ 3 Clear Shift Background: Leagues focus
Lake Country A District Municipality in Central Okanagan Regional District
 Produced by Stats for Population Total Immigrants Change in Change in Immigrants Population Number Percent Population Number Percent 1991 1991 to 1996 1996 9,7 1,275 14.2 1996 to 1 26 7 5.5 1 9,267 1,345
Powell River A City in Powell River Regional District
 A City in Regional District Produced by Stats for Population Total Immigrants Change in Change in Immigrants Population Number Percent Population Number Percent 1991 12,991 1,965 15.1 1991 to 1996 14 4
Fort St. James A District Municipality in Bulkley-Nechako Regional District
 A District Municipality in BulkleyNechako Regional District Produced by Stats for Global NonResponse Rate: 36.9 Population Total Immigrants Change in Change in Immigrants Population Number Percent Population
Management Systems: Paulo Sampaio - University of Minho. Pedro Saraiva - University of Coimbra PORTUGAL
 Management Systems: A Path to Organizational Sustainability Paulo Sampaio - University of Minho paulosampaio@dps.uminho.ptuminho pt Pedro Saraiva - University of Coimbra pas@eq.uc.pt PORTUGAL Session learning
Dooly County Middle School
 Dooly County Middle School - 7 th Grade Social Studies Curriculum Map/Pacing Guide July 29- August 5, Rules/Procedures 8/8-12/16 5 Enduring Themes ALL Students will develop an understanding of social studies
List of Main Imports to the United States
 Example List 1 CANADA CHINA JAPAN MEXICO List 1 ARGENTINA AUSTRALIA BELGIUM COSTA RICA COTE D IVOIRE KUWAIT NORWAY SOUTH KOREA SRI LANKA SUDAN List 2 BRAZIL DOMINICAN REPUBLIC FRANCE NEW ZEALAND QATAR
Osoyoos A Town in Okanagan-Similkameen Regional District
 A Town in OkanaganSimilkameen Regional District Produced by Stats for Global NonResponse Rate: 38.5 Population Total Immigrants Change in Change in Immigrants Population Number Percent Population Number
Year. Fig.1 Population projections
 Outline of DNE21+ Model - Population, GDP Estimates- March 25, 28 1. Population Statistics from United Nations 26 are used. (UN, World Population Prospects:The 26 Revision. http://esa.un.org/unpp/) (Figure
INTERNATIONAL GENDER PERSPECTIVE
 Chapter 7 INTERNATIONAL GENDER PERSPECTIVE OF DEVELOPMENT INDICATORS Women & Men In India 2016 115 116 International Gender Perspective International Gender Perspective of Development Indicators India
7 th Grade Social Studies Pacing Guide
 August 17 September 14 th 20 Economic and Government Systems Aug. 10 th - 12 th Rules/Procedures Aug. 15 th 16 th 2 Enduring Students will develop an understanding of social studies themes that apply to
Development. Differences Between Countries
 Development Between Countries Inequalities Between Developing Countries [Date] Today I will: - Know the reasons why there are differences between developing countries. There are over 100 Developing countries.
Skeena-Queen Charlotte A Regional District in British Columbia
 Global NonResponse Rate: 34.7 Population Total Immigrants Change in Change in Immigrants Population Number Percent Population Number Percent 1991 24,287 3,125 12.9 1991 to 1996 58 27 8.6 1996 24,795 2,855
Levels and Trends of International Migration in Asia and the Pacific
 Expert Group Meeting on International Migration and Development in Asia and the Pacific Bangkok, Thailand, 20-21 September 2008 Levels and Trends of International Migration in Asia and the Pacific Sabine
Northern Rockies Regional Municipality A Regional Municipality in Northern Rockies Regional District
 Produced by Stats for Global NonResponse Rate: 39.2 Population Total Immigrants Change in Change in Immigrants Population Number Percent Population Number Percent 1991 1991 to 1996 1996 1996 to 21 21 21
GLOBALISATION AND ASIAN YOUTH
 GLOBALISATION AND ASIAN YOUTH by Graeme Hugo Federation Fellow, Professor of Geography and Director of the National Centre for Social Applications of GIS, The University of Adelaide Paper presented at
Guanghua Wan Principal Economist, Asian Development Bank. Toward Higher Quality Employment in Asia
 Guanghua Wan Principal Economist, Asian Development Bank Toward Higher Quality Employment in Asia 1 Key messages Asia continued its robust growth accompanied by significant poverty reduction But performance
Higher education global trends and Emerging opportunities to 2020
 0 Get informed. Seize challenges. Engage with the future. The shape of things to come: Higher education global trends and Emerging opportunities to 2020 www.aiec.idp.com 1 0 Research Topic Forecast the
Unit 1: Introduction to Economics Chapters 1 & 2
 Unit 1: Introduction to Economics Chapters 1 & 2 What is a market? Any place or method used by buyers and sellers to exchange goods and services. What kind of market system is used in the United States?
STUDENT VISA HOLDERS WHO LAST HELD A VISITOR OR WHM VISA Student Visa Grant Data
 STUDENT VISA HOLDERS WHO LAST HELD A VISITOR OR WHM VISA 2013-14 Student Visa Grant Data Over 40,000 or 14% of all student visa grantees in 2013-14 last held a visitor or WHM visa Visa grants by sector
Bangladesh: towards middle-income status
 Bangladesh: towards middle-income status Martin Rama Chief Economist for South Asia, the World Bank * SANEM Annual Economists Conference Dhaka, 2016 * With Miklos Bankuti. Zahid Hussain, and Fan Zhang
ECONOMIC SYSTEMS METHOD USED BY A SOCIETY TO PRODUCE AND DISTRIBUTE GOODS AND SERVICES
 ECONOMICS ECONOMIC SYSTEMS METHOD USED BY A SOCIETY TO PRODUCE AND DISTRIBUTE GOODS AND SERVICES THREE ECONOMIC QUESTIONS WHAT GOODS AND SERVICES SHOULD BE PRODUCED? HOW SHOULD THEY BE PRODUCED WHO CONSUMES
ECON 1000 Contemporary Economic Issues (Spring 2018) Economic Growth
 Economic Growth") ECON 1000 Contemporary Economic Issues (Spring 2018) Economic Growth Relevant Readings from the Required Textbooks: Chapter 7, Gross Domestic Product and Economic Growth Definitions and Concepts: economic
ECON 1000 Contemporary Economic Issues (Spring 2018) Economic Growth Relevant Readings from the Required Textbooks: Chapter 7, Gross Domestic Product and Economic Growth Definitions and Concepts: economic
Chapter 11. Trade Policy in Developing Countries
 Chapter 11 Trade Policy in Developing Countries Preview Import-substituting industrialization Trade liberalization since 1985 Trade and growth: Takeoff in Asia Copyright 2015 Pearson Education, Inc. All
Quesnel A City in Cariboo Regional District
 Produced by Stats for Global NonResponse Rate:.4 Population Total Immigrants Change in Change in Immigrants Population Number Percent Population Number Percent 1991 8,8 1,35 16.4 1991 to 1996 26 5.4 1996
A GAtewAy to A Bet ter Life Education aspirations around the World September 2013
 A Gateway to a Better Life Education Aspirations Around the World September 2013 Education Is an Investment in the Future RESOLUTE AGREEMENT AROUND THE WORLD ON THE VALUE OF HIGHER EDUCATION HALF OF ALL
Charting Cambodia s Economy, 1H 2017
 Charting Cambodia s Economy, 1H 2017 Designed to help executives interpret economic numbers and incorporate them into company s planning. Publication Date: January 3 rd, 2017 HELPING EXECUTIVES AROUND
2018 Social Progress Index
 2018 Social Progress Index The Social Progress Index Framework asks universally important questions 2 2018 Social Progress Index Framework 3 Our best index yet The Social Progress Index is an aggregate
HUMAN RESOURCES IN R&D
 HUMAN RESOURCES IN R&D This fact sheet presents the latest UIS S&T data available as of July 2011. Regional density of researchers and their field of employment UIS Fact Sheet, August 2011, No. 13 In the
Population. C.4. Research and development. In the Asian and Pacific region, China and Japan have the largest expenditures on R&D.
 Statistical Yearbook for Asia and the Pacific 2013 C. Education and knowledge C.4. (R&D) is a critical element in the transition towards a knowledgebased economy. It also contributes to increased productivity,
Proliferation of FTAs in East Asia
 Proliferation of FTAs in East Asia Shujiro URATA Waseda University and RIETI April 8, 2005 Contents I. Introduction II. Regionalization in East Asia III. Recent Surge of FTAs in East Asia IV. The Factors
CHILE NORTH AMERICA. Egypt, Israel, Oman, Saudi Arabia and UAE. Barge service: Russia Federation, South Korea and Taiwan. USA East Coast and Panama
 EUROPE Bulgaria, Greece, Italy, Netherlands and Turkey Belgium, Denmark, France, Germany, Malta, Netherlands, Poland, Slovenia, Spain and UK Belgium, Germany, Gibraltar, Greece, Italy, Malta, Netherlands,
Markets in higher education
 Markets in higher education Simon Marginson Institute of Education (IOE) Conference on The State and Market in Education: Partnership or Competition? The Grundtvig Study Centre Aarhus University and LLAKES,
Human Resources in R&D
 NORTH AMERICA AND WESTERN EUROPE EAST ASIA AND THE PACIFIC CENTRAL AND EASTERN EUROPE SOUTH AND WEST ASIA LATIN AMERICA AND THE CARIBBEAN ARAB STATES SUB-SAHARAN AFRICA CENTRAL ASIA 1.8% 1.9% 1. 1. 0.6%
From Crisis to Redistribution? Global Attitudes Towards Equality, Welfare, and State Ownership
 From Crisis to Redistribution? Global Attitudes Towards Equality, Welfare, and State Ownership Marcel Paret, University of Utah & University of Johannesburg Michael Levien, Johns Hopkins University September
Hong Kong, China (SAR)
") Human Development Report 2014 Sustaining Human Progress: Reducing Vulnerabilities and Building Resilience Explanatory note on the 2014 Human Development Report composite indices Hong Kong, China (SAR)
Human Development Report 2014 Sustaining Human Progress: Reducing Vulnerabilities and Building Resilience Explanatory note on the 2014 Human Development Report composite indices Hong Kong, China (SAR)
Changes After Socialism*
 Changes After Socialism* November 2015 Leszek Balcerowicz Warsaw School of Economics *I m grateful to Magda Ciżkowicz, Aleksander Łaszek, Sonja Wap, Marek Tatała and Tomasz Dróżdż for their assistance
Business Data For Engaging in International Real Estate Transactions in Idaho. National Association of REALTORS Research Division
 Business Data For Engaging in International Real Estate Transactions in National Association of REALTORS Research Division November 2016 Table of Contents Introduction 1 Table 1. Population by Place of
ASIAN TRANSFORMATIONS: An Inquiry into the Development of Nations
 ASIAN TRANSFORMATIONS: An Inquiry into the Development of Nations DEEPAK NAYYAR Jawaharlal Nehru University, New Delhi UNU- WIDER Development Conference Think Development, Think WIDER Helsinki 14 September
REGIONAL INTEGRATION IN THE AMERICAS: THE IMPACT OF THE GLOBAL ECONOMIC CRISIS
 REGIONAL INTEGRATION IN THE AMERICAS: THE IMPACT OF THE GLOBAL ECONOMIC CRISIS Conclusions, inter-regional comparisons, and the way forward Barbara Kotschwar, Peterson Institute for International Economics
2014 BELGIAN FOREIGN TRADE
 2014 BELGIAN FOREIGN TRADE 2 3 01 \\ EXPORTS 6 1.1 Geographical developments 1.2 Sectoral developments 02 \\ IMPORTS 14 2.1 Geographical developments 2.2 Sectoral developments 03 \\ GEOGRAPHICAL TRADE
Number of Applicants on Waiting List in Family Preference Categories As of Nov. 1, 2014 vs. As of Nov. 1, 2015
 Annual Report of Immigrant Visa Applicants in the Family-sponsored and Employment-based preferences Registered at the National Visa Center as of November 1, 2015 Most prospective immigrant visa applicants
North-South Migration To Developing Countries
 North-South Migration To Developing Countries Frank Laczko Head, Migration Research Division, European Migration Network Conference, Dublin, June 14, 2013 Policy Dialogue on Migration and Development 2013
Index. Brazil debt 16, 17, 29 education 21, 22 employment and unemployment 19
 Index African developing 25, 26,27 : Hong Kong 38, 39; 157; Philippines 173, 174, 175; Singapore 88, 89; Taiwan 111, 112, 113;, 196 Aquino, C. 164 Argentina debt 16, 17, 29 education 21, 22, 24 exports
Female Labor Force Participation: Contributing Factors
 REGIONAL SEMINAR WOMEN S EMPLOYMENT, ENTREPRENEURSHIP & EMPOWERMENT: MOVING FORWARD ON IMPERFECT PATHWAYS Female Labor Force Participation: Contributing Factors Valerie Mercer-Blackman Senior Economist
The Chinese Economy. Elliott Parker, Ph.D. Professor of Economics University of Nevada, Reno
 The Chinese Economy Elliott Parker, Ph.D. Professor of Economics University of Nevada, Reno The People s s Republic of China is currently the sixth (or possibly even the second) largest economy in the
Some are Doing Well How Well? (India vs. China)
") Sharif Azami Millennium Development Goals Some are Doing Well How Well? (India vs. China) Some are Still Struggling Afghanistan Q/A Source: http://images.oambassadors.org/system/images/0000/0047/mdg-themes.png
Sharif Azami Millennium Development Goals Some are Doing Well How Well? (India vs. China) Some are Still Struggling Afghanistan Q/A Source: http://images.oambassadors.org/system/images/0000/0047/mdg-themes.png
Business Data For Engaging in International Real Estate Transactions in California. National Association of REALTORS Research Division
 Business Data For Engaging in International Real Estate Transactions in National Association of REALTORS Research Division November 2016 Table of Contents Introduction 1 Table 1. Population by Place of
Changes After Socialism*
 Changes After Socialism* November 2016 Leszek Balcerowicz *I m grateful to Magda Ciżkowicz, Aleksander Łaszek, Sonja Wap, Marek Tatała and Tomasz Dróżdż for their assistance in preparing this presentation.
Education Quality and Economic Development
 Education Quality and Economic Development Eric A. Hanushek Stanford University Bank of Israel Jerusalem, June 2017 Sustainable Development Goals (SDGs) Development = Growth Growth = Skills Conclusions
Contemporary Human Geography, 2e. Chapter 9. Development. Lectures. Karl Byrand, University of Wisconsin-Sheboygan Pearson Education, Inc.
 Contemporary Human Geography, 2e Lectures Chapter 9 Development Karl Byrand, University of Wisconsin-Sheboygan 9.1 Human Development Index Development The process of improving the material conditions of
Epidemiology of TB in the Western Pacific Region
 Epidemiology of TB in the Western Pacific Region First Asia-Pacific Region Conference IUATLD Kuala Lumpur August 3, 27 Tuberculosis notification rates, 25 Notified TB cases (new and relapse) per 1 population
Economic Systems. Essential Questions. How do different societies around the world meet their economic systems?
 Economic Systems Essential Questions How do different societies around the world meet their economic systems? What are the advantages and disadvantages of each system? Terms to know: Economics Economist
Guangxi Zhuang Autonomous Region 2013
 Guangxi Zhuang Autonomous Region 2013 By Sophie Lu LUP 011.8-3, Dec. 2013 Guangxi is the country s only area in the west which has a coastline and seaports. This region has the geographic advantage of