Post-socialist Transition in a Comparative Perspective
|
|
|
- Damon Jenkins
- 6 years ago
- Views:
Transcription
1 Post-socialist Transition in a Comparative Perspective March 11 th 2010 Leszek Balcerowicz
2 Leszek Balcerowicz Warsaw School of Economics 20 years of transformation in CEE: results, lessons, prospects London School of Economics, February 22 nd Socialism and its economic costs 2. Different institutional trajectories after socialism 3. Economic and non-economic outcomes 4. The global financial crisis and the CEE 5. Some lessons
3 1. Socialism and its economic costs
4 Initial conditions in transition countries: Nature of the socialist institutional system A. The control exerted by the socialist state was exceptionally extensive: private entrepreneurship was banned, which, together with the initial nationalisations, resulted in a monopoly of the state sector; state-owned enterprises were subject to central planning, which included output commands, rationing of input and foreign exchange, price controls, and directed foreign trade; the range of financial assets available to enterprises and individuals was extremely limited, as a market-type financial system could not have co-existed with central planning; the establishment and functioning of non-economic organisations were also heavily controlled, that is, civil society was suppressed and political opposition was banned; foreign travel was restricted; the media were subjected to formal censorship, direct party control and personnel policy the mass media were largely an instrument of communist state propaganda. 4
5 B. These extensive restrictions co-existed with an overgrown socialist welfare state, which included: relatively large transfers in kind (education, health); social protection delivered via state-owned enterprises (SOEs); artificially low prices for foodstuffs, energy, and housing; a social safety net, typical of some market economies, did not exist as the need for it was sharply limited through the curtailment of individuals opportunities and risks. C. The socialist state was peculiar with respect to the provision of public goods. Defence spending was excessive and was shaped by the imperial aspirations of the ruling elites. Law and order was kept at a reasonable level, but at the cost of practices typical of a police state. The legal framework and the justice system criminalized private economic activity and independent political activity, and were ill suited to the market economy, the rule of law and a free society. 5
6 Countries under communism lost a lot of distance to Western European economies. Per-capita GDP (in 1990 international dollars) in 1950 and 1990: Poland vs. Spain (239%) Hungary vs. Austria. (261%) (102%) (98%) (42%) (67%) 2480 (149%) 3706 (38%) Poland Spain Hungary Austria Source: Maddison Database. 6
7 Per-capita GDP (in 1990 international dollars) in 1950 and 2003: North Korea vs. South Korea Cuba vs. Chile (1396%) (426%) (100%) (100%) (7%) (56%) 2046 (179%) 3670 (23%) North Korea South Korea Cuba Chile Per-capita GDP (in 1990 international dollars) in China (Western Europe=100). 25% 20% 15% 10% 5% 0% Source: Maddison Database. 7
8 2. Different political trajectories after socialism
9 Political freedom (Polity IV)

10 Political freedom 2008 (Polity IV)
11 The Socialist System Institutional System in 2009 Institutional Change I. The Legal Framework 1. Classical (negative) rights Fully and extensively suppressed. Full catalogue, as in Western Attempts to exercise these rights legally democracies recognized as crimes Liberalizing legislation 2. Welfare (positive) rights Extensive catalogue - Secured the monopoly of social (i.e state) ownership and the operation of central planning - Little legal basis for the market transactions Prohibitively strong restrictions on setting up independent foundations and associations. In most countries: extensive catalogue, similar to that in some West European democracies 3. Economic laws - Full catalogue of laws supporting market transactions 4. Civil laws Regulations which ensure the freedom of association, i.e. the basis for the development of civil society Post-socialist legislation, including constitutions, entrenched welfare rights in most countries - Eliminating the command regulations - Massive legislation in support of the expanding markets. Substantial legislative effort in support of civil society Electoral laws which ensured the monopoly of the socialist party and made elections and parliaments into facades 5. Laws regulating political process Electoral laws which enable political pluralism Substantial legislative effort to support democracy
12 A monoparty holding power in an oppressive (antiliberal) state Rubber stamp institution The Socialist System Institutional System in 2009 Institutional Change Controlled by the party apparatus and grouped into many ministries to suit the needs of a command economy II. The Organizational System 6. The Party System A multi-party system 7. The Parliament The Parliament reflects the political pluralism. Varying regulations and practices governing the legislative process i.e. the quantity, quality and (in)stability of legislation 8. Public administration Basically apolitical and grouped into for fewer ministries. Specialized regulators e.g. in telecommunication, energy, media The transformation of the inherited parties and the development of new ones, based on liberalizing legislation and electoral laws From rubber stamp to democratic Parliament. Different changes in regulations and practices governing the legislative process Elimination of party control, reorganizations of the public administration. Creation of new regulatory bodies, modeled on the West 9. Local government Centralized state no room for local autonomy Autonomous local government Dividing the state power along the central local dimension 10. The Security Apparatus Very extensive and dominating over the police in order to block attempts to use classical rights Controlled by the Party and occasionally used as a ultimate tool to maintain its overall control Varying efficiency in preventing and dealing with ordinary crime. Weak constraints of the due process. Controlled by the party and easily used against the opponents of the regime Controlled by the Party and thus easily used for prosecuting socialist crimes. Dominating over the judiciary Radically changed in line with liberalizing legislation and in order to deal with new threats (e.g. terrorism) 11. The Army De-linked from the party system, subject to a different form of civil control. 12. The Police Different efficiency. Stronger constraints of due process. De-linked from the Party system. Dismantling the old apparatus, building the new one Different extent of restructuring and re(training) Different extent of restructuring and (re)training. 13. The Procuracy (Prosecutors) - Largely de-linked from the party system. Different extent of restructuring and retraining Focused on prosecuting ordinary crimes - Most of the legal dominance removed. Judges have legal controls over the key prosecutors decisions, e.g. on temporary arrests - Different efficiency
13 The Socialist System Institutional System in 2009 Institutional Change Subject to ultimate Party control and thus potential tools of political prosecution. - Penitentiaries weakly constrained by human rights. - Few, if any, specialists enforcing the courts decisions, say, in insolvency issues (bailiffs) 14. The Courts Legally independent. Varying efficiency 15. Organizations to enforce the courts rulings - Stronger constraints in relation to human rights, but situation differs across countries. - Expanded number of bailiffs etc., but situation differs across countries. Legal independence granted during the breakthrough period Different extent of reforms dealing with accountability and efficiency - Different extent of restructuring. - Development of new professions and organizations. Politically controlled by formal and informal censorship 16. The Media Free from political control, possibly except for the public media 17. Civil Society Suppressed by the legal framework, the security No legal restrictions. Different extent of apparatus and the Party control. development. Official social organizations e.g. trade unions, Restructured and reduced in size youth organizations, subject to Party control - In the financial sector the main organization was the mono-bank - Non financial organizations: overwhelming dominance of the state firms compulsorily grouped in the monopolistic, branch-based associations 18. Organizations of the Economy (narrowly defined) Independent central bank. Competing commercial banks - Many competing, mostly private firms Dismantling of political controls. Spontaneous growth of private media thanks to revenues from advertising resulting from the growth of a market economy Spontaneous growth of foundations and associations related to the growth of market economy Restructuring Separating the central bank from the mono-bank and granting it independence Privatization of the inherited state banks, entry of new ones. Creating the institutions of the capital market Dismantling of compulsory associations. Privatization of the inherited SOE s; entry of new private firms.
14 The Socialist System Institutional System in 2009 Institutional Change State monopoly of the supply and finance. Party control over sensitive subjects (social sciences) Monopoly of the public sector Education and research in the social sciences subject to ideological interventions and constraints, and largely isolated from the West. Research and development in technical sciences subjected to anti-innovative constraints and influences of the command economy. - Extensive pay-as-you go pension system. No private pension schems. - Extensive catalogue of other transfers in cash, but no unemployment benefits as open unemployment did not exist under socialism - Dominance of the state on the supply and the financing side of the health sector. 19. Elementary and Secondary Education Limited share of the non-public schools, privately financed. On the whole, little socialist ideology in the education programme 20. Higher education and Research Substantial share of the private sector in higher education. Education and research in social sciences largely free of ideological influence and constraints and open to contacts with the West. Different extent of the remnants of the R+D organizations inherited from socialism. New R+D organizations in the private sector, linked to technology transfer. 21. The Welfare State Basically preserved but in some countries increasingly supplemented by a funded system. - Basically preserved. Unemployment benefits available. - Financing largely private, more private provision Limited entry of the private sector Different extent of changes in the teaching programmes. Substantial entry of the private sector. Some restructuring of the public universities. Liberalizing the education and research in social sciences Different extent of restructuring of the inherited R+D organizations. Gradual development of the new R+D organizations in the private sector Different extent of reforms - Relatively little reform of the inherited transfers - Introduction of unemployment benefits and of the related labour offices. - Some reforms which enlarged the role of the private provision and changed the organizational form of the public payer.
15 The Socialist System Institutional System in 2009 Institutional Change III. Mechanisms of mass and regular interactions 22. Central planning Markets Dismantling of command mechanism, and largely spontaneous development of markets. 23. Collective bargaining as an autonomous mechanism nonexistent as both employers and employees organizations were controlled by the party Increased role of collective bargaining due to emergence of autonomous trade unions and employers organizations Dismantling of command mechanism, and largely spontaneous development of markets. Different extent of change. Source: Leszek Balcerowicz Institutional Change after Socialism and the Rule of Law, Hague Journal on the Rule of Law, 1: , 2009
16 Economic and Political Rights, Country Economic Rights (1) Political Rights (2) The Leaders Denmark Finland New Zealand Switzerland The Transition Countries Bulgaria Czech Republic 70 1 Estonia Hungary 70 1 Latvia Lithuania Poland Romania 30 2 Slovakia Slovenia Belarus Russia Ukraine China Other OECD Comparators Greece Italy Portugal 70 1 Spain 70 1 (1) Heritage Foundation, Index of Economic Freedom, 2009 (2) Freedom House, Freedom in the World, 2009 Source: Leszek Balcerowicz Institutional Change after Socialism and the Rule of Law, Hague Journal on the Rule of Law, 1: , 2009
17 The Court s Independence, Impartiality and Efficiency Country Judicial (1) Judicial Impartiality (2) Contract Enforcement Contract Enforcement days (3) cost (% of debt) (4) Leaders in Political and Economic Rights Denmark Finland 9 8, New Zeland 9 8, Swizerland 8,5 8, Transition Countries Bulgaria Czech Republic Estonia 7 6, Hungary 5, Latvia 4,5 4, Lithuania Poland 4, Romania Slovakia 4 4, Slovenia Belarus Russi 2,5 2, Ukraine 2, ,5 China 4 4, OECD Comparatives Greece 5,5 6 5, Italy 4,5 5 3,5 4, Portugal 7, , Spain 4, , (1) and (2) Fraser Institute, Economic Freedom of the World: 2008 Annual Report (3) and (4) World Bank Source: Leszek Balcerowicz Institutional Change after Socialism and the Rule of Law, Hague Journal on the Rule of Law, 1: , 2009
18 3. Economic and non-economic outcomes
19 180% 160% 140% 120% 100% 80% 60% 40% 20% 0% 71% 72% (1998)(1993) GDP 2008 Lowest GDP level between 1989 and 2008 (year of the bottom) 84% 92% (1994) (1993) 121% 107% 114%115%120% 101% (1993) GDP growth (1989 = 100%) (1998) (1997) (1993) 154%154% 159%161% 138% 143% 130% 177% (1993) (1992) (1991) (1992)(1993) (1997) (1994) (1992) (1994)(1993) Source: EBRD Transition Report 2008; EU Commision
20 Source: EBRD Transition Report 2008; WB WDI, IMF WEO
21 GDP per capita, ppp, GK$ 1990, Germany=100% Transition economies GDP per capita against Germany's GDP 55% (Germany= 100%, GK$ 1990, PPP) 50% Poland 45% EU NMS CIS 40% 35% 30% 25% 20% NMS=Bulgaria, Czech R., Estonia, Hungary, Latvia, Lithuania, Slovak R., Romania CIS=Armenia, Azerbaijan, Belarus, Kazakhstan, Kyrgyzstan,Moldova, Russia, Turkmenistan, Tajikistan,Uzbekistan Ukraine Source: The Conference Board and Groningen Growth and Development Centre, Total Economy Database, January 2009
22 Source: WB WDI

23 Source: WB World Development Indicators 23
24 Source: WB World Development Indicators 24

25 Source: WB World Development Indicators 25
26 Explaining the differences in economic outcomes The principal factors explaining differences in growth rates are: initial conditions, external developments (e.g. the Russian crisis) including: - access to markets, location, extent of market reforms and the nature of macroeconomic policies: most important in the long run 26
27 These findings are strongly supported by substantial empirical literature reviewing the experience of countries in transition. Polanec, Saŝo (2004) Krueger, Anne O. (2004) Fischer, Stanley; Sahay, Ratna (2004) Falcetti, Elisabetta; Lysenko, Tatiana; Sanfey, Peter (2006) ( ) we find that in later stages of transition, measures of economic reforms matter for productivity growth, although with a lag, which is in our exercise equal to four years. This result confirms importance of reform efforts in enhancing the potential for growth. ( ) it is worth noting that those transition countries that experienced the most rapid structural reforms have, by and large, experienced more rapid growth. This is true, for example, of the Baltic States. In recent years, Russia has also seen higher rates of growth a result, in large measure, of reforms that were implemented in the 1990s. The general conclusion was that the effect of initial conditions, while strong at the start of transition, wears off over time ( ). Moreover, the importance of the fiscal policy variable (the budget balance) increases with the longer period data set. The coefficients on the reform indices ( ) are significant throughout the period, irrespective of the time period considered. During transition, a positive correlation between progress in marketoriented reforms and cumulative growth is observed for most countries. This is reassuring to those who have promoted the virtues of reforms; is also serves as a warning of the dangers that arise when reform fatigue set in, as it appears to have done in parts of some region ( ) We find that the importance of initial conditions as a determinant of growth has declined over time, but that fiscal surpluses remain positively associated with higher growth. 27
28 Why better economic results go hand in hand with better non-economic indicators (health, environment, etc.)? Some crucial factors conducive to long-term economic growth are also conducive to environmental improvement and to favourable health-related developments, e.g. less waste economic reforms less environmental deterioration and less damage to health healthier foodstuffs become more available and relatively cheaper stronger rule of law privatisation (separation of companies from the state) ecological regulations are more strictly observed 28
29 4. The global financial crisis and the CEE 4.1 Before the crisis

30 Source: IMF, World Economic Outlook
31 Source: IMF, World Economic Outlook
32 Source: EBRD Transition Report 2008, EC Spring 2009 forecast 32
33 55% 52% General government expenditure (%GDP) 50% 50% 49% % 46% 45% 45% 45% 44% 42% 45% 44% 44% 43% 43% 42% 41% % 35% 34% 33% 38% 36% 40% 35% 34% 39% 39% 37% 37% 37% 34% 33% 38% 37% 35% 35% 34% 33% 30% Source: EBRD Transition Report 2008, EC Spring 2009 forecast 33

34 N/A Source: EBRD Transition Report
35 45% Domestic credit to households (%GDP) 43% 43% 40% 35% % 38% 30% 25% 20% 15% 10% 5% 9% 7% 5% 2007 average: 23% 19% 20% 20% 18% 16% 17% 17% 15% 16% 13% 14% 12% 11% 11% 7% 19% 16% 22% 23% 23% 15% 17% 14% 8% 18% 12% 24% 27% 28% 0% Source: EBRD Transition Report 2008,
 150% 100% 50% 0% Source: World Bank EU10 Report, II")
36 300% Loan to deposit ratio, % 200% Share of FX Denominated Bank Loans in Loans to the Private Sector (%, ) 150% 100% 50% 0% Source: World Bank EU10 Report, II 2009

37 Source: EBRD Transition Report 2008, 37
38 4. The global financial crisis and the CEE 4.2 Determinants of the CEE countries vulnerability

39 Source: WB World Development Indicators 39
40 GDP gorwth (yoy) Steel prices growth (yoy) 2. Dependence on commodities export 16% 14% 12% 10% Ukraine In 2008 steel export (with world prices well above long term average) represented 15% GDP (40% of overall export). Ukraine: GDP growth vs. steel prices Real GDP growth (LHS) steel prices growth (RHS) 50% 40% 30% Russia In 2007 minerals (including gas and oil) together with metals represented 80% of Russian export and quater of GDP. Machinery represented only 6% of export, but over 50% of import. 6% 5% Russian export structure 8% mineral products metals, etc 8% 6% 4% 2% 20% 10% 0% 16% 65% chemicals machinery & transport others 0% 1Q2003 1Q2005 1Q2007 Source: Ukrainian statistical office -10% 4Q2008: GDP -8%, steel - 15%, both out of scale Source: Federal state statistics service 40
41 Average annual real credit growth rate Average annual real credit growth rate Dependence on credit Rapid credit growth fueled GDP growth in the past (particularly ), but now has become a source of vulnerability. PL PL Average GDP growth GDP growth forecasts for 2009 The faster was credit growth during period, the faster was GDP growth in that period, but also the stepper is forecasted GDP decline in 2009 Source: EBRD Transition Report 2008, Economist forecasts, ECB, central banks 41
42 4. The global financial crisis and the CEE 4.3 Impact of the crisis
43
44
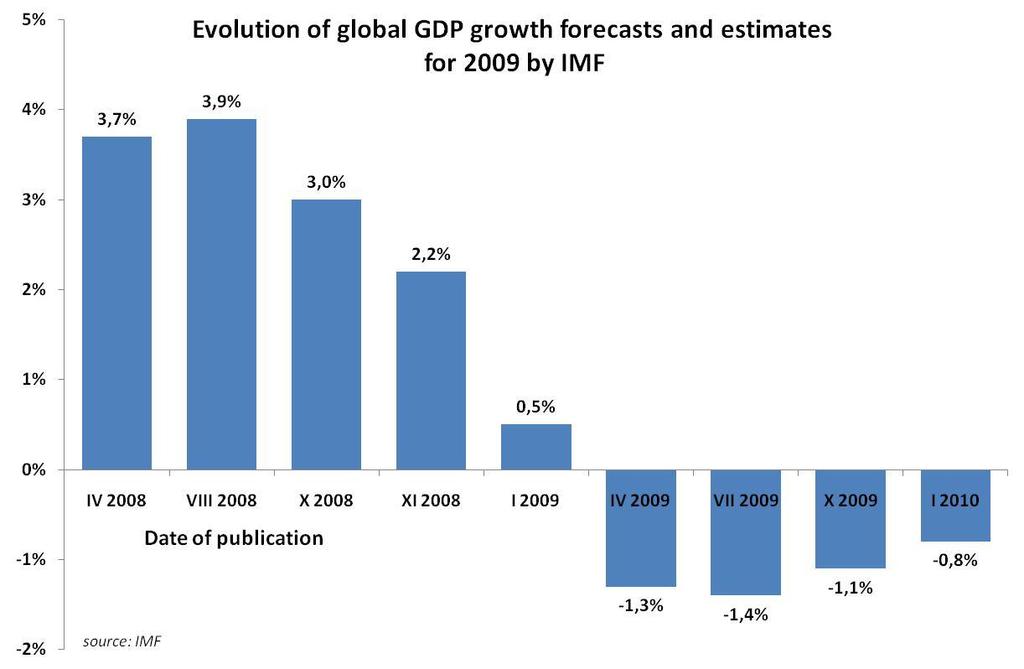
45 Short-term outlook Changing forecasts for GDP growth in 2009 (IMF) 10% 5% 0% -5% IV ,5% 3,5% 3,7% 4,1% 4,5% 4,7% 4,7% 4,8% 5,5% 5,6% 6,3% 0,5% LV HUN SL EST UA PL CZ RO BG LT SK RUS 10% 5% 0% -5% X ,5% 0,7% 2,3% 2,5% 3,4% 3,7% 3,8% 4,3% 4,8% 5,5% 5,6% LV EST LT HUN UA CZ SL PL BG RO RUS SK -2,2% -10% -10% -15% -15% -20% 10% IV % 10% X % 0% -5% -10% -15% LV EST LT UA RUS RO CZ HUN SL SK BG PL -4,1% -3,5% -3,3% -2,7%-2,1%-2,0% -0,7% -6,0% -8,0% -10,0%-10,0% -12,0% 5% 0% -5% -10% -15% 1% LT LV EST UA RO RUS HUN BG SL SK CZ PL -5% -5% -4% -8% -8% -7% -7% -14% -14% -20% -20% -19% -18%
46 5. Some lessons
47

48 Countries with GG deficit: expenditure=revenue+deficit GG expenditures (%GDP) Countries with GG surplus: expenditure Expenditure Deficit Revenue Source: Eurostat

49 Source: World Bank Doing Business Report 2010 Dodać Singapur

50 Source: Eurostat Economically Active Population (15-64 years old) 2008
51 Thank you for your attention
52 Polity IV description Brief Description: The Polity conceptual scheme is unique in that it examines concomitant qualities of democratic and autocratic authority in governing institutions, rather than discreet and mutually exclusive forms of governance. This perspective envisions a spectrum of governing authority that spans from fully institutionalized autocracies through mixed, or incoherent, authority regimes (termed "anocracies") to fully institutionalized democracies. The "Polity Score" captures this regime authority spectrum on a 21-point scale ranging from -10 (hereditary monarchy) to +10 (consolidated democracy). The Polity scores can also be converted to regime categories: we recommend a three-part categorization of "autocracies" (-10 to -6), "anocracies" (-5 to +5 and the three special values: -66, -77, and -88), and "democracies" (+6 to +10); see "Global Regimes by Type, " above. The Polity scheme consists of six component measures that record key qualities of executive recruitment, constraints on executive authority, and political competition. It also records changes in the institutionalized qualities of governing authority. The Polity data include information only on the institutions of the central government and on political groups acting, or reacting, within the scope of that authority. It does not include consideration of groups and territories that are actively removed from that authority (i.e., separatists or "fragments"; these are considered separate, though not independent, polities) or segments of the population that are not yet effectively politicized in relation to central state politics.
Changes After Socialism*
 Changes After Socialism* November 2015 Leszek Balcerowicz Warsaw School of Economics *I m grateful to Magda Ciżkowicz, Aleksander Łaszek, Sonja Wap, Marek Tatała and Tomasz Dróżdż for their assistance
Changes After Socialism*
 Changes After Socialism* November 2016 Leszek Balcerowicz *I m grateful to Magda Ciżkowicz, Aleksander Łaszek, Sonja Wap, Marek Tatała and Tomasz Dróżdż for their assistance in preparing this presentation.
Convergence: a narrative for Europe. 12 June 2018
 Convergence: a narrative for Europe 12 June 218 1.Our economies 2 Luxembourg Ireland Denmark Sweden Netherlands Austria Finland Germany Belgium United Kingdom France Italy Spain Malta Cyprus Slovenia Portugal
Transition: Changes after Socialism (25 Years Transition from Socialism to a Market Economy)
") Transition: Changes after Socialism (25 Years Transition from Socialism to a Market Economy) Summary of Conference of Professor Leszek Balcerowicz, Warsaw School of Economics at the EIB Institute, 24 November
Transition: Changes after Socialism (25 Years Transition from Socialism to a Market Economy) Summary of Conference of Professor Leszek Balcerowicz, Warsaw School of Economics at the EIB Institute, 24 November
OECD ECONOMIC SURVEY OF LITHUANIA 2018 Promoting inclusive growth
 OECD ECONOMIC SURVEY OF LITHUANIA 218 Promoting inclusive growth Vilnius, 5 July 218 http://www.oecd.org/eco/surveys/economic-survey-lithuania.htm @OECDeconomy @OECD 2 21 22 23 24 25 26 27 28 29 21 211
After the crisis: what new lessons for euro adoption?
 After the crisis: what new lessons for euro adoption? Zsolt Darvas Croatian Parliament 15 November 2017, Zagreb Background and questions Among the first 15 EU member states, Mediterranean countries experienced
The Boom-Bust in the EU New Member States: The Role of Fiscal Policy
 The Boom-Bust in the EU New Member States: The Role of Fiscal Policy JVI Lecture, Vienna, January 21, 216 Bas B. Bakker Senior Regional Resident Representative for Central and Eastern Europe Outline The
Migration and the European Job Market Rapporto Europa 2016
 Migration and the European Job Market Rapporto Europa 2016 1 Table of content Table of Content Output 11 Employment 11 Europena migration and the job market 63 Box 1. Estimates of VAR system for Labor
Is the transition countries reliance on foreign capital a sign of success or failure?
 Is the transition countries reliance on foreign capital a sign of success or failure? Christoph Rosenberg IMF Regional Office for Central Europe and the Baltics UNECE FfD Regional Consultation Expert Meeting
Mark Allen. The Financial Crisis and Emerging Europe: What Happened and What s Next? Senior IMF Resident Representative for Central and Eastern Europe
 The Financial Crisis and Emerging Europe: What Happened and What s Next? Seminar with Romanian Trade Unions Bucharest, November 2, 21 Mark Allen Senior IMF Resident Representative for Central and Eastern
This document is available on the English-language website of the Banque de France
 JUNE 7 This document is available on the English-language website of the www.banque-france.fr Countries ISO code Date of entry into the euro area Fixed euro conversion rates France FR //999.97 Germany
Looking Through the Crystal Ball: For Growth and Productivity, Can Central Europe be of Service?
 Looking Through the Crystal Ball: For Growth and Productivity, Can Central Europe be of Service? ARUP BANERJI REGIONAL DIRECTOR FOR EUROPEAN UNION MEMBER STATES THE WORLD BANK 6 th Annual NBP Conference
"Science, Research and Innovation Performance of the EU 2018"
 "Science, Research and Innovation Performance of the EU 2018" Innovation, Productivity, Jobs and Inequality ERAC Workshop Brussels, 4 October 2017 DG RTD, Unit A4 Key messages More robust economic growth
Leszek Balcerowicz The Institutional Systems and the Quality of Life*
 14 th European Association for Comparative Economic Studies Conference Leszek Balcerowicz The Institutional Systems and the Quality of Life* Keynote speech *I am grateful to Tomasz Dróżdż and Paulina Woźniak
The Israeli Economy: Current Trends, Strength and Challenges
 The Israeli Economy: Current Trends, Strength and Challenges Dr. Karnit Flug Governor of the Bank of Israel 30.06.2017 1 GDP per capita Growth Rates 8 GDP per capita annual % change (2000-2018F) 6 4 2
Supplementary figures
 Supplementary figures Source: OECD (211d, p. 8). Figure S3.1 Business enterprise expenditure on R&D, 1999 and 29 (as a percentage of GDP) ISR FIN SWE KOR (1999, 28) JPN CHE (2, 28) USA (1999, 28) DNK AUT
BULGARIAN TRADE WITH EU IN JANUARY 2017 (PRELIMINARY DATA)
") BULGARIAN TRADE WITH EU IN JANUARY 2017 (PRELIMINARY DATA) In January 2017 Bulgarian exports to the EU increased by 7.2% month of 2016 and amounted to 2 426.0 Million BGN (Annex, Table 1 and 2). Main trade
BULGARIAN TRADE WITH EU IN JANUARY 2017 (PRELIMINARY DATA) In January 2017 Bulgarian exports to the EU increased by 7.2% month of 2016 and amounted to 2 426.0 Million BGN (Annex, Table 1 and 2). Main trade
WORLDWIDE DISTRIBUTION OF PRIVATE FINANCIAL ASSETS
 WORLDWIDE DISTRIBUTION OF PRIVATE FINANCIAL ASSETS Munich, November 2018 Copyright Allianz 11/19/2018 1 MORE DYNAMIC POST FINANCIAL CRISIS Changes in the global wealth middle classes in millions 1,250
BULGARIAN TRADE WITH EU IN THE PERIOD JANUARY - MARCH 2016 (PRELIMINARY DATA)
") BULGARIAN TRADE WITH EU IN THE PERIOD JANUARY - MARCH 2016 (PRELIMINARY DATA) In the period January - March 2016 Bulgarian exports to the EU grew by 2.6% in comparison with the same 2015 and amounted to
BULGARIAN TRADE WITH EU IN THE PERIOD JANUARY - MARCH 2016 (PRELIMINARY DATA) In the period January - March 2016 Bulgarian exports to the EU grew by 2.6% in comparison with the same 2015 and amounted to
Stuck in Transition? STUCK IN TRANSITION? TRANSITION REPORT Jeromin Zettelmeyer Deputy Chief Economist. Turkey country visit 3-6 December 2013
 TRANSITION REPORT 2013 www.tr.ebrd.com STUCK IN TRANSITION? Stuck in Transition? Turkey country visit 3-6 December 2013 Jeromin Zettelmeyer Deputy Chief Economist Piroska M. Nagy Director for Country Strategy
Measuring Social Inclusion
 Measuring Social Inclusion Measuring Social Inclusion Social inclusion is a complex and multidimensional concept that cannot be measured directly. To represent the state of social inclusion in European
Informal Ministerial Meeting of the EU Accession Countries
 1 of 7 Informal Ministerial Meeting of the EU Accession Countries EU Enlargement and the Free Movement of Labour Geneva, June 14,2001 The on-going negotiations on the eastern enlargement of the European
Challenges for Baltics as for the Eurozone countries having Advanced Economy status
 Challenges for Baltics as for the Eurozone countries having Advanced Economy status 4th European High-level Panel Discussion on Banking Vilnius, February 4, 216 Bas B. Bakker Senior Regional Resident Representative
Curing Europe s Growing Pains: Which Reforms?
 Curing Europe s Growing Pains: Which Reforms? Luc Everaert Assistant Director European Department International Monetary Fund Brussels, 21 November Copyright rests with the author. All rights reserved.
BULGARIAN TRADE WITH EU IN THE PERIOD JANUARY - FEBRUARY 2017 (PRELIMINARY DATA)
") BULGARIAN TRADE WITH EU IN THE PERIOD JANUARY - FEBRUARY 2017 (PRELIMINARY DATA) In the period January - February 2017 Bulgarian exports to the EU increased by 9.0% to the same 2016 and amounted to 4 957.2
BULGARIAN TRADE WITH EU IN THE PERIOD JANUARY - FEBRUARY 2017 (PRELIMINARY DATA) In the period January - February 2017 Bulgarian exports to the EU increased by 9.0% to the same 2016 and amounted to 4 957.2
Stimulating Investment in the Western Balkans. Ellen Goldstein World Bank Country Director for Southeast Europe
 Stimulating Investment in the Western Balkans Ellen Goldstein World Bank Country Director for Southeast Europe February 24, 2014 Key Messages Location, human capital and labor costs make investing in the
The Impact of the Global Economic Crisis on Central and Eastern Europe. Mark Allen
 The Impact of the Global Economic Crisis on Central and Eastern Europe Fourth Central European CEMS Conference Warsaw, February 25, 211 Mark Allen Senior IMF Resident Representative for Central and Eastern
BULGARIAN TRADE WITH EU IN THE PERIOD JANUARY - JUNE 2014 (PRELIMINARY DATA)
") BULGARIAN TRADE WITH EU IN THE PERIOD JANUARY - JUNE 2014 (PRELIMINARY DATA) In the period January - June 2014 Bulgarian exports to the EU increased by 2.8% to the corresponding the year and amounted to
BULGARIAN TRADE WITH EU IN THE PERIOD JANUARY - JUNE 2014 (PRELIMINARY DATA) In the period January - June 2014 Bulgarian exports to the EU increased by 2.8% to the corresponding the year and amounted to
APPENDIX 1: MEASURES OF CAPITALISM AND POLITICAL FREEDOM
 1 APPENDIX 1: MEASURES OF CAPITALISM AND POLITICAL FREEDOM All indicators shown below were transformed into series with a zero mean and a standard deviation of one before they were combined. The summary
The political economy of electricity market liberalization: a cross-country approach
 The political economy of electricity market liberalization: a cross-country approach Erkan Erdogdu PhD Candidate The 30 th USAEE/IAEE North American Conference California Room, Capital Hilton Hotel, Washington
HAS GROWTH PEAKED? 2018 growth forecasts revised upwards as broad-based recovery continues
 HAS GROWTH PEAKED? 2018 growth forecasts revised upwards as broad-based recovery continues Regional Economic Prospects May 2018 Stronger growth momentum: Growth in Q3 2017 was the strongest since Q3 2011
Hungary s Authoritarian U-Turn Background and Prospects. Tamás Bauer
 Hungary s Authoritarian U-Turn Background and Prospects Tamás Bauer Hungary s changed position Earlier proud of Hungary pioneering role in reforming the planned economy Pioneer of economic and political
2018 BAVARIA S ECONOMY FACTS AND FIGURES
 Bavarian Ministry of Economic Affairs, Energy and Technology 2018 BAVARIA S ECONOMY FACTS AND FIGURES wwwstmwibayernde As of August 2018 Area Population (3006) 1) females males age 0-14 (3112) 15-64 65+
WILL CHINA S SLOWDOWN BRING HEADWINDS OR OPPORTUNITIES FOR EUROPE AND CENTRAL ASIA?
 ECA Economic Update April 216 WILL CHINA S SLOWDOWN BRING HEADWINDS OR OPPORTUNITIES FOR EUROPE AND CENTRAL ASIA? Maurizio Bussolo Chief Economist Office and Asia Region April 29, 216 Bruegel, Brussels,
September 2012 Euro area unemployment rate at 11.6% EU27 at 10.6%
 STAT/12/155 31 October 2012 September 2012 Euro area unemployment rate at 11.6% at.6% The euro area 1 (EA17) seasonally-adjusted 2 unemployment rate 3 was 11.6% in September 2012, up from 11.5% in August
1. Why do third-country audit entities have to register with authorities in Member States?
 Frequently Asked Questions (FAQ) Form A Annex to the Common Application Form for Registration of Third-Country Audit Entities under a European Commission Decision 2008/627/EC of 29 July 2008 on transitional
Industrial Relations in Europe 2010 report
 MEMO/11/134 Brussels, 3 March 2011 Industrial Relations in Europe 2010 report What is the 'Industrial Relations in Europe' report? The Industrial Relations in Europe report provides an overview of major
EUROBAROMETER 72 PUBLIC OPINION IN THE EUROPEAN UNION
 Standard Eurobarometer European Commission EUROBAROMETER 72 PUBLIC OPINION IN THE EUROPEAN UNION AUTUMN 2009 COUNTRY REPORT SUMMARY Standard Eurobarometer 72 / Autumn 2009 TNS Opinion & Social 09 TNS Opinion
Consumer Barometer Study 2017
 Consumer Barometer Study 2017 The Year of the Mobile Majority As reported mobile internet usage crosses 50% 2 for the first time in all 63 countries covered by the Consumer Barometer Study 1, we look at
A. The image of the European Union B. The image of the European Parliament... 10
 Directorate General for Communication Direction C Relations with citizens PUBLIC OPINION MONITORING UNIT EUROPEAN ELECTIONS 2009 25/05/2009 Pre electoral survey First wave First results: European average
GERMANY, JAPAN AND INTERNATIONAL PAYMENT IMBALANCES
 Articles Articles Articles Articles Articles CENTRAL EUROPEAN REVIEW OF ECONOMICS & FINANCE Vol. 2, No. 1 (2012) pp. 5-18 Slawomir I. Bukowski* GERMANY, JAPAN AND INTERNATIONAL PAYMENT IMBALANCES Abstract
The Economies in Transition: The Recovery
 Georgetown University From the SelectedWorks of Robert C. Shelburne October, 2011 The Economies in Transition: The Recovery Robert C. Shelburne, United Nations Economic Commission for Europe Available
Data Protection in the European Union. Data controllers perceptions. Analytical Report
 Gallup Flash Eurobarometer N o 189a EU communication and the citizens Flash Eurobarometer European Commission Data Protection in the European Union Data controllers perceptions Analytical Report Fieldwork:
An anatomy of inclusive growth in Europe*
 An anatomy of inclusive growth in Europe* Zsolt Darvas Bruegel and Corvinus University of Budapest * Based on a joint work with Guntram B.Wolff Inclusive growth: global and European lessons for Spain 31
Collective Bargaining in Europe
 Collective Bargaining in Europe Collective bargaining and social dialogue in Europe Trade union strength and collective bargaining at national level Recent trends and particular situation in public sector
Alternative views of the role of wages: contours of a European Minimum Wage
 Alternative views of the role of wages: contours of a European Minimum Wage Europe at a crossroads which way to quality jobs and prosperity? ETUI-ETUC Conference Brussels, 24-26 September 2014 Dr. Torsten
Special Eurobarometer 467. Report. Future of Europe. Social issues
 Future of Europe Social issues Fieldwork Publication November 2017 Survey requested by the European Commission, Directorate-General for Communication and co-ordinated by the Directorate- General for Communication
Earnings, education and competences: can we reverse inequality? Daniele Checchi (University of Milan and LIS Luxemburg)
") Earnings, education and competences: can we reverse inequality? Daniele Checchi (University of Milan and LIS Luxemburg) 1 Educational policies are often invoked as good instruments for reducing income
Earnings, education and competences: can we reverse inequality? Daniele Checchi (University of Milan and LIS Luxemburg) 1 Educational policies are often invoked as good instruments for reducing income
INTERNAL SECURITY. Publication: November 2011
 Special Eurobarometer 371 European Commission INTERNAL SECURITY REPORT Special Eurobarometer 371 / Wave TNS opinion & social Fieldwork: June 2011 Publication: November 2011 This survey has been requested
Standard Eurobarometer 85. Public opinion in the European Union
 Public opinion in the European Union Fieldwork: May 2016 Survey conducted by TNS opinion & social at the request of the European Commission, Directorate-General for Communication Survey coordinated by
THE CORRUPTION AND THE ECONOMIC PERFORMANCE
 THE CORRUPTION AND THE ECONOMIC PERFORMANCE Jana Soukupová Abstract The paper deals with comparison of the level of the corruption in different countries and the economic performance with short view for
Migration as an Adjustment Mechanism in a Crisis-Stricken Europe
 Migration as an Adjustment Mechanism in a Crisis-Stricken Europe Martin Kahanec Central European University (CEU), Budapest Institute for the Study of Labor (IZA), Bonn Central European Labour Studies
Euro area unemployment rate at 9.9% EU27 at 9.4%
 STAT/11/76 April 2011 Euro area unemployment rate at 9.9% EU27 at 9.4% The euro area 1 (EA17) seasonally-adjusted 2 unemployment rate 3 was 9.9% in April 2011, unchanged compared with March 4. It was.2%
Context Indicator 17: Population density
 3.2. Socio-economic situation of rural areas 3.2.1. Predominantly rural regions are more densely populated in the EU-N12 than in the EU-15 Context Indicator 17: Population density In 2011, predominantly
EUROPEAN YOUTH: PARTICIPATION IN DEMOCRATIC LIFE
 Flash Eurobarometer 375 EUROPEAN YOUTH: PARTICIPATION IN DEMOCRATIC LIFE SUMMARY Fieldwork: April 2013 Publication: May 2013 This survey has been requested by the European Commission, Directorate-General
Regional Economic Context and Economic Trends in Ukraine
 Regional Economic Context and Economic Trends in Ukraine Konstantine Kintsurashvili June 2017 ECONOMIC PROSPECTS: EBRD REGION 2 Growth in the EBRD region is to pick up in 2017 and 2018 In 2017-18, EBRD
wiiw Workshop Connectivity in Central Asia Mobility and Labour Migration
 wiiw Workshop Connectivity in Central Asia Mobility and Labour Migration Vienna 15-16 December 2016 Radim Zak Programme Manager, ICMPD Radim.Zak@icmpd.org The project is funded by the European Union What
Russian Federation. OECD average. Portugal. United States. Estonia. New Zealand. Slovak Republic. Latvia. Poland
 INDICATOR TRANSITION FROM EDUCATION TO WORK: WHERE ARE TODAY S YOUTH? On average across OECD countries, 6 of -19 year-olds are neither employed nor in education or training (NEET), and this percentage
Miracle of Estonia Entrepreneurship and Competitiveness Policy in Estonia
 Miracle of Estonia Entrepreneurship and Competitiveness Policy in Estonia Signe Ratso Deputy Secretary General of EU and International Co-operation Ministry of Economic Affairs and Communications of Estonia
ERGP REPORT ON CORE INDICATORS FOR MONITORING THE EUROPEAN POSTAL MARKET
 ERGP (15) 27 Report on core indicators for monitoring the European postal market ERGP REPORT ON CORE INDICATORS FOR MONITORING THE EUROPEAN POSTAL MARKET 3 December 2015 CONTENTS 1. EXECUTIVE SUMMARY...
EUROPEAN UNION UNEMPLOYMENT AND SOCIAL EXCLUSION
 EUROPEAN UNION UNEMPLOYMENT AND SOCIAL EXCLUSION NAE Tatiana-Roxana junior teaching assistant / Ph.D. student), Faculty of Commerce, Academy of Economic Studies, Bucharest, Romania, nae.roxana@yahoo.com
BRAND. Cross-national evidence on the relationship between education and attitudes towards immigrants: Past initiatives and.
 Cross-national evidence on the relationship between education and attitudes towards immigrants: Past initiatives and future OECD directions EMPLOYER BRAND Playbook Promoting Tolerance: Can education do
Gender pay gap in public services: an initial report
 Introduction This report 1 examines the gender pay gap, the difference between what men and women earn, in public services. Drawing on figures from both Eurostat, the statistical office of the European
VISA POLICY OF THE REPUBLIC OF KAZAKHSTAN
 VISA POLICY OF THE REPUBLIC OF KAZAKHSTAN Country Diplomatic Service National Term of visafree stay CIS countries 1 Azerbaijan visa-free visa-free visa-free 30 days 2 Kyrgyzstan visa-free visa-free visa-free
Inclusion and Gender Equality in China
 Inclusion and Gender Equality in China 12 June 2017 Disclaimer: The views expressed in this publication are those of the authors and do not necessarily reflect the views and policies of the Asian Development
Taiwan s Development Strategy for the Next Phase. Dr. San, Gee Vice Chairman Taiwan External Trade Development Council Taiwan
 Taiwan s Development Strategy for the Next Phase Dr. San, Gee Vice Chairman Taiwan External Trade Development Council Taiwan 2013.10.12 1 Outline 1. Some of Taiwan s achievements 2. Taiwan s economic challenges
The regional and urban dimension of Europe 2020
 ESPON Workshop The regional and urban dimension of Europe 2020 News on the implementation of the EUROPE 2020 Strategy Philippe Monfort DG for Regional Policy European Commission 1 Introduction June 2010
DETERMINANTS OF GROWTH IN THE EU MEMBER STATES OF CENTRAL AND EASTERN EUROPE 1
 DETERMINANTS OF GROWTH IN THE EU MEMBER STATES OF CENTRAL AND EASTERN EUROPE 1 After the recession following the collapse of the centrally planned economies at the beginning of the 199s, the countries
Macroeconomic Outlook and Challenges for the CEE Region. Luboš Komárek CFO Executive Summit Prague, 29 th April 2015
 Macroeconomic Outlook and Challenges for the CEE Region Luboš Komárek CFO Executive Summit Prague, 29 th April 2015 Outline I. Mapping out the current situation and economic forecast United States Euro
Economic Growth, Foreign Investments and Economic Freedom: A Case of Transition Economy Kaja Lutsoja
 Economic Growth, Foreign Investments and Economic Freedom: A Case of Transition Economy Kaja Lutsoja Tallinn School of Economics and Business Administration of Tallinn University of Technology The main
Widening of Inequality in Japan: Its Implications
 Widening of Inequality in Japan: Its Implications Jun Saito, Senior Research Fellow Japan Center for Economic Research December 11, 2017 Is inequality widening in Japan? Since the publication of Thomas
2014 BELGIAN FOREIGN TRADE
 2014 BELGIAN FOREIGN TRADE 2 3 01 \\ EXPORTS 6 1.1 Geographical developments 1.2 Sectoral developments 02 \\ IMPORTS 14 2.1 Geographical developments 2.2 Sectoral developments 03 \\ GEOGRAPHICAL TRADE
Determinants of the Trade Balance in Industrialized Countries
 Determinants of the Trade Balance in Industrialized Countries Martin Falk FIW workshop foreign direct investment Wien, 16 Oktober 2008 Motivation large and persistent trade deficits USA, Greece, Portugal,
OVERVIEW OF CENTRAL AND EASTERN EUROPE CAR MARKETS
 OVERVIEW OF CENTRAL AND EASTERN EUROPE CAR MARKETS MAY 2005 Presentation by Dale Butcher Group Development Director, Inchcape plc OVERVIEW OF CEE AUTOMOTIVE MARKETS 322 ( 000 Units) 354 2 137 17.5 Estonia
3-The effect of immigrants on the welfare state
 3-The effect of immigrants on the welfare state Political issues: Even if in the long run migrants finance the pay as you go pension system, migrants may be very costly for the destination economy because
The 2006 Robert Schuman Lecture The Honourable Leszek Balcerowicz President, National Bank of Poland Residence Palace, Brussels 23 January, 2006
 The 2006 Robert Schuman Lecture The Honourable Leszek Balcerowicz President, National Bank of Poland Residence Palace, Brussels 23 January, 2006 Presentation Agenda: I. Facts about Convergence and Divergence.
The effect of migration in the destination country:
 The effect of migration in the destination country: This topic can be broken down into several issues: 1-the effect of immigrants on the aggregate economy 2-the effect of immigrants on the destination
The Economies in Transition: The Recovery Project LINK, New York 2011 Robert C. Shelburne Economic Commission for Europe
 The Economies in Transition: The Recovery Project LINK, New York 2011 Robert C. Shelburne Economic Commission for Europe EiT growth was similar or above developing countries pre-crisis, but significantly
EUROBAROMETER The European Union today and tomorrow. Fieldwork: October - November 2008 Publication: June 2010
 EUROBAROMETER 66 Standard Eurobarometer Report European Commission EUROBAROMETER 70 3. The European Union today and tomorrow Fieldwork: October - November 2008 Publication: June 2010 Standard Eurobarometer
Andrew Wyckoff, OECD ITIF Innovation Forum Washington, DC 21 July 2010
 OECD s Innovation Strategy: Getting a Head Start on Tomorrow Andrew Wyckoff, OECD ITIF Innovation Forum Washington, DC 21 July 2010 www.oecd.org/innovation/strategy 1 Overview What is OECD s Innovation
UNDER EMBARGO UNTIL 9 APRIL 2018, 15:00 HOURS PARIS TIME
 TABLE 1: NET OFFICIAL DEVELOPMENT ASSISTANCE FROM DAC AND OTHER COUNTRIES IN 2017 DAC countries: 2017 2016 2017 ODA ODA/GNI ODA ODA/GNI ODA Percent change USD million % USD million % USD million (1) 2016
Special Eurobarometer 461. Report. Designing Europe s future:
 Designing Europe s future: Trust in institutions Globalisation Support for the euro, opinions about free trade and solidarity Fieldwork Survey requested by the European Commission, Directorate-General
Poland s ECONOMIC PERFORMANCE
 Poland s ECONOMIC PERFORMANCE Trade and Investment Promotion Section Embassy of the Republic of Poland in The Hague June 2014 Project co-financed by the European Union from European Regional Development
Economic Meaning of Emerging Communication Technologies for CEE Countries and Baltic States. CEE Countries and Baltic States
 Economic Meaning of Emerging Communication Technologies for CEE Countries and Baltic States Jaroslaw K. Ponder Market, Economics and Fianance Unit Telecommunciation Development Biureau International Telecommunication
NATIONAL INTEGRITY SYSTEM ASSESSMENT ROMANIA. Atlantic Ocean. North Sea. Mediterranean Sea. Baltic Sea.
 Atlantic Ocean Baltic Sea North Sea Bay of Biscay NATIONAL INTEGRITY SYSTEM ASSESSMENT ROMANIA Black Sea Mediterranean Sea www.transparency.org.ro With financial support from the Prevention of and Fight
Flash Eurobarometer 430. Summary. European Union Citizenship
 European Union Citizenship Survey requested by the European Commission, Directorate-General for Justice and Consumers and co-ordinated by the Directorate-General for Communication This document does not
The global and regional policy context: Implications for Cyprus
 The global and regional policy context: Implications for Cyprus Dr Zsuzsanna Jakab WHO Regional Director for Europe Policy Dialogue on Health System and Public Health Reform in Cyprus: Health in the 21
IMMIGRATION IN THE EU
 IMMIGRATION IN THE EU Source: Eurostat 10/6/2015, unless otherwise indicated Data refers to non-eu nationals who have established their usual residence in the territory of an EU State for a period of at
Evolution of the European Union, the euro and the Eurozone Sovereign Debt Crisis
 Evolution of the European Union, the euro and the Eurozone Sovereign Debt Crisis Brexit? Dr. Julian Gaspar, Executive Director Center for International Business Studies & Clinical Professor of International
Objective Indicator 27: Farmers with other gainful activity
 3.5. Diversification and quality of life in rural areas 3.5.1. Roughly one out of three farmers is engaged in gainful activities other than farm work on the holding For most of these farmers, other gainful
Public consultation on a European Labour Authority and a European Social Security Number
 Public consultation on a European Labour Authority and a European Social Security Number 1. About you You are replying: As an individual In your professional capacity (including self-employed) or on behalf
Emerging Markets: Russia & the CIS Responding to Rising Demand
 Emerging Markets: Russia & the CIS Responding to Rising Demand Stuart Hensel Senior Analyst May 3rd 2007 Russia & the CIS: Interest Rising As seen by: FDI inflows & outflows Lending flows Growing CIS presence
EuCham Charts. October Youth unemployment rates in Europe. Rank Country Unemployment rate (%)
") EuCham Charts October 2015 Youth unemployment rates in Europe Rank Country Unemployment rate (%) 1 Netherlands 5.0 2 Norway 5.5 3 Denmark 5.8 3 Iceland 5.8 4 Luxembourg 6.3... 34 Moldova 30.9 Youth unemployment
EuCham Charts October 2015 Youth unemployment rates in Europe Rank Country Unemployment rate (%) 1 Netherlands 5.0 2 Norway 5.5 3 Denmark 5.8 3 Iceland 5.8 4 Luxembourg 6.3... 34 Moldova 30.9 Youth unemployment
Labour mobility within the EU - The impact of enlargement and the functioning. of the transitional arrangements
 Labour mobility within the EU - The impact of enlargement and the functioning of the transitional arrangements Tatiana Fic, Dawn Holland and Paweł Paluchowski National Institute of Economic and Social
Migration in employment, social and equal opportunities policies
 Health and Migration Advisory Group Luxembourg, February 25-26, 2008 Migration in employment, social and equal opportunities policies Constantinos Fotakis DG Employment. Social Affairs and Equal Opportunities
SEPTEMBER TRADE UPDATE ASIA TAKES THE LEAD
 Public Disclosure Authorized Public Disclosure Authorized Public Disclosure Authorized Public Disclosure Authorized SEPTEMBER TRADE WATCH SEPTEMBER TRADE UPDATE ASIA TAKES THE LEAD All regions show an
THE EU s EASTERN NEIGHBOURING COUNTRIES AND THE CRISIS
 THE EU s EASTERN NEIGHBOURING COUNTRIES AND THE CRISIS by Dr. Loukas STEMITSIOTIS Dr. Lúcio VINHAS DE SOUZA European Commission DG Economic and Financial Affairs 2300 2200 2100 2000 1900 1800 1700 1600
Options for Romanian and Bulgarian migrants in 2014
 Briefing Paper 4.27 www.migrationwatchuk.com Summary 1. The UK, Germany, France and the Netherlands are the four major countries opening their labour markets in January 2014. All four are likely to be
PUBLIC PERCEPTIONS OF SCIENCE, RESEARCH AND INNOVATION
 Special Eurobarometer 419 PUBLIC PERCEPTIONS OF SCIENCE, RESEARCH AND INNOVATION SUMMARY Fieldwork: June 2014 Publication: October 2014 This survey has been requested by the European Commission, Directorate-General
Trends in international higher education
 Trends in international higher education 1 Schedule Student decision-making Drivers of international higher education mobility Demographics Economics Domestic tertiary enrolments International postgraduate