Quantifying the Costs of Corruption Assessing Current Methods and Recommendations for the Future
|
|
|
- Christiana Georgia York
- 6 years ago
- Views:
Transcription
1 Quantifying the Costs of Corruption Assessing Current Methods and Recommendations for the Future Transparency International Fall 2012 New School Practicum in International Affairs Paula Astorga, Athina Doutis, Ian Loumos, Ardian Mollabeciri 1
2 Contents Table of Contents Executive Summary Introduction Macro-Economic Growth Public Procurement Military Spending/Defense Sector Natural Resource Management Pharmaceutical Industry Conclusions and Recommendations APPENDICES Appendix 1: Macroeconomic Data Appendix 2: Equation the Effect of Corruption on Growth Appendix 3: Correlating National Variables to Corruption Appendix 4: Illicit Financial Flows from Africa: Appendix 5:Construction Firms in BEEPS Reported Corruption & Corruption Frequency Appendix 6: Corruption in Procurement and Public Purchase Symmetric a& Asymmetric Cases Appendix 7: SIPRI - Share of World Military Spending for Top 10 Spenders, Appendix 8: SIPRI - National Military Expenditures as a Share of GDP, Appendix 9: IMF - Corruption and Military Spending - Countries Used Appendix 10:IMF - Corruption and Military Spending Cross-Sectional Analysis Model 6868 Appendix 11: IMF - Corruption and Military Spending Panel Regression Analysis Model Appendix 12: IMF - Corruption and Military Spending Panel Regression Analysis Model. 70 Appendix 13: IMF - Corruption and Military Spending Panel Regression Analysis Model. 71 Appendix 14: IMF - Corruption and Military Spending Panel Regression Analysis Model Appendix 15: IMF - Corruption and Military Spending Panel Regression Analysis Model
3 Appendix 16: IMF - Corruption and Military Spending Panel Regression Analysis Results Appendix 17: Military Spending, Corruption, and Economic Growth Description of Variables Measures and Resources Appendix 18: Military Spending, Corruption, and Economic Growth Mathematical Equations Employed to Measure and Correlate the Cost of Corruption Appendix 19: Military Spending, Corruption, and Economic Growth Correlations between Country Risk Guide Index and Cardinal Corruption Index Appendix 20: NATO, Economic Costs of Corruption in Russian Armed Forces Appendix 21: Extractive Industries Patterns and Stakeholders Appendix 22: Corruption Regressions & Improvements in Trade Appendix 23: Copper & Cobalt Trade in the DRC Prices & Contracts Appendix 24: Logging in Papua New Guinea Financial Obligations and Payments Appendix 25: Examples of Counterfeit Cases, Lawsuits Appendix 26: Spurious/Falsely Labeled/Falsified/Counterfeit (SFFC) Medicines Appendix 27: Potentially Relevant Databases Appendix 28: PSI Counterfeit Incident System Data BIBLIOGRAPHY
4 Executive Summary Corruption is a serious and pervasive problem in world. Yet it is not easy to define because cultural norms vary greatly. Even in the case of some accepted definition of corruption it is difficult to get information because the activities in question are hidden from view. Nonetheless it is imperative to pursue the question because it has negative consequences on social and economic activity. Reliable empirical information on the extent of corruption is essential for evidence-based advocacy and policy-making because it helps to identify the most salient corruption issues and the sectors, institutions, population groups and countries where it is most prevalent. There is an increasing demand for reliable quantitative information on the costs of corruption. A number of previous attempts have been made to provide estimates of these costs, ranging from theoretical macro-level data to empirical project-level estimates. However, we have found that there are problems with much of this information: sources and methods are seldom available, and often the same figures are cited without much explanation. It is clear that much more work needs to be done in this area, particularly in the construction of proper economic models of the costs and impact of corruption. The objective of this paper is to collect already available data on the economic costs of corruption and assess the methodologies used with specific attention on five sectors: general macro-economic growth, public procurement, national defense, natural resources and the pharmaceutical industry. Our goal is to help organizations such as Transparency International (TI) to develop more effective anti-corruption tools and to track progress in fighting corruption. 4
5 Introduction Transparency International (TI) is a Berlin based NGO that fights against worldwide corruption whose stated goal is to create change towards a world free of corruption by raising awareness and diminishes apathy and tolerance of corruption, and devises and implements practical actions to address it. 1 Although they are not the only NGO working towards this goal, they are the largest international anti-corruption organization with more than 100 independent national chapters. 2,3 Moreover, it has become the pioneer in this field by developing tools that make it possible to better analyze corruption and mechanisms for its eradication. 4 As the global civil society organization leading the fight against corruption, bringing people together in a powerful worldwide coalition to end the devastating impact of corruption on men, women and children around the world, TI defines corruption as the abuse of entrusted power for private gain. It hurts everyone whose life, livelihood or happiness depends on the integrity of people in a position of authority. 5 The need to measure corruption has grown exponentially since the 1990s. With the end of the Cold War, the balance of power changed as did the willingness to accommodate corruption as it came to be seen as a global problem and a major impediment to the growth and development of democratic societies worldwide. This has spurred global action against corruption as evidenced by the emergence of TI. Corruption is not a new phenomenon and although it lacks universally agreed upon definition, it is nonetheless present in all countries Due to the plurality of the term, the occurrence of corruption also carries with it a number of meanings depending on which part of the world it is occurring. These issues cut across multiple dimensions and include the social, political and cultural spheres, as well as the very character of the term corruption itself. This therefore makes it difficult to distinguish the occurrence of corruption, as what may constitute a corrupt act in India may be interpreted quite differently in the United States. Thus, the broad range of phenomena labeled as corruption renders any attempts to quantify its exact effects empirically very difficult. In practice, most working definitions of corruption tend to be too vague to be quantifiable. 6 Any measure of corruption must specify what is being measured, meaning that the purpose of corruption must be made clearer. Social aspects also present difficulties because social costs brought on by corruption are difficult to ascertain and objectively quantify. For example, no one is able to measure precisely what the loss of an 1 About Us. Transparency International. Accessed April 19, Gonzalez, About Us. Transparency International. Accessed April 19, González, About Us. Transparency international. Accessed April 19, Faiz-Ur-Rahim & Asad Zaman, Corruption: Measuring the Unmeasurable, Humanomics Vol. 25 No , p.118 5
6 energetic entrepreneur or an acclaimed scientist can cost a country. In addition, things such as the erosion of public confidence or a deterioration of a government s legitimacy are other examples of instances where corruption is extremely difficult to quantify, thereby lending credence to focusing mainly on economic aspects related to corruption. 7 The fact is that much of corruption, because of its very nature as both a criminal and consensual act, is concealed or hidden and thus hinders our ability to enumerate its costs. Yet more barriers exist due to the fact that empirical measurements do not adequately take into account the cultural dimensions of the problem. However, as our research will show, the fact that quantifying corruption is extremely difficult does not make it impossible. Contemporary studies in the field such as those covered in the Macroeconomic section almost always begin with what they know and seek to identify gaps in the information which is reported. What is also used more and more is a combination of different types of measures and indices, such as employing regression analysis and various other forms of econometric techniques. This begins by using perception or survey-based indicators in conjunction with other macro or micro-level economic indicators, which vary and are often-times tailored to each country s specific situation, depending on the information available. Our research strives to explore, uncover and analyze the various methods that have already been employed in attempts to empirically measure, and in some cases quantify, the economic costs of corruption. The aforementioned limitations present us with the challenge of grasping the extent to which the existence of relevant data showing the economic costs of corruption has been identified and established. We know corruption is present; the challenge lies in the ability to find an approach or model that helps to accurately measure, quantify and correlate the costs produced by corruption to various economic indicators. This paper aims to tackle these concerns, with a particular focus on the economic costs of corruption. This will be done by first providing a background of the issue, then by presenting an overview of existing approaches to quantifying the financial costs of corruption, providing an assessment of their respective strengths and weaknesses as well as identifying major challenges and barriers to finding a solution to quantifying the costs of corruption. This will be done by examining in detail five specific sectors: general macro-economic growth, public procurement, national defense, natural resources and the pharmaceutical industry. The five specific sectors follow a general methodology within the report of focusing on the areas where corruptions affects are most widespread and by then moving on to areas deemed to be narrower in scope. Finally, this paper will also present a series of recommendations and best practices found in conclusions drawn from our study of these aforementioned areas in an attempt to provide a framework from which to begin to tackle the problem of enumerating the financial costs of corruption. 7 Our Organization - Overview. Transparency International. Accessed April 28 th,
7 Our set of key findings and recommendations, which will be discussed in greater detail later on, have concluded that no economic model which relies on official data to estimate illicit flows can adequately capture the more nuanced or narrower effects of corruption, such as the effects of smuggling, trade in narcotics and other contraband, human trafficking, and intellectual property. Also, any measures of corruption must take into account the fact that a large part of the effects of corruption are transmitted through other variables, thus reflecting its indirect effects. The collection of quantitative data also typically requires much more effort than a perception survey of service users, making them both more costly and time consuming. In addition, the evidence suggests that general country-level corruption indicators may be poor tools to uncover particularly corrupt construction industries and may differ depending on sub-sector or location, highlighting the need for a range of targeted and flexible responses at the country and sector level. Finally, the elusiveness of measuring the economic costs of corruption has placed a series of limitations in the way of significantly quantifying the costs of corruption, the take-away from many of the studies examined being that the data is largely not available due to the inability to measure such a broad range of indicators. Thus, based on these main findings we have also developed a number of recommendations which take into account the research conducted in this report. Firstly, given its secretive nature an effective way to investigate corruption would be collaboration with state authorities. Transparency International should also look into developing a model which attempts to accurately estimate the size of the black market, giving TI the ability to expose or shed light on countries which are more engaged with illegal or grey market activities. Also, the frequent invocation of TI s indexes reflects the widespread influence that TI has to establish precedents from which corruption may be addressed. As a result, one recommendation is for TI to establish new guidelines and standards of what constitutes as corruption, while another useful step would be to use the legal profession as an access point for estimates of the costs produced by various corruption lawsuits. Furthermore, a team of economists might be assembled in order to explore various avenues aimed at providing new estimates of the cost of corruption. Finally, a database should be compiled which would consist of all available data from governments and private institutions and would also be able to be continuously updated. 7
8 Macro-Economic Growth The field of macroeconomics covers a wide spectrum in which corruption could be seen as having detrimental effects and thus makes enumerating its costs at the same time both enticing and challenging. The majority of studies which aim to measure the economic costs of corruption have focused on the use of regression analysis, most of which seek to identify and examine the channels through which corruption operates, thereby either positively or negatively affecting economic growth. This section will present four main approaches to measuring corruption at the macroeconomic level. Furthermore, the common theme which these four approaches share is the use of a corruption index or a set of indices which they then regress against macro-economic indicators such as GDP, GDP per-capita, etc. In Corruption and Growth, Paulo Mauro Argues that inefficient and/or corrupt government institutions act to disrupt and even reverse economic growth. 8 The stated aim of his paper is to also identify the channels through which corruption and other institutional factors affect economic growth and to quantify the magnitude of these effects. Mauro s strategy was to build a corruption index out of the following components: 1) The author makes use of Ethno-linguistic fractionalization in order to show high levels of correlation with corruption and other institutional variables. 9 Ethnolinguistic fractionalization measures the probability that two persons drawn at random from a country s population will belong to the same ethno-linguistic group. 2) Mauro also considers Business Internationals indices on corruption, red tape or bureaucratic inefficiencies, as well as the effectiveness of the judicial system between the years These indices are based on standard questionnaires filled in by BI s correspondents stationed in 70+ countries and reflect their analyst s perspectives on risk/efficiency factors. This analysis is restricted to use of 9 indicators of institutional efficiency which are assessed independently of macro-economic variables, are positively and significantly correlated and apply to all companies within a country. 11 These indices are then aggregated into a single index labeled the bureaucratic efficiency index which is then part of the regression model used for the BEI versus Per-Capita Income, Investment, and Per-Capita Growth Rates. 12 Also, in order to account for endogeneity, an index of ethno-linguistic fractionalization is used. Simply put, ethno-linguistic fractionalization measures probability that two 8 Paulo Mauro. Corruption and Growth. The Quarterly Journal of Economics (August 1995): Ibid 10 Ibid, Ibid, Ibid, 690 8
9 persons drawn at random from a country s population will not belong to the same ethno-linguistic group. 13 In his final analysis which can be found in Appendix 1, Mauro finds that corruption, or what he defines as malfunctioning government institutions, serves to lower private investment, thus reducing economic growth, even in highly regulated bureaucracies, and also finds that economic performance is strongly correlated to institutional efficiency while there is a significant negative association between corruption and investment. 14 A one-standard deviation increase in corruption index was seen to be associated with a 2.9% increase in investment rate while a onestandard deviation increase in BEI was associated with an increase in investment rate equal to 4.75% of GDP. A negative association between corruption and GDP growth was highlighted by one-standard deviation increase in corruption index equal to a 0.8% increase in GDP growth as well as a one-standard deviation increase in BEI equal to a 1.3% increase in GDP growth. 15 There is also a negative correlation between institutional efficiency and ethno-linguistic fractionalization. 16 Finally, the positive correlation of country risk indicators means that they tend to move together in the same direction. Similar work by Pellegrini and Gerlagh suggests that levels of corruption are better explained by the quality of economic institutions rather than by income level. 17 By seeking to measure or gauge the value of such institutions, their work seeks to empirically analyze the contribution of various direct and indirect channels through which corruption affects economic growth as well as explore the transmission channels through which corruption can affect growth as captured by the other variables: investment, schooling, openness and political instability. 18 Their findings suggest that corruption slows down economic growth, mainly through its effect on investments and trade policies. Their methodological approach estimates basic growth regressions in order to quantify the effect of corruption on economic growth, both in with and without other independent variables which include corruption, investment and trade openness. The authors controlled for endogeneity of the corruption variable by use of legal origins as an instrument variable for corruption and following on the work of Mauro also made use continental dummies and ethnolinguistic fractionalization as instrumental variables. However, use of the Hausman test rejected these as valid instruments for corruption in most of the regressions conducted. The Hausman test, which is covered in more detail in table 2.1 of the Appendix, is a statistical hypothesis test used to evaluate the significance of an estimator variable relative to an alternative, helping to evaluate 13 Ibid, Ibid, Ibid, Ibid, Lorenzo Pellegrini & Reyer Gerlagh, Corruption s Effect on Growth and Its Transmission Channels, Kyklos Vol.57 (2004): Ibid, 422 9
10 if a statistical model does indeed correspond to the data it is based upon. 19 Pellegrini and Gerlagh also used the Hausman test in order to check the veracity of their results in the regression analyses of other independent variables such as the democracy index and regional dummies. 20 Their research concludes that corruption among civil servants often both reflects and reinforces burdensome bureaucratic procedures for which the help of state employees is necessary, who themselves are in a position to expect payments for fulfilling their duties. Their analysis also found that a decrease in the corruption level of one standard deviation increases economic growth by approximately 1 per cent per year, and increases the long-term income level by about 140 %. 21 They also estimate that an increase in investments of 7.5%, equal to one-standard deviation, increases growth rates by 1.05 per cent, and increases the longterm income level by 70 %, while a change of one standard deviation in the corruption variable increases growth by a relatively small 0.20 %. A one-standard deviation decrease in corruption levels was estimated to increase investments by 2.46 %, which in turn increases economic growth by 0.34 per cent per year. 22 Studying the effect of the investment transmission channel found that it substantially exceeds the direct corruption effect of 0.20 per cent growth per year. With regards to education, a one-standard deviation decrease in corruption is associated with an increase of half a year of schooling of the people above 25 years. This in turn results in an increase of growth of 0.06 per cent per year. Thus the schooling transmission channel, being highly influenced by the income variable, was found to be the one with the smallest effect in the author s estimations. 23 A one-standard deviation decrease in corruption was estimated to be associated with an increase in the openness of a country of 0.19, in turn associated with an increase in growth of 0.30 per cent per year, while corruption had a positive and significant effect on political instability. A one-standard deviation decrease in corruption is associated with a decrease in the political instability index of 0.06, which in turn increases growth by 0.14 % per yearly transmission channels to account for more than 80% of the total effect of corruption on growth. 24 As the equation of Appendix 2 shows, while examining the direct and indirect effects of corruption on growth, the authors found that the relative contribution of the direct impact of corruption to be 19%, the relative contribution of the investment channel to the total effect is 32%, the relative contribution of the schooling channel to the total effect is 5%, the relative contribution of the openness channel to the total effect is 28%, and the relative contribution of the political instability channel to the total effect is 16%. Thus, the main effect of corruption on 19 J.A. Hausman, Specification Tests in Econometrics, Econometrica Vol.46 No.6. (November 1978) 20 Pellegrini & Gerlagh, Ibid, Ibid, Ibid, Ibid,
11 economic growth is found to be transmitted through investments. 25 Finally, studying the longterm effects of corruption on growth finds that a one-standard deviation decrease in corruption levels increases the long-term level of investment by 4.86 per cent points, consistent with Mauro s finding. It further increases schooling by 2.21 years while increasing the openness coefficient by 0.30 and increases the political instability index by 0.06, thus revealing the longterm effect of corruption on those variables that are seen as drivers of economic growth. 26 Foster, Horowitz and Mendez take a slightly different approach in their application of economic measurements of corruption. Their approach adapts the axiomatic measure theory originally developed to analyze the effects of poverty and inequality in order to organize corruption data and generate specific aggregate corruption measures. 27 The objective is both to use axiomatic methodology to make the application of existing data more efficient and to provide guidance for subsequent design of surveys and other data collection instruments. This approach was developed in response to what they view as the limitations of perception indexes as well as alternative data collection mechanisms that record information about actual corrupt acts, similar to those carried out by Reinikka and Svensson (discussed below). The axiomatic approach entails formal definition of potentially important properties of a measure, i.e. the axioms and is then followed by an aggregation of measures according to such properties. 28 The study provides an empirical application of the methodology and estimates several aggregate corruption measures for a sample of over 25 countries during the year 2000 and focuses on using the transaction itself as the object of analysis, rather than the bribe taker or payer. 29 The study concentrated on recording the transactions between clients and government departments throughout a specific period of time, usually a year, where the size and purpose of these transactions vary with the type of service provided, examples of which may include the legal payment of a passport application fee, the bribe given in exchange for a driver s license or the illegal appropriation of public funds allocated to a specific department. 30 The focus on transactions is because it is easier to monitor at the departmental level than at the individual level, with another possibility being that by treating each official as a single department, the methodology could be easily applied to individual level data, were it available. It also makes use of data from the Business Environment and Enterprise Performance Survey (BEEPS), developed jointly by the World Bank and the European Bank for Reconstruction and Development which allowed it to reconstruct important elements of the D matrices including information on 25 Ibid, Ibid, James Foster, Andrew Horowitz & Fabio Mendez, An Axiomatic Approach to the Study of Corruption: Theory and Applications. University of Arkansas (January 2009): 1 3%2F01%2Fwber.lhs008.full.pdf 28 Ibid 29 Ibid, Ibid,
12 frequency and the monetary value of corrupt acts in order to estimate the total number of dollars spent at each department on corrupt acts. 31 The axiomatic approach, like many others, also utilizes the Corruption Perception Index (CPI) from Transparency International for the year for comparison purposes. 32 The author s final analysis, which can be found in greater detail in Appendix 3, finds that there is indeed a positive correlation between the amount of perceived corruption and the time wasted by management officials in dealing with government officials. Their results also confirm a negative correlation between investment and corruption perception. 33 Finally, a paper by Global Financial Integrity conducts an analysis of the volume and pattern of illicit financial flows from African countries over a 39-year period from 1970 to The paper finds that illicit flows have not only grown on a decennial basis, cumulatively they have come to far exceed the continent s outstanding external debt as of the end of Their methodological approach uses the World Bank Residual (CED) model and the Trade Misinvoicing model (Gross Excluding Reversals or GER method using bilateral IMF Direction of Trade Statistics) to estimate the volume of illicit flows from African countries. 34 The World Bank Residual model compares a country s source of funds with its recorded use of funds. Sources of funds, i.e. the countries inflows of capital, include increases in net external indebtedness of the public sector and the net inflow of foreign direct investment. The net external indebtedness is derived by calculating the change in the stock of external debt which was obtained from the World Bank s Global Development Finance database while the use of funds includes financing the current account deficit and additions to central bank reserves. Both these data series along with data on foreign direct investment were obtained from the IMF Balance of Payments database. According to this model, whenever a country s source of funds exceeds its recorded use of funds, the residual comprises unaccounted-for, and hence illicit, capital outflows. 35 Trade mis-invoicing has long been recognized as a major conduit for illicit financial flows. By overpricing imports and under-pricing exports on customs documents, residents can illegally transfer money abroad. To estimate this, the authors compared African countries global exports to what is reported, after adjusting for insurance and freight. Additionally, country imports from the world are compared to what the world reports as having exported to that country. Discrepancies in partner-country trade data, after adjusting for insurance and freight, indicate mis-invoicing. However, this method only captures illicit transfer of fund abroad 31 Ibid, Ibid, Ibid, Dev Carr & Devon Cartwright-Smith, Illicit Financial Flows from Africa: Hidden Resource for Development, Global Financial Integrity (March 2010): 5 reports%2fgfi_africareport_web.pdf 35 Ibid, 7 12
13 through customs re-invoicing; IMF Direction of Trade Statistics cannot capture mispricing that is conducted on the same customs invoice. 36 The authors also state that the World Bank Residual and Trade Mis-invoicing models understate actual outflows of illicit capital due to missing data, particularly for the earlier years. 37 The authors also add the World Bank Residual model estimates to this subtotal to derive total illicit flows for all African countries that have reported data to the IMF and the World Bank, estimated at $1.4 trillion, which is then adjusted for the number of African countries that do not report either balance of payments or external debt data. They assume that illicit flows from the countries with missing data bear the same ratio to GDP as they do for countries that report the data, while in order to analyze the long-term trend in illicit flows from the continent, they deflate the nominal series by the World consumer price index in Their final analysis, presented by the tables in Appendix 4, shows that over the 39-year period Africa lost $854 billion in cumulative capital flight which by their estimates is enough to erase the region s total external debt outstanding of around $250 billion as of December 2008 and also potentially leave $600 billion for poverty alleviation and economic growth. Cumulative illicit flows from the continent were also found to have increased from about $57 billion in the 1970s to $437 billion between 2000 and An adjustment by the authors to these figures in order to account for data limitations saw original estimates raised to upwards of $1.8 trillion. These real illicit flows from Africa grew at an average rate of 12.1 % annually over the same 39- year period, while illicit flows from Africa increased from around 2 % of GDP in 1970, peaked at around 11 % in 1987, fell sharply to below 4 percent for much of the 1990s, rose again to 8 % of GDP in 2007 before declining to around 7 % in The study also found that there are two main channels through which illicit capital, unrecorded in official statistics, can leave a country. The World Bank Residual model captures the first channel through which illicit capital leaves a country as through its external accounts. The second type of illicit flows, generated through the mispricing of trade transactions, is captured by the Trade Mis-invoicing model which uses IMF Direction of Trade Statistics. 40 In summary, the literature on the macro-economic effects of corruption mirrors that of the area itself, in that it the research tends to cover a wide range of data sources and focuses on different outcomes. The same is also true of the methodologies used in attempting to empirically quantify corruption s effects and this as a result leads to varying conclusions. However, one common theme among the approaches surveyed remains the use regression analysis linking one or more surveys to different sets of economic indicators. 36 Ibid, Ibid 38 Ibid, Ibid, Ibid,
14 Public Procurement Public procurement is the process by which government departments or agencies purchase goods and services from the private sector and which takes place at both the national and regional level. In accounting for 10 to 15% of GDP in developed countries as well as up to 20% in developing countries, public procurement accounts for a substantial part of the global economy, thereby rendering it especially susceptible to acts of corruption. 41 And being that the public procurement process is utilized as an important tool for increasing socio-economic welfare, being able to accurately identify and measure corruption within the sector as a whole is critical. Studies aimed at the empirical analysis and measurement of the economic costs of corruption within the procurement and investment sectors have largely been focused in a few directions; one strategy of measurement has emphasized the use of regression analysis in linking one or more indices currently in use by major organization in the field of corruption together with economic indicators of their choosing; this avenue mirrors the methodological studies examined in the previous section. The other strategy has attempted to make use of more microlevel approaches, the most promising of which sought to combine a quantitative variant used to analyze public expenditure with a qualitative element which utilized a survey-based approach. Still others have foregone the use of hard empirical evidence and have instead sought to rely on the use of survey-based perception indices of corruption such as those used by Transparency International and others. In utilizing the first of these approaches, Tanzi and Davoodi have contended that corruption increases the number of capital projects undertaken while tending to enlarge their size and complexity. 42 The result has been that some public investment can ironically end up reducing a country s growth because, even though the share of public investment in gross domestic may have risen, the average productivity of that investment has dropped. Furthermore, they argue that widespread corruption in the investment budget will not only reduce the rate of return to new investment in a country, but will also affect the rate of return the country gets from its existing infrastructure. A principal source of their assessments of the degree of corruption in various countries is Business International and Political Risk Services, Inc., which publishes an annual index, International Country Risk Guide, covering the period for 42 to 128 countries, depending on the year. Data on specific aspects of government spending and revenue collection 41 Harvard University, Government Procurement Summary. Accessed: November 25 th, Hamid Davoodi & Vito Tanzi, Roads to Nowhere: How Corruption in Public Investment Hurts Growth. International Monetary Fund (March 1998):
15 was collected from the IMF s Government Financial Statistics. 43 The authors examination of the data from these two sources led to the formulation of several clear hypotheses concerning the relationship between corruption and four variables: public investment, government revenue, operation and maintenance expenditures, and the quality of infrastructure. Government revenue data, taken from the GFS, are expressed as fractions of GDP, while data on GDP and real per capita GDP come from the World Bank s World Development Indicators data base. 44 The authors test the hypotheses against statistical evidence, analyzing cross-country data through the use of regression analysis to estimate the strength of the relationship between corruption and those four variables. In guarding against false regression results, and depending on the regression, the researchers controlled for other variables, such as real per capita GDP, the ratio of government revenue to GDP, and the ratio of public investment to GDP. 45 To test the hypothesis that high corruption is associated with high public investment, they regress the public investment-gdp ratio on a constant and the corruption index and subsequently add real per capita GDP and government revenue-gdp ratio to see if the corruption-investment relationship is robust to the inclusion of these two variables. 46 They then add real per capita GDP as it is typically a proxy for the stage of economic development and different levels of development may require different needs for public investment. Government revenue-gdp ratio is added because the higher are these revenues the easier it is to finance public investment. To test the hypothesis that high corruption is associated with low government revenue, they regress government revenue-gdp ratio on a constant and corruption and then add real per capita GDP to control for stage-of-economic development effects. 47 In testing the hypothesis that high corruption is associated with low-quality infrastructure, they regress indicators of quality of infrastructure on a constant, the corruption index and real per capita GDP. 48 Their findings conclude that high corruption is associated with high public investment as well as suggesting that corruption reduces private capital investment by more than it increases public capital investment, government revenue, and the productivity of capital spending. These in turn lower the growth rate of the country, while also distorting decisions about the investment budget. 49 Charles Kenny argues that the impact of corruption goes beyond bribe payments but can be seen in poor quality construction of transport infrastructure with low-economic returns 43 Ibid, 5 44 Hamid Davoodi & Vito Tanzi, Corruption, Public Investment, and Growth. IMF Fiscal Affairs Department (October 1997): pdf 45 Ibid, 7 46 Davoodi & Tanzi, Corruption, Public Investment, and Growth Ibid, Ibid 49 Davoodi & Tanzi, Roads to Nowhere: How Corruption in Public Investment Hurts Growth.,
16 alongside low funding for maintenance. His work centers on examining corruption in the transport construction industry within developing countries by focusing on the use of a number of perceptions indicators such as Transparency International s Corruption Perceptions Index as well as the Business Environment and Enterprise Survey (BEEPS), whose statistics are located in tables 5.1 and 5.2 of the Appendix. 50 Kenny s analysis finds that in 1999, the median firm in BEEPS reported spending 1 to 2% of its revenues of unofficial payments to public officials while at the aggregate level across the region, the average firm suggested that it spent 28% of this sum to deal with licenses, health and fire inspections and 15% on securing government contracts. 51 He also finds that there is little significant correlation between cross-industry general estimates of corruption and estimates of corruption given by the subset of construction industries at the national level. 52 Kenny s work suggests that general country-level corruption indicators may be poor tools to uncover particularly corrupt construction industries, but also that corruption within the industry may differ markedly by sub-sector or by location within a country. This lays bare the danger in assuming that a single intervention or model will have a similar or significant impact on corruption in construction within a country, much less across different countries, and highlights the need for a range of targeted and flexible responses at the country and sector level. Emmanuelle Auriol s work studies capture and extortion in public procurement, showing that capture yields what he terms a dead-weight loss while extortion does not. The paper sets up a three-tier hierarchy which consists of a principal, delegate, and a firm, with all the players assumed to be risk neutral. 53 It then presents a set of models and proofs, located in tables 6.1 and 6.2 of the Appendix, which allow for cases of perfect as well as imperfect information, allowing for a final calibration of corruption cost. Based on the calibration of the model, the total cost of capture is between 1.2 and 2.88 times the amount of the bribes, while the loss from capture represents between 4.14 % and 9.93% of the world procurement spending. 54 Reinikka and Svensson present an altogether different vision for quantifying corruption in public procurement. In their World Bank Research Group paper entitled Assessing Front-line Service Delivery the authors argue that it is not enough to analyze cross-country macroeconomic and budget allocations data, but rather that micro-level tools are needed to reveal and assess provider behavior as well as the translation of public spending into services, in terms of both the 50 Charles Kenny, Transport Construction, Corruption, and Developing Countries. Transport Reviews Vol.29 No.1 (January 2009): Ibid, Ibid, Emmanuelle Auriol, Corruption in Procurement and Public Purchase. International Journal of Industrial Organization Vol.24 (September 2006): 1 54 Ibid, 24 16
17 quantity and quality of services, that reflect the public funds spent on them. 55 The paper presents what was then a new survey tool and its first applications in Uganda, Tanzania and Ghana in order to document frontline service delivery from public, private not-for-profit, and private forprofit providers. This tool has two variants: a diagnostic public expenditure tracking survey (PETS), and a more comprehensive facility-based quantitative service delivery survey (QSDS). The PETS was designed to provide the missing information from different tiers of government and frontline service facilities. In the QSDS, the facility or frontline service provider is typically the main unit of analysis much in the same way that the firm is the unit of observation in enterprise surveys and the household in the household surveys. Together, these serve as diagnostic tools on service delivery and also provide primary data on service providers for empirical research. 56 The microeconomic survey approach they present focuses on provider behavior in general, including issues of incentives, oversight, accountability and multiple-principal multipleagent dynamics in the public sector. 57 Quantitative data was collected both through interviews and directly from the service provider s records. This data can then also be triangulated by surveying local governments, umbrella NGOs, and private provider associations. Also, given their public expenditure focus the following data was found to be of particular interest to the authors: the quantity and quality of service outputs, inputs, resource allocations within facilities and lower tiers of government and financing. To avoid any perceptions of bias in the data collection process, the authors decided that the survey should be implemented by a body that most firms had confidence in. The questions on corruption were also phrased in an indirect fashion to avoid implicating the respondent of wrongdoing while the corruption related questions were asked at the end of the interview, by which time the interviewer had established necessary credibility and trust. And although such euphemisms may rightly be perceived as being too malleable, this is merely indicative of the entire corruption research literature in general. Finally, to enhance the reliability of the corruption data, multiple questions on corruption were asked in different sections of the questionnaire. 58 These multiple questions were then incorporated into a standardized firm survey instrument. In Uganda, on average, only 13 percent of the annual capital (per student) granted by the central government reached the school in Eighty-seven percent either disappeared for private gain or was used by district officials for purposes unrelated to education. Most schools, 55 Ritva Reinikka & Jakob Svensson, Assessing Frontline Service Delivery. World Bank Development Research Group (January 2002): Ibid, 5 57 Ibid, 6 58 Ibid,
18 roughly 70 percent, received very little or nothing. 59 When the survey tools were applied in Tanzania, leakage of public funds was estimated at 57 percent in education and 41 percent in health care. 60 In Ghana, PETS covered 4 districts in each of the 10 regions and found that only about 20 percent of the non-wage public health expenditure and 50 percent of non-wage education expenditure reached the frontline facilities. 61 The findings of the study show that the PETS and the QSDS can be used to diagnose and quantify problems of inefficiency, low quality of services, leakage of resources, and capture manifestations of moral hazard in public service, such as shirking and ghost workers, asymmetric information, ineffective management and supervision systems, as well as distributional issues. The PETS can be conducted in conjunction with the QSDS and their combination allows a direct evaluation of the effect of wider institutional and resource-flow problems on frontline service delivery. The authors maintain that facility level analysis can also be linked both upstream to the public administration and political processes, including public official surveys, and downstream to households to combine the supply and demand side of service delivery. However, since records at the district level were found to be patchy, a detailed comparison between budgets and actual spending could only be made about non-wage spending between the center and the school. 62 Another problem is the fact that when assessing this data it should be noted that despite the data collection strategy, there are likely to be cases of misreporting in the sample, the usefulness of which is limited by the lack of a rigorous conceptual framework even when it is available since it is not clear how to identify a corrupt act or how to generate an aggregate corruption measure. Also, the compilation of facility level quantitative data typically requires much more effort than, say, a perception survey of service users, which makes the QSDS both more costly and time consuming to implement than its qualitative alternatives. However, an important contribution of the PETS and the QSDS is the establishment of what the author s term stylized facts, otherwise known as general research themes or trends, about service provision. Such stylized facts can then be used as benchmarks for cross-country studies, as well as baselines for monitoring the effectiveness of policy changes within individual countries. Finally, the PETS/QSDS can help to confront current problems of sector-wide lack of empirical information by helping to build capacity and public awareness through the publication of fund-leakage. 63 As a side note, while survey approaches likes the PETS and QSDS are not directly identical to the procurement sector as a whole, this research was chosen in order to give 59 Ibid, Ibid, Ibid, Ibid, Ibid 18
19 an idea of other types of methods which could possibly be applied towards use in measuring corruption in procurement. In summary, the survey of the research conducted within the procurement sector has been shown to have certain key differences when compared to other sectors such as military spending or macroeconomics. Firstly, the procurement sector is sufficiently narrow enough in scope that it is possible to combine the use of both qualitative and quantitative assessments as has been shown. Also, the greater methodological bent toward micro-economic approaches means that the research into the costs of corruption within the procurement sector allows for a deeper and more nuanced view, as evidenced by the use of techniques such as household surveys. Together, these two trends give an example of the different methods which can be used when the focus of the research is narrower in scope. 19
20 Military Spending/Defense Sector National Military/Defense expenditures is an arena in which corruption has seemingly become a tacit rule of thumb. The dramatic volume of money that is allocated and funneled into the military sector attracts a myriad of wide-ranging players into the defense arena from contractors, to weapons traders, IT systems and more. All of which compete for a share of the profits that are to be had in this lucrative sector. Yet assessment of the real impact or costs of corrupt practices has not been widely unexplored due almost entirely to the lack of empirical data available for analysis. The incapacity to directly measure costs of corruption has lead to indirect perception measures rather than hard evidence. This section has drawn supportive evidence from a large pool of sources, ranging from International Organizations such as the World Bank and the International Monetary Fund, to intergovernmental military alliances such as NATO. University/Government funded research institutes such as the Stockholm International Peace Research Institute (SPIRI), and investigatory journalism publications have also been incorporated into the source pool. The approaches utilized by these sources are either macroeconomic or microeconomic. In terms of modeling analysis the majority of primary investigatory work make use of regression analysis to showcase, quantify and correlate their findings, though others use more qualitative approaches such as questionnaires to inform their results. The macroeconomic indicators focus more on quantifiably based data such as GDP, military expenditure and trends in military growth/cutbacks which have implications for recommendations on a more national scale. The more micro-based questionnaire reports provide nuanced assessments of the costs of corruption on the local scale. Within the sector of military and defense spending, many authors argue that measuring the costs of corruption is in effect measuring a black market. One such example of this methodological quagmire is seen in SPIRI s (2011) attempt to measure the costs of corruption in the arms trade. When discussing the nature of the global arms trade arena, the authors claim; While black market deals are illegal in conception and execution, grey market deals are undertaken by governments covertly as they entail both legal and illegal actions to achieve foreign policy ends. 64 Many of the reports reviewed put forth similar disclaimers, in part so that the tendency of the research to yield inconclusive data results/findings might be justified by the elusive nature of measuring the costs of corruption. It has also been brought to the fore that there is a severe lack of transparency within the military sector in relation to both observing fair trade under the auspices of western democratic values and granting the general public free access to this information. There have been a series of comprehensive justifications for this lack of open access to information surrounding military/defense expenditures, most of which fall under the aegis of national security and 64 Andrew Fienstein, Paul Holden & Barnaby Pace. Corruption and the arms trade: sins of commission SPIRI Yearbook 2011: Armaments, Disarmament and International Security. Oxford University Press, (2011): P
21 therefore requires full discretion. Bearing all of this in mind, one may begin to see the real challenge that lies ahead in holding the capacity and resources necessary to expose various economic costs of corruption in bridging the gap between transparent and corrupt practice in military expenditures. In this capacity it has lead this report in many cases to conclude that the take-away from measuring the economic costs of corruption may not be a comprehensive data set, which acutely measures cases of corruption s impact, but rather the fact that most data sets and methodological frameworks employed to measure the costs of corruption are vastly inconclusive. According to the Stockholm International Peace Research Institute (SPIRI) world military spending in 2011 is estimated to have been $1,738 billion 65. The leading military spenders (Appendix 7 and 8) include the U.S., U.K., France, Brazil, Russia and China 66. The latter two have had notable increases in military spending over the years , as Russia has been cited for increasing its military spending by 9.3 percent in Statistics from the World Bank allow us to further break down these larger general figures of global military expenditure on the national scale. The World Bank s military expenditure (% of GDP) 68 database provides a list of each country s annual military expenditure as a percentage of their GDP. Statistics for China, for instance, indicate that in 2011 China spent 2 percent of its GDP on military expenditures, The Russian Federation spending 3.9 percent of its GDP and the US spending 4.7 percent of its annual GDP on military 69. The task now becomes a matter of deciphering these figures and percentages and translating them into tangible economic costs of corruption. An IMF working paper Corruption and Military Spending by Sanjeev Gupta et al. attempts to draw a correlation between corruption and military expenditure as a percentage of GDP 70. The study does this through directly correlating Transparency International s Corruption Perception Index (CPI) with military spending as a share of GDP 71 and as a share of general government expenditures 72. The analysis is based on existing data gathered from over 120 countries (Appendix 9) on both military expenditures and CPI scores and then running the data through a panel regression model 73 and a cross sectional analysis 74 (Appendices 10-15). The 65 Stockholm International Peace Research Institute. SPIRI Military Expenditure Data, Last Modified April 17, years-of-increases-says-sipri. 66 Ibid. 67 Ibid. 68 The World Bank. Military Spending (% of GDP). Accessed October 22, Ibid. 70 Sanjeev Gupta, Luiz de Mello & Raju Sharan, Corruption and Military Spending, International Monetary Fund Working Paper 23, (2000): Ibid. P Ibid. P Ibid. P Ibid. P
22 index s findings (Appendix 16) suggest, more corrupt countries tend to have a higher military spending as a share of GDP and total government expenditures. 75 The IMF working paper, although comprehensive in methodological design is severely limited by its access to empirically tested data on corruption. Furthermore the study inserts a disclaimer stating, The evidence reported in this paper is suggestive but by no means conclusive that countries perceived as being as being more corrupt tend to spend more on the military 76. Lastly the paper provides a couple of key policy recommendations based on its findings, namely that policies aimed at reducing corruption will tend to improve the composition of government spending toward more productive, nonmilitary outlays 77. The IMF working paper thus suggests that the economic costs of corruption in regards to military spending can be seen as the amount of corrupt funding that is taken from a national budget and is allocated towards military expenditures effectively taking away from other sectors such as education and health. In a study commissioned by SPIRI and carried out by Feinstein et al. (2011) 78 the impacts of corruption from the arms trade are explored. The report asserts that the cost of corruption takes a heavy toll on buyer and seller countries, undermining democratic practice, the rule of law and global security 79. The report utilizes both macroeconomic and microeconomic (South African state-centered) data sets to quantify the costs of corruption. It grounds its claims in the case of the notorious arms deal known better as South Africa s Strategic Defense Procurement 80 commissioned by the South African Government which spent an estimated amount of 70 billion rand ($11 billion) on the acquisition of military related goods/services 81. The arms deal was the largest in South African history and came shortly after the declaration from the post apartheid government to promise to reduce military spending in favor of socio-economic development 82. The arms deal was heavily fraught with corrupt practices such as fraud and government overspending 83 ; these de facto decimated funds could have been allocated to other government spending sectors or initiatives. The report frames this lack of adequate and transparent fund allocation to other sectors as a cost of corruption. Therefore the findings are not directly correlative per se as in corrupt practice A can be directly correlated to corrupt cost B but is suggestive in the ways in which the cost of the military expenditure could have been alternatively used, i.e. funding and affording of HIV preventative medication which would go towards assisting the over 5 million known cases of HIV/AIDS. Therefore the economic cost is instrumentally framed through essentially commoditizing human 75 Ibid. P Ibid. P Ibid. P Fienstein et al P Ibid. P Ibid. P Ibid. P Ibid. P Ibid. P
23 life to exemplify what the cost of corruption reflects in terms of access to life saving preventative medication and programs. The study goes on to further illustrate numerically the discrepancies between military expenditures/budgets and nationally subsidized HIV/AIDS programs, citing that by 2008 South Africa had spent a paltry 8.7 billion rand ($1.4 billion) on its HIV/AIDS Program, meaning that for every 1 rand spent to combat the disease in South Africa, an equivalent 7.63 rand was spent on the arms deal 84. In brief the study sets a great precedent in illustrating the opportunity cost of a corrupt practice, through correlating economic statistics of the corrupt practice onto a corrupt cost. The strategy to use human life as an economic cost of corruption is very effective and many other studies could take note from this framework in driving home the severity corrupt practices hold for a society. Peironi and d Agostino (2008) strive to test if corruption opportunities are associated with a larger size of expenditure of the military sector and if this dangerous externality has a significant impact on economic growth 85. The methodology of their research makes use of the already established Multiple Indicators Multiple Causes (MIMIC) model, which provides their research with the ability to rank each country according to a cardinal index of corruption expressed as a percentage of GDP per capita 86. The corruption index was invoked to show an interaction with each country s military burden 87 so that the authors could estimate gross and indirect elasticities of the military [expenditure] and corruption with respect to economic growth 88. The authors define their research variables and sources in a table (Appendix 17) to tie together the various methodological models incorporated into their research. The research also represented the interaction of their 3 core variables in a set of 3 different mathematical formulas 89 (Appendix 18). The research employs a regression analysis as a framework for the empirical evidence to be analyzed. The dominant equation built into the regression analysis assumes that military spending and corruption are complementary factors and their impact on growth is a non-linear function. 90 The main findings yielded by the correlation analysis (Appendix 19) suggest, The share of military spending to GDP and corruption deteriorate per capita growth rate 91. Moreover the results also indicate the negative impact of corruption on growth is consistently influenced by the indirect impact of military burden on corruption 92. Therefore the results assert that there is a direct economic cost of corruption and utilizes their findings to make a couple of key policy recommendations. Once again as was noted in Gupta et al. s (2000) end remarks, the results are more suggestive than conclusive. 84 Ibid. P Luca Pieroni and Giorgi d Agostino. Military Spending, Corruption and Economic Growth. Peace Economics, Peace Science and Public Policy. Volume 14, Issue 3 (2008): P Ibid. P Ibid. P Ibid. P Ibid. P Ibid. P Ibid. P Ibid. P
24 We may begin to draw a common thread in the indicators/variables used within the more macroeconomic regression analysis based research. Both Gupta et al. (2000) and Pieroni and d Agostino, (2008), represent the costs of corruption within military expenditures as a share of GDP. Moreover both invoke already existing indexes used to measure causes and proxies of corruption 93, Gupta et al. utilizes TI s CPI and Pieroni and d Agostino using MIMIC s corruption model. NATO s report Building Integrity and Reducing Corruption in Defense: A Compendium of Best Practices 94 (2010) indirectly provides a great example of how data limitations, namely access to empirically based evidence meant to illustrate the economic costs of corruption, threaten the credibility of the assessments due to lack of supportive background evidence. The report compiles a series of NATO initiatives and best practices through which the costs of corruption and corruption as a whole may be combated, though a few of the sources cited in their report are questionable as they lack concrete supportive evidence. To illustrate, the report cites a case of corruption in Russia s Armed Forces (Appendix 20) as an example of the cost of corruption in terms of wasted money and lost opportunities for technological modernization in defense 95. The report asserts that corruption in the Russian Armed Forces resulted in losses of 2.2 billion rubles ($78.6 million) to the state budget in the first nine months of 2008 and the number of corruption-related crimes in the Russian Armed Forces increased by at least 30% compared to the same period in 2007 to a total of 1, But upon further investigation into NATO s sources we can only trace the statistics back to a news source with no further trail to how, where and when the data was collected and results were arrived at. This becomes problematic for a number of reasons, but for the purpose of this research, one may note how a lack of sufficient background data and the opaqueness of data within the military sector effectively hinder a grounded framework and methodology from which the costs of corruption may be measured. In summary, the main findings of this section assert that the leading way authors have attempted to empirically test for the economic costs of corruption is through either employing a more quantitative macroeconomic-based regression analysis model, as exemplified by Gupta et al. and Luca Pieroni and Giorgi d Agostino or employing a more qualitative based model which innovatively reworks existing theoretical frameworks from which the costs of corruption may be exemplified. The shortcomings for both of the macro-economic quantitative based researches, fall into the inability for either to develop their own corruption indexes, rather they run already existing corruption index models (i.e. TI s CPI or MIMIC s Corruption Indicator Index) against their own economic based regression models to showcase a correlative relationship between 93 Ibid. P NATO. Building Integrity and Reducing Corruption in Defense: A Compendium of Best Practices. NATO, Geneva (2010): P Ibid. P RIANovosti. Military corruption costs Russia almost $80 million in Accessed November 25,
25 military spending/growth and corruption. The SPIRI report adopts an innovative theoretical framework on how the costs of corruption can be effectively linked to human costs. SPIRI quantify the costs of corruption in the case of the South African Arms deal, through correlating the amount of funds that the arms deal effectively took away from the nationally funded HIV/AIDS prevention and treatment programs resulting ultimately in the loss of human life and health. This is a very effective way in not just showcasing the true impacts of corruption but also asserting a sense of urgency for readers that corruption is something that holds severe human ramifications if not addressed and exposed. This sort of modeling which is based on linking human costs of corruption to economic miss-spending also invokes emotion which serves as a better catalyst for popular support and action over that of just showcasing numerical figures and percentages, it makes it more personal and gives corruption the needed human element to make it relatable. 25
26 Natural Resource Management In general, natural resources like oil, gas, diamonds, and other precious minerals breed corruption, because governments can live off of their export earnings without having to compromise with their own societies. The natural resources are therefore not only a target of corruption but also an instrument of holding power. Many foreign companies, intent on cashing in, fuel the pathology of corrupt regimes by peddling in bribes and political protection. Jeffrey D. Sachs, In many countries around the globe Nigeria, the Democratic Republic of Congo, Sudan, Chile, Mexico, Colombia the extractive resource industry is a primary sector of the economy. Resource extraction involves any activity which withdraws resources from nature, including mining, logging, hunting, oil extraction, and gas drilling. As demand for natural resources is constantly fuelled by both developing and developed nations and growth in numbers of consumers, extractive industries are wildly profitable for the country in which extraction is undertaken (despite loss of potential incomes due to the fact that mined ores are usually processed and elaborated elsewhere). 98 OPEC countries alone are projected to make about $1,154 billion total from oil revenues in When extractive industry is a country s primary source of wealth, many social benefits fall by the wayside. This is a cycle known as the Dutch disease, wherein labor and capital are withdrawn from other activities and focused solely on the profitable extractive resource sector. Human development declines as social programs and general employment decrease, while the growth generated by extraction only benefits a small sector of the population. 100 Governments in these countries tend to concurrently bolster the military for increased protection of extraction sites. 101 As a result of these patterns, leaders are less accountable to their citizens, since they are not dependent on taxes for national income and are protected by the army; corrupt behavior can be fostered much more easily. 102 The exploitation of natural resources is reliant on massive capital for investment in infrastructure capital that many developing nations with abundant resources do not have at their disposal. As a result, they are dependent on foreign companies to invest in the necessary infrastructure. 103 Multinationals involved in such investments then have the leverage to make deals that are disadvantageous to the local population, while local leaders are able to demand bribes which are unavoidable if the multinational wishes to function properly in their locale. Such rent-seeking behavior can escalate as the project moves forward, since it is impossible to transfer operations on extraction 97 Jeffrey D. Sachs, Who Beats Corruption? Project Syndicate, December 23, syndicate.org/commentary/who-beats-corruption- 98 Pinsent Masons, Natural Resources U.S. Energy Information Administration, Oil Revenues Fact Sheet, May Eleanor R.E. O Higgins, Corruption, Underdevelopment, and Extractive Resource Industries: Addressing the Vicious Cycle, Business Ethics Quarterly, Vol.16, Issue 2 (2006): p Ibid See Appendices 21.1 & Ibid
27 projects. While local populations are left out of the profit cycle, corporations reap huge profits and local leaders increase their personal wealth through systemic bribery. 104 While the dramatic profitability of resource extraction has enormous potential for improving citizens lives, what usually happens is that the country succumbs to the Resource Curse. This phenomenon has been defined by economists as the inverse relationship between the low or absence of economic growth in a country filled with highly valuable resources. 105 The resource curse is prevalent in resource-rich countries where these revenues have exacerbated corruption, conflict, and economic stagnation amongst the majority of citizens. 106 The characteristics of the industry itself lend it quite naturally to high potentials for corruption. On the government (exporter/supply) side, it requires large amounts of investment capital; necessitates high levels of government control/regulation; inability to choose location freely; and sudden influx of wealth. 107 Although corrupt leaders and officials play a large part in spreading the resource curse, transnational companies have been playing an increasing large part in promoting corrupt activities non-disclosure of payments, non-disclosure of volume of resource extraction, avoidance of whistle-blowing, and increasing incidents of bribery, among others. 109 While there are plenty of studies documenting the incidence of corruption, weak governance, and rent-seeking in resource-rich countries (Lewis 2007, Aslaksen 2008, Leite & Weidmann 1999), most data tends to focus on correlating democracy 110 or trade openness and corruption levels 111 in these countries, or on creating indexes to measure the incidence of corruption. The scarcity of quantitative data to directly measure corruption can be attributed to the notorious opacity of deals brokered between governments and private investors in the field of resource extraction. Because of this, studies including actual numerical figures on the costs of corruption in natural resource management are few and far between. Leite and Weidmann have studied the effects of known corruption in resource rich countries on levels of economic growth. Instead of measuring how much money was lost, though, they use a regression model and indexes to infer how corruption affects economic growth. As a measure of corruption, they use the International Country Risk Guide (ICRG) corruption index, which gives countries a score on a scale of 0-6 (lower scores indicate a higher incidence of bribery throughout both lower and higher levels of government, as well as bribery related to import/export licenses, tax assessment, and 104 Ibid Janelle Melissa Lewis, The Resource Curse: Examining Corruption in the Extractive Industries. Perspectives on Global Issues, Vol.2 Issue 1 (Autumn 2007): p Save the Children. Beyond the Rhetoric: Measuring Revenue Transparency: company performance in the oil and gas industries. Save the Children, March 2005: p Ian E. Marshall. A Survey of Corruption Issues in the Mining and Mineral Sector, International Institute for Environment and Development Mining, Minerals and Sustainable Development Project, 7 September Lewis Ibid Silje Aslaksen, Corruption and Oil: Evidence from Panel Data, University of Oslo, p Ibid,
28 exchange controls 112 ; higher scores show stronger political institutions and courts, and provisions for an orderly succession of power 113 ). The theoretical model predicts that higher corruption will be associated with lower rates of growth. When comparing corruption scores to GDP growth in the years 1970 to using their regression model, Leite and Weidmann discover that long-term growth is negatively affected by the level of corruption: the average GDP growth rate is raised by some 1.4 percentage points with a onestandard deviation improvement in the corruption ranking. 115 For example: if Cameroon, Nigeria, and Venezuela raised their corruption score to the level of Chile; if Chile raised its score to the level of the USA; or if Kenya or Cameroon raised their scores to that of Taiwan; these improvements in corruption scores would result in a 1.4 percent increase in GDP for the more corrupt nations. 116 Table 5 in particular shows projected income increases in GDP per Economically Active Person (EAP) for the year 1990 if the scores of the aforementioned countries were improved. 117 The study leads to an unambiguous conclusion that corruption has a significant effect on growth, while affecting citizens of resource-rich countries in concrete monetary ways which can be measured by comparing corruption scores to GDP growth. Regression analyses comparing levels of corruption to GDP can be used to research similar hypotheses about any sector of an economy, so long as figures exist for the income produced. While they do show a correlation, however, none of the results will be exact as the corruption scores furnished by various indexes are always an estimate. A more intimate way to measure costs of corruption on local economies micro level is employed by Global Witness in their report on corruption in the copper and cobalt mines in Katanga, Democratic Republic of Congo (DRC). 118 These mines are among the world s richest in cobalt and copper, yet the DRC is one of the world s poorest countries. Corruption is endemic in these mines, and a significant amount of cobalt and copper is exported illegally and undeclared resulting in a huge loss of income for the Congolese government. 119 Researchers at Global Witness have turned to the local people as a source of information for just how much of the local ore profits are being lost. The report focuses on the artisanal mining sector, wherein mining is undertaken by independent individuals, free from regulations, and which produces raw minerals which are processed into cobalt and copper after export. 120 Since these individuals are intimately involved with every stage of the artisan mining and exporting process, this lends much 112 Carlos Leite & Jens Weidmann, Does Mother Nature Corrupt? Natural Resources, Corruption, and Economic Growth, International Monetary Fund, July p Ibid See Appendix Tables Leite & Weidmann See Appendix Tables Leite & Weidmann 26 Appendix 22.2, Table Global Witness. Digging in Corruption: Fraud, Abuse, and Exploitation in Katanga s copper and cobalt mines, 5 July Global Witness Ibid 28
29 credence to the information they are able to provide and allows researchers to make general inferences about corruption numbers. Artisan mining itself causes the Congolese government to lose money; when minerals are exported in their unprocessed state, they are worth less money than if they had been processed before export. The price of processed copper is currently $8,022 per ton 121, while that of cobalt is $23,600 per ton 122. A local source estimated that three quarters of the mined ore was being exported illegally in ; this can provide interested parties with a rough estimate of how much money the Congolese government has lost when compared to overall profits from ore exported legally. Testimonies from artisan miners interviewed for the Global Witness report are an excellent way to see how corrupt officials demand payment from them, as well as shedding light on the amounts paid in bribes by the miners. These bribes, known as per diems are paid by the miners and those tasked with transporting the cargoes across borders. 124 Depending on the mine or the area, per diems can total between 30,000-35,000 francs ($67-78), while officials at border crossings demand between $3000- $5000 per truck 125 These are outrageous amounts for a people whose average annual GDP per capita is $ Another form of corruption uncovered by this report is the exploitation of négoçiants (representatives of artisan miners) by trading companies, who offer prices far below the market value of the minerals. Some négoçiants report being offered as little as $78 for 3% grade cobalt ore a paltry amount when compared to the $23,000 plus reaped through legal export. 127 By the time the money trickles down to the artisanal miners, their daily income only amounts to $ The Global Witness report does not focus solely on artisanal miners in the DRC; it also discusses joint venture contracts between the DRC s state-owned mining company Gécamines and private companies. By and large, these are quite disadvantageous to the DRC; the report cites several contracts signed which cede a maximum of 25% of shares to Gécamines (in many cases, this is significantly lower.) 129 Global Witness interviewed Gécamines employees and local mining experts who stated that government employees would refuse to negotiate better contracts with the private companies, in many cases putting pressure on Gécamines to rush the approval of disadvantageous contracts. 130 These 121 Investment Mine, Copper Prices and Copper Price Charts, Investment Mine, Cobalt Investing Cobalt Stocks, Mining, Companies, Prices, and News, Global Witness Ibid Ibid. 126 The World Factbook, Democratic Republic of the Congo, CIA Ibid 20. See Appendix 23.1 for more approximations. 128 Ibid Ibid 36-37; see Appendix 23.2 for full details 130 Ibid
30 testimonies directly link the low profits received by the government to corrupt dealings with government officials. Reports like these work very well when one is attempting to measure costs of corruption on a small scale: in a particular locale, a certain industry, a specific village. The testimonies of locals as well as those of employees in the state-owned mining company give a very detailed picture of bribes being paid to individual officials or quantities being co-opted into illegal channels from mines in their specific region. As so many of these transactions are never put into writing, the best way to retrieve the information is from the people directly involved with giving bribe payments in their daily lives. From these testimonies, a reader can extrapolate the aggregate costs of corruption by making rough calculations based on the numbers provided. When corruption is widespread to a level that can no longer be ignored by state authorities, a report will occasionally be commissioned to track the financial losses and give recommendations as to what systemic changes can be made to avoid massive bribery. One such report is the Lutundula Report, published in December 2005;the Lutundula delegation went to Katanga in the DRC (mentioned above) to inventory and review trade agreements made in that region. The delegation inventoried a total of sixty agreements on behalf of Gécamines, the Congolese State, Sodomico another public mining company, and the SNCC the Congolese National Railway. 131 They also worked with State offices to gather statistics and data on mining exports and proofs of payment, and with private companies in the industry who were also involved in these contracts. 132 The Lutundula delegation was able to access government and industry documents, allowing it to make an in-depth analysis of financial and contractual commitments by both the government and private companies. The Report makes note of the distribution of share percentages in each project, relevant legal provisions, infrastructure and equipment used, profits reaped, and money which was owed or misplaced. The Report then makes recommendations for each case, whether that be to terminate the contract, allow it to lapse, or renegotiate. The delegation was also able to pinpoint overt instances of corruption; in one case, three people were directly accused of embezzlement when they were caught exploiting artisanal miners, selling state equipment to private buyers, embezzling revenues, and dismantling infrastructure for private sale. 133 Investigations similar to the Lutundula report have been carried out in India, Liberia, and Papua New Guinea. In the case of Liberia, the investigation enabled the government to review permits and agreements from 70 timber operators, discovering that only 47 were able to produce documentation none of which was proof of legal operation in Liberia. Following that, they were able to track how these concessions were made, how much revenue was being lost, and to what extent tax evasion was present. 134 In India, the investigation known as the Karnataka Lokayuta Report examined corruption 131 Rights and Accountability, Unofficial Translation of Lutundula Report, December p Ibid. 133 Ibid Marie Chêne, Corruption and the Renegotiation of Mining Contracts, U4 Anti-Corruption Resource Center, 30 November p.4 30
31 present in the iron ore mines of the Bellary District. The 2,000 page report examined illegal activities between January 2000 and July 2006, highlighting the amount of money lost to the exchequer. 135 One of the people directly implicated in the scandal was former Chief Minister N. Dharam Singh, who was in charge of the Department of Mines and Geology; he is cited as being responsible for the loss of Rs.232,211,850 between 2004 and 2006 by giving out illegal transportation permits at the mines. 136 In Papua New Guinea, corruption was investigated in timber harvesting; as in India, the legality of timber operations was assessed 137 and financial obligations pending to the state were uncovered. 138 Finally, corruption can have economic costs arising from outside the state itself. Many developing countries receive funding from international agencies like the United Nations and the World Bank so that they may decrease environmental impacts stemming from natural resource extraction or stop such activities altogether. The Observer reported that 37 tropical countries had requested $15 billion to reduce carbon emissions from logging, but upon further investigation some of these were discovered to be misusing these funds and abusing the system. 139 Reports like this point out another economic cost of corruption: development money lost to the citizens of countries in need because of corrupt government practices (which can then lead to cessation of funding). On a macro level, flows of funding to beneficiaries of the World Bank, as well as the stemming of these flows and the reasons behind such interruptions in funding, can also be employed in measuring the economic costs of corrupt practices. In summary, the natural resource extraction industry is rife with corruption at every level, from individual miners to the top echelons of multinational corporations and state governments. While macro-economic studies can be done to collect figures for corruption, the notorious opacity of government transactions in this field will only divulge general numbers and patterns. Detailed and accurate reports on extraction corruption are more likely to be the product of sector-level inquiry at the national or even local level. These can take the form of research on the ground, as seen in the Global Witness report interviewing miners, loggers, and other workers directly engaged in extracting the resource or administrative research by government-appointed delegation, as in the Lutundula report. The latter will profit from much broader access to classified government documents, and government researchers are more likely to ferret out large-scale corruption. Unfortunately, this type of investigation is rare because it could potentially expose corruption by the very government officials who would be in a position to authorize an official inquiry. 135 Vikhar Ahmed Sayeed, Mines of Scandal, Frontline Vol26 Issue 3, January 31-February 13, p Ibid Forest Trends. Logging, Legality, and Livelihoods in Papua New Guinea: Synthesis of Official Assessments of the Large-Scale Logging Industry, 1 March p2 138 Ibid, 46. See Appendix 24 for chart. 139 John Vidal, United Nations warned that corruption is undermining grants to stop logging, The Observer, 3 July
32 Pharmaceutical Industry Over the past two decades the pharmaceutical industry has moved very far from its original purpose of discovering and producing useful new drugs to marketing drugs that can sometimes be of dubious benefit. This industry increasingly uses its wealth and power to co-opt every institution that might stand in its way, including the US Congress, the FDA, academic medical centers, and the medical profession itself. 140 Combating corruption within the Pharmaceutical sector should high on everyone s agenda. Not only does corruption in this sector create inefficiencies and economic losses, it can also give rise to grave consequences for the health of society as a whole. Globally US$ 5.3 trillion is estimated to be spent in health sectors, thereby presenting lucrative prospects for abuse and illicit gains. 141 It has been estimated by the World Health Organization (WHO) that the value of the global pharmaceutical market alone is over US$ 600 billion and growing rapidly. 142 Moreover, since the 1980s, the pharmaceutical industry has developed into the most profitable in the United States. 143 As Angell states, it is important to note that financial estimates of the pharmaceutical companies are exactly that, estimates. It is virtually impossible to be exact with most figures concerning this industry as drugs pass through various middlemen, processes and interactions where costs and price determinations are hidden before reaching the consumer. 144 WHO attributes corruption in the pharmaceuticals sector to the high level of financial flows, lack of shared information between players involved, high procurement activity, coupled with the high burden of regulation over the many steps involved in producing the product making it more susceptible to corrupt practices and unethical behavior. Moreover, due to the significant degree of government intervention and lack of checks and oversight, officials have increased power over core decisions making them susceptible to corrupt practices such as favoritism and kickbacks. The nature of the pharmaceutical sector itself also creates an environment where corruption is favored as agents are told to behave in a manner that will maximize financial interest over the care patients. 145 Most academic research on corruption in the pharmaceutical industry has been on identifying the areas in which corruption is most prevalent in the medicine chain and assessing 140 Angell, Marcia, The Truth about the Drug Companies. Accessed November , Hussmann, Karen Vulnerabilities to Corruption in the Health Sector: Perspectives from Latin America Sub- Systems for the Poor". (UNDP, 2011): Anello, Eloy, A Framework for Good Governance in the Public Pharmaceutical Sector (WHO, 2008): Angell, Marcia, The Truth about the Drug Companies. (New York: Random House Inc, 2004), Ibid Cohen, J.C et al, Tackling Corruption in the Pharmaceutical Systems Worldwide with Courage and Conviction, Clinical Pharmacology & Therapeutics 81 (2007):
33 vulnerability to corruption at every stage of this chain. Through this lens it is believed that the key to reducing economic/ social corruption within this troublesome sector is to promote good governance (information, transparency, integrity, accountability, participation). While there has been a growing effort by international and national organizations and governments to crack down on corruption within this sector, there is an unfortunate lack of information on quantitative cost of corruption, which has been attributed by many as a result of its complex and clandestine nature. Dean Baker, the Co-Director of the Center for Economic and Policy Research in Washington, DC, has stated that research on corruption in pharmaceuticals is lacking in economic analysis. 146 My own research on corruption in the Pharmaceutical sector confirms his sentiment: there is little on the actual economic cost of corruption, and the few estimates that do exist are seldom accompanied by discussions of sources and methods During the first phase of the research project papers and journal articles of various topics were collected and analyzed in an attempt to find content on the quantification of the cost of corruption within the pharmaceutical sector. This search did not yield any results on this specific topic. As mentioned previously, a great wealth of information on general corruption in the pharmaceutical sector was found but unfortunately, there very few estimates of the economic cost of corruption, and the few figures that are available provide no underlying detail on the methodology through which they were derived. In an attempt to work around the lack of data in this sector I analyzed the medicine chain as a way of pinpointing other ways in which people were quantifying the costs through monitoring or recording the incidents of corrupts acts at the different stages of the chain. By using this method I sought to acquire estimates that could then be used by Transparency International to arrive at their own cost estimates. Shown below is the medicine chain detailing the various processes and the way in which corruption occurs during each of the steps. 146 Baker, Dean, Corruption in the Pharmaceutical Industry: Why Is Anyone Surprised?, accessed November 22011, 33

34 Figure 1: The Medicines Chain and potential Corrupt Activities Source: WHO, Figure 1, p. 2, Good Governance foe Medicines Programme: an innovative approach to prevent corruption in the pharmaceutical sector, Once this data was collected it was put into a database listing the name of the sources, the figures provided, and the methodology (if available) that was used to arrive at these figures. The information was then analyzed with a view to the validity of the numbers presented and the effectiveness of the methods. A third avenue that I investigated consisted of obtaining quantitative data from newspapers and court cases that provide proof of corruption through law suits against pharmaceutical companies that covered corrupt activities 147. This not only provided proof of corruption in these areas of the pharmaceutical industry but also provided specific numbers. Even here, the methodology behind these figures was not publically available although it may be accessible to legal professionals. Although the economic costs of corruption are yet to be measured and identified in the pharmaceutical sector, there are some ways in which we can infer some of these costs. It is important to emphasize that these inferences would need to be supplemented by specific economic analysis and by special access to records which are not available to the public. For example, Kassirer states that, pharmaceuticals and biotechnology industries have spent some US $16 billion annually in the United States on marketing to physicians. Of this, more than US $2 billion was spent on meals, meetings and events alone. 148 He continues to state that companies seek to influence doctors with US $ 1,000 5,000 honoraria (or more) to participate 147 See Appendix 1 for examples of cases 148 Kassirer, Jerome The corrupting influence of money in medicine cited in The Global Corruption Report: Corruption and Health, (Transparency International, 2006): 86 34
35 in their speaker s bureaus and hire them as well paid consultants and members of their advisory boards. They also bombard doctors with journal ads and almost 90,000 friendly drug salesmen. 149 Several organizations lead the investigation into corruption: WHO, TI, UNDP, IMF and WB. Although these organizations do not focus primarily on quantifying the cost of corruption they do provide some widely cited statistics in relation to procurement and counterfeiting of drugs. For example in a UNDP paper titled Vulnerabilities to Corruption in the Health Sector: Perspectives from Latin America Sub-Systems for the Poor it was stated that in the US, up to 15% of all drugs sold are fake while in some countries the figure can amount to 50%. Further, of the public procurement costs for drugs, an estimated 10-25% is lost to corruption. 150 This is especially worrying as patients are not aware or are not given vital information when purchasing a drug for their health. Up to 25% of drugs consumed in less developed countries are considered to be counterfeit. 151 Cohen states that in 2001, it was reported that China had close to 500 illegal medicine manufacturers, Laos around 2,100 illegal and that In Thailand, counterfeit drugs accounted for 8.5 per cent of those on the market 152. With that said, more than 98% of counterfeit drugs are imported from China and India. 153 In 2003, Lybecker estimated the annual turnover for the pharmaceutical industry to be $435 billion in 2003, calculating the financial loss to the industry at as much as $43.5 billion per year. 154 Finally, it has been estimated that in developing countries, pharmaceutical expenditures and drug procurements comprise 20-50% of public health budgets. 155 As can be imagined, this is a fertile area for corrupt practices. Databases During my research I came across several databases whose numerical information could enter into more detailed estimates of the costs of corruption within the sector Ibid 150 Hussmann, Karen Vulnerabilities to Corruption in the Health Sector: Perspectives from Latin America Sub- Systems for the Poor". (UNDP, 2011): WHO Fact Sheet Number 275, Revised February 2006, Counterfeit Medicines Kassirer, Jerome The corrupting influence of money in medicine cited in The Global Corruption Report: Corruption and Health, (Transparency International, 2006): Akunyili, Dora The fight against counterfeit drugs in Nigeria cited in The Global Corruption Report: Corruption and Health, (Transparency International, 2006): Lybecker,, Kristina M. RX Roulette: Counterfeit Pharmaceuticals in Developing Nations, Drexel University, (August 2003): U4 Anti-Corruption Resource Centre, Corruption in the Heath Sector, (November 2008): 16 35
36 ProPublica s Dollars for Docs : Recently compiled a database where the public can find out much money doctors accepted from pharmaceutical companies (USA only). IMS Health: A private information company who sells data on the scale, size and growth of pharmaceutical market. It is apparent that they hold the most reference data on the pharmaceutical market. The International Drug Price Indicator Guide: compiles prices from pharmaceutical suppliers, international development organizations, and government agencies, which is currently used to improve procurement of medicines and the quality for lowest price. Pharmaceutical Security Institute (PSI): Focus on dispersing data on the counterfeiting of drugs. It created the Counterfeiting Incident System (CIS) to record incidents of counterfeiting, theft and illegal diversion of pharmaceutical products worldwide from a variety of sources 157. The Centers for Medicare and Medicaid Services ("CMS"): Under the Sunshine Act, a provision of the 2010 Patient Protection and Affordable care act (PPACA), CMS will begin to compile a database from medical device, biological and medical supply manufacturers to track and report payments made to physicians and teaching hospitals it also for the release of any financial or ownership interests that physicians or family members have with those entities. 158 The collection of data has been postponed till January 1 st As mentioned previously, there is a frustrating lack of specific data on corruption in pharmaceuticals, and the little that is available seldom provides information on the sources and methods used in arriving at these numbers. What is more, the few figures that one can find are constantly reproduced in different reports, and the majority of these numbers seem to derive from WHO. The data collected from academic journals and papers could be argued to be credible, as they had to go through a rigorous process to be published. These sources were usually written by academics prominent in the field who have been working on corruption specifically in relation to the pharmaceutical sector. Furthermore the figures given in court cases can also be considered reliable, as they are official reports that have a team working behind to dig up the figures. Due to the fact that the economic calculations given in these court cases are not made public, it was not possible to assess their validity. 156 See Appendix see Appendix 4 for examples of data 158 Mondaq. United States: Physician Payment Sunshine Act Data Collection Deferred To 2013 accessed Nov , eferred+to
37 The same can be said about the databases mentioned above. The information that they collect is either not available to the public and there is not much further information on how they collected their data. For example, PSI does state that it collects it data from various sources such as newspapers but does not provide specifics. The information in the databases that I have identified could be compiled into one metadatabase containing the relevant information. This would make it much easier to track the existing data and assess the underlying methodologies. The authors of existing studies could also be listed in the meta-base, so that they might be contacted if necessary. While this would help, it is only a step in the right direction. My central empirical finding is that there is not much publically available data on the economic costs of corruption in the first place, particularly specifically in the pharmaceutical sector. My central methodological conclusion is that full scale economic models need to be identified. These might exist in existing court cases, but since they are not publically available, it would be worthwhile to track down the authors of the estimates used in the legal cases. In addition, there is an urgent need for new economic studies on the costs and impact of corruption. 37
38 Conclusions and Recommendations It has become evident throughout the course of our research that the amount of empirically tested data and overall existing evidence of the costs of corruption is severely limited in scope. The approaches which have been adopted in attempts to measure the costs of corruption are extremely varied and of variable quality. The more macro-economically oriented reports predominately make use of correlation models, ranging from regression analysis to crosssectional and panel data analysis models where quantifiable statistics such as GDP, GDP per capita, growth rates etc are utilized in any or all of the aforementioned analysis models. The microeconomic-based approaches take on a more qualitative dimension and are methodologically characterized by theoretical modeling; this form of analysis is more substantiated by employing measuring techniques such as questionnaires and surveys. The ability to correlate a corrupt practice with a corrupt cost in economic terms has been hindered by the limited access to empirically substantive and reliable data. Consequently, the reports assert that their findings are more suggestive in nature than conclusive. However, despite these challenges there have been a number of significant attempts to effectively measure, correlate and analyze the varying costs of corruption, as shown across the aforementioned sectors, which ultimately have allowed for this report to posit a series of key methodological and policy recommendations. Moreover, there is ample room for innovation and creativity within the arena of measuring the costs of corruption. Here attached is the link to our group s database, which was created to showcase and compile the various methods and key statistical findings, which our report has uncovered during the course of our research. This database strives to succinctly catalog the myriad of sources utilized in our report and briefly summarizes each source s methodological framework, key findings and supportive evidence across the 4 sectors we focused on. It should be noted that each sector has its own tab, which can be found at the bottom of the spreadsheet. This database is intended to provide our present client and future clients with an accessible data set from which one may access information to the existing research available concerning quantifying the costs of corruption. Link to Database: mb3pid1e#gid=0 Based on our review of existing literature we have drawn the following conclusions from which to present a set of best practices for future attempts in this area: 38
39 Key Findings: There are a certain number of limitations inherent in studies, which attempt to estimate illicit financial flows. First, no economic model that relies on official data to estimate illicit flows can capture the effects of smuggling, which entirely bypasses customs authorities and their recording systems. The profits from smuggling often end up as part of outgoing illicit flows since smugglers seek to shield their ill-gotten gains from the scrutiny of officials, even as smuggling distorts the quality of bilateral trade. As a result, trade data distortions due to smuggling may indicate that there are inward illicit flows into a country when in fact the reverse is true. Therefore, any future attempts to measure illicit outflows should take this into consideration. Economic models which rely on official statistics also do not capture illicit flows generated through transactions in narcotics and other contraband goods, human trafficking, violations of intellectual and property rights, and the sex trade because related financial flows are not recorded in any publicly available books. As such, economic models understate the actual volume of illicit flows to the extent that these types of transactions are significant for both developing and developed countries. The IMF s Direction of Trade Statistics used in the Trade Mis-invoicing model does not capture same-invoice faking. Thus, total trade mispricing estimates must be further adjusted for same-invoice faking by assuming that such faking is at least equal to reinvoiced trade mispricing. Any measures of corruption must take into account the fact that a large part of the effect of corruption on growth is transmitted through other variables (investments, schooling, openness, and political stability), which serve to reflect the indirect effects of corruption on growth in particular, but also on society more generally. Compilations of facility level quantitative data such as those undertaken by Reinikka and Svensson typically requires much more effort than, say, a perception survey of service users, which makes a survey tool such as QSDS both more costly and time consuming to implement than some other alternatives. An important contribution of measures similar to the PETS and the QSDS is the establishment of stylized facts about service provision. These facts can then be used as benchmarks for cross-country studies, as well as baselines for monitoring the effectiveness of policy changes within individual countries. 39
40 PETS and QSDS can also help to confront current problems of sector-wide lack of empirical information by helping to build capacity and public awareness through the publication of fund-leakage. Evidence suggests that general country-level corruption indicators may be poor tools to uncover particularly corrupt construction industries, and also that corruption within the industry may differ markedly by sub-sector or by location within a country, perhaps due to varying business models and local government clients between different firms within countries. This in turn suggests some danger in assuming a single intervention or model will have a similar or significant impact on corruption in a specific manner across different countries, and highlights the need for a range of targeted and flexible responses at the country and sector level. The elusiveness of measuring the economic costs of corruption has placed a series of limitations in the way of significantly quantifying the costs of corruption. As a result the take-away from many of the studies examined here is that is that the data is largely not available due almost entirely to the inability to measure the broad range of indicators which may constitute as corruption and compiling the evidence necessary to substantiate those claims. Within the sector of military spending and defense for example, it has been shown in multiple ways that in essence the ability to measure the costs of corruption implicitly goes hand in hand with the ability to measure a black market. Recommendations: Given the secretive and opaque nature of resource extraction deals, the most effective way to investigate corruption in this sector would be to collaborate with state authorities interested in eradicating corruption amongst their own ranks. Detailed investigations like the Lutundula Report make use of state documents, contracts, and testimonies to create a well-rounded picture of issues involving missing or misappropriated revenues owed to the state. In certain cases, this type of thorough investigation can even uncover individuals who have been operating in corrupt ways, leading to potential prosecutions. The inability of states to get the full value of their own resources can be mitigated by weeding out corrupt individuals, as well as pointing out where improvements can be made to improve knowledge and capacity. TI should look into developing a model, which attempts to accurately estimate the size of the black market either as a whole (global share) or in the context of regional, national and/or local share. The black market estimation model would in effect provide a framework from which black market transactions and activities could be quantified 40
41 relative to legal market transactions. This also would give TI the ability to expose or shed light on countries, which are more engaged with illegal or grey market activities within the military sector. TI is the global leader in advocating for and publishing anti-corruption policy/work and has subsequently forged many relationships with relevant partner organizations. The frequent invocation of TI s indexes reflects those relationships and the widespread influence that TI has to establish precedents from which corruption may be addressed. With that said, there are many implications that the finding in this report holds, not just within the confines of this report but also for TI in general in driving policy and influence further throughout its partnerships with organizations/governments etc. One recommendation is for TI to establish new guidelines and standards of what constitutes as corruption. TI holds the influence and respect necessary to set more strict guiding principles for defining and exposing the presence of corruption globally. Partner organizations and national governments would in theory also adopt TI s new guidelines in showcasing up-to-date standards on anticorruption policy/initiatives as a form of displaying good governance and move towards observing more transparency within the military sector. Substantial work needs to be undertaken in order to construct estimates of the quantitative cost of corruption in the pharmaceutical sector. A useful next step would be to see if legal professionals could access the estimates of corruption costs that have been produced by various sides in lawsuits. Furthermore, a team of economists might be assembled to provide new estimates of the cost of corruption. Finally, a database should be compiled consisting of all currently available data from governments and private institutions, and this should be updated as new information becomes available. The use of surveys as part of an over-all corruption measure is one avenue that should be looked into. Such surveys should be designed to gather information regarding corrupt transactions through external audits that track public resources and estimate the amount lost to theft or graft. A similar approach could be used to incorporate information about corrupt transactions uncovered through criminal investigations. When assessing survey data in the manner of the PETS and QSDS, it should be stressed that despite the data collection strategy, there are likely to be cases of misreporting in the sample. The average graft numbers in particular may be sensitive to such misreporting. 41
42 The usefulness of data obtained in the PETS/QSDS is limited by the lack of a rigorous conceptual framework since it is not clear how to identify a corrupt act or how to generate an aggregate corruption measure. 42
43 APPENDICES Appendix 1: Macroeconomic Data 1.1 Paulo Mauro. Corruption and Growth. The Quarterly Journal of Economics (January 1995):
44 1.2 Paulo Mauro. Corruption and Growth. The Quarterly Journal of Economics (January 1995):
45 1.3 Paulo Mauro. Corruption and Growth. The Quarterly Journal of Economics (January 1995):
46 1.4 Paulo Mauro. Corruption and Growth. The Quarterly Journal of Economics (January 1995):

47 1.5 Paulo Mauro. Corruption and Growth. The Quarterly Journal of Economics (January 1995):

48 1.6 Paulo Mauro. Corruption and Growth. The Quarterly Journal of Economics (January 1995):

49 1.7 Paulo Mauro. Corruption and Growth. The Quarterly Journal of Economics (January 1995):

50 1.8 Paulo Mauro. Corruption and Growth. The Quarterly Journal of Economics (January 1995):
51 1.9 51

52 Paulo Mauro. Corruption and Growth. The Quarterly Journal of Economics (January 1995):

:")
53 1.10 Paulo Mauro. Corruption and Growth. The Quarterly Journal of Economics (January 1995):

54 1.11 Paulo Mauro. Corruption and Growth. The Quarterly Journal of Economics (January 1995):
55 Appendix 2: Equation the Effect of Corruption on Growth Source: Pellegrini & Gerlagh, Corruption s Effect on Growth and Its Transmission Channels, Kyklos Vol.57 (2004): p. 55
56 Appendix 3: Correlating National Variables to Corruption 3.1 Foster, Horowitz and Mendez, An Axiomatic Approach to the Study of Corruption: Theory and Applications. University of Arkansas (January 2009): 17 56
57 3.2 Foster, Horowitz and Mendez, An Axiomatic Approach to the Study of Corruption: Theory and Applications. University of Arkansas (January 2009): 18 57
58 3.3 Foster, Horowitz and Mendez, An Axiomatic Approach to the Study of Corruption: Theory and Applications. University of Arkansas (January 2009): 19 58

59 Appendix 4: Illicit Financial Flows from Africa: Carr and Smith, Illicit Financial Flows from Africa: Hidden Resource for Development, Global Financial Integrity (March 2010): 10 59
:")
60 4.2 Carr and Smith, Illicit Financial Flows from Africa: Hidden Resource for Development, Global Financial Integrity (March 2010): 16 60

61 Appendix 5: Construction Firms in BEEPS Reported Corruption & Corruption Frequency 5.1 Charles Kenny, Transport Construction, Corruption, and Developing Countries. Transport Reviews (January 2009):

62 5.2 Charles Kenny, Transport Construction, Corruption, and Developing Countries. Transport Reviews (January 2009):
63 Appendix 6: Corruption in Procurement and Public Purchase - Symmetric & Asymmetric Cases 6.1 Emmanuelle Auriol, Corruption in Procurement and Public Purchase. International Journal of Industrial Organization (September 2006): 17 63
64 6.2 Emmanuelle Auriol, Corruption in Procurement and Public Purchase. International Journal of Industrial Organization (September 2006): 21 64

65 Appendix 7: SPIRI - Share of World Military Spending for Top 10 Spenders, 2011 Source: Stockholm International Peace Research Institute. SPIRI Military Expenditure Data, Last Modified April 17,
66 Appendix 8: SPIRI - National Military Expenditures as a Share of GDP, 2011 Source: Stockholm International Peace Research Institute. SPIRI Military Expenditure Data, Last Modified April 17,
67 Appendix 9: IMF - Corruption and Military Spending - Countries Used Source: Gupta, Sanjeev. Luiz de Mello and Raju Sharan. Corruption and Military Spending International Monetary Fund, Working Paper 23, (2000): P
68 Appendix 10: IMF - Corruption and Military Spending - Cross Sectional Analysis Model Source: Gupta, Sanjeev. Luiz de Mello and Raju Sharan. Corruption and Military Spending International Monetary Fund, Working Paper 23, (2000): P
69 Appendix 11: IMF - Corruption and Military Spending - Panel Regression Analysis Model Source: Gupta, Sanjeev. Luiz de Mello and Raju Sharan. Corruption and Military Spending International Monetary Fund, Working Paper 23, (2000): P
70 Appendix 12: IMF - Corruption and Military Spending - Panel Regression Analysis Model Source: Gupta, Sanjeev. Luiz de Mello and Raju Sharan. Corruption and Military Spending International Monetary Fund, Working Paper 23, (2000): P
71 Appendix 13: IMF - Corruption and Military Spending - Panel Regression Analysis Model Source: Gupta, Sanjeev. Luiz de Mello and Raju Sharan. Corruption and Military Spending International Monetary Fund, Working Paper 23, (2000): P
72 Appendix 14: IMF - Corruption and Military Spending - Panel Regression Analysis Model Source: Gupta, Sanjeev. Luiz de Mello and Raju Sharan. Corruption and Military Spending International Monetary Fund, Working Paper 23, (2000): P
73 Appendix 15: IMF -Corruption and Military Spending - Panel Regression Analysis Model Source: Gupta, Sanjeev. Luiz de Mello and Raju Sharan. Corruption and Military Spending International Monetary Fund, Working Paper 23, (2000): P
74 Appendix 16: IMF - Corruption and Military Spending - Panel Regression Analysis Results Source: Gupta, Sanjeev. Luiz de Mello and Raju Sharan. Corruption and Military Spending International Monetary Fund, Working Paper 23, (2000): P
75 Appendix 17: Military Spending, Corruption and Economic Growth - Description of Variables Measured and Sources Source: Pieroni, Luca and Giorgi d Agostino. Military Spending, Corruption and Economic Growth. Peace Economics, Peace Science and Public Policy. Volume 14, Issue 3 (2008): P
76 76
: P. 2.")
77 Appendix 18: Military Spending, Corruption and Economic Growth - Mathematical Equations Employed to Measure and Correlate the Cost of Corruption Source: Pieroni, Luca and Giorgio d Agostino. Military Spending, Corruption and Economic Growth. Peace Economics, Peace Science and Public Policy. Volume 14, Issue 3 (2008): P
78 Appendix 19: Military Spending, Corruption and Economic Growth - Correlations between Country Risk Guide Index and Cardinal Corruption Index Source: Pieroni, Luca and Giorgi d Agostino. Military Spending, Corruption and Economic Growth. Peace Economics, Peace Science and Public Policy. Volume 14, Issue 3 (2008): P
79 79

80 Appendix 20: NATO - Economic Costs of Corruption in Russian Armed Forces Source: NATO. Building Integrity and Reducing Corruption in Defense: A Compendium of Best Practices. NATO, Geneva (2010): P
81 Appendix 21: Extractive Industries Patterns and Stakeholders 21.1 Source: Eleanor R.E. O Higgins, Corruption, Underdevelopment, and Extractive Resource Industries: Addressing the Vicious Cycle, Business Ethics Quarterly, Vol.16, Issue 2 (2006): p


82 21.2 Source: Eleanor R.E. O Higgins, Corruption, Underdevelopment, and Extractive Resource Industries: Addressing the Vicious Cycle, Business Ethics Quarterly, Vol.16, Issue 2 (2006): p
83 Appendix 22: Corruption Regressions & Improvements in Trade Regimes 22.1 Source: Carlos Leite & Jens Weidmann, Does Mother Nature Corrupt? Natural Resources, Corruption, and Economic Growth, International Monetary Fund, July :p22 83
84 Source: Carlos Leite & Jens Weidmann, Does Mother Nature Corrupt? Natural Resources, Corruption, and Economic Growth, International Monetary Fund, July :p24. 84
85

86 Source: Carlos Leite & Jens Weidmann, Does Mother Nature Corrupt? Natural Resources, Corruption, and Economic Growth, International Monetary Fund, July :p

87 Appendix 23: Copper & Cobalt Trade in the DRC Prices & Contracts 23.1 Source: Global Witness. Digging in Corruption: Fraud, Abuse, and Exploitation in Katanga s copper and cobalt mines, 5 July p.20 87


88 23.2 Source: Global Witness. Digging in Corruption: Fraud, Abuse, and Exploitation in Katanga s copper and cobalt mines, 5 July p37. 88

89 Appendix 24: Logging in Papua New Guinea Financial Obligations and Payments Source: Forest Trends. Logging, Legality, and Livelihoods in Papua New Guinea: Synthesis of Official Assessments of the Large-Scale Logging Industry, 1 March p46. 89
90 Appendix 25: Examples of Counterfeit cases. Source Country Case Cohen, J.C. et al. Tackling corruption in the pharmaceutical systems worldwide with courage and conviction. WHO fact sheet Brazil United States of America, 2010 China, were jailed and 25 Ministry of Health employees fired for embezzling US$637 million in the last decade through bribes and price fixing related to reimbursement listings Alli (weight-loss medicines) Smuggled into the USA. Contained undeclared active ingredients with possible serious health risks to the consumer Anti-diabetic traditional medicine. Contained six times the normal dose of glibenclamide. Two people died, nine Colitt, R. Brazil probe reveals decade of corruption in health contracts. Financial Times (June 2, 2004). Food and Drug Administration, United States of America State Food and Drug Administration, People s Republic of China 90
91 people were hospitalized United Republic of Tanzania, 2009 Metakelfin (anti-malarial), Discovered in 40 pharmacies. The drug lacked sufficient active ingredient Tanzania Food and Drugs Authority, United Republic of Tanzania Kenya, 2011 Zidolam-N (for HIV/AIDS) Nearly patients affected by falsified batch of their antiretroviral therapy. Pharmacy Board, Kenya United Kingdom, 2011 Truvada and Viread (for HIV/AIDS), Seized before reaching patients. Diverted authentic product in falsified packaging. The Medicines and Healthcare Products Regulatory Agency, United Kingdom BBC News Pakistan, 2011/ people died from taking contaminated heart medicine 91
92 Examples of Lawsuits against Pharmaceutical companies Pharmaceuti cal company Countr y/ year Fraudulent act Link GlaxoSmithKli ne USA, 2012 Fined totaling $3bn for criminal and civil violations. Admitted illegally marketing the popular antidepressa nts Paxil and Wellbutrin and also withholding the data on the health risks of its best-selling diabetes drug, Avandia. insidestoryamericas/2012/07/ html Eli Lilly USA, 2009 Paid more than $1.4bn for illegally promoting the drug Zyprexa. Pfizer Inc USA, 2009 Paid $2.3bn for improperly marketing 13 different drugs, 92
93 Johnson & Johnson Abbott Laboratories USA, 2012 including Viagra. Paid more than $1.2bn for minimizing or concealing dangers associated with the antipsychotic drug Risperdal Settled for $1.6bn in regard to false marketing of the antiepileptic and moodstabilizing drug Depakote. 93
94 Appendix 26: Spurious/Falsely Labeled/ Falsified/Counterfeit (SFFC) medicines 159 Fact sheet N 275 May 2012 Key facts Spurious/falsely-labeled/falsified/counterfeit (SFFC) medicines are medicines that are deliberately and fraudulently mislabeled with respect to identity and/or source. Use of SFFC medicines can result in treatment failure or even death. Public confidence in health systems may be eroded following use and/or detection of SFFC medicines. Both branded and generic products are subject to counterfeiting. All kinds of medicines have been counterfeited, from medicines for the treatment of life-threatening conditions to inexpensive generic versions of painkillers and antihistamines. SFFC medicines may include products with the correct ingredients or with the wrong ingredients, without active ingredients, with insufficient or too much active ingredient, or with fake packaging. SFFC medicines are found everywhere in the world. They range from random mixtures of harmful toxic substances to inactive, ineffective preparations. Some contain a declared, active ingredient and look so similar to the genuine product that they deceive health professionals as well as patients. But in every case, the source of a SFFC medicine is unknown and its content unreliable. SFFC medicines are always illegal. They can result in treatment failure or even death. Eliminating them is a considerable public health challenge. Extent of the problem Defining the extent of counterfeiting is difficult for a number of reasons. The variety of information sources makes compiling statistics a difficult task. Sources of information include reports from national medicines regulatory authorities, enforcement agencies, pharmaceutical companies and nongovernmental organizations, as well as ad hoc studies on specific geographical areas or therapeutic groups. The different methods used to produce reports and studies also make compiling and comparing statistics difficult. 159 WHO Fact Sheet Number 275, Revised February 2006, Counterfeit Medicines. factsheets/fs275/en/. 94
95 Studies can only give snapshots of the immediate situation. Counterfeiters are extremely flexible in the methods they use to mimic products and prevent their detection. They can change these methods from day to day, so when the results of a study are released, they may already be outdated. Finally, information about a case under legal investigation is sometimes only made public after the investigation has been concluded. Counterfeiting is greatest in regions where regulatory and enforcement systems for medicines are weakest. In most industrialized countries with effective regulatory systems and market control (i.e. Australia, Canada, Japan, New Zealand, the United States of America, and most of the European Union), incidence of SFFC medicines is extremely low less than 1% of market value according to the estimates of the countries concerned. But in many African countries, and in parts of Asia, Latin America, and countries in transition, a much higher percentage of the medicines on sale may be SFFC. Not only is there a huge variation between geographic regions in terms of incidence of SFFC medicines, variation can also be significant within countries: for example, between urban and rural areas, and between cities. All kinds of medicines have been counterfeited branded and generic ranging from medicines for the treatment of life-threatening conditions to inexpensive generic versions of painkillers and antihistamines. Internet sales In over 50% of cases, medicines purchased over the Internet from illegal sites that conceal their physical address8 have been found to be counterfeit. Public health risks SFFC medicines pose a public health risk because their content can be dangerous or they can lack active ingredients. Their use can result in treatment failure and contribute to increased resistance (e.g. in the case of anti-malarials that contain insufficient active ingredient) or even death. Unlike substandard medicines where there are problems with the manufacturing process by a known manufacturer, SFFC medicines are made by people with the intent to mislead. The extreme difficulty in tracing the manufacturing and distribution channels of SFFC medicines makes their circulation on markets difficult to stop. Even a single case of a SFFC medicine is unacceptable since it indicates that the pharmaceutical supply system in which it was detected is vulnerable. It undermines the credibility of national health and enforcement authorities. Contributory factors 95
96 Several factors contribute to the SFFC medicine problem. Paying for medicines can consume a significant proportion of individual or family income. Some people seek medicines that are sold more cheaply. These are often available from non-regulated outlets, where the incidence of SFFC medicines is likely to be higher. People might also purchase medicines from non-regulated outlets if, as is often the case in rural areas of developing countries, supplies of medicines at regular health facilities do not meet demand. Counterfeiting medicines can be very lucrative. Since many countries have not yet enacted deterrent legislation, counterfeiters often do not fear prosecution. The growth in international trade of pharmaceutical ingredients and medicines adds a further dimension of complexity to this issue. For example, trade through brokers and free trade zones where regulation is lax or absent (and medicines are repackaged and relabeled to conceal the country of origin) is increasing. WHO response Stringent regulatory control of medicines and enforcement by national medicines regulatory authorities contributes significantly to the prevention and detection of SFFC medicines. WHO provides direct country and regional support for strengthening medicines regulation In 2010, the World Health Assembly established a Working Group of Member States to review WHO s role in ensuring the availability of quality, safe, efficacious and affordable medical products and in the prevention and control of medical products of compromised quality, safety and efficacy such as substandard/spurious/falsely-labeled/falsified/counterfeit medical products from a public health perspective, excluding trade and intellectual property considerations 96
97 Appendix 27: Potentially Relevant Databases Source Link Information Comments IMS Health ( a private information company) Has data on scale, size and growth of pharmaceutic al market ProPublica: Dollars for Doc s. Compiled database listing amount of money doctors accepted from pharmaceutic al companies (USA only) Pharmaceutic al Security Institute (PSI) PSI Counterfeitin g Incident System (CIS) is used to record incidents of counterfeiting, theft and illegal diversion of pharmaceutic al products worldwide. Not available to the public Has data of payments made in 2009, 2010 and beginning of Accessible to the public. CSI collects data from a variety of sources, including open media reports, PSI member company submissions, and publicprivate sector partnership s. The Lists prices Methodolog 97
98 International Drug Price Indicator Guide cfm?file=1.0.htm&module=dmp&language=en glish from pharmaceutic al suppliers, international development organizations, and government agencies in order to improve procurement of medicines + quality for lowest price. y and data collection information not available The Centers for Medicare and Medicaid Services ("CMS"): Tracks and reports payments made to physicians and teaching hospitals from medical supply manufacturer s Collection of data postponed till Jan 1 st


99 Appendix 28: PSI Counterfeit Incident System Data Pharmaceutical Security Institute 99

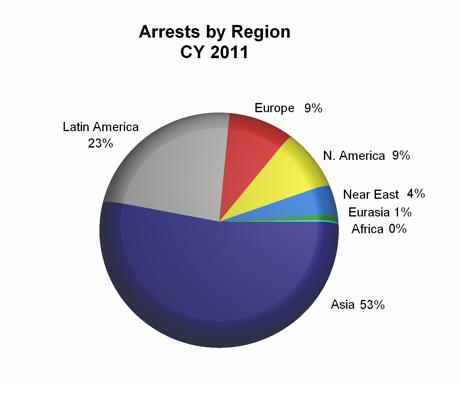
100 100
Corruption, Political Instability and Firm-Level Export Decisions. Kul Kapri 1 Rowan University. August 2018
 Corruption, Political Instability and Firm-Level Export Decisions Kul Kapri 1 Rowan University August 2018 Abstract In this paper I use South Asian firm-level data to examine whether the impact of corruption
The evolution of the EU anticorruption
 DEVELOPING AN EU COMPETENCE IN MEASURING CORRUPTION Policy Brief No. 27, November 2010 The evolution of the EU anticorruption agenda The problem of corruption has been occupying the minds of policy makers,
Corruption and business procedures: an empirical investigation
 Corruption and business procedures: an empirical investigation S. Roy*, Department of Economics, High Point University, High Point, NC - 27262, USA. Email: sroy@highpoint.edu Abstract We implement OLS,
Corruption s Effect on Growth and its Transmission Channels
 KYKLOS, Vol. 57 2004 Fasc. 3, 429 456 Corruption s Effect on Growth and its Transmission Channels Lorenzo Pellegrini and Reyer Gerlagh* I. INTRODUCTION It is a common finding in the literature that corruption
Governance, Corruption, and Public Finance: An Overview
 Chapter 1 Governance, Corruption, and Public Finance: An Overview Vito Tanzi Introduction Growing attention has been directed in recent years to the role of government. Governance in general and corruption
Unit 4: Corruption through Data
 Unit 4: Corruption through Data Learning Objectives How do we Measure Corruption? After studying this unit, you should be able to: Understand why and how data on corruption help in good governance efforts;
Measuring the Shadow Economy of Bangladesh, India, Pakistan, and Sri Lanka ( )
") Measuring the Shadow Economy of Bangladesh, India, Pakistan, and Sri Lanka (1995-2014) M. Kabir Hassan Blake Rayfield Makeen Huda Corresponding Author M. Kabir Hassan, Ph.D. 2016 IDB Laureate in Islamic
Measuring the Shadow Economy of Bangladesh, India, Pakistan, and Sri Lanka (1995-2014) M. Kabir Hassan Blake Rayfield Makeen Huda Corresponding Author M. Kabir Hassan, Ph.D. 2016 IDB Laureate in Islamic
Measuring and understanding corruption at the micro level
 Public Disclosure Authorized 28021 Public Disclosure Authorized Measuring and understanding corruption at the micro level January 2002 Public Disclosure Authorized Public Disclosure Authorized Ritva Reinikka
World Bank Corruption Surveys
 World Bank Corruption Surveys In recent years, research and analysis have provided overwhelming evidence that corruption is a regressive tax on the poor. Corruption distorts public resource allocation
Call for Research Proposals to Assess the Economic Impact of Refugees on host and/or regional economies
 Call for Research Proposals to Assess the Economic Impact of Refugees on host and/or regional economies Background: There is very limited work to date on the economic impact of refugees on host and/or
Corruption: Causes and consequences
 From the SelectedWorks of riccardo pelizzo February 23, 2015 Corruption: Causes and consequences riccardo pelizzo Available at: http://works.bepress.com/riccardo_pelizzo/74/ Corruption: causes and consequences
Corruption: Costs and Mitigation Strategies
 Corruption: Costs and Mitigation Strategies Presented by Bernardin AKITOBY Assistant Director INTERNATIONAL MONETARY FUND SEPTEMBER 2017 Motivation Corruption has been identified as one of the most important
ENHANCING DOMESTIC RESOURCES MOBILIZATION THROUGH FISCAL POLICY
 UNITED NATIONS ECONOMIC COMMISSION FOR AFRICA SUBREGIONAL OFFICE FOR EASTERN AFRICA ECA/SROEA/ICE/2009/ Original: English SROEA 13 th Meeting of the Intergovernmental Committee of Experts (ICE) Mahe, Seychelles,
The 2017 TRACE Matrix Bribery Risk Matrix
 The 2017 TRACE Matrix Bribery Risk Matrix Methodology Report Corruption is notoriously difficult to measure. Even defining it can be a challenge, beyond the standard formula of using public position for
Methodological note on the CIVICUS Civil Society Enabling Environment Index (EE Index)
") Methodological note on the CIVICUS Civil Society Enabling Environment Index (EE Index) Introduction Lorenzo Fioramonti University of Pretoria With the support of Olga Kononykhina For CIVICUS: World Alliance
Methodological note on the CIVICUS Civil Society Enabling Environment Index (EE Index) Introduction Lorenzo Fioramonti University of Pretoria With the support of Olga Kononykhina For CIVICUS: World Alliance
Corruption and Economic Growth
 Corruption and Economic Growth by Min Jung Kim 1 Abstract This study investigates the direct and indirect impact of corruption on economic growth. Recent empirical studies have examined that human capital,
Measuring and Reducing the Impact of Corruption in Infrastructure
 Public Disclosure Authorized WPS4099 Measuring and Reducing the Impact of Corruption in Infrastructure Public Disclosure Authorized Public Disclosure Authorized Charles Kenny 1 Abstract This paper examines
Measurement and Global Trends in Central Bank Autonomy (CBA)
") Measurement and Global Trends in Central Bank Autonomy (CBA) Conference Central Bank Independence: Legal and Economic Issues Sponsored by the International Monetary Fund and the Central Reserve Bank of
Measurement and Global Trends in Central Bank Autonomy (CBA) Conference Central Bank Independence: Legal and Economic Issues Sponsored by the International Monetary Fund and the Central Reserve Bank of
SHOULD THE UNITED STATES WORRY ABOUT LARGE, FAST-GROWING ECONOMIES?
 Chapter Six SHOULD THE UNITED STATES WORRY ABOUT LARGE, FAST-GROWING ECONOMIES? This report represents an initial investigation into the relationship between economic growth and military expenditures for
What about corruption s dimension? A study case for a Colombian institution: an axiomatic approach proposal. 1
 What about corruption s dimension? A study case for a Colombian institution: an axiomatic approach proposal. 1 Cristian Piñeros Rodrigo Domínguez Economics as a discipline provides a comprehensive analytical
Empirical Tools for Governance Analysis A New Learning Activity
 Empirical Tools for Governance Analysis A New Learning Activity The Challenge Practitioners and researchers have increasingly focused on the link between governance and development. Novel cross-country
Happiness and economic freedom: Are they related?
 Happiness and economic freedom: Are they related? Ilkay Yilmaz 1,a, and Mehmet Nasih Tag 2 1 Mersin University, Department of Economics, Mersin University, 33342 Mersin, Turkey 2 Mersin University, Department
The water services crisis is essentially a crisis of governance
 Water Governance: Applying Anti-Corruption in Water Capacity Building Workshop for Improving the Performance of Water Utilities in the African Region 6-8 December6, 2006 Nairobi, Kenya Dr. Håkan Tropp
Terms of Reference for a consultancy to undertake an assessment of current practices on poverty and inequalities measurement and profiles in SADC
 Terms of Reference for a consultancy to undertake an assessment of current practices on poverty and inequalities measurement and profiles in SADC 1. BACKGROUND The Southern African Development Community
Mexico: How to Tap Progress. Remarks by. Manuel Sánchez. Member of the Governing Board of the Bank of Mexico. at the. Federal Reserve Bank of Dallas
 Mexico: How to Tap Progress Remarks by Manuel Sánchez Member of the Governing Board of the Bank of Mexico at the Federal Reserve Bank of Dallas Houston, TX November 1, 2012 I feel privileged to be with
HOW ECONOMIES GROW AND DEVELOP Macroeconomics In Context (Goodwin, et al.)
") Chapter 17 HOW ECONOMIES GROW AND DEVELOP Macroeconomics In Context (Goodwin, et al.) Chapter Overview This chapter presents material on economic growth, such as the theory behind it, how it is calculated,
Chapter 17 HOW ECONOMIES GROW AND DEVELOP Macroeconomics In Context (Goodwin, et al.) Chapter Overview This chapter presents material on economic growth, such as the theory behind it, how it is calculated,
Enabling Environments for Civic Engagement in PRSP Countries
 The Participation and Civic Engagement Team works to promote poverty reduction and sustainable development by empowering the poor to set their own priorities, control resources and influence the government,
CORRUPTION AS AN OBSTACLE TO ECONOMIC GROWTH OF NATIONAL ECONOMIES
 CORRUPTION AS AN OBSTACLE TO ECONOMIC GROWTH OF NATIONAL ECONOMIES Veronika Linhartova Universy of Pardubice, Czech Republic veronika.linhartova@upce.cz Eva Zidova Universy of Pardubice, Czech Republic
Rewriting the Rules of the Market Economy to Achieve Shared Prosperity. Joseph E. Stiglitz New York June 2016
 Rewriting the Rules of the Market Economy to Achieve Shared Prosperity Joseph E. Stiglitz New York June 2016 Enormous growth in inequality Especially in US, and countries that have followed US model Multiple
Economic and Social Council
 United Nations E/CN.3/2014/20 Economic and Social Council Distr.: General 11 December 2013 Original: English Statistical Commission Forty-fifth session 4-7 March 2014 Item 4 (e) of the provisional agenda*
GENDER EQUALITY IN THE LABOUR MARKET AND FOREIGN DIRECT INVESTMENT
 THE STUDENT ECONOMIC REVIEWVOL. XXIX GENDER EQUALITY IN THE LABOUR MARKET AND FOREIGN DIRECT INVESTMENT CIÁN MC LEOD Senior Sophister With Southeast Asia attracting more foreign direct investment than
The Effect of Foreign Aid on the Economic Growth of Bangladesh
 Journal of Economics and Development Studies June 2014, Vol. 2, No. 2, pp. 93-105 ISSN: 2334-2382 (Print), 2334-2390 (Online) Copyright The Author(s). 2014. All Rights Reserved. Published by American Research
Analysis of the Sources and Uses of Remittance by Rural Households for Agricultural Purposes in Enugu State, Nigeria
 IOSR Journal of Agriculture and Veterinary Science (IOSR-JAVS) e-issn: 2319-2380, p-issn: 2319-2372. Volume 9, Issue 2 Ver. I (Feb. 2016), PP 84-88 www.iosrjournals.org Analysis of the Sources and Uses
Labour Market Reform, Rural Migration and Income Inequality in China -- A Dynamic General Equilibrium Analysis
 Labour Market Reform, Rural Migration and Income Inequality in China -- A Dynamic General Equilibrium Analysis Yinhua Mai And Xiujian Peng Centre of Policy Studies Monash University Australia April 2011
Conference of the States Parties to the United Nations Convention against Corruption
 United Nations Conference of the States Parties to the United Nations Convention against Corruption Distr.: General 8 October 2010 Original: English Open-ended Intergovernmental Working Group on the Prevention
Trends in inequality worldwide (Gini coefficients)
") Section 2 Impact of trade on income inequality As described above, it has been theoretically and empirically proved that the progress of globalization as represented by trade brings benefits in the form
Section 2 Impact of trade on income inequality As described above, it has been theoretically and empirically proved that the progress of globalization as represented by trade brings benefits in the form
2017 SADC People s Summit Regional Debates and Public Speaking Gala. Strengthening Youth Participation in Policy Dialogue Processes
 2017 SADC People s Summit Regional Debates and Public Speaking Gala Strengthening Youth Participation in Policy Dialogue Processes Constitutional Hill, Johannesburg South Africa 16 18 August 2017 Introduction
Remittances and the Macroeconomic Impact of the Global Economic Crisis in the Kyrgyz Republic and Tajikistan
 Public Disclosure Authorized Public Disclosure Authorized Public Disclosure Authorized Public Disclosure Authorized China and Eurasia Forum Quarterly, Volume 8, No. 4 (2010), pp. 3-9 Central Asia-Caucasus
The Effect of Foreign Direct Investment, Foreign Aid and International Remittance on Economic Growth in South Asian Countries
 St. Cloud State University therepository at St. Cloud State Culminating Projects in Economics Department of Economics 12-2016 The Effect of Foreign Direct Investment, Foreign Aid and International Remittance
Corruption and Agricultural Trade. Trina Biswas
 Corruption and Agricultural Trade Trina Biswas Selected Paper prepared for presentation at the International Agricultural Trade Research Consortium s (IATRC s) 2015 Annual Meeting: Trade and Societal Well-Being,
Executive summary 2013:2
 Executive summary Why study corruption in Sweden? The fact that Sweden does well in international corruption surveys cannot be taken to imply that corruption does not exist or that corruption is not a
Conference on What Africa Can Do Now To Accelerate Youth Employment. Organized by
 Conference on What Africa Can Do Now To Accelerate Youth Employment Organized by The Olusegun Obasanjo Foundation (OOF) and The African Union Commission (AUC) (Addis Ababa, 29 January 2014) Presentation
and with support from BRIEFING NOTE 1
 and with support from BRIEFING NOTE 1 Inequality and growth: the contrasting stories of Brazil and India Concern with inequality used to be confined to the political left, but today it has spread to a
The abuse of entrusted power by public officials in their
 CIDOB Barcelona Centre for International Affairs 51 MARCH 2012 ISSN: 2013-4428 notes internacionals CIDOB CRACKING THE MYTH OF PETTY BRIBERY Eduardo Bohórquez, Transparency International, Mexico Deniz
The interaction effect of economic freedom and democracy on corruption: A panel cross-country analysis
 The interaction effect of economic freedom and democracy on corruption: A panel cross-country analysis Author Saha, Shrabani, Gounder, Rukmani, Su, Jen-Je Published 2009 Journal Title Economics Letters
Does Corruption Effects on Social Sector in SAARC Region?
 53 J. Asian Dev. Stud, Vol. 2, Issue 2, (June 2013) ISSN 2304-375X Does Corruption Effects on Social Sector in SAARC Region? Hina Kiran 1, Saeeda Rehman 2, M. Naveed Iftikhar 3 and Rabia Mir 4 Abstract
The Political Challenges of Economic Reforms in Latin America. Overview of the Political Status of Market-Oriented Reform
 The Political Challenges of Economic Reforms in Latin America Overview of the Political Status of Market-Oriented Reform Political support for market-oriented economic reforms in Latin America has been,
ECONOMIC GROWTH* Chapt er. Key Concepts
 Chapt er 6 ECONOMIC GROWTH* Key Concepts The Basics of Economic Growth Economic growth is the expansion of production possibilities. The growth rate is the annual percentage change of a variable. The growth
Informal Trade in Africa
 I. Introduction Informal trade or unrecorded trade is broadly defined as all trade activities between any two countries which are not included in the national income according to national income conventions
Differences Lead to Differences: Diversity and Income Inequality Across Countries
 Illinois State University ISU ReD: Research and edata Master's Theses - Economics Economics 6-2008 Differences Lead to Differences: Diversity and Income Inequality Across Countries Michael Hotard Illinois
Yet the World Bank Enterprise Surveys suggest that there is much room for improvement in service quality and accountability
 51 How transparent is business regulation around the world? Nobel Prize winning economist Amartya Sen wrote in 2009 that lack of transparency in the global financial system was among the main factors contributing
Determinants of Violent Crime in the U.S: Evidence from State Level Data
 12 Journal Student Research Determinants of Violent Crime in the U.S: Evidence from State Level Data Grace Piggott Sophomore, Applied Social Science: Concentration Economics ABSTRACT This study examines
Workers Remittances. and International Risk-Sharing
 Workers Remittances and International Risk-Sharing Metodij Hadzi-Vaskov March 6, 2007 Abstract One of the most important potential benefits from the process of international financial integration is the
The spectre of corruption
 The spectre of corruption Every year the Nedbank & Old Mutual Budget Speech Competition invites economics students to submit essays on urgent topical issues. The winners are announced on the evening of
Will Inequality Affect Growth? Evidence from USA and China since 1980
 http://rwe.sciedupress.com Research in World Economy Vol. 8, No. 2; 217 Will Inequality Affect Growth? Evidence from and China since 198 Yongqing Wang 1 1 Department of Business and Economics, University
Macroeconomics and Gender Inequality Yana van der Meulen Rodgers Rutgers University
 Macroeconomics and Gender Inequality Yana van der Meulen Rodgers Rutgers University International Association for Feminist Economics Pre-Conference July 15, 2015 Organization of Presentation Introductory
Online Appendices for Moving to Opportunity
 Online Appendices for Moving to Opportunity Chapter 2 A. Labor mobility costs Table 1: Domestic labor mobility costs with standard errors: 10 sectors Lao PDR Indonesia Vietnam Philippines Agriculture,
DEFINING AND MEASURING CORRUPTION AND ITS IMPACT
 DEFINING AND MEASURING CORRUPTION AND ITS IMPACT MANUEL BALÁN ASSISTANT PROFESSOR POLITICAL SCIENCE AND INTERNATIONAL DEVELOPMENT MCGILL UNIVERSITY MANUEL.BALAN@MCGILL.CA September 29, 2017 Objectives
Pakistan s Economy: Opportunities and Challenges I have been asked to speak today on the subject of Opportunities and Challenges for Pakistan s
 Pakistan s Economy: Opportunities and Challenges I have been asked to speak today on the subject of Opportunities and Challenges for Pakistan s Economy. I have a very simple take on this. The current economic
Do Migrants Improve Governance at Home? Evidence from a Voting Experiment
 Do Migrants Improve Governance at Home? Evidence from a Voting Experiment Catia Batista Trinity College Dublin and IZA Pedro C. Vicente Trinity College Dublin, CSAE-Oxford and BREAD Second International
Synthesis of the Regional Review of Youth Policies in 5 Arab countries
 Synthesis of the Regional Review of Youth Policies in 5 Arab countries 1 The Regional review of youth policies and strategies in the Arab region offers an interesting radioscopy of national policies on
What is corruption? Corruption is the abuse of power for private gain (TI).
.") Outline presentation What is corruption? Corruption in the water sector Costs and impacts of corruption Corruption and human rights Drivers and incentives of corruption What is corruption? Corruption is
Outline presentation What is corruption? Corruption in the water sector Costs and impacts of corruption Corruption and human rights Drivers and incentives of corruption What is corruption? Corruption is
Social Dimension S o ci al D im en si o n 141
 Social Dimension Social Dimension 141 142 5 th Pillar: Social Justice Fifth Pillar: Social Justice Overview of Current Situation In the framework of the Sustainable Development Strategy: Egypt 2030, social
The business case for gender equality: Key findings from evidence for action paper
 The business case for gender equality: Key findings from evidence for action paper Paris 18th June 2010 This research finds critical evidence linking improving gender equality to many key factors for economic
Ghana Lower-middle income Sub-Saharan Africa (developing only) Source: World Development Indicators (WDI) database.
 Source: World Development Indicators (WDI) database.") Knowledge for Development Ghana in Brief October 215 Poverty and Equity Global Practice Overview Poverty Reduction in Ghana Progress and Challenges A tale of success Ghana has posted a strong growth performance
Knowledge for Development Ghana in Brief October 215 Poverty and Equity Global Practice Overview Poverty Reduction in Ghana Progress and Challenges A tale of success Ghana has posted a strong growth performance
Forms of Civic Engagement and Corruption
 Forms of Civic Engagement and Corruption Disentangling the role of associations, elite-challenging mass activities and the type of trust within networks Nicolas Griesshaber, Berlin Graduate School of Social
The Impact of Interprovincial Migration on Aggregate Output and Labour Productivity in Canada,
 The Impact of Interprovincial Migration on Aggregate Output and Labour Productivity in Canada, 1987-26 Andrew Sharpe, Jean-Francois Arsenault, and Daniel Ershov 1 Centre for the Study of Living Standards
Impact of Human Rights Abuses on Economic Outlook
 Digital Commons @ George Fox University Student Scholarship - School of Business School of Business 1-1-2016 Impact of Human Rights Abuses on Economic Outlook Benjamin Antony George Fox University, bantony13@georgefox.edu
BELARUS ETF COUNTRY PLAN Socioeconomic background
 BELARUS ETF COUNTRY PLAN 2007 1. Socioeconomic background Belarus is a lower middle-income country with a per capita GDP of 2,760 USD in 2005 (Atlas method GNI). The economy is highly industrialized, and
Table 1-1. Transparency International Corruption Perceptions Index 2005 and Corruption Perceptions Global Corruption Barometer 2004: Correlations
 Table 1-1 Transparency International Corruption Perceptions Index 2005 and Corruption Perceptions Global Corruption Barometer 2004: Correlations Global Corruption Barometer Variables TI Corruption Perceptions
THE BUSINESS CLIMATE INDEX SURVEY 2008
 THE BUSINESS CLIMATE INDEX SURVEY 2008 Prepared by: The Steadman Group, Riverside Drive, P.O. Box 68230 00200 Nairobi, Tel: 44450190-6, October, 2008 1 Summary of Main Findings 1. Introduction In meeting
Research Report. How Does Trade Liberalization Affect Racial and Gender Identity in Employment? Evidence from PostApartheid South Africa
 International Affairs Program Research Report How Does Trade Liberalization Affect Racial and Gender Identity in Employment? Evidence from PostApartheid South Africa Report Prepared by Bilge Erten Assistant
The impact of political instability on economic growth (Case of Albania)
") The impact of political instability on economic growth (Case of Albania) Abstract 99 PhD (C.) Gerta Xhaferi (Gorjani) MSc Ilija Ilija The aim of this study is to define the impact of political instability
The impact of political instability on economic growth (Case of Albania) Abstract 99 PhD (C.) Gerta Xhaferi (Gorjani) MSc Ilija Ilija The aim of this study is to define the impact of political instability
The Correlates of Wealth Disparity Between the Global North & the Global South. Noelle Enguidanos
 The Correlates of Wealth Disparity Between the Global North & the Global South Noelle Enguidanos RESEARCH QUESTION/PURPOSE STATEMENT: What explains the economic disparity between the global North and the
Executive Board of the United Nations Development Programme and of the United Nations Population Fund
 UNITED NATIONS DP Executive Board of the United Nations Development Programme and of the United Nations Population Fund Distr. GENERAL DP/CCF/ZIM/2 22 February 2000 ORIGINAL: ENGLISH Second regular session
European International Virtual Congress of Researchers. EIVCR May 2015
 European International Virtual Congress of Researchers P a g e 18 European International Virtual Congress of Researchers EIVCR May 2015 Progressive Academic Publishing, UK www.idpublications.org European
CHAPTER 12: The Problem of Global Inequality
 1. Self-interest is an important motive for countries who express concern that poverty may be linked to a rise in a. religious activity. b. environmental deterioration. c. terrorist events. d. capitalist
Informality effects in the economy of Albania in light of world s economic crisis
 (Volume3, Issue 1/ 2012 ), pp. 139 Informality effects in the economy of Albania in light of world s economic crisis Brunilda Muça, 1+ and Galantina Doraci 2++ 1, 2 Faculty of and Agribusiness, University
Immigration and Internal Mobility in Canada Appendices A and B. Appendix A: Two-step Instrumentation strategy: Procedure and detailed results
 Immigration and Internal Mobility in Canada Appendices A and B by Michel Beine and Serge Coulombe This version: February 2016 Appendix A: Two-step Instrumentation strategy: Procedure and detailed results
Measuring Corruption: Myths and Realities
 Measuring Corruption: Myths and Realities Daniel Kaufmann, Aart Kraay, and Massimo Mastruzzi, TheWorld Bank Draft, May 1 st, 2006 There is renewed interest in the World Bank, and among aid donors and aid
Corruption and Growth: Exploring the Investment Channel
 University of Massachusetts Amherst ScholarWorks@UMass Amherst Economics Department Working Paper Series Economics 2008 Corruption and Growth: Exploring the Investment Channel Mina Baliamoune-Lutz University
Key Issues in Recording Remittances in the Balance of Payments Statistics and Recent Improvements in Concepts and Definitions
 International Technical Meeting on Remittances Statistics Key Issues in Recording Remittances in the Balance of Payments Statistics and Recent Improvements in Concepts and Definitions The World Bank Washington,
Response to the Evaluation Panel s Critique of Poverty Mapping
 Response to the Evaluation Panel s Critique of Poverty Mapping Peter Lanjouw and Martin Ravallion 1 World Bank, October 2006 The Evaluation of World Bank Research (hereafter the Report) focuses some of
Summary of the Results of the 2015 Integrity Survey of the State Audit Office of Hungary
 Summary of the Results of the 2015 Integrity Survey of the State Audit Office of Hungary Table of contents Foreword... 3 1. Objectives and Methodology of the Integrity Surveys of the State Audit Office
DECENT WORK IN TANZANIA
 International Labour Office DECENT WORK IN TANZANIA What do the Decent Work Indicators tell us? INTRODUCTION Work is central to people's lives, and yet many people work in conditions that are below internationally
INTERNATIONAL WORKING GROUP ON IMPROVING DATA ON REMITTANCES
 TSG/3 UNITED NATIONS DEPARTMENT OF ECONOMIC AND SOCIAL AFFAIRS STATISTICS DIVISION Meeting of the United Nations Technical Subgroup on Movement of Persons Mode 4 New York, 22 (afternoon) -24 (morning)
THE GLOBAL ECONOMIC CRISIS DEVELOPING ECONOMIES AND THE ROLE OF MULTILATERAL DEVELOPMENT BANKS
 THE GLOBAL ECONOMIC CRISIS DEVELOPING ECONOMIES AND THE ROLE OF MULTILATERAL DEVELOPMENT BANKS ADDRESS by PROFESSOR COMPTON BOURNE, PH.D, O.E. PRESIDENT CARIBBEAN DEVELOPMENT BANK TO THE INTERNATIONAL
The Impact of Foreign Workers on the Labour Market of Cyprus
 Cyprus Economic Policy Review, Vol. 1, No. 2, pp. 37-49 (2007) 1450-4561 The Impact of Foreign Workers on the Labour Market of Cyprus Louis N. Christofides, Sofronis Clerides, Costas Hadjiyiannis and Michel
Using the Index of Economic Freedom
 Using the Index of Economic Freedom A Practical Guide for Citizens and Leaders The Center for International Trade and Economics at The Heritage Foundation Ryan Olson For two decades, the Index of Economic
Corruption and quality of public institutions: evidence from Generalized Method of Moment
 Document de travail de la série Etudes et Documents E 2008.13 Corruption and quality of public institutions: evidence from Generalized Method of Moment Gbewopo Attila 1 University Clermont I, CERDI-CNRS
The GLOBAL ECONOMY: Contemporary Debates
 The GLOBAL ECONOMY: Contemporary Debates 2005 Thomas Oatley 0-321-24377-3 ISBN Visit www.ablongman.com/replocator to contact your local Allyn & Bacon/Longman representative. sample chapter The pages of
Corruption and economic growth, with a focus on Vietnam
 MPRA Munich Personal RePEc Archive Corruption and economic growth, with a focus on Vietnam Ngoc Anh Nguyen and Ngoc-Minh Nguyen and Binh Tran-Nam Development and Policies Research Center (DEPOCEN), Hanoi,
Globalization and its Impact on Poverty in Pakistan. Sohail J. Malik Ph.D. Islamabad May 10, 2006
 Globalization and its Impact on Poverty in Pakistan Sohail J. Malik Ph.D. Islamabad May 10, 2006 The globalization phenomenon Globalization is multidimensional and impacts all aspects of life economic
ANALYSIS OF THE EFFECT OF REMITTANCES ON ECONOMIC GROWTH USING PATH ANALYSIS ABSTRACT
 ANALYSIS OF THE EFFECT OF REMITTANCES ON ECONOMIC GROWTH USING PATH ANALYSIS Violeta Diaz University of Texas-Pan American 20 W. University Dr. Edinburg, TX 78539, USA. vdiazzz@utpa.edu Tel: +-956-38-3383.
Labor Market Dropouts and Trends in the Wages of Black and White Men
 Industrial & Labor Relations Review Volume 56 Number 4 Article 5 2003 Labor Market Dropouts and Trends in the Wages of Black and White Men Chinhui Juhn University of Houston Recommended Citation Juhn,
IMPLEMENTATION OF THE BUENOS AIRES PLAN OF ACTION: ADOPTION OF THE DECISIONS GIVING EFFECT TO THE BONN AGREEMENTS
 UNITED NATIONS Distr. LIMITED FCCC/CP/2001/L.28 9 November 2001 Original: ENGLISH CONFERENCE OF THE PARTIES Seventh session Marrakesh, 29 October - 9 November 2001 Agenda item 3 (b) (i) IMPLEMENTATION
Understanding the Governance Context Analytical Tools and their Utilization. December 10 Francesca Recanatini, WBI
 Understanding the Governance Context Analytical Tools and their Utilization December 10 Francesca Recanatini, WBI www.worldbank.org/wbi/governance Outline of the Session Introducing a working framework
TRANSPARENCY INTERNATIONAL BOSNIA AND HERZEGOVINA CRINIS STUDY. Study of the Transparency of Political Party Financing in BiH
 TRANSPARENCY INTERNATIONAL BOSNIA AND HERZEGOVINA 2010 CRINIS STUDY Study of the Transparency of Political Party Financing in BiH CRINIS STUDY Study of the Transparency of Political Party Financing in
and any occurrences of waste, fraud, or abuse as instances. A product may have one or more instances of waste, fraud, or abuse, or none at all.
 July 17, 2018 The Honorable Walter B. Jones U.S. House of Representatives The Honorable Tim Walberg U.S. House of Representatives The Honorable Peter Welch U.S. House of Representatives Thank you for your
PRE-CONFERENCE MEETING Women in Local Authorities Leadership Positions: Approaches to Democracy, Participation, Local Development and Peace
 PRE-CONFERENCE MEETING Women in Local Authorities Leadership Positions: Approaches to Democracy, Participation, Local Development and Peace Presentation by Carolyn Hannan, Director Division for the Advancement