2008 Blue Hen Poll Public Release
|
|
|
- Julia French
- 5 years ago
- Views:
Transcription
1
2 2008 Blue Hen Poll Public Release Welcome!! Administrators Faculty Staff Students Media Community
3 Acknowledgments Center for Teaching Effectiveness Instructional Grants (Martha Carothers & Gabriele Bauer) Office of the Vice Provost for Academic Affairs & International Programs Vice Provost Havidan Rodriguez College of Arts and Sciences (Social Sciences & History) Dean Tom Apple Associate Dean Debra Norris Department of Political Science and International Relations Gretchen Bauer, Chair
4 Acknowledgments Research and Data Management Services (RDMS) Dick Sacher The Office of Institutional Research and Planning Michael F. Middaugh Dale W. Trusheim Heather A. Kelly Ashley John Pigford, Assistant Professor, Art Department Lindsay Hoffman, Assistant Professor, Communications Department Students who participated in the Poll
5 What is the Blue Hen POLL? Public opinion survey run by students Scientific sample of full-time undergraduates at UD Newark campus Designed to promote research and scholarship, inform the public, and enhance democratic ideals
6 Major Topics Opinions toward UD Student faculty relationships Student social and academic experiences Sources of political information Political candidates and issues Political involvement Attitudes towards social and political groups Morality and Religiosity Socialization
7 Methodology Simple random sample of 1,500 students Web based (Qualtrics) Data collected 3/13 4/11 (avg. time mins.) Final n=643, response rate of 43% Margin of Error = 4% (95% confidence in results)

8 Opinions Related to the University of Delaware
9 What affects satisfaction? Good value A Confidence UD will help reach career goals B How much attention UD pays to students like me C+ Satisfaction with major Satisfaction with friends A A
10 Student Satisfaction Students are satisfied with UD (90%) and very likely to recommend the university (87%) to friends and family Highs and lows Most Satisfied with: Most Dissatisfied with: Friends (88%) Student health services program (26%) Major (85%) Quality of fitness facilities (30%) 83% say UD is a good value for what you pay. 62% have high confidence UD will help reach career goals
11 Supply and Demand for Professional Development SUPPLY Indicate how often faculty or professors at the University of Delaware have provided you with. DEMAND Indicate how often you have sought from a faculty member. 8% A letter of recommendation An opportunity to publish research or written work -7% 4% An opportunity to apply classroom learning to real-life issues An opportunity to discuss coursework outside of class -7% Encouragement to pursue graduate study -10% Emotional support and encouragement An opportunity to work on a research project -16% -17% -20% -15% -10% -5% 0% 5% 10% 15% 20% Difference in % saying occasionally or frequently
12 Opportunities for Students Discussing Work Outside Class Encourage Graduate Study Publishing Written Work Satisfaction w/major w/u of DE Emotional Support & Encouragement Collaborate on Research Project


13 Political Opinions and Behavior of UD Students
14 Political Interest More interested than not 31% Very much interested & 44% Somewhat interested 25% Not much or Not at all interested More interested students seek out more information More interested students exhibit more political behaviors
15 Political Behavior (last 12 months) Intend to vote in presidential election 92% Registered to vote 76% Been able to devote any time to volunteer work Tried to change someones opinion about parties or candidates 47% 53% Worked with other people 29% Attended a meeting about an issue Political meetings, rallies, speeches, or dinners in support of a particular candidate Contacted government official 17% 13% 24% Buttons, stickers, or signs 11% Protest, march, or demonstrate 9%
16 Political Candidates Love or Hate relationship for Clinton Obama is everyone s second favorite McCain has no chance of winning UD students UD students have other candidates in mind
17 Presidential Candidates 100% 95% 90% 80% New York Senator, Hillary Clinton 70% 60% 66% 53% Arizona Senator, John McCain 50% 40% 30% 34% 29% 24% 29% 34% Illinois Senator, Barack Obama 20% 10% % 14% 1% 5% 19% Other First Second Overall
18 Policy Priorities ( very important ) Combating world hunger 41% Preventing the spread of nuclear weapons 39% Protecting the jobs of American workers 38% Promoting and defending human rights in other countries 38% Combating international terrorism 36% Strengthening the United Nations (and other international organizations) 30% Controlling and reducing illegal immigration 22% Helping to bring a democratic form of government to other nations 14%
19 Political Party and Politics More students are Democrat (53%) than Republican (22%) Party Identification does not influence political involvement Party Identification matters on issue approval
20 Party Identification and Moral Issues Issue Democrat Republican Difference Abortion 61% 31% 30% Divorce 76% 48% 28% Pre-Marital Sex 88% 71% 17% Stem Cell Research 78% 49% 29%


21 Student Experiences and Involvement
 stress levels Does not differ across classification Stress")
22 Stress Stressed Undergrads! Measured on a 5 point scale 40% have above average (3 to 5) stress levels Does not differ across classification Stress Factors Studying Working University Satisfaction On-Campus Housing Satisfaction Stress and Drinking
23 Group Membership 2/3 of UD students are involved in at least one campus group 275 groups on campus Religious-affiliated groups Professional and academic societies Political and service clubs Sororities and fraternities Sports and intramural groups Investment in campus groups leads to healthy returns for UD
24 Advantages of Student Group Membership Our data shows that students in groups Are more active in community and politics Volunteer more often Have broader social networks On average, spend more hours studying per week Are more satisfied with UD and more likely to recommend it to others


25 Advantages of Supporting Groups at UD
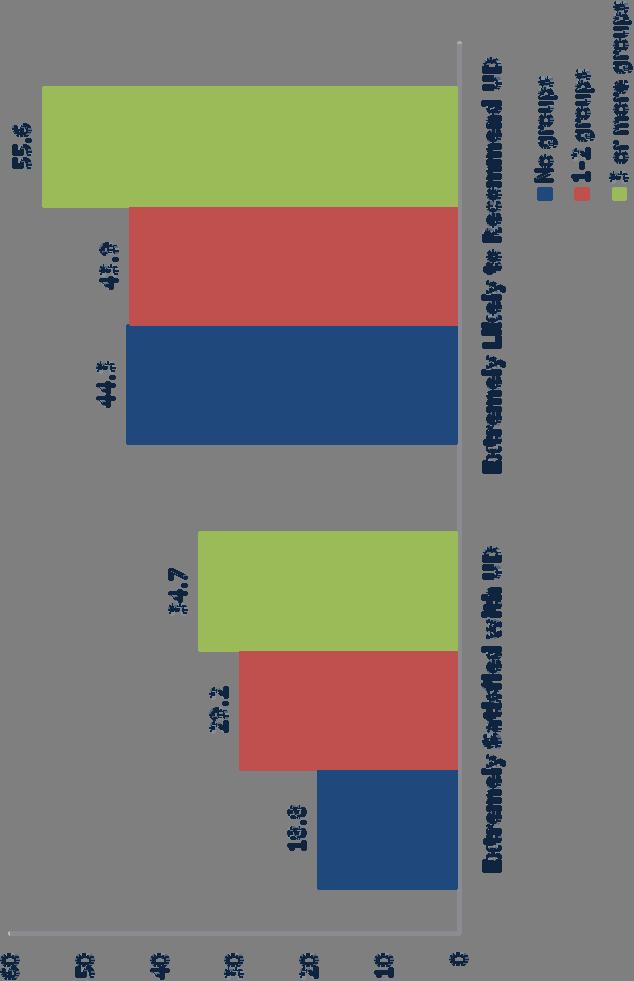
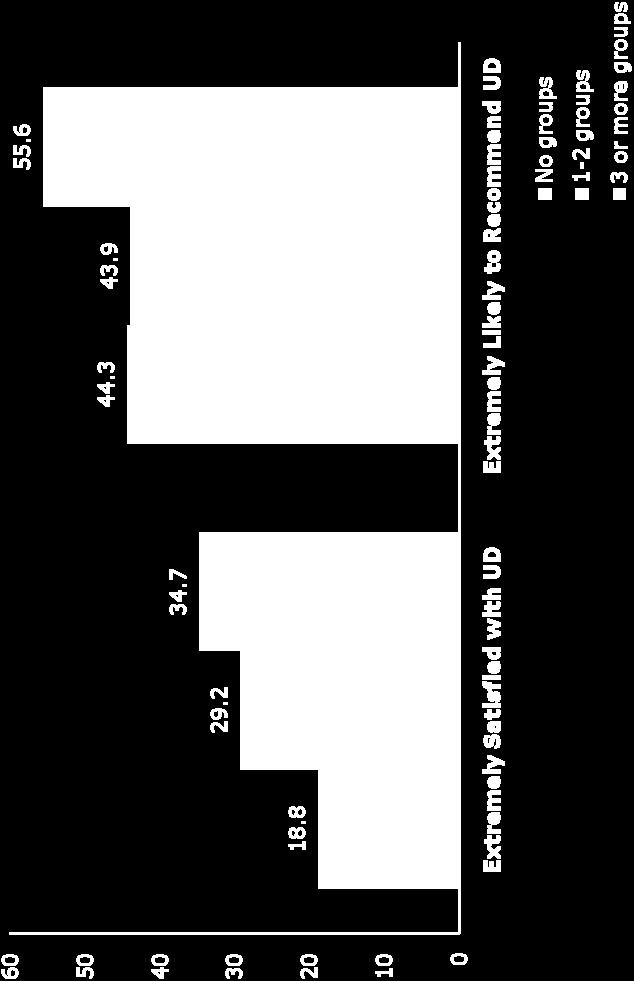
26 Advantages of Supporting Groups at UD


27 Group Relations
28 Attitudes Toward Social and Political Groups Positive Moderate Negative Religious fundamentalists Illegal Immigrants Conservatives Republicans Muslims Hispanics/Latinos Gays/Lesbians/Bisexuals Liberals African Americans/Blacks Democrats Asian Americans Whites/Caucasians 0% 20% 40% 60% 80% 100%
29 Volunteerism and Attitudes Positive Attitudes Towards Groups Based on Volunteerism In The Last 12 Months Democrats Asian Americans Liberals Gay/Lesbian Volunteered Did Not Volunteer African Americans Hispanics/Latinos Muslims Republicans
30 Sex and Attitudes Positive Attitudes Towards Groups Based on Sex Gay/Lesbian Democrats Asian Americans Liberals Female Male Hispanics/Latinos African Americans Muslims
31 Gay Marriage 7% 7% Support Gay Marrigae 86% Support Civil Unions Support Neither
32 Interracial Interaction on Campus 50% 45% 40% 35% 30% Since the beginning of last fall have you socialized with someone of another racial/ethnic group 46% 25% 20% 21% 15% 10% 5% 2% 7% 4% 9% 12% 0% Never Seldom About once a month Almost every week At least once per week More than once per week Almost daily
33 Interracial Interaction and Satisfaction w/ud Satisfied Dissatisfied 50% 45% 40% 35% 30% 47% 40% 25% 20% 15% 10% 5% 0% 1% 9% 7% 12% 5% 0% Never Seldom About once a month 8% 15% Almost every week 13% 9% At least once per week 21% 16% More than once per week Almost daily


34 Morality and Religiosity
35 Morality: Right and Wrong Acceptible Wrong Can't Decide Married men and women having affairs Cloning humans Medical testing on animals Doctor-assisted suicide The death penalty Cloning animals Abortion Divorce Medical research using stem cells obtained from human embryos Sex between an unmarried man and woman 0% 20% 40% 60% 80% 100%
36 Morals Morals in the country 18% good or excellent / 50% fair / 32% poor 55% believe they are getting worse. Moral stances among those saying getting worse : Sex between unmarried people (73%) Cloning Animals (63%) Cloning Humans (58%) Abortion (57%)

37 Religiosity on Campus Low Religiosity at UD 16% are members of a religion affiliated group. 65% seldom or never attend religious services 74% since school began last fall
38 Can Morals Predict Religiosity? Cloning Humans Death Penalty Cloning Animals Divorce Doctor Assisted S uicide Abortion Seldom or Never At Least Once A Month Medical Research Using Stem Cells from Human Embryos Sex Between an Unmarried Man and Woman
39 Summary.on average Students are satisfied with UD Students have man opportunities for professional development through faculty interaction Students are engaged in a variety of political behaviors Group membership is important UD is a tolerant campus There are concerns about morality Have lower religiosity
40 Guest Commentary Eric Nielsen Senior Director, Media Strategies, Gallup

41 Questions and Answers


42
University of Iowa Hawkeye Poll Topline Results Oct. 31, 2012 October 2012 poll of Iowa respondents
 University of Iowa Hawkeye Poll Topline Results Oct. 31, 2012 October 2012 poll of Iowa respondents Sample: 320 participants in Iowa, margin of error for full sample is plus or minus 5.6 percent. The October
Muhlenberg College/Morning Call. Pennsylvania 15 th Congressional District Registered Voter Survey
 KEY FINDINGS: Muhlenberg College/Morning Call Pennsylvania 15 th Congressional District Registered Voter Survey January/February 2018 1. As the 2018 Midterm elections approach Pennsylvania s 15 th Congressional
Loras College Statewide Wisconsin Survey October/November 2016
 Loras College Statewide Wisconsin Survey October/November 0 Field Dates: October November, 0 Completed Surveys: 00 Margin of Error: +/.% Note on Methodology: The Loras College Poll surveyed 00 Wisconsin
HART/McINTURFF Study # page 1. Interviews: 1,000 Registered voters, including 200 reached by cell phone Date: October 14-18, 2010
 HART/McINTURFF Study #101407--page 1 Interviews: 1,000 Registered voters, including 200 reached by cell phone Date: October 14-18, 2010 Study #101407 48 Male 52 Female Please note: all results are shown
THE VANISHING CENTER OF AMERICAN DEMOCRACY APPENDIX
 APPENDIX Survey Questionnaire with Percentage Distributions of Response All numbers are weighted percentage of response. Figures do not always add up to 100 percent due to rounding. 1. When the government
Hillary Clinton Leading the Democratic Race in California
 California Democratic Candidates Statewide Survey Date: February 15, 2007 Sample size 865 +/- 3.3 percent sampling error February 9 13, 2007 Contact: Raul Furlong 619-579-8244 www.datamar.com Hillary Clinton
Self-Questionnaire on Political Opinions and Activities
 Self-Questionnaire on Political Opinions and Activities 1. Which best describes your year in college? Freshman Sophomore Junior Senior Other Not in college 2. What is your major? Government, Politics,
HART/McINTURFF Study # page 1. Interviews: 1000 Registered Voters, including 300 cell phone only respondents Date: October 17-20, 2012
 HART/McINTURFF Study #121864-- page 1 Interviews: 1000 Registered Voters, including 300 cell phone only respondents Date: October 17-20, 2012 Study #121864 48 Male 52 Female Please note: all results are
September 2017 Toplines
 The first of its kind bi-monthly survey of racially and ethnically diverse young adults Field Period: 08/31-09/16/2017 Total N: 1,816 adults Age Range: 18-34 NOTE: All results indicate percentages unless
Missouri Dem Primary Exit Poll
 Estimates not for on-air use Page 1 of 9 Number of Interviews - 1,026 Vote Estimate Not for On-Air 100 48 2 49 0 Use Are you: (n=1,020) Male 44 47 2 49 1 Female 56 48 2 49 0 Sex by race (n=992) White men
Views on Social Issues and Their Potential Impact on the Presidential Election
 Views on Social Issues and Their Potential Impact on the Presidential Election Opinions on Eight Issues Vary, Could Influence the Way U.S. Adults Vote in 2008 ROCHESTER, N.Y.--(BUSINESS WIRE)--U.S. adults
FOR RELEASE: WEDNESDAY, NOVEMBER 1 AT 4 PM
 P O L L Interviews with 1,014 adult Americans conducted by telephone by Opinion Research Corporation on October 27-29, 2006. The margin of sampling error for results based on the total sample is plus or
Exit Polls 2000 Election
 Exit Polls 2000 Election Demographic Category Percent of Gore Bush Buchanan Nader Total for Category Gender Male 48 42 53 0 3 Female 52 54 43 0 2 Race by Sex White Males 48 36 60 0 3 White Females 52 48
AMERICAN MUSLIM VOTERS AND THE 2012 ELECTION A Demographic Profile and Survey of Attitudes
 AMERICAN MUSLIM VOTERS AND THE 2012 ELECTION A Demographic Profile and Survey of Attitudes Released: October 24, 2012 Conducted by Genesis Research Associates www.genesisresearch.net Commissioned by Council
Analysis: Impact of Personal Characteristics on Candidate Support
 1 of 15 > Corporate Home > Global Offices > Careers SOURCE: Gallup Poll News Service CONTACT INFORMATION: Media Relations 1-202-715-3030 Subscriber Relations 1-888-274-5447 Gallup World Headquarters 901
Democracy Corps Frequency Questionnaire
 Democracy Corps Frequency Questionnaire April 22-26, 2009 1000 2008 Voters (1000 Unweighted) 851 Likely 2010 Voters (867 Unweighted) Q.3 First of all, are you registered to vote? Yes... 100 100 No...-
GW POLITICS POLL 2018 MIDTERM ELECTION WAVE 1
 GW POLITICS POLL 2018 MIDTERM ELECTION WAVE 1 The survey was fielded May 14 30, 2018 with a sample of registered voters. The survey was fielded by YouGov with a sample of registered voters. YouGov recruits
U.S. Catholics split between intent to vote for Kerry and Bush.
 The Center for Applied Research in the Apostolate Georgetown University Monday, April 12, 2004 U.S. Catholics split between intent to vote for Kerry and Bush. In an election year where the first Catholic
A Nation Divided: New national poll shows Americans distrust Congress, the media, Hollywood, and even other voters in the U.S.
 A Nation Divided: New national poll shows Americans distrust Congress, the media, Hollywood, and even other voters in the U.S. FOR IMMEDIATE RELEASE October 31, 2017, Newark, DE Contact: Peter Bothum,
FINAL RESULTS: National Voter Survey Total Sample Size: 2428, Margin of Error: ±2.0% Interview Dates: November 1-4, 2018
 FINAL RESULTS: National Voter Survey Total Sample Size: 2428, Margin of Error: ±2.0% Interview Dates: November 1-4, 2018 Language: English and Spanish Respondents: Likely November 2018 voters in 72 competitive
Clinton could win Texas in 2016
 FOR IMMEDIATE RELEASE January 31, 2013 INTERVIEWS: Tom Jensen 919-744-6312 IF YOU HAVE BASIC METHODOLOGICAL QUESTIONS, PLEASE E-MAIL information@publicpolicypolling.com, OR CONSULT THE FINAL PARAGRAPH
HART/McINTURFF Study # page 1. Interviews: 900 Registered Voters, including 270 cell phone only respondents Date: September 12-16, 2012
 HART/McINTURFF Study #121235 -- page 1 Interviews: 900 Registered Voters, including 270 cell phone only respondents Date: September 12-16, 2012 Study #121235 48 Male 52 Female Please note: all results
North Dakota Polling
 North Dakota Polling Executive Summary Contact: Doug Kaplan, 407-242-1870 Gravis Marketing, a nonpartisan research firm, conducted a random survey of 385 registered voters in North Dakota. The poll was
NBC News/WSJ/Marist Poll Iowa September 20, 2012 Presidential Election Questionnaire
 Screener Are you 18 years of age or older? Do you consider your permanent home address to be in Iowa? HH SELECTION LANDLINE FRAME ONLY GENDER GUESS NBC News/WSJ/Marist Poll Iowa
NEWS RELEASE. Red State Nail-biter: McCain and Obama in 47% - 47 % Dead Heat Among Hoosier Voters
 NEWS RELEASE FOR IMMEDIATE RELEASE: October 31, 2008 Contact: Michael Wolf, Associate Professor of Political Science, 260-481-6898 Andrew Downs, Assistant Professor of Political Science, 260-481-6691 Red
October 21, 2015 Media Contact: Joanna Norris, Director Department of Public Relations (904)
") October 21, 2015 Media Contact: Joanna Norris, Director Department of Public Relations (904) 620-2102 UNF Poll Reveals Hillary Clinton Holds Significant Lead in Democratic Primary Race A new University
October 21, 2015 Media Contact: Joanna Norris, Director Department of Public Relations (904) 620-2102 UNF Poll Reveals Hillary Clinton Holds Significant Lead in Democratic Primary Race A new University
Democracy Corps Frequency Questionnaire
 Democracy Corps Frequency Questionnaire February 11-14, 2012 1000 Likely Voters Q.5 First of all, are you registered to vote? Yes... 100 No...- (Refused)...- (ref:screen1) Q.6 Many people weren't able
WHITE EVANGELICALS, THE ISSUES AND THE 2008 ELECTION October 12-16, 2007
 CBS NEWS POLL For release: Thursday, October 18, 2007 6:30 PM EDT WHITE EVANGELICALS, THE ISSUES AND THE 2008 ELECTION October 12-16, 2007 Evangelicals have become important supporters of the Republican
Muhlenberg College/Morning Call 2018 Midterm Election Survey April Wave
 Muhlenberg College/Morning Call 2018 Midterm Election Survey April Wave Key Findings: 1. With about 7 months remaining before the 2018 elections Democratic candidates are in strong positions across an
Old Dominion University / Virginian Pilot Poll #3 June 2012
 Selected Poll Cross-tabulations Old Dominion University / Virginian Pilot Poll #3 June 2012 Random Digit Dial sample of landline and cell phone numbers in Virginia. Survey restricted to registered voters
Swing Voters Criticize Bush on Economy, Support Him on Iraq THREE-IN-TEN VOTERS OPEN TO PERSUASION
 NEWS RELEASE 1150 18 th Street, N.W., Suite 975 Washington, D.C. 20036 Tel (202) 293-3126 Fax (202) 293-2569 FOR IMMEDIATE RELEASE Wednesday, March 3, 2004 FOR FURTHER INFORMATION Andrew Kohut, Director
FOR RELEASE: TUESDAY, DECEMBER 19 AT 4 PM
 P O L L Interviews with 1,019 adult Americans conducted by telephone by Opinion Research Corporation on December, 2006. The margin of sampling error for results based on the total sample is plus or minus
Democracy Corps Frequency Questionnaire
 Democracy Corps Frequency Questionnaire July 21-25, 2012 700 Likely Voters Q.3 (LANDLINE SAMPLE) First of all, are you registered to vote at this address? Yes... 100 No... - (Refused)... - (ref:screen1)
SouthCarolinaElection IssuesSurvey
 SouthCarolinaElection IssuesSurvey August2007 South Carolina Election Issues Survey ort prepared by S. Kathi Brown and Gretchen Straw Data collected by Woelfel Research, Inc. Copyright by AARP, 2007 AARP
Florida Survey 2008 Presidential General Election
 Florida Survey 2008 Presidential General Election Date: October 27, 2008 Contact: Raul Furlong 619-579-8244 www.datamar.com Sample size 630 +/-3.9 percent sampling error October 25 26, 2008 San Diego A
Morris Central School Mock Primary Election Results April 19, 2016
 Student Results Participation Breakdown by Classes Morris Central School Mock Primary Election Results April 19, 2016 149 students from grades 7-12 participated in the mock election. The table and graph
Survey of Pennsylvanians on the Issue of Health Care Reform KEY FINDINGS REPORT
 The Morning Call/ Muhlenberg College Institute of Public Opinion Survey of Pennsylvanians on the Issue of Health Care Reform KEY FINDINGS REPORT Release Date November 17, 2009 KEY FINDINGS: 1. As the national
THE AP-GfK POLL. Conducted by GfK Roper Public Affairs & Media
 GfK Custom Research North America THE AP-GfK POLL Conducted by GfK Roper Public Affairs & Media Interview dates: September 5-10, 2008 Interviews: 1,217 adults; 812 likely voters Margin of error: +/- 2.8
AP AMERICAN GOVERNMENT STUDY GUIDE POLITICAL BELIEFS AND BEHAVIORS PUBLIC OPINION PUBLIC OPINION, THE SPECTRUM, & ISSUE TYPES DESCRIPTION
 PUBLIC OPINION , THE SPECTRUM, & ISSUE TYPES IDEOLOGY THE POLITICAL SPECTRUM (LIBERAL CONSERVATIVE SPECTRUM) VALENCE ISSUES WEDGE ISSUE SALIENCY What the public thinks about a particular issue or set of
Democracy Corps/Center for American Progress Frequency Questionnaire
 !!! Democracy Corps/Center for American Progress Frequency Questionnaire October 15-18, 2011 1000 Likely Voters! Q.5 First of all, are you registered to vote? Yes... 100 No...- (Refused)...- (ref:screen1)
POLL Republican National Delegate Survey. July 23 August 26, 2008 N= 854
 For paper of September 1, 2008 POLL 2008 Republican National Delegate Survey July 23 August 26, 2008 N= 854 RESPONSES LABELED GOP DEL ARE DELEGATES TO THE REPUBLICAN NATIONAL CONVENTION. RESPONSES LABELED
Democracy Corps - Youth Frequency Questionnaire
 Democracy Corps - Youth Frequency Questionnaire May 29-June 19, 2007 1017 Respondents age 18-29 606 Landline survey (510 unweighted) 92 Cell phone survey (100 unweighted) 319 Web survey (407 unweighted)
Political Culture in America
 Political Culture in America Definition distinctive and patterned way of thinking about how political and economic life should be carried out Economics are part of it because politics affect economics
UndecidedVotersinthe NovemberPresidential Election. anationalsurvey
 UndecidedVotersinthe NovemberPresidential Election anationalsurvey September2008 Undecided Voters in the November Presidential Election a national survey Report prepared by Jeffrey Love, Ph.D. Data collected
NEW JERSEY VOTERS TAKE ON 2008
 Contact: PATRICK MURRAY 732-263-5858 (office) 732-979-6769 (cell) pdmurray@monmouth.edu Released: Wednesday, 30, For more information: Monmouth University Polling Institute 400 Cedar Avenue West Long Branch,
Checking the Political Pulse of the University:
 DISCUSSED Adventist institutions, 2012 presidential election, average American Adventist, Republicans, Democrats, independents, religious liberty Checking the Political Pulse of the University: Findings
New HampshireElection IssuesSurvey. Wave3. December13,2007
 New HampshireElection IssuesSurvey Wave3 December13,2007 December2007 New Hampshire Election Issues Survey Wave 3 ort prepared by Jeffrey Love and Gretchen Straw Data collected by Woelfel Research, Inc.
HART RESEARCH ASSOCIATES/PUBLIC OPINION STRATEGIES Study # page 1
 HART RESEARCH ASSOCIATES/PUBLIC OPINION STRATEGIES Study #13266 -- page 1 Interviews: 1000 Adults, including 300 cell phone only respondents Date: July 17-21, 2013 Study #13266 48 Male 52 Female Please
Datamar Inc. Florida Statewide Survey Presidential General Election. October 31, 2008
 Datamar Inc. Florida Statewide Survey 2008 Presidential General Election October 31, 2008 500 Fesler Street, Suite 207 El Cajon, CA. 92020 1 Florida Survey 2008 Presidential General Election Date: October
HART RESEARCH ASSOCIATES/PUBLIC OPINION STRATEGIES Study # page 1
 HART RESEARCH ASSOCIATES/PUBLIC OPINION STRATEGIES Study #16579 -- page 1 Interviews: 800 Registered Voters, including 360 respondents with a cell phone only and Date: July 31-August 3, 2016 27 respondents
Minnesota Public Radio News and Humphrey Institute Poll
 Minnesota Public Radio News and Humphrey Institute Poll Minnesota Contests for Democratic and Republican Presidential Nominations: McCain and Clinton Ahead, Democrats Lead Republicans in Pairings Report
Bellwork. Where do you think your political beliefs come from? What factors influence your beliefs?
 Bellwork Where do you think your political beliefs come from? What factors influence your beliefs? Unit 4: Political Beliefs and Behaviors Political Culture 1. What is the difference between political
Arizona Polling. Contact: Doug Kaplan,
 Arizona Polling Executive Summary Contact: Doug Kaplan, 407-242-1870 Gravis Marketing, a nonpartisan research firm, conducted a random survey of 925 likely voters across Arizona. The poll was conducted
Kansas Speaks 2015 Statewide Public Opinion Survey
 Kansas Speaks 2015 Statewide Public Opinion Survey Prepared For The Citizens of Kansas By The Docking Institute of Public Affairs Fort Hays State University Copyright October 2015 All Rights Reserved Fort
Democracy Corps Frequency Questionnaire
 Democracy Corps Frequency Questionnaire September 8-12, 2012 1000 Likely Voters Q.3 First of all, are you registered to vote at this address? Yes... 100 No...- (Refused)...- (ref:screen1) Q.4 Many people
******DRAFT***** Muhlenberg College/Morning Call 2016 Pennsylvania Republican Presidential Primary Survey. Mid April Version
 ******DRAFT***** Muhlenberg College/Morning Call 2016 Pennsylvania Republican Presidential Primary Survey Key Findings: Mid April Version 1. Donald Trump has built a solid lead over both Senator Ted Cruz
Democracy Corps Frequency Questionnaire
 Democracy Corps Frequency Questionnaire January 10-14, 2013 950 2012 Voters 852 2014 Voters Q.3 First of all, are you registered to vote? Yes... 100 100 No... - - (Refused)... - - (ref:screen1) Q.4 Many
HART RESEARCH ASSOCIATES/PUBLIC OPINION STRATEGIES Study # page 1
 HART RESEARCH ASSOCIATES/PUBLIC OPINION STRATEGIES Study #13266 -- page 1 Interviews: 1000 Adults, including 300 cell phone only respondents Date: July 17-21, 2013 Study #13266 48 Male 52 Female Please
McLAUGHLIN & ASSOCIATES NATIONAL SURVEY OF REPUBLICANS TABLE OF CONTENTS FEBRUARY 28,
 McLAUGHLIN & ASSOCIATES NATIONAL SURVEY OF REPUBLICANS TABLE OF CONTENTS FEBRUARY 28, 2013 TABLE # TABLE TITLE ---------------------------------------- Pg 1 1 Q1. - OF ALL THE PERSONAL TELEPHONE CALLS
Democracy Corps Frequency Questionnaire
 Democracy Corps Frequency Questionnaire May 28-June 1, 2009 1013 2008 Voters (1013 unweighted) 890 Likely Voters (897 unweighted) 123 Drop-Off Voters (116 unweighted) 810 Non-Seniors (712 unweighted) Q.3
Democracy Corps National/Presidential Battleground Frequency Questionnaire
 Democracy Corps National/Presidential Battleground Frequency Questionnaire September 1-3, 2008 1000 Likely Voters 600 Likely Voters in Presidential Battleground States (400 Weighted) Battleground States:
November 2017 Toplines
 November 2017 Toplines The first of its kind bi-monthly survey of racially and ethnically diverse young adults GenForward is a survey associated with the University of Chicago Interviews: 10/26-11/10/2017
Marquette Law School Poll September 15-18, Results for all items among Likely Voters
 Marquette Law School Poll September 15-18, 2016 (Percentages are rounded to whole numbers for reporting of results. Values ending in.5 here may round up or down if they are slightly above.5 or slightly
2016 NCSU N=879
 Spring, 2016 NCSU Pack Poll: Big Poll Toplines Report March 13-15 N=879 Completed Response Rate= 20% Margin of sampling error for completed response rate and questions asked of the full sample +/- 3.3%
HART/McINTURFF Study # page 1
 HART/McINTURFF Study #141290 --page 1 Interviews: 1000 registered voters including 666 likely voters, 350 respondents with a cell phone only and 41 respondents reached on a cell phone but who also have
Note: The sum of percentages for each question may not add up to 100% as each response is rounded to the nearest percent.
 Interviews: N=834 Likely Voters in Competitive U.S. House and Senate Races Interviewing Period: July 3-13, 2014 Margin of Error = ± 4.1% for Full Sample, ± 5.6% House (n=425), ± 5.7% for Senate (n=409)
1. In general, do you think things in this country are heading in the right direction or the wrong direction? Strongly approve. Somewhat approve Net
 TOPLINES Questions 1A and 1B held for future releases. 1. In general, do you think things in this country are heading in the right direction or the wrong direction? Right Direction Wrong Direction DK/NA
Summer 2008 N=800 Adults July 18-30, Q1. Are you registered to vote in the state of Texas? 84% Yes, registered. 14% No, not registered.
 Poll Results Poll produced by the Government Department and the Texas Politics project at the University of Texas at Austin. For more information, contact Dr. Daron Shaw (dshaw@austin.utexas.edu) or Dr.
United States General Exit Poll PRES04 - Horizontal Percentages Time of Weighting: 11/2/2004 7:33:46 PM Time Created: 11/2/2004 7:33:46 PM
 Page 1 of 12 Number of Interviews - 11,027 Vote Estimate Not for On-Air 100 51 48 1 - Use Are you: (n=10,978) Male 46 47 51 1-2 Female 54 54 45 1 2 Sex by race (n=10,824) White male 36 41 58 1 - White
Red Oak Strategic Presidential Poll
 Red Oak Strategic Presidential Poll Fielded 9/1-9/2 Using Google Consumer Surveys Results, Crosstabs, and Technical Appendix 1 This document contains the full crosstab results for Red Oak Strategic s Presidential
Democracy Corps - Inner Mountain West Frequency Questionnaire
 Democracy Corps - Inner Mountain West Frequency Questionnaire July 11 - August 3, 2008 1,003 Likely Hispanic Voters in the Inner Mountain West (AZ, CO, NM, NV) Q.3 What language do you feel most comfortable
Obama Leaves on a High Note Yet with Tepid Career Ratings
 ABC NEWS/WASHINGTON POST POLL: Obama s Legacy EMBARGOED FOR RELEASE AFTER 7 a.m. Wednesday, Jan. 18, 2017 Obama Leaves on a High Note Yet with Tepid Career Ratings Boosted by an improving economy, Barack
Public Opinion and Political Participation
 CHAPTER 5 Public Opinion and Political Participation CHAPTER OUTLINE I. What Is Public Opinion? II. How We Develop Our Beliefs and Opinions A. Agents of Political Socialization B. Adult Socialization III.
q10 What do you think will be the most important campaign issue in your state?
 CBS NEWS/NEW YORK TIMES POLL A LOOK AT THE 2004 DELEGATES TO THE DEMOCRATIC CONVENTION June 16-July 17, 2004 Note: Numbers may not add to 100 due to rounding. q6 How would you describe your support for
2008Hispanic RegisteredVotersSurvey
 2008Hispanic RegisteredVotersSurvey June2008 2008 Hispanic Registered Voters Survey Report Prepared By: William E. Wright, Ph.D. June 2008 AARP Knowledge Management 601 E Street NW Washington, DC 20049
Democracy Corps/Republican Party Project Frequency Questionnaire
 Democracy Corps/Republican Party Project Frequency Questionnaire July 10-15, 2013 950 Respondents (1200 Unweighted) 389 232 Republicans (567 Unweighted) 94 Independent-Lean Republicans (193 Unweighted)
THE CANDIDATES FOR VICE PRESIDENT September 12-16, 2008
 CBS NEWS/NEW YORK TIMES POLL FOR RELEASE: Wednesday, September 17 th, 2008 6:30 PM (EDT) THE CANDIDATES FOR VICE PRESIDENT September 12-16, 2008 While Republican Vice Presidential nominee Sarah Palin remains
WVWVAF Battleground Frequency Questionnaire
 WVWVAF Battleground Frequency Questionnaire June 11-14, 2018 1000 Registered Voters 558 RAE Respondents 261 Working Class Women 465 Diverse States 535 Belt+ States Q.4 First of all, are you registered
University of Texas / Texas Tribune Texas Statewide Survey
 Fall 2009 Results Summary N=800 Registered Voters Margin of error: +/- 3.46% October 20 27, 2009 University of Texas / Texas Tribune Texas Statewide Survey Note: Due to rounding, not all percentages will
Interview dates: September 6 8, 2013 Number of interviews: 1,007
 AP Syria Survey A telephone survey of the American general population (ages 18+) Interview dates: September 6 8, 2013 Number of interviews: 1,007 Margin of error for the total sample: +/- 3.7 percentage
Democracy Corps Post Election Frequency Questionnaire
 Democracy Corps Post Election Frequency Questionnaire November 4-7, 2018 454 2018 BG-15 Voter (831 unweighted) 359 2018 BG-12 Voter (666 unweighted) 245 RAE 2018 BG-15 Voter (479 unweighted) 191 RAE 2018
GenForward March 2019 Toplines
 Toplines The first of its kind bi-monthly survey of racially and ethnically diverse young adults GenForward is a survey associated with the University of Chicago Interviews: 02/08-02/25/2019 Total N: 2,134
UNIVERSITY OF MASSACHUSETTS LOWELL MASSACHUSETTS U.S. SENATE POLL. Sept , ,005 Registered Voters (RVs)
") UNIVERSITY OF MASSACHUSETTS LOWELL MASSACHUSETTS U.S. SENATE POLL Sept. 22-28, 2011-1,005 Registered Voters (RVs) Sample design: Overlapping dual-frame random digit dial landline (75%) and cell phone (25%).
UNIVERSITY OF MASSACHUSETTS LOWELL MASSACHUSETTS U.S. SENATE POLL Sept. 22-28, 2011-1,005 Registered Voters (RVs) Sample design: Overlapping dual-frame random digit dial landline (75%) and cell phone (25%).
Latinos in the 2016 Election:
 Latinos in the 2016 Election: Was there a Trump effect? Ana Gonzalez-Barrera Senior Researcher Mark Hugo Lopez Director of Global Migration and Demography Gustavo López Research Assistant Setting the Stage
Catholic voters presidential preference, issue priorities, and opinion of certain church policies
 Catholic voters presidential preference, issue priorities, and opinion of certain church policies This memo highlights the findings from a national public opinion survey conducted for Catholics for Choice
Democracy Corps Frequency Questionnaire
 Democracy Corps Frequency Questionnaire January 26-29, 2009 1,000 Likely Voters Q.3 (LANDLINE SAMPLE) First of all, are you registered to vote at this address? (CELL SAMPLE) Are you registered to vote?
Clinton Lead Cut in Half from August (Clinton 47% - Trump 42% in 2-way and Clinton 45% - Trump 39% in 4-way)
") P R E S S R E L E A S E FOR RELEASE: September 9, 2016 Contact: Steve Mitchell 248-891-2414 Clinton Lead Cut in Half from August (Clinton 47% - Trump 42% in 2-way and Clinton 45% - Trump 39% in 4-way)
P R E S S R E L E A S E FOR RELEASE: September 9, 2016 Contact: Steve Mitchell 248-891-2414 Clinton Lead Cut in Half from August (Clinton 47% - Trump 42% in 2-way and Clinton 45% - Trump 39% in 4-way)
The margin of error for 1,004 interviews is ± 3.1%
 1724 Connecticut Avenue, NW Interviews: 1,004 adults Washington, DC 20009 Dates: April 20-23, 2007 (202) 234-5570 48 Male 52 Female [109] FINAL Study #6072 NBC News/Wall Street Journal April 2007 Please
Conducted by the University of New Hampshire Survey Center
 Conducted by the University of New Hampshire Survey Center Interviews with 339 New Hampshire residents who say they plan to vote in the Democratic presidential primary and 306 who say they plan to vote
EMBARGOED NOT FOR RELEASE UNTIL: FRIDAY, OCTOBER, 25, 1996
 EMBARGOED NOT FOR RELEASE UNTIL: FRIDAY, OCTOBER, 25, 1996 RELEASE: SL/EP 59-3 (EP 109-3) CONTACT: JANICE BALLOU (908)828-2210, Ext. 240 A story based on the survey findings presented in this release and
R.I. Survey: Obama Leads McCain by 20 Percent
 August 26, 2008 Taubman Center for Public Policy R.I. Survey: Obama Leads McCain by 20 Percent Sen. Barack Obama leads Sen. John McCain by 20 percentage points in the U.S. presidential race, according
 http://www.newsweek.com/2010/08/27/newsweek-poll-democrats-may-not-be-headed-for-midterm-bloodbath.html Newsweek Poll Obama/Muslims Princeton Survey Research Associates International Final Topline Results
THE PRESIDENTIAL NOMINATION CONTESTS May 18-23, 2007
 CBS NEWS/NEW YORK TIMES POLL For release: Thursday, May 24, 2007 6:30 P.M. EDT THE PRESIDENTIAL NOMINATION CONTESTS May 18-23, 2007 The current front-runners for their party's Presidential nomination Senator
Roanoke College Poll October 2, Election
 Roanoke College Poll October 2, 2012 2012 Election 1. First, to be sure that we get a representative sample of Virginians, would you please tell me in what county do you live? [IF NOT IN COUNTY, THEN WHICH
Subject: Sanders leads in Wisconsin; GOP Race Close; VA Privatization Issue Hurts Johnson
 From: Tom Jensen, Director of Public Policy Polling To: Interested Parties Subject: Sanders leads in Wisconsin; GOP Race Close; VA Privatization Issue Hurts Johnson Date: 3-31-16 A new Public Policy Polling
Democracy Corps Frequency Questionnaire
 Democracy Corps Frequency Questionnaire November 12-16, 2009 1,000 2008 Voters (1,000 unweighted) 847 Likely Voters (875 unweighted) 1 153 Drop-Off Voters (125 unweighted) 2 Q.3 First of all, are you registered
PRESIDENT OBAMA AT THE 100-DAY MARK April 22-26, 2009
 CBS NEWS/NEW YORK TIMES POLL For release: Monday, April 27 th, 2009 6:30 p.m. EDT PRESIDENT OBAMA AT THE 100-DAY MARK April 22-26, 2009 President Barack Obama nears the 100 day mark in his presidency with
April Franklin & Marshall College Poll SURVEY OF PENNSYLVANIANS SUMMARY OF FINDINGS
 For immediate release Wednesday, April 16, 2008 April 2008 Franklin & Marshall College Poll SURVEY OF PENNSYLVANIANS SUMMARY OF FINDINGS Prepared by: Center for Opinion Research Floyd Institute for Public
Speaking about Women in the Year of Hillary Clinton
 Abstract Speaking about Women in the Year of Hillary Clinton Meshayla Hagen-Young March 22 th, 2018 PS 300 Previous research has explored the extent to which elected officials follow the lead of individuals
Defining the Arab American Vote
 Defining the Arab American Vote Our Voice. Our Future. Yalla Vote 2008 June 2007 2007 Zogby International Table Of Contents I. Results and Analysis...2 Table 1: Arab American Party Identification...2 Table