2006 Census Bulletin #10 Labour Force Activity
|
|
|
- Derek Richards
- 5 years ago
- Views:
Transcription
1 Issue Date: November Census Bulletin #10 Labour Force Activity Introduction This bulletin provides an overview of the labour force of Metro Vancouver based on data from the 2006 Census. Included in this bulletin is information on: The labour force in Metro Vancouver; Changes in the labour force between 1996 and 2006; The distribution of labour force in Metro Vancouver; Age and gender profile of the labour force; Labour force place of work status. Labour Force Activity in Metro Vancouver Labour force refers to the population age 15 and older who are eligible for employment. This excludes retired workers, students, homemakers, seasonal workers on an off season and those people who are unable to work due to long term illness or disability. refers to the labour force in the week prior to Census Day (May 16, 2006), expressed as a percentage of the population 15 years and over excluding institutional residents. As shown in Table 1, Metro Vancouver has a labour force of 1,169,720 people, representing 66.7% of the total population age 15 and older in Metro Vancouver s participation of 66.7% is comparable to the national participation of 66.8%, and is slightly lower than Toronto s participation of 68.3%. Calgary and Edmonton have higher participation s (75.6% and 73.0% respectively) while Victoria s participation of 65.7% is lower than Metro Vancouver s participation. Table 1. Labour Force for Select Metropolitan Areas Geographic Area Population age 15 years and older In the Labour Force Not in the Labour Force Rate (%) Employment Rate (%) Unemployment Rate (%) Canada 25,664,220 17,146,135 8,518, Vancouver CMA 1,752,390 1,169, , Toronto CMA 4,122,820 2,815,845 1,306, Montreal CMA 2,967,715 1,972, , Calgary CMA 871, , , Edmonton CMA 837, , , Victoria CMA 278, ,895 95, The Labour Force activity data also reports on the employment and unemployment s. Metro Vancouver s unemployment of 5.6% in 2006 is lower than the national unemployment of 6.6%. Calgary and Edmonton also have low unemployment s (4.0% and 4.6% respectively), whereas Montreal s unemployment of 6.9% was higher than the national unemployment of 6.6%. Changes in the Labour Force Activity from 1991 to 2006 Table 2 shows the change in the number of labour force participants in Metro Vancouver over the past four census periods, from 1991 to s declined from 69.7% in 1991 to 66.7% in This reflects an aging population, characterized by a higher proportion of the population retired and no longer participating in employment.
2 Table 2. Labour Force for Metro Vancouver, Metro Vancouver In the Labour Force 896, ,355 1,073,010 1,169,720 Rate Employment Rate Unemployment Rate * Population age 15 years and older. Table 2 also shows that unemployment s declined from 9.2% in 1991 to 5.6% in Table 3 shows how participation s have changed between 1996 and 2006 for municipalities in Metro Vancouver. While the region s participation s declined from 67.3% to 66.7% between 1996 and 2006, participation s increased in the City of Vancouver (from 65.5% in 1996 to 66.4% in 2006), New Westminster (from 67.6% in 1996 to 69.3% in 2006), Burnaby (from 63.6% in 1996 to 64.0% in 2006) and Pitt Meadows (from 70.7% in 1996 to 71.1% in 2006). Some municipalities showed a slight decline in labour force between 1996 and 2006 even though the total population increased. These municipalities include Delta, West Vancouver, District of North Vancouver, Lions Bay and Belcarra. Table 3: Labour Force Rate by Municipality, Geographic Area Population * Labour Force Rate (%) Population * Labour Force Rate (%) Anmore ,325 1, Belcarra Bowen Island n/a n/a 2,750 2, Burnaby 147,855 93, , , Coquitlam 79,215 55, ,630 62, Delta 74,010 53, ,930 53, Electoral Area 'A' n/a n/a 9,075 5, Langley City 17,860 11, ,430 12, Langley Township 60,515 43, ,885 53, Lions Bay 1, , Maple Ridge 41,920 28, ,125 37, New Westminster 41,870 28, ,455 34, North Vancouver City 35,130 25, ,570 27, North Vancouver District 63,235 45, ,610 45, Pitt Meadows 10,125 7, ,635 8, Port Coquitlam 35,180 26, ,850 30, Port Moody 16,020 12, ,940 16, Richmond 120,200 76, ,530 92, Surrey 232, , , , Vancouver 436, , , , West Vancouver 33,990 20, ,515 20, White Rock 15,080 8, ,225 9, Vancouver CMA 1,476, , ,752,390 1,169, * Population age 15 years and older Source: Statistics Canada, 1996, 2006 Census 2
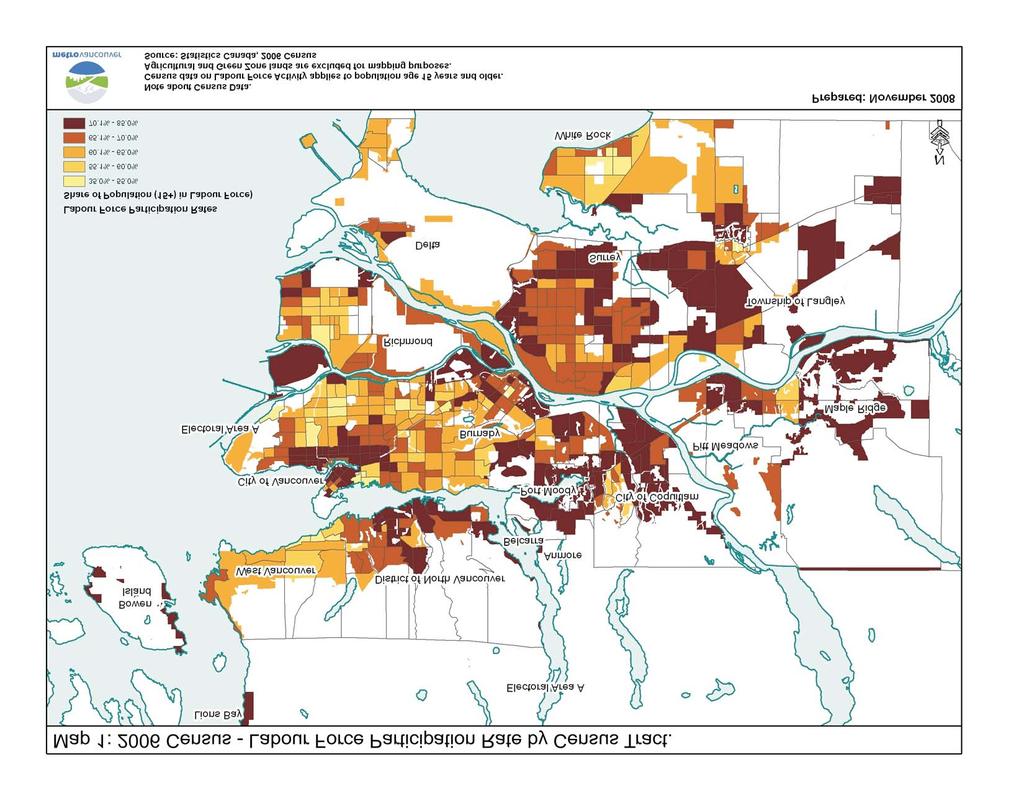
3 The Labour Force Activity in Metro Vancouver by Municipalities. This bulletin also provides information on labour force activity by municipality (Table 4). The highest participation s were found in Port Moody (74.3%) and Port Coquitlam (72.6%), as well as Anmore (78.9%), Belcarra (72.4%) and Bowen Island (77.1%). The municipalities with the lowest participation s in 2006 were West Vancouver (57.7%) and White Rock (59.7%). Unemployment s vary across the region by municipality. The municipalities with the highest unemployment s in 2006 were the City of Burnaby (6.8%) and Electoral Area A (7.9%). The municipalities with the lowest unemployment s were Langley Township (3.5%), Lions Bay (2.5%), Anmore (2.9%), Belcarra (3.6%) and Bowen Island (1.9%). Table 4. Labour Force Rate and Employment Rate for Metro Vancouver, 2006 Population (15 In the Labour Not in Labour Employment Unemployment Geographic Area yrs and older) Force Force Rate (%) Rate (%) Rate (%) Anmore 1,325 1, Belcarra Bowen Island 2,750 2, Burnaby 171, ,545 61, Coquitlam 93,630 62,895 30, Delta 77,930 53,105 24, Electoral Area 'A' 9,075 5,600 3, Langley City 19,430 12,800 6, Langley Township 74,885 53,030 21, Lions Bay 1, Maple Ridge 54,125 37,665 16, New Westminster 49,455 34,260 15, North Vancouver City 38,570 27,325 11, North Vancouver District 66,610 45,540 21, Pitt Meadows 12,635 8,985 3, Port Coquitlam 41,850 30,380 11, Port Moody 21,940 16,300 5, Richmond 146,530 92,470 54, Surrey 312, , , Vancouver 497, , , West Vancouver 35,515 20,480 15, White Rock 16,225 9,690 6, Vancouver CMA 1,752,390 1,169, , Map 1 shows participation s by census tract in Metro Vancouver Census tracts with low participation s have a high share of the population out of the labour force because they are retired, students, homemakers, seasonal workers, or unable to work due to health issues. The pattern that is reflected in the data show older, established neighbourhoods have lower participation s than new neighbourhoods. 3
4

5 The Labour Force of Metro Vancouver by Gender Table 5 shows the change in labour force participation in Metro Vancouver by gender between 1991 to While the drop in participation s is common to both genders, female participation s dropped by only 0.7% between 1991 and 2006 whereas male participation s dropped 5.2% over the same period. Table 4 also shows an inequality in unemployment s between males and females. In 2006 the unemployment for females was 6.1% as compared to 5.1% for males. This difference between unemployment s in 2006 is noticeably different than previous census periods when the unemployment difference between genders was negligible (less than 0.2%). Table 5. Labour Force for Metro Vancouver by Gender, Metro Vancouver Female Male Female Male Female Male Female Male In the Labour Force 411, , , , , , , ,640 Rate Employment Rate Unemployment Rate Source: Statistics Canada, 1991, 1996, 2001, 2006 Census The Labour Force of Metro Vancouver by Age Groups Table 6 shows the change in distribution of labour force by age groups in Metro Vancouver over the census periods from 1996 to As shown in Table 6, younger workers (age 15 to 34) account for 36% of the labour force in 2006, a decrease from 42% in s are lowest among the 15 to 24 age group (61.2% as compared to the regional participation of 66.7%) as many youth continue with their education beyond high school. The age group 35 to 54 account for 49% of the labour force in This is a slight increase from 47% in This age grouping has the highest participation s and also has the lowest unemployment. Figure 1. Labour Force by Select Age Groups for Metro Vancouver Municipalities,
6 Table Census - Labour Force Activity by Age Groups, Metro Vancouver CMA TOTAL - All Age Groups (2006) Total - Labour force activity In the labour force Share of labour force Employed Unemployed Not in the labour force Employment Unemployment Total (Age 15 and olde 1,752,390 1,169, % 1,104,760 64, , Ages , ,390 15% 155,240 19, , Ages , ,040 21% 230,825 13,215 44, Ages , ,850 25% 279,745 13,105 53, Ages , ,715 24% 267,470 11,245 58, Ages , ,265 13% 143,450 6,810 86, Ages ,625 24,510 2% 23,410 1, , Ages 75 and older 118,915 4,950 0% 4, , TOTAL - All Age Groups (2001) Total - Labour force activity In the labour force Share of labour force Employed Unemployed Not in the labour force Employment Unemployment Total (Age 15 and olde 1,620,920 1,073, % 995,320 77, , Ages , ,455 15% 135,685 21, , Ages , ,190 23% 230,295 17,890 48, Ages , ,110 27% 273,415 17,695 56, Ages , ,330 23% 234,475 12,850 56, Ages , ,520 10% 101,345 6,175 72, Ages ,555 17,830 2% 16,745 1, , Ages 75 and older 100,535 3,575 0% 3, , TOTAL - All Age Groups (1996) Total - Labour force activity In the labour force Share of labour force Employed Unemployed Not in the labour force Employment Unemployment Total (Age 15 and olde 1,476, , % 908,325 85, , Ages , ,825 15% 128,045 21,785 92, Ages , ,450 27% 247,230 23,225 47, Ages , ,480 27% 248,905 19,570 49, Ages , ,940 20% 189,400 12,540 42, Ages ,380 84,850 9% 78,180 6,665 66, Ages ,110 15,195 2% 14,150 1, , Ages 75 and older 82,710 2,600 0% 2, , Source: Statistics Canada, 1996, 2001, 2006 Census
7 In comparing the 2006 data on labour force age 55 and older with the data from 1996, their proportion of total labour force increased from 11% (102,645 people) of total labour force in 1996 to 15% (179,725 people) in It is interesting to note how the number of seniors age 75 and older who are actively employed in the labour force increased from 2,410 seniors in 1996 to 4,620 in The age group 65 to 74 also showed a substantial increase in the number of people actively employed in the labour force, increasing from 14,150 seniors in 1996 to 23,410 seniors in As shown in Figure 1, municipalities with the highest percentage of the labour force age 55 and older were West Vancouver (30.7%), and Lions Bay (30.6%). The municipalities of Bowen Island, Belcarra and White Rock show had a high share (greater than 25%) of their labour force age 55 and older. On the other end of the scale, Electoral Area A (including UBC) reported 71.2% of its labour force age 45 and younger, as compared to the regional share of 60.8% of the labour force for that age grouping. Employed Labour Force Place of Work Status The 2006 Census data on labour force provides insight into where the employed labour force are working. This is referred to as the place of work status. The employed labour force is categorized either having no fixed workplace, working outside of Canada, working at a usual place of work, or working at home. Working at Home Table 7 shows how the number of employed labour force working at home has increased in Metro Vancouver. Working at home has increased as an absolute number in Metro Vancouver (from 69,885 jobs in 1996 to 91,595 in 2006) and as a share of the total employed labour force (from 7.3% in 1996 to 8.3% in 2006). Municipalities with a high proportion of employed labour force working at home were West Vancouver (20.3%), Bowen Island (21.3%), and Lions Bay (24.5%). The municipalities with a low proportion of employed labour force working at home were New Westminster (5.2%) and the City of Langley (5.3%). Municipalities that showed increases in the proportion of their employed labour force working at home include Vancouver (from 6.8% in 1996 to 8.6% in 2006), the City of North Vancouver (from 6.6% in 1996 to 8.4% in 2006), Port Moody (from 6.9% in 1996 to 8.7% in 2006), Electoral Area A (from 6.7% in 1996 to 12.0% in 2006) and Anmore (from 4.9% in 1996 to 9.3% in 2006). 5
8 Table 7: Employed Labour Force Working At Home, Metro Vancouver, Employed Work at Home Employed Work at Home Geographic Area Labour Force # % Labour Force # % Anmore % 1, % Belcarra % % Bowen Island 1, % 2, % Burnaby 89,225 4, % 102,125 7, % Coquitlam 52,350 3, % 59,555 4, % Delta 43,455 3, % 50,635 4, % Electoral Area 'A' 4, % 5, % Langley City 10, % 12, % Langley Township 43,695 4, % 51,180 5, % Lions Bay % % Maple Ridge 30,670 2, % 35,935 2, % New Westminster 28,115 1, % 32,330 1, % North Vancouver City 22,525 1, % 26,060 2, % North Vancouver District 38,730 4, % 43,310 5, % Pitt Meadows 7, % 8, % Port Coquitlam 24,770 1, % 28,905 1, % Port Moody 13, % 15,535 1, % Richmond 76,835 5, % 87,180 7, % Surrey 166,700 10, % 198,885 13, % Vancouver 272,870 18, % 310,640 26, % West Vancouver 17,900 3, % 19,570 3, % White Rock 7, % 9,240 1, % Vancouver CMA 955,790 69, % 1,104,760 91, % Note: Employed labour force includes no fixed workplace and work outside of Canada Working in Home Municipality Table 8 shows how many employed labour force with a fixed place of work within Canada have jobs within the same municipality in which they reside. In Metro Vancouver, the percentage of labour force workers working within the same municipality in which they reside has increased from 46.1% in 1996 to 48.0% in Municipalities with a high proportion of employed labour force working in their home municipality in 2006 were Vancouver (68.9%), Richmond (59.2%), Bowen Island (54.0%), and Electoral Area A (51.4%). The municipalities with a low proportion of employed labour force working at home were Anmore (5.2%) Belcarra (12.5%) and Port Moody (17.7%). Municipalities that showed increases in the proportion of their employed labour force working in their home municipality include Delta (from 31.4% in 1996 to 37.0% in 2006), Electoral Area A (from 6.9% in 1996 to 51.4% in 2006), and Bowen Island (from 45.5% in 1996 to 54.0% in 2006). Municipalities that showed a large increase in the absolute number of employed labour force working in their home municipality between 1996 and 2006 include Vancouver (37,770 people), Surrey (32,185 people), and Burnaby (12,900 people). Also showing a significant increase in the number of labour force working in their home municipality were Langley Township (7,485 people), Coquitlam (7,205) and Delta (7,180). 6
9 Table 8: Employed Labour Force Working in Home Municipality, Employed Employed in Employed Employed in Labour Home Municipallity Labour Home Municipallity Municipality Force * No. % Force * No. % Anmore % 1, % Belcarra % % Bowen Island 1,615 n/a 2, % Burnaby 89,225 28, % 102,125 35, % Coquitlam 52,350 12, % 59,555 16, % Delta 43,455 14, % 50,635 16, % Electoral Area 'A' 4,565 1, % 5,160 2, % Langley City 10,515 2, % 12,160 2, % Langley Township 43,695 14, % 51,180 18, % Lions Bay % % Maple Ridge 30,670 10, % 35,935 12, % New Westminster 28,115 5, % 32,330 6, % North Vancouver City 22,525 6, % 26,060 7, % North Vancouver District 38,730 11, % 43,310 11, % Pitt Meadows 7,525 1, % 8,585 1, % Port Coquitlam 24,770 4, % 28,905 6, % Port Moody 13,930 1, % 15,535 2, % Richmond 76,835 35, % 87,180 46, % Surrey 166,700 52, % 198,885 76, % Vancouver 272, , % 310, , % West Vancouver 17,900 6, % 19,570 7, % White Rock 7,860 1, % 9,240 1, % Vancouver CMA 955, , % 1,104, , % Note: Employed labour force includes "no fixed place of work" and those employed "outside Canada" Working in Home Subregion Table 9 shows how many employed labour force have jobs within the same subregion in which they reside. In Metro Vancouver, the percentage of the employed labour force working within their subregion has increased from 45.9% in 1996 to 48.6% in The Vancouver/Electoral Area A subregion shows the greatest proportion of employed labour force working within the home subregion (73.2% in 2006). Most subregions have a higher percentage of jobs filled by local workers in 2006 than in Only Vancouver/Electoral Area A showed a decrease the percentage of employed labour force working in their home subregion, dropping from 74.1% in 1996 to 73.2% in Although the percentage dropped for the subregion, the absolute number increased by 28,405 (from 174,755 in 1996 to 203,160 to 2006). 7
10 Table 9: Employed Labour Force Working in Home Subregion, Employed Employed in Employed Employed in Metro Vancouver Labour Home Subregion Labour Home Subregion Subregions Force * # * % Force # * % Vancouver, Electoral Area A 235, , % 277, , % Surrey, White Rock 131,410 59, % 174,560 83, % Delta, Richmond 108,575 59, % 120,290 72, % Burnaby / New Westminster 99,205 40, % 117,340 50, % Northeast Sector 78,870 28, % 92,310 38, % North Shore 81,080 40, % 81,450 43, % Langley Township, Langley City 45,795 22, % 54,210 28, % Maple Ridge, Pitt Meadows 29,230 12, % 38,195 17, % Metro Vancouver Total 812, , % 958, , % * Employed labour force excludes "no fixed place of work" and those employed "outside Canada" for this table. Note: Bowen Island incorpod in The geographic area of Electoral Area A has changed since the 1996 Census. Note: 1996 values for Bowen Island and Electoral A are approximated for this table. Conclusions and Observations Analysis of the labour force data shows several important changes over the past ten years. The labour force participation s have declined since 1991, which indicates a greater proportion of the population is not working and is dependent upon the labour force. s can be expected to continue to decline as the population experiences increased longevity and as the babyboom age people move out of the labour force move and into retirement. Although still not large in absolute numbers, the region is seeing more seniors continuing to work after the age of 65. Regarding the place of employment, the employed labour force is traveling less. Over the previous two census periods more people are working at home, working within their home municipality, or working close by in a neighbouring municipality
Jobs in Richmond Hot Facts
 Jobs in Richmond Hot Facts Introduction This issue of Hot Facts examines the number and the occupational categories of Richmond jobs. Jobs within Richmond are those that are held by: y Richmond workers
International Migration Continues to Fuel Greater Vancouver s Population Growth and Multicultural Change
 GVRD Policy & Planning Department February 2003 2001 CENSUS BULLETIN #6 IMMIGRATION International Migration Continues to Fuel Greater Vancouver s Population Growth and Multicultural Change According to
Labour Force Activity in Richmond. Total Population Aged 15 years and Over by Labour Force Status, 2016 Census
 Labour and Mode of Travel to Work Hot Facts This issue of Hot Facts examines: y Labour force and labour force activity in Richmond y Occupations of Richmond residents y Place of work status y Mode of transportation
MEMO TO MEMBERS November 19, 2018
 MEMO TO MEMBERS November 19, 2018 TO: FROM: RE: UBCM MEMBERS Attn: Elected Officials of Member Local Governments and First Nations UBCM EXECUTIVE NOTIFICATION OF EXECUTIVE VACANCIES The purpose of this
Metro 2040 Performance Monitoring Update
 5.2 Metro 2040 Performance Monitoring Update SECTION G AMENDMENT Lauren Klose REGIONAL PLANNER Regional Planning Committee March 10, 2016 Background 2 55 15 Performance Measures Key Summary Measures Complete
Economic Structure of Vancouver:
 Factsheet # 1.2 Economic Structure of Vancouver: Role of Vancouver in the Metro Vancouver Region Vancouver as a Regional Centre The city of Vancouver is the largest jobs and population centre in the Metro
MEMO December 1, 2011
 MEMO December 1, 2011 TO: UBCM MEMBERS Attn: Mayor & Council Chair & Board FROM: UBCM EXECUTIVE RE: NOTIFICATION OF EXECUTIVE VACANCIES The purpose of this memo is to notify members of the direction taken
Metro Vancouver Backgrounder Metro 2040 Residential Growth Projections
 Metro Vancouver 2040 - Backgrounder Metro 2040 Residential Growth Projections Purpose Metro Vancouver 2040 Shaping our Future, Metro s draft regional growth strategy, was released for public review in
MEMO December 4, 2014
 MEMO December 4, 2014 TO: UBCM MEMBERS Attn: Mayor & Council Chair & Board FROM: UBCM EXECUTIVE RE: NOTIFICATION OF EXECUTIVE VACANCIES The purpose of this memo is to notify members of the direction taken
City of Surrey. Preface. Labour Force Fact Sheet
 City of Labour Force Fact Sheet Preface Statistics Canada conducts its Census of Population every five years with the most recent census having occurred in 2006. The Census provides information on the
Mayor and Council Bill Flitton, Director, Legislative Services/City Clerk Metro Vancouver - Greater Vancouver Regional District Board Appointments
 COUNCIL REPORT Report No. COR 116-2017 Regular Council Date: November 14, 2017 File No: 0540-30 To: From: Subject: Mayor and Council Bill Flitton, Director, Legislative Services/City Clerk Metro Vancouver
City of Surrey. Labour Force Fact Sheet. Preface
 City of Preface Every five years, Statistics Canada conducts a Census of Population in order to develop a statistical portrait of Canada and its people. The most recent Census was conducted in May 2011.
TOWNSHIP OF LANGLEY, B.C Township of Langley Immigrant Demographics I
 Immigrant demographics TOWNSHIP OF LANGLEY, B.C. - 2018 Township of Langley Immigrant Demographics I Page 1 TOWNSHIP OF LANGLEY IMMIGRANT DEMOGRAPHICS Your quick and easy look at facts and figures around
new westminster, B.C New Westminster Immigrant Demographics I
 Immigrant demographics new westminster, B.C. - 2018 Immigrant Demographics I Page 1 new westminster IMMIGRANT DEMOGRAPHICS Your quick and easy look at facts and figures around immigration. Newcomers are
Immigrant DELTA, B.C Delta Immigrant Demographics I
 Immigrant demographics DELTA, B.C. - 2018 Immigrant Demographics I Page 1 DELTA IMMIGRANT DEMOGRAPHICS Your quick and easy look at facts and figures around immigration. Newcomers are an important and growing
Immigrant PORT COQUITLAM, B.C Port Coquitlam Immigrant Demographics I
 Immigrant demographics PORT COQUITLAM, B.C. - 2018 Immigrant Demographics I Page 1 PORT COQUITLAM IMMIGRANT DEMOGRAPHICS Your quick and easy look at facts and figures around immigration. Newcomers are
Collective Bargaining: The Cost of Safety
 Collective Bargaining: The Cost of Safety Collective Bargaining: The Cost of Safety Union of BC Municipalities 2016 Convention September 26-30, 2016 Thomas A. Roper Q.C. Ryan D. Copeland Police Compensation
METRO VANCOUVER HOUSING CORPORATION (MVHC) BOARD OF DIRECTORS
 BOARD OF DIRECTORS") Meeting 4 of 10 METRO VANCOUVER HOUSING CORPORATION (MVHC) BOARD OF DIRECTORS REGULAR BOARD MEETING Friday, February 23, 2018 9:00 A.M. 28 th Floor Boardroom, 4730 Kingsway, Burnaby, British Columbia Membership
Meeting 4 of 10 METRO VANCOUVER HOUSING CORPORATION (MVHC) BOARD OF DIRECTORS REGULAR BOARD MEETING Friday, February 23, 2018 9:00 A.M. 28 th Floor Boardroom, 4730 Kingsway, Burnaby, British Columbia Membership
Immigrant. coquitlam, B.C Coquitlam Immigrant Demographics I
 Immigrant demographics coquitlam, B.C. - 2018 Immigrant Demographics I Page 1 coquitlam IMMIGRANT DEMOGRAPHICS Your quick and easy look at facts and figures around immigration. Newcomers are an important
Director Darrell Mussatto, North Vancouver City. Director Geoff Meggs, Vancouver. Director Barinder Rasode, Surrey. Director Mae Reid, Coquitlam
 Chair, Director Greg Moore, Port Coquitlam Director Heather Anderson, An more Director Wayne Baldwin, White Rock Alternate Director Bruce Bell, Pitt Meadows, for Deb Walters Director Malcolm Brodie, Richmond
Social and Demographic Trends in Burnaby and Neighbouring Communities 1981 to 2006
 Social and Demographic Trends in and Neighbouring Communities 1981 to 2006 October 2009 Table of Contents October 2009 1 Introduction... 2 2 Population... 3 Population Growth... 3 Age Structure... 4 3
METRO VANCOUVER REGIONAL DISTRICT BOARD OF DIRECTORS
 METRO VANCOUVER REGIONAL DISTRICT BOARD OF DIRECTORS Directors held at 10:26 a.m. on Friday, March 31, 2017 in the 2nd Floor Boardroom, 4330 Kingsway, Burnaby, British Columbia. MEMBERS PRESENT: Port Coquitlam,
METRO VANCOUVER REGIONAL DISTRICT BOARD OF DIRECTORS - PARKS
 METRO VANCOUVER REGIONAL DISTRICT BOARD OF DIRECTORS - PARKS of Directors held at 9:09 a.m. on Friday, November 24, 2017 in the 2gth Floor Boardroom, 4730 Kingsway, Burnaby, British Columbia. MEMBERS PRESENT:
METRO VANCOUVER REGIONAL DISTRICT ELECTORAL AREA COMMITTEE
 METRO VANCOUVER REGIONAL DISTRICT ELECTORAL AREA COMMITTEE Minutes of the Regular Meeting of the Metro Vancouver Regional District (MVRD) Electoral Area Committee held at 9:20 a.m. on Wednesday, July 4,
METRO VANCOUVER REGIONAL DISTRICT BOARD OF DIRECTORS - PARKS
 METRO VANCOUVER REGIONAL DISTRICT BOARD OF DIRECTORS - PARKS of Directors held at 9:03 a.m. on Friday, March 31, 2017 in the 2nd Floor Boardroom, 4330 Kingsway, Burnaby, British Columbia. MEMBERS PRESENT:
Corporate. Report COUNCIL DATE: April 28, 2008 NO: R071 REGULAR COUNCIL. TO: Mayor & Council DATE: April 28, 2008
 Corporate NO: R071 Report COUNCIL DATE: April 28, 2008 REGULAR COUNCIL TO: Mayor & Council DATE: April 28, 2008 FROM: General Manager, Planning and Development FILE: 6600-01 SUBJECT: 2006 Census Information
City of Port Moody Statistical Economic Profile
 City of Port Moody Statistical Economic Profile 2002 Edition Produced by: Crunch Analytics Vancouver, BC For further economic development information, please contact: City of Port Moody Economic & Strategic
4330 Kingsway, Burnaby, British Columbia.
 GREATER VANCOUVER REGIONAL DISTRICT BOARD OF DIRECTORS Directors held at 10:13 a.m. on Friday, October 24, 2014 in the 2nd Floor Boardroom, 4330 Kingsway, Burnaby, British Columbia. MEMBERS PRESENT: Chair,
MV has drafted a new Solid Waste Management Plan (SWMP) to replace the existing plan (referred to as the 1995 SWMP ).
 to replace the existing plan (referred to as the 1995 SWMP ).") CORPORATE REPORT NO: R122 COUNCIL DATE: June 7, 2010 REGULAR COUNCIL TO: Mayor & Council DATE: June 3, 2010 FROM: General Manager, Engineering FILE: 5360-60 SUBJECT: Establishment of an Eco-centre in Surrey
CORPORATE REPORT NO: R122 COUNCIL DATE: June 7, 2010 REGULAR COUNCIL TO: Mayor & Council DATE: June 3, 2010 FROM: General Manager, Engineering FILE: 5360-60 SUBJECT: Establishment of an Eco-centre in Surrey
City of Surrey. Preface. Citizenship and Immigration Fact Sheet
 City of Citizenship and Immigration Fact Sheet Preface Statistics Canada conducts its Census of Population every five years with the most recent census having occurred in 2006. The Census provides information
2016 Census Bulletin: Education and Labour
 2016 Census Bulletin: Education and Labour Kingston, Ontario Census Metropolitan Area (CMA) The 2016 Census Day was May 10, 2016. In the fall of 2017, Statistics Canada released various data sets from
Mayor Bruce Banman City of Abbotsford South Fraser Way Abbotsford, BC V2T 1W7
 Board & Information Services, Corporate Services Department Telephone: 604 432 6250 Fax: 604 451 6686 CR 12 02 CAP (8353631) Sent via email. December 18, 2013 Mayor Bruce Banman City of Abbotsford 32315
CENSUS BULLETIN #5 Immigration and ethnocultural diversity Housing Aboriginal peoples
 CENSUS BULLETIN #5 Immigration and ethnocultural diversity Housing Aboriginal peoples October 25, 217 Bulletin Highlights: 86.1 per cent of the Brampton s 216 surveyed population held a Canadian citizenship
The problem of growing inequality in Canadian. Divisions and Disparities: Socio-Spatial Income Polarization in Greater Vancouver,
 Divisions and Disparities: Socio-Spatial Income Polarization in Greater Vancouver, 1970-2005 By David F. Ley and Nicholas A. Lynch Department of Geography, University of British Columbia The problem of
METRO VANCOUVER REGIONAL DISTRICT BOARD OF DIRECTORS. Minutes of the Regular Meeting of the Metro Vancouver Regional District (MVRD) Board of
 Board of") METRO VANCOUVER REGIONAL DISTRICT BOARD OF DIRECTORS Directors held at 9:07 a.m. on Friday, March 23, 2018 in the 28 th Floor Boardroom, 4730 Kingsway, Burnaby, British Columbia. MEMBERS PRESENT: Port
METRO VANCOUVER REGIONAL DISTRICT BOARD OF DIRECTORS Directors held at 9:07 a.m. on Friday, March 23, 2018 in the 28 th Floor Boardroom, 4730 Kingsway, Burnaby, British Columbia. MEMBERS PRESENT: Port
GREATER VANCOUVER URBAN FUTURES OPINION SURVEY 2012
 GREATER VANCOUVER URBAN FUTURES OPINION SURVEY 2012 TECHNICAL REPORT New City Ventures Inc. MARCH 2013 URBAN FUTURES SURVEY 2012 SPONSORS Real Estate Foundation of British Columbia City of Vancouver City
Artists in Large Canadian Cities
 Artists in Large Canadian Cities http://www.hillstrategies.com info@hillstrategies.com Statistical insights on the arts, Vol. 4 No. 4 Hill Strategies Research Inc., March 2006 ISBN 0-9738391-6-3; Research
GREATER VANCOUVER REGIONAL DISTRICT BOARD OF DIRECTORS
 GREATER VANCOUVER REGIONAL DISTRICT BOARD OF DIRECTORS Directors held at 9:08 a.m. on Friday, November 27, 2015 in the 2nd Floor Boardroom, 4330 Kingsway, Burnaby, British Columbia. MEMBERS PRESENT: Chair,
Re s e a r c h a n d E v a l u a t i o n. L i X u e. A p r i l
 The Labour Market Progression of the LSIC Immigrants A Pe r s p e c t i v e f r o m t h e S e c o n d Wa v e o f t h e L o n g i t u d i n a l S u r v e y o f I m m i g r a n t s t o C a n a d a ( L S
how neighbourhoods are changing A Neighbourhood Change Typology for Eight Canadian Metropolitan Areas,
 how neighbourhoods are changing A Neighbourhood Change Typology for Eight Canadian Metropolitan Areas, 1981 2006 BY Robert Murdie, Richard Maaranen, And Jennifer Logan THE NEIGHBOURHOOD CHANGE RESEARCH
2001 Census: analysis series
 Catalogue no. 96F0030XIE2001006 2001 Census: analysis series Profile of the Canadian population by mobility status: Canada, a nation on the move This document provides detailed analysis of the 2001 Census
TIEDI Labour Force Update September 2012
 The Toronto Immigrant Employment Data Initiative (TIEDI) s Labour Force Update aims to provide upto-date labour market data on immigrants. This monthly report relies on data from the Labour Force Survey
Immigration Status of Population: BC and the KPU Region
 Immigration Status of Population: BC and the KPU Region IMMIGRATION STATUS: KPU REGION AND BC 1 In 2016, 41%% of the KPU Region s total population were immigrants, compared to 40% in 2011. In 2016, 28%
Salvadoran Diaspora in Canada and Higher education
 Salvadoran Diaspora in Canada and Higher education Jose A. Garcia, Ph. D., MBA Salvadoran Canadian Association (ASALCA) November 18, 2010 VIII CONVENCIÓN INTERNACIONAL DE SALVADOREÑOS EN EL MUNDO, TORONTO,
Private Sector Commission
 Private Sector Commission Technical Information Bulletin No. 4 Labour Force and Employment in the Guyana Economy Private Sector Commission 157 Waterloo Street North Cummingsburg Georgetown Labour Force
TIEDI Labour Force Update January 2013
 The Toronto Immigrant Employment Data Initiative (TIEDI) s Labour Force Update aims to provide upto-date labour market data on immigrants. This monthly report relies on data from the Labour Force Survey
BYLAW NOTICE ENFORCEMENT REGULATION
 Page 1 of 22 Copyright (c) Queen's Printer, Victoria, British Columbia, Canada License Disclaimer B.C. Reg. 175/2004 O.C. 392/2004 Deposited April 22, 2004 effective May 3, 2004 Local Government Bylaw
GREATER VANCOUVER REGIONAL DISTRICT BOARD OF DIRECTORS
 GREATER VANCOUVER REGIONAL DISTRICT BOARD OF DIRECTORS Board of Directors held at 9:53 a.m. on Friday, July 29, 2011 in the 2 nd Floor Boardroom, 4330 Kingsway, Burnaby, British Columbia. MEMBERS PRESENT:
COMMUNITY PROFILE BURNABY
 COMMUNITY PROFILE BURNABY Burnaby Demographics I Page 1 BURNABY IMMIGRANT DEMOGRAPHICS Your quick and easy look at facts and figures around immigration. Newcomers are an important and growing part of your
COMMUNITY PROFILE COQUITLAM. Coquitlam Immigrant Demographics I Page 1
 COMMUNITY PROFILE COQUITLAM Coquitlam Demographics I Page 1 COQUITLAM IMMIGRANT DEMOGRAPHICS Your quick and easy look at facts and figures around immigration. Newcomers are an important and growing part
TIEDI Labour Force Update May 2011
 The Toronto Immigrant Employment Data Initiative (TIEDI) s Labour Force Update aims to provide upto-date labour market data on immigrants. This monthly report relies on data from the Labour Force Survey
2000 ANNUAL REPORT. Livable Region Strategic Plan
 2000 ANNUAL REPORT Livable Region Strategic Plan POLICY AND PLANNING DEPARTMENT DECEMBER 2000 Contents Introduction 4 1. Protect the Green Zone 5 1.1 Our Green Zone Assets 9 1.2 Protecting the Agricultural
TIEDI Labour Force Update December 2012
 The Toronto Immigrant Employment Data Initiative (TIEDI) s Labour Force Update aims to provide upto-date labour market data on immigrants. This monthly report relies on data from the Labour Force Survey
AN ANALYSIS OF THE SOCIO-ECONOMIC AND SOCIO- DEMOGRAPHIC CONTRIBUTORS TO PROPERTY CRIME IN THE LOWER MAINLAND DISTRICT
 AN ANALYSIS OF THE SOCIO-ECONOMIC AND SOCIO- DEMOGRAPHIC CONTRIBUTORS TO PROPERTY CRIME IN THE LOWER MAINLAND DISTRICT Dr. Irwin M. Cohen, Dr. Garth Davies, Kevin Burk, and Christine Neudecker August 2016
M Decision aking The Asian Pacific Post The South Asian Post The Filipino Post
 Making Decision The Asian Pacific Post The South Asian Post The Filipino Post THE ASIAN PACIFIC POST Serving the Urban Asian/ Chinese Markets We have chosen to advertise with The Asian Pacific Post for
GREATER VANCOUVER REGIONAL DISTRICT REGIONAL PLANNING COMMITTEE
 GREATER VANCOUVER REGIONAL DISTRICT REGIONAL PLANNING COMMITTEE REGULAR MEETING Friday, October 2, 2015 9:00 am 2 nd Floor Boardroom, 4330 Kingsway, Burnaby, British Columbia A G E N D A 1 1. ADOPTION
"Discouraged Workers"
 Autumn 1989 (Vol. 1, No. 2) "Discouraged Workers" Ernest B. Akyeampong Discouraged workers are defined in many countries, including Canada, as people who want work and yet are not job-hunting because they
B.C. Election: Parties hustle for advantage on key issues, leader momentum and credibility
 B.C. Election: Parties hustle for advantage on key issues, leader momentum and credibility Clark, Horgan in statistical tie on question of who would make best premier Page 1 of 12 April 12, 2017 The earliest
2016 Census of Canada
 2016 Census of Canada People Introduction This release examines the demographic and geographic aspects of the identity population in Alberta from the 2016 Census. The population is relatively young and
Release of 2006 Census results Labour Force, Education, Place of Work and Mode of Transportation
 Backgrounder Release of 2006 Census results Labour Force, Education, Place of Work and Mode of Transportation On March 4, 2008 Statistics Canada released further results from the 2006 census focusing on
Post-Secondary Education, Training and Labour September Profile of the New Brunswick Labour Force
 Post-Secondary Education, Training and Labour September 2018 Profile of the New Brunswick Labour Force Contents Population Trends... 2 Key Labour Force Statistics... 5 New Brunswick Overview... 5 Sub-Regional
METRO VANCOUVER REGIONAL DISTRICT (MVRD) BOARD OF DIRECTORS
 BOARD OF DIRECTORS") Meeting 1 of 2 METRO VANCOUVER REGIONAL DISTRICT (MVRD) BOARD OF DIRECTORS REGULAR BOARD MEETING Friday, December 7, 2018 9:00 A.M. 28 th Floor Boardroom, 4730 Kingsway, Burnaby, British Columbia Membership
Meeting 1 of 2 METRO VANCOUVER REGIONAL DISTRICT (MVRD) BOARD OF DIRECTORS REGULAR BOARD MEETING Friday, December 7, 2018 9:00 A.M. 28 th Floor Boardroom, 4730 Kingsway, Burnaby, British Columbia Membership
Artists and Cultural Workers in Canadian Municipalities
 Artists and Cultural Workers in Canadian Municipalities Based on the 2011 National Household Survey Vol. 13 No. 1 Prepared by Kelly Hill Hill Strategies Research Inc., December 2014 ISBN 978-1-926674-36-0;
Population and Dwelling Counts
 Release 1 Population and Dwelling Counts Population Counts Quick Facts In 2016, Conception Bay South had a population of 26,199, representing a percentage change of 5.4% from 2011. This compares to the
Article. W Visible Minority Women. by Tina Chui and Hélène Maheux. July 2011
 Component of Statistics Canada Catalogue no. 89-503-X Women in Canada: A Gender-based Statistical Report Article W Visible Minority Women by Tina Chui and Hélène Maheux July 2011 How to obtain more information
Statistics Update For County Cavan
 Social Inclusion Unit November 2013 Key Figures for Cavan Population 73,183 Population change 14.3% Statistics Update For County Cavan Census 2011 Shows How Cavan is Changing Population living in 70% rural
Social Indicators and Trends 2014
 Social Indicators and Trends 214 Healthy City for All Targets By 225: increase Vancouver residents sense of belonging by 1 per cent. By 225: increase Vancouver residents sense of safety by 1 per cent.
MEMORANDUM OF UNDERSTANDING (Amended February 10, 2016)
") MEMORANDUM OF UNDERSTANDING (Amended February 10, 2016) BETWEEN: SOUTH COAST BRITISH COLUMBIA TRANSPORTATION AUTHORITY POLICE SERVICE ("SCBCTAPS") AND JURISDICTIONAL POLICE As identified in Schedule A
MEMORANDUM OF UNDERSTANDING (Amended February 10, 2016) BETWEEN: SOUTH COAST BRITISH COLUMBIA TRANSPORTATION AUTHORITY POLICE SERVICE ("SCBCTAPS") AND JURISDICTIONAL POLICE As identified in Schedule A
G. The Fraser Valley. 1. Evolution of the Fraser Valley. electoral district north of the
 Part Proposed SINGLE MEMBER PLURALITY BOUNDARIES G. The Fraser Valley Fraser Valley North, Map 1 Historically, most Fraser Valley electoral districts were either exclusively north or south of the Fraser
4The British Columbia Demographic Context
 4The British Columbia Demographic Context This chapter provides background material on BC based on selective demographic characteristics. The original Atlas provided information on physical, climatic,
COMMUNITY PROFILE TOWNSHIP OF LANGLEY. Township of Langley Immigrant Demographics I Page 1
 COMMUNITY PROFILE TOWNSHIP OF LANGLEY Township of Langley Demographics I Page 1 TOWNSHIP OF LANGLEY IMMIGRANT DEMOGRAPHICS Your quick and easy look at facts and figures around immigration. Newcomers are
Social Profile of Oakville An Overview
 Social Profile of Oakville An Overview Prepared by Community Development Halton Funding support provided by the United Way of Oakville 2004 Community Development Halton, all rights reserved. Copies of
OBSERVATION. TD Economics A DEMOGRAPHIC OVERVIEW OF ABORIGINAL PEOPLES IN CANADA
 OBSERVATION TD Economics May 1, 213 A DEMOGRAPHIC OVERVIEW OF ABORIGINAL PEOPLES IN CANADA Highlights New data from the National Household Survey (NHS) show that just over 1.4 million people identified
SUSTAINABLE OR SPENT FORCE? Review of Metro Vancouver Labour Relations Function. James E. Dorsey, Q.C.
 SUSTAINABLE OR SPENT FORCE? Review of Metro Vancouver Labour Relations Function James E. Dorsey, Q.C. March 3, 2011 Metro Vancouver Population by Municipality 2009 Belcarra 0.03% (681) Lions Bay 0.1% (1,398)
BURNABY AUTOMATED VOTE COUNTING SYSTEM BYLAW AMENDMENTS
 Item... Meeting... 2018 June 25 COUNCIL REPORT TO: CITY MANAGER DATE: 2018 June 20 FROM: CITY CLERK & CHIEF ELECTION OFFICER FILE: Reference: 45000 2018 Election SUBJECT: BURNABY AUTOMATED VOTE COUNTING
2016 Census: Release 5 Immigration and ethnocultural diversity, Housing and the Aboriginal population
 2016 Census: Release 5 Immigration and ethnocultural diversity, Housing and the Aboriginal population Dr. Doug Norris Senior Vice President and Chief Demographer November 2, 2017 Today s presenter Dr.
GREATER VANCOUVER SEWERAGE AND DRAINAGE DISTRICT BOARD OF DIRECTORS
 GREATER VANCOUVER SEWERAGE AND DRAINAGE DISTRICT BOARD OF DIRECTORS (GVS&DD) Board of Directors held at 11:21 a.m. on Friday, April 27, 2018 in the 28 th Floor Boardroom, 4730 Kingsway, Burnaby, British
Aboriginal People in Canadian Cities,
 Aboriginal People in Canadian Cities, 1951 1996 Guide for Research in Summer, 2002 Evelyn J. Peters Department of Geography University of Saskatchewan 9 Campus Drive Saskatoon, SK S7J 3S9 (306) 966-5639
Preliminary Demographic Analysis of First Nations and Métis People
 APPENDIX F Preliminary Demographic Analysis of First Nations and Métis People A Background Paper Prepared for the Regina Qu Appelle Health Region Working Together Towards Excellence Project September 2002
GREATER VANCOUVER REGIONAL DISTRICT (GVRD) - PARKS BOARD OF DIRECTORS
 - PARKS BOARD OF DIRECTORS") Meeting 1 of 7 GREATER VANCOUVER REGIONAL DISTRICT (GVRD) - PARKS BOARD OF DIRECTORS REGULAR BOARD MEETING Friday, July 31, 2015 9:00 A.M. 2 nd Floor Boardroom, 4330 Kingsway, Burnaby, British Columbia
Meeting 1 of 7 GREATER VANCOUVER REGIONAL DISTRICT (GVRD) - PARKS BOARD OF DIRECTORS REGULAR BOARD MEETING Friday, July 31, 2015 9:00 A.M. 2 nd Floor Boardroom, 4330 Kingsway, Burnaby, British Columbia
NORTHERN ONTARIO IMMIGRATION PROFILE. Michael Haan & Elena Prokopenko
 NORTHERN ONTARIO IMMIGRATION PROFILE Michael Haan & Elena Prokopenko FALL 2015 This Employment Ontario project is funded by the Ontario government The views expressed in this document do not necessarily
Land Supply: Scarce means Dense and Expensive
 Daedalus Analytics Incorporated Written by David Baxter Copyright 2016 Daedalus Analytics Incorporated Way back in the early 1970s the Greater Vancouver Regional District (GVRD) was involved in a long
Multiculturalism and Local Government in Vancouver
 Western Geography, 10/11(2000/01), pp. 1 29 Western Division, Canadian Association of Geographers Multiculturalism and Local Government in Vancouver David W. Edgington Department of Geography University
New Brunswick Population Snapshot
 New Brunswick Population Snapshot 1 Project Info Project Title POPULATION DYNAMICS FOR SMALL AREAS AND RURAL COMMUNITIES Principle Investigator Paul Peters, Departments of Sociology and Economics, University
The Chinese Community in Canada
 Catalogue no. 89-621-XIE No. 001 ISSN: 1719-7376 ISBN: 0-662-43444-7 Analytical Paper Profiles of Ethnic Communities in Canada The Chinese Community in Canada 2001 by Colin Lindsay Social and Aboriginal
Deconstructing Neighbourhood Transitions Larry S. Bourne, April 2007
 Deconstructing Neighbourhood h Transitions: The Contributions of Demographic, Immigration, Life Style and Housing Stock Changes Larry S. Bourne Professor of Geography and Planning Centre for Urban and
The Planning & Development Department recommends that Council receive this report for information.
 CORPORATE REPORT NO: R237 COUNCIL DATE: November 19, 2018 REGULAR COUNCIL TO: Mayor & Council DATE: November 15, 2018 FROM: General Manager, Planning & Development FILE: 6600-01 SUBJECT: Surrey Community
Putting Numbers into Action: Aboriginal Data on the Statistics Canada Website
 Putting Numbers into Action: Aboriginal Data on the Statistics Canada Website Findings from the 2011 National Household Survey (NHS) Social and Aboriginal Statistics Division, Statistics Canada Outline
aboriginal edmonton A Statistical Story I
 aboriginal edmonton A Statistical Story - 2009 I II Report prepared for: Aboriginal Relations Office, City of Edmonton Prepared by: Dr. Chris Andersen Faculty of Native Studies University of Alberta Edmonton,
We hope you find this report useful. It is available online at the websites of each of the contributing organizations:
 1 Over half of Ontario s population lives and works in the province s central region. With high rates of immigration, commuting and re-location based on life stage, the region is often on the move. In
Chapter One: people & demographics
 Chapter One: people & demographics The composition of Alberta s population is the foundation for its post-secondary enrolment growth. The population s demographic profile determines the pressure points
A Profile of CANADiAN WoMeN. NorTHerN CoMMuNiTieS
 A Profile of CANADiAN WoMeN in rural, remote AND NorTHerN CoMMuNiTieS DeMogrAPHiC Profile in 2006, the last census year for which data are currently available, approximately 2.8 million women resided in
SPECIAL PROGRAM APPROVALS GRANTED
 SPECIAL PROGRAM APPROVALS GRANTED Applicant Effective Dates Amata Transition House 07/15/2012 07/15/2017 BC Centre for Disease and 08/07/2012 Control 08/15/2022 BC Women's Hospital & Health Centre, Aboriginal
Community Social Profile Cambridge and North Dumfries
 Community Trends for 2013 in Cambridge, North Dumfries, Wellesley, Wilmot and Woolwich Community Social Profile - Cambridge and North Dumfries Published December 2014 Community Social Profile Cambridge
Canada s Visible Minorities: Andrew Cardozo and Ravi Pendakur
 Canada s Visible Minorities: 1967-2017 Andrew Cardozo and Ravi Pendakur Introduction Introductory remarks Demographic overview Labour market outcomes Policy initiatives Some defining moments Demographic
metrovancouver SERVICES 1\ND SOLUT:<>HS FOP A Ll\fb.SLE RFGiOH
 SERVICES 1\ND SOLUT:HS FOP A Ll\fb.SLE RFGiOH 4330 Kin()>way, Burnaby, BC, Canada VSH 4G3 604'"],32 6200 IE For Metro Vancouver meetings on Friday, June 12, 2015 Please note these are notthe official
HOUSING RESEARCH REPORT. Household Mobility and Housing Choices
 HOUSING RESEARCH REPORT Household Mobility and Housing Choices CMHC helps Canadians meet their housing needs. Canada Mortgage and Housing Corporation (CMHC) has been helping Canadians meet their housing
RECENT IMMIGRANTS IN METROPOLITAN AREAS. Québec. A Comparative Profile Based on the 2001 Census April 2005
 RECENT IMMIGRANTS IN METROPOLITAN AREAS Québec A Comparative Profile Based on the 2001 Census April 2005 Produced by Strategic Research and Statistics For additional copies, please visit our website: Internet:
Edmonton Real Estate Forum May 9, Prepared By: Myron Borys Vice President, Edmonton Economic Development Corporation
 Edmonton Real Estate Forum May 9, 2006 Prepared By: Myron Borys Vice President, Edmonton Economic Development Corporation Outline The Fundamental Issues Oil Sands as Driver Immigration Migration Employment
cent. crime. Sense of Safety Reported Whether threats marginalization from City of Vancouver, Social Policy
 Healthy City for All Targets Increase Vancouver residents sense of belonging and sense of safety by 10 per cent. Vancouver to be the safest major city in Canada by annually reducing violent and property