INEQUALITY AND POVERTY IN COMPARATIVE PERSPECTIVE
|
|
|
- Arabella Daniel
- 5 years ago
- Views:
Transcription
1 INEQUALITY AND POVERTY IN COMPARATIVE PERSPECTIVE Lee Rainwater Estudio/ Working Paper 1997/110 December 1997 Lee Rainwater is Emeritus Professor of Sociology at Harvard University and Director of Research of the Luxembourg Income Study. This paper is based on a seminar that he gave at the Center for Advanced Study in the Social Sciences of the Juan March Institute in Madrid, on 26 February 1996 entitled Income Distribution and Poverty in OECD Countries: Evidence from the Luxembourg Income Study.
2 -1- Members of modern societies use a wide range of goods and services to effect their participation in social relations, and their sense of social identity. As a part of common cultural understandings, members assume the necessity for particular material underpinnings to their activities in carrying out the social roles which constitute participation in their communities. Because these are highly stratified societies, the level of economic resources available to individuals and families varies greatly. People have a lively sense of what different levels imply in terms of both with whom an individual is likely to participate, and the kind of activities in social participation which are feasible. The definition of poverty adopted by the European Community in 1984 reflects a conception of poverty grounded in an understanding of the nature of social stratification in prosperous industrial societies: The poor shall be taken to mean persons, families, and groups of persons whose resources (material, cultural, and social) are so limited as to exclude them from the minimum acceptable way of life in the member state in which they live. This paper summarizes several studies concerned with cross-national comparisons of income inequality and poverty in the recent past. In the first part I report inequality measures and poverty rates in 24 countries currently available in the Luxembourg Income Study (LIS) database. Income will be used as a shorthand for equivalent disposable income. Disposable income is total income after tax and after transfers. Equivalent income is adjusted for differences in family size and the age of the head of the household. The conventional measure of income inequality is the Gini coefficient. Another frequently used measure is the Atkinson coefficient. (I have calculated the Atkinson coefficient with an epsilon of 0.5, which has the effect of weighting the lower end of the distribution more heavily in assessing differences in inequality.) Gini and Atkinson coefficients for these 25 countries are reported in Table 1.
3
4
5
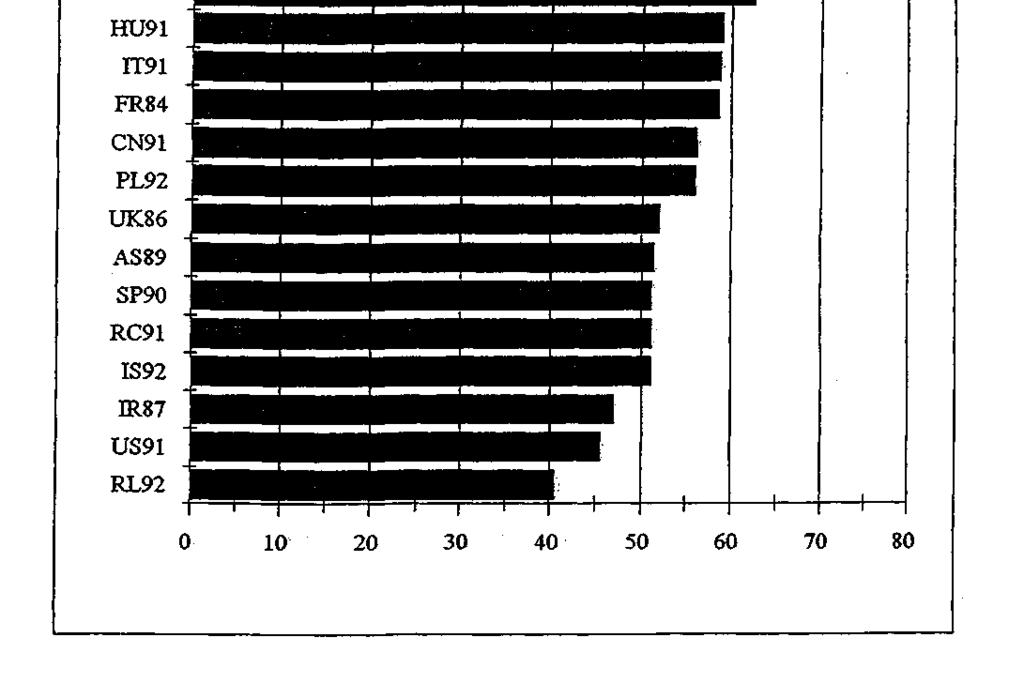
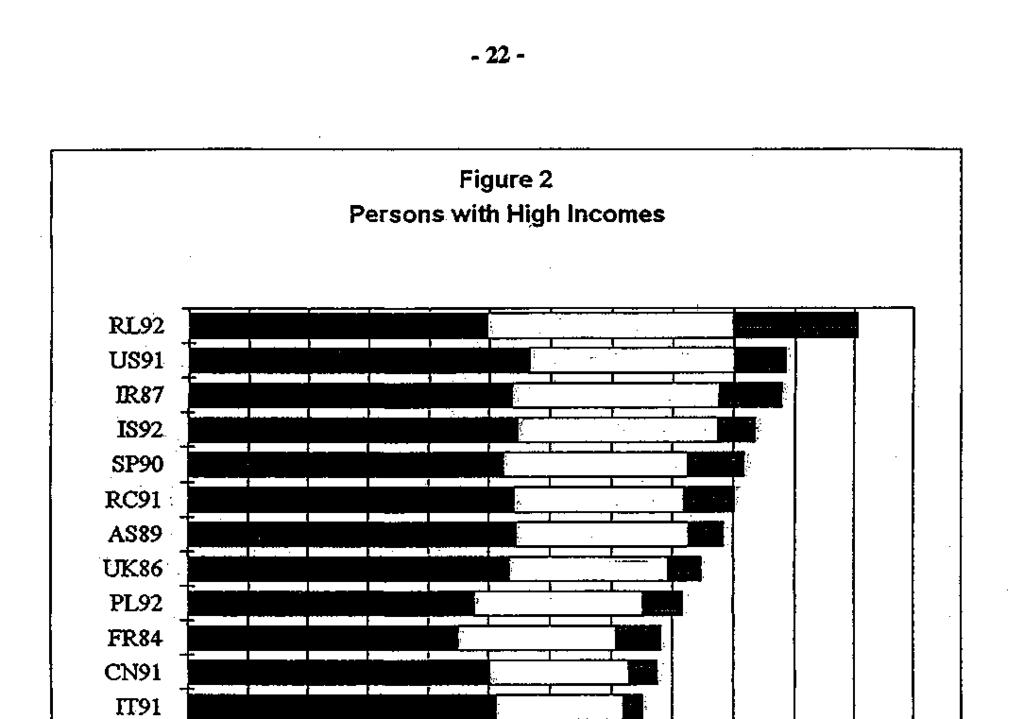
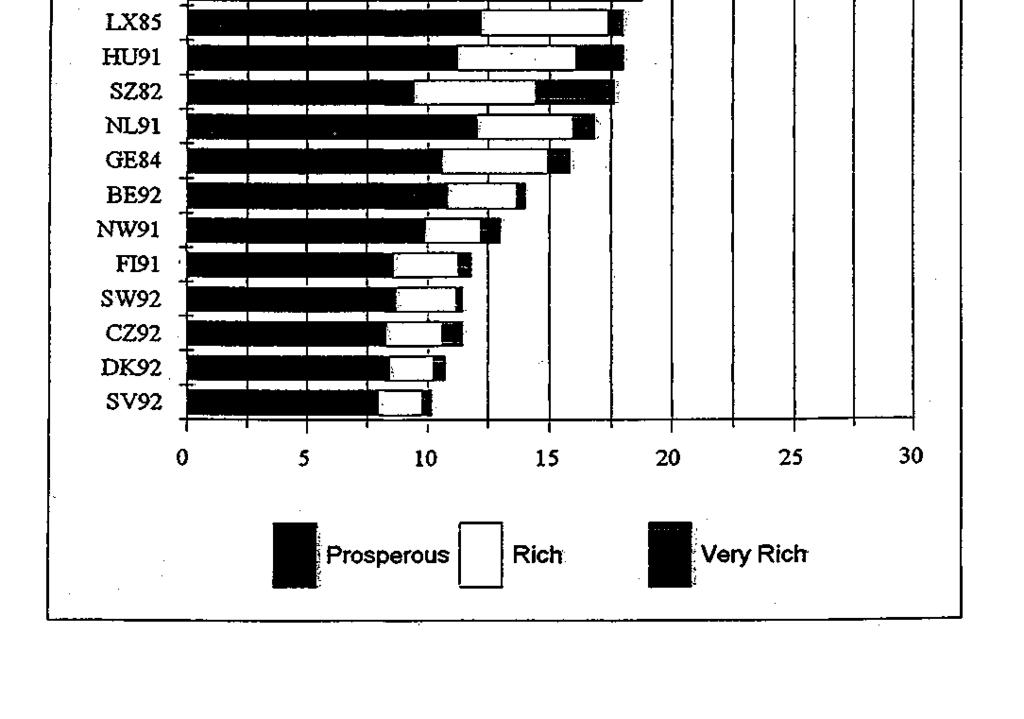
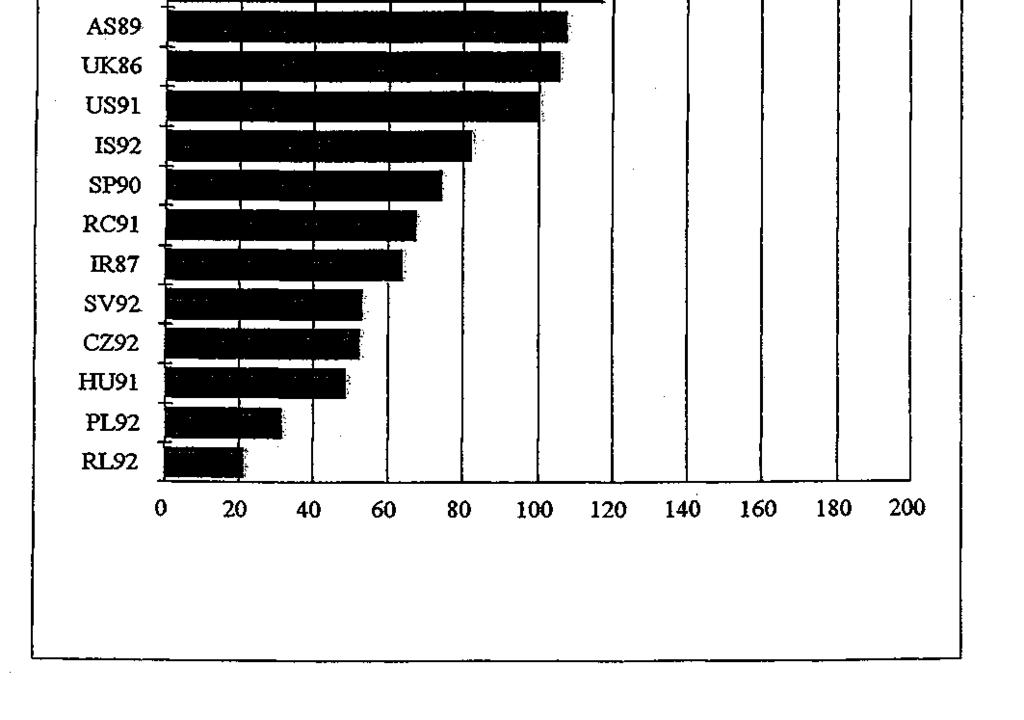
6 -5- These categories allow us to examine the texture of income stratification as it varies from country to country. We see that there is a very wide range in the proportion of people who are middle income -- from around 40% in Russia to three-quarters in the Czech Republic and Slovakia (Figure l) 1. Close to two-thirds or more of persons are middle income in Belgium, Denmark, Finland, Norway and Sweden, followed closely by Germany, Luxembourg, the Netherlands and Switzerland at slightly over sixty percent The United States and Ireland have less than half of their populations in the middle income group. The other countries range from the low to the high fifties. By and large, the countries with more high income people also have more low income people - - the correlation of the two percentages is.832. But although the correlation is strong, we note that there is quite a range in the number of high income people in countries that are quite similar in the percentage in the lower income group. Fourteen countries have low income percentages from around 20 percent to 25 percent, but their high income groups range from a little over ten percent in Slovakia, Denmark, Finland, Sweden and the Czech Republic to close to 20 percent in Canada, France, Italy and Poland. We note that very few people in any country have incomes more than three times the median -- the range is from almost no one in Sweden to three percent in Switzerland, with Russia as an outlier at 5 percent (Figure 2). Shifting to the low income categories we find a similarly wide range in the size of the poor and near poor group -- from around thirty percent in Russia, the United States and Ireland to less than fifteen percent in the Czech Republic and Slovakia and less than twenty percent in Finland, Norway, Switzerland and Luxembourg (Figure 3). We note that in only two countries are more than five percent of persons extremely poor -- the United States and Russia at slightly over eight percent. In the great majority of countries, fewer than three percent have such low incomes. 1 All Figures (1 through 10) are to be found at the end of the text.
7 -6- Shifting to the poverty line -- less than half of the median income -- we find interesting differences among the continental groups of nations. The non-european countries all have poverty rates of at least ten percent, ranging from Israel and Taiwan at the low end, to Australia and Canada slightly higher and the United States much higher at 17 percent. The range among the East European countries is as wide as for the total group -- the Czech Republic and Slovakia have the lowest poverty rates of all countries, Hungary and Poland are on the high side at around nine percent, and Russia has the highest rate. In the European Union the range is much narrower -- Ireland and Spain have the highest rates at eleven or ten percent while the other countries are tightly grouped together in the five to eight percent range. It is as well to remember that some of our samples are small, and that while quite comparable the surveys are not exactly comparable. This means we should not exaggerate small differences in either overall inequality measures or in distributions over income classes. When differences are large as between the United States and Russia and any of the other countries, or between Spain and Belgium, or Ireland and Finland, we can feel very confident that they are real but it is best not to rely too heavily on differences when countries are quite close in their distributions. The Distribution of Children s Well-Being We have been examining the distribution of income levels among the total populations of these countries. The question arises as to whether the same patterns obtain if we focus on particular groups. My current project concerns the economic well-being of children in the LIS countries, so let us shift our focus to them. 2 2 The remainder of this paper revises and extends Rainwater and Smeeding (1995).
8
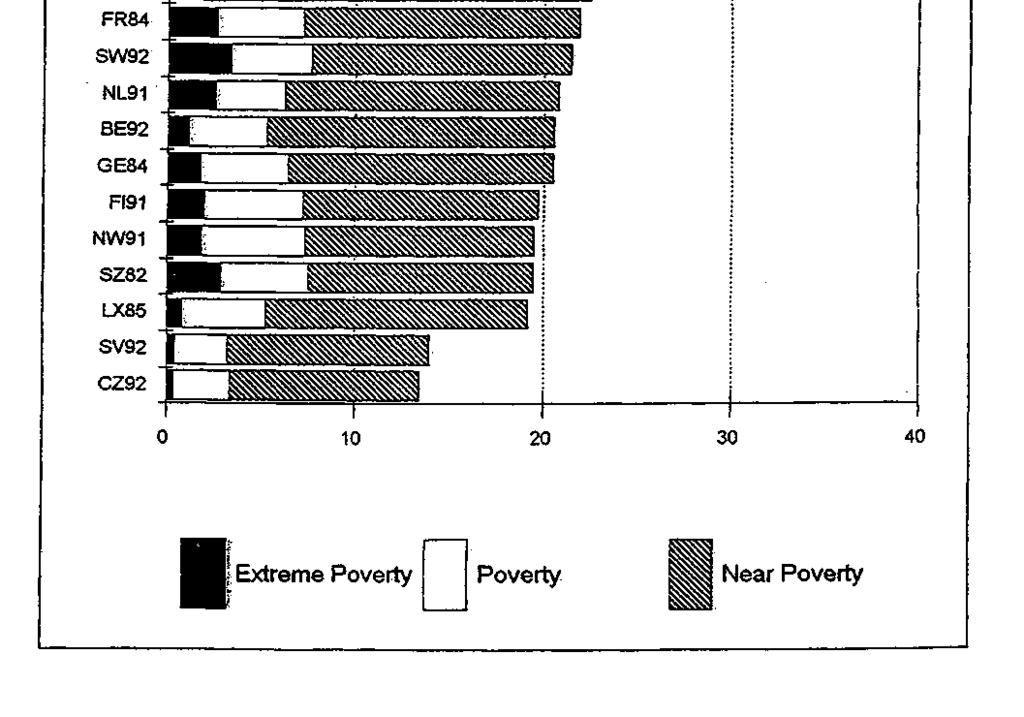
9 -8- Sixty-five percent of children are middle income in the median country. We note that threequarters or more of children are middle income in six countries -- Finland, Sweden, Norway, Denmark, Slovakia and the Czech Republic. In contrast, fewer than half are middle income in Russia and the United States, and only slightly more than half in five other countries -- Ireland, Spain, Australia, Israel and Taiwan. The two countries with the highest proportion of low income children, the United States and Ireland, have poverty and near poverty rates over three times as high as those with the lowest (the Czech Republic, Slovakia and Sweden). Italy, Spain, the United Kingdom, Taiwan and Israel also have elevated rates. In contrast, the other Scandinavian countries, Switzerland and Belgium have quite low rates (see Figure 4). If we shift the focus to poverty rates per se, we see important differences that are not apparent at the near poverty level. Only the United States, Russia and Australia have extreme poverty rates as high as five percent. In contrast to the US extreme poverty rate of over ten percent, some thirteen countries have rates of two percent or less. In the European Union, Spain, Italy, and the United Kingdom as well as Ireland have elevated overall child poverty rates. Except for the Netherlands and France, all the other countries have rates below five percent. It is apparent if one compares Tables 3 and 4 that the distribution of income among children is different in important ways from that of the total population. This raises the question of the distribution for other age groups. Since working age adults are the parents of children we would not expect much difference between the two distributions and in fact there is not. However, with the elderly there can be, and are, significant differences. The correlation between child and elderly poverty rates is only.57 so there are important differences in the pattern across countries of the two rates. Most countries have elder poverty rates higher than their child poverty rates. Russia is the most extreme -- an elder rate of 38 percent versus 17 percent for children.
10
11 -10- The other countries are plotted in Figure 5. We see that for a group from France and the Netherlands on the low side, to the United States with high rates, child and elder rates are about the same. For the other countries the elder rate is somewhat to quite a bit higher than the child rate. For example, compare the countries with child poverty rates in the 10 to 15 percent range: the United Kingdom, Poland, Spain and Canada have elder poverty rates in the same range. But Taiwan, Israel, Ireland and Australia have much higher elder poverty rates -- above 20 percent. Switzerland and Finland also have elevated elder poverty rates compared to their very low child poverty rates, and Norway, Luxembourg and Belgium are not far behind. We would expect to find the reasons for the differences in elder versus child poverty rates first by examining pension programs in these countries, and then by comparing wage inequality (particularly with the addition of the social wage in the form of family benefits, housing allowances, and temporary absence insurance) with the inequality of benefits for the retired. Children s Real Levels of Living Although we would argue that economic well-being (at least in developed countries) is most crucially a function of the individual s relative position in the distribution of income, real levels of living are also of interest in comparing income and well-being. Interest in real income goes beyond the situation of poor children since in comparative studies one also wants to know about the real standard of living of average and well-off children as well. Comparisons of real gross domestic product and aggregate consumption often show that the United States has the highest standard of living among major modern nations. Thus, the question of whether this state of affairs extends to measures of after-tax adjusted disposable income arises. While the purchasing power parities (PPPs) used to make such adjustments are based on differences in consumption patterns among nations, they are designed to be used with
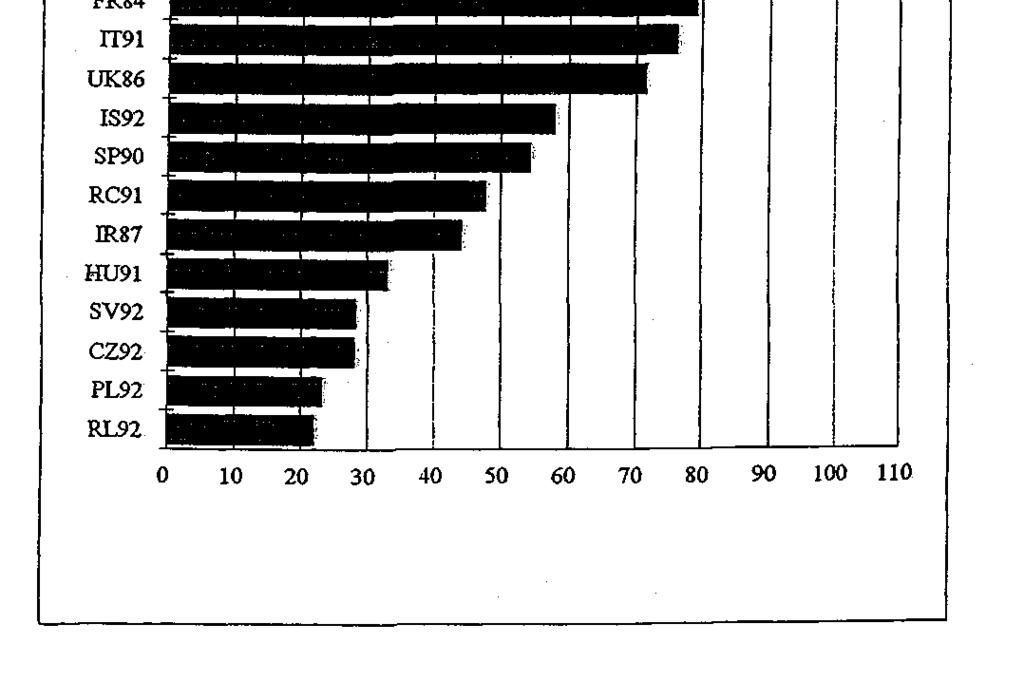
12 -11- macroeconomic concepts: aggregate output (GDP) and aggregate consumption as defined by national and international income accountants. Cross-national differences in types of consumption which are tax financed versus household expenditure financed are not taken into account. Because countries differ in the way that they finance such goods as health care and education, and because they differ in the extent to which specific types of consumption are tax subsidized, for example, owned versus rented housing, the PPPs used here are less than ideal for adjusting disposable income for control over resources across countries. Yet they are the best tool we have to make such comparisons. The real incomes measures below should therefore be seen as measures of net spendable income rather than measures of total consumption for children, the largest difference between the two concepts being goods and services such as health care, day care, and education which are provided at different prices in different nations. Figures 6, 7 and 8 address this issue (also see Table 5, columns 4, 5 and 6, on which the figures are based). We compare the real spendable (disposable) incomes of well-off, average and low income children in the United States with comparably situated children in the other nations. The average American child in a four person family in 1991 had a family income of $34,675. In fact, American children who are in families in the upper 20 percent of the income distribution do very well indeed (Figure 6). They have much higher standards of living as measured by real spendable income than do similarly situated children in all countries, with only Switzerland and Canada being within 20 percent of the United States level. Scandinavia -for example, Denmark and Sweden- has high income children who live in families with three-quarters the income of the average American child. The only nations whose rich children live in households with incomes which are less than 60 percent of that found in the United States are Israeli and Irish children. Given that Israel and Ireland have, by far, the lowest overall real standards of living of the nations observed here, this is to be expected. Focusing on children in the middle 20 percent (Figure 7), we find that only in Denmark and in Canada are children as well off as American children, although Swedish and Swiss children are almost as well off. The average child in Belgium, Germany, Norway and Finland
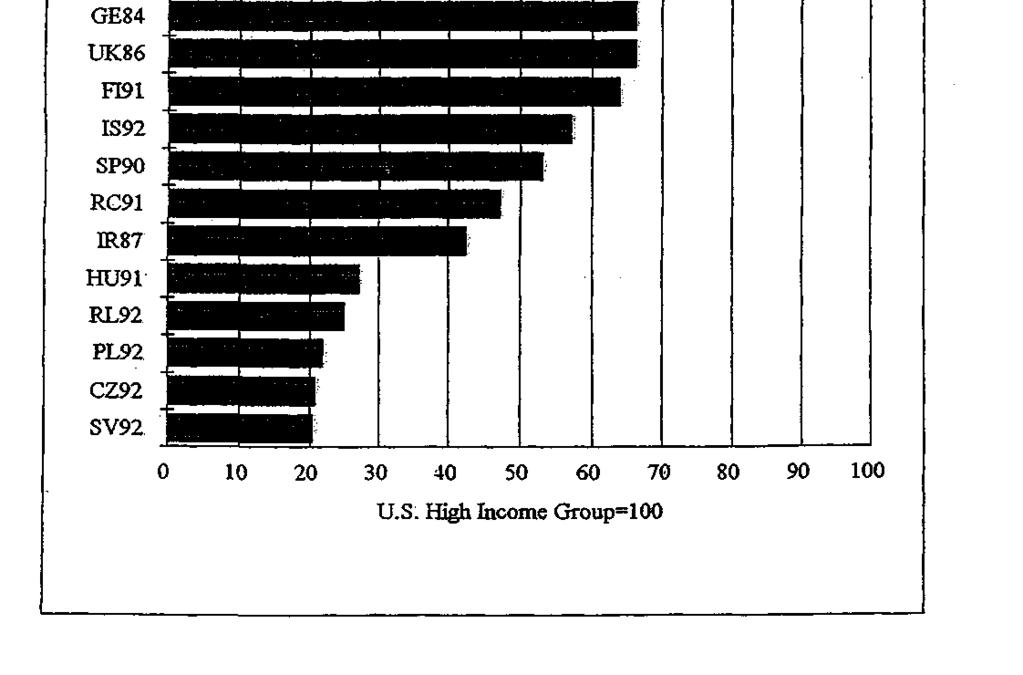
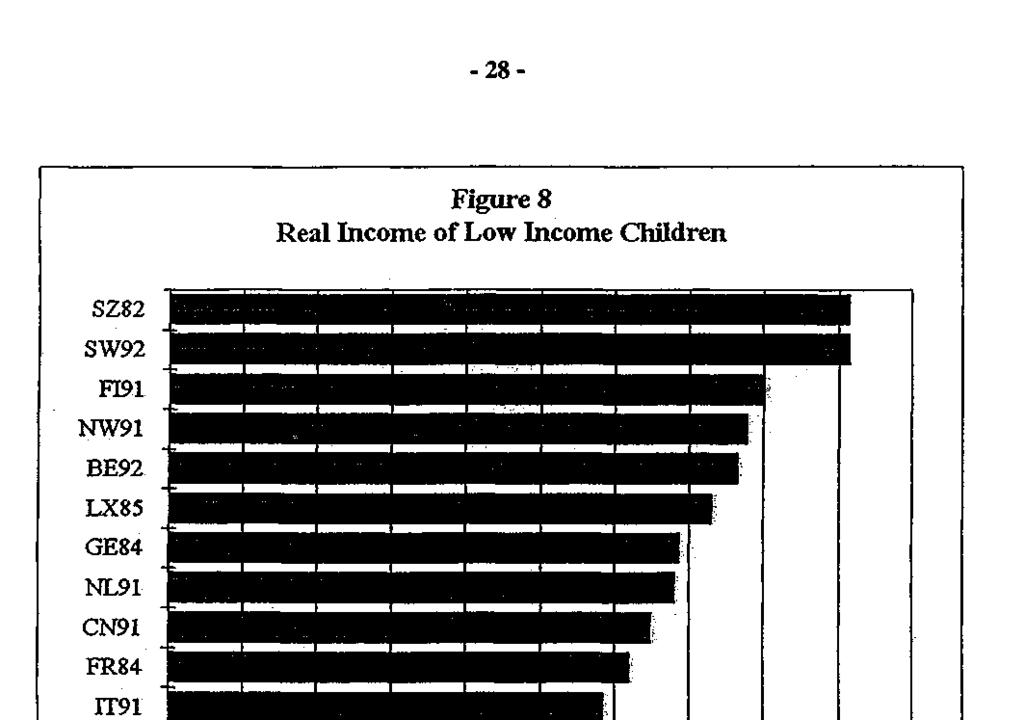
13 -12- is only 90 percent as well off, and 80 percent or less as well off in countries like Austria, Italy and France. On the other hand, in only three countries is the average child less than three-quarters as well-off as in the United States: the United Kingdom at 72 percent, Israel at 52 percent and Ireland at 43 percent. At the lower end of the distribution we find a very different and surprising picture. Both the official U.S. statistics and our international results suggest that the poverty rate of United States children is in the neighborhood of 20 percent. In Figure 8, we compare the real spendable incomes of the typical poor American child - the one at the median of the bottom 20 percent- with that of comparable low income children in other countries. We see immediately that in six countries, low income children have real standards of living at least 50 percent higher than in the United States: Switzerland, Sweden, Finland, Denmark, Belgium and Norway. And in four other countries (Germany, Luxembourg, Netherlands and Austria), low income children are at least 30 percent better off than in the United States. Only in Israel and Ireland - the two nations with the lowest GDP per capita of those studied- do low income children have a lower real standard of living than do children in the United States. In other words, while the United States has a higher real level of income than most of our comparison countries, it is the high and middle income children who reap the benefits (and much more the former than the latter). Low income American children suffer in both absolute and relative terms. The average low income child in the other 23 countries is at least one-third better off than is the average low-income American child (see also Table 5). Trends in Child Poverty We now examine the trend in child poverty for the nations for which we have multi-year data. In order to have really solid evidence on patterns of change in these measures it would be desirable to have multiple observations over several decades for a large number of nations. Unfortunately a database with data for several countries over long periods of time does
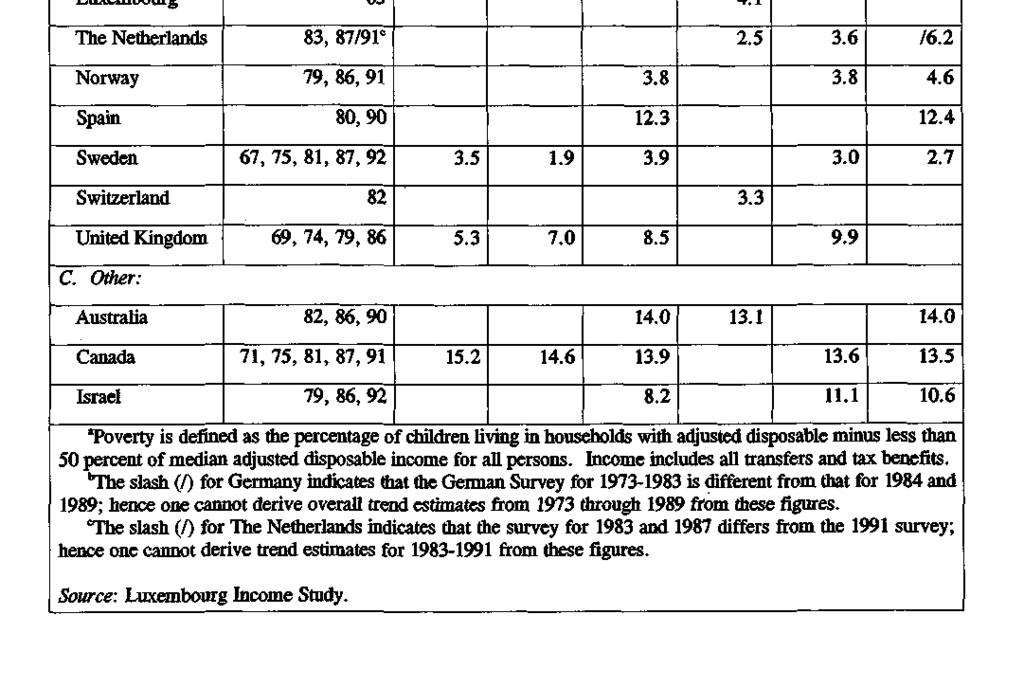
14 -13- not yet exist. However, LIS has made efforts to bring in earlier datasets from the later 1960s and 1970s, and also to pursue continual updating of datasets to the late 1980s and early 1990s, to provide a better data base for determining trends as well as levels of poverty in advanced nations. Table 6 provides multi-year data on child poverty rates. We have split the estimates into six periods: before 1971; ; ; ; ; and 1989 or later. For 15 nations, we have observations for child poverty at two or more points in time (although in some cases the time lapse is short). For eight of these countries we have observations at three points in time, and four or five points for a few. We must therefore interpret changes in a very tentative way. The 1980s was not a period in which the relative economic well-being of children in any of these countries was greatly improved. In two countries, there are hints of improvement from the 1970s through the 1980s to the 1990s (see Canada and Sweden in Table 6). But overall we have a picture of either stability or deterioration in children s economic well-being. In the United States, Israel and the United Kingdom, there is a clear trend toward a worsening situation for children. The 1990s results for Israel and the United Kingdom are not yet available. Over an 18 year period, from 1969 to 1986, the child poverty rate increased from 5.3 percent to 9.9 percent in the United Kingdom and in the United States from 13.1 percent to 22.9 percent, before falling to 21.5 percent in 1991 but rising again to 22.5 percent in In Israel, too, there was a deterioration during the first half of the 1980s. All of the Scandinavian countries have been able to keep child poverty below five percent, and many other European nations keep it in the 5 to 6 percent range over the 1980s and into the 1990s. 3 3 Note that in both Germany and the Netherlands, the datasets used in earlier periods are different from those used in later periods. Thus, the observed trend toward higher poverty rates in these nations may be attributed to different datasets, not to true increases in child poverty. Moreover, at worst, both of these nations have child poverty rates in the six percent range.
15
16 -15- At the very least, these multiple year observations suggest that the finding from the various LIS datasets are not artifacts of particular years of our samples. We find that the countries that have low poverty rates in our latest samples have low rates in the earlier periods as well. Those with middling rates are in the middle earlier and the higher rate countries are higher in early periods. Differences between Two-Parent and Solo-Mother Families In all countries studied, one s chance of being poor in a one-parent mother family is much higher than in two parent families. A child s chances of being poor in the United States differs dramatically depending on whether he or she lives in a one or two parent family (see columns 4, 5 and 6 of Table 7). A child in a two-parent United States family has only about an 11 percent chance of being poor as compared to a 60 percent chance if the child lives with a lone parent who is a mother. (Our analysis here is based on results for 18 countries; we have not yet made tabulations by family type for the other six countries discussed above.) Because so few children in most countries live in solo mother families, the difference across countries in the percent of children living in solo mother families has little to do with the difference in total child poverty rates. Only in the cases of Australia, Canada and the United States would total poverty rates be noticeably lower if the proportion of solo mother families was the average for these 17 countries. In other counties with more than 10 percent of children in solo mother families (Denmark, Norway, Sweden, United Kingdom), the poverty rates for single parent children are close enough to couples rates to not make a great deal of difference in the overall poverty rate. And demography is clearly not destiny; children in solo mother families in Denmark, Finland (7 percent poverty rate) and Sweden (5 percent poverty rate) do better than children in two parent families in many of the nations studied.
17
18 -17- Comparing the poverty rates of children in two parent families and in solo mother families, we note a group of countries with very low rates for both types: Sweden, Finland, Belgium, Denmark and Luxembourg. Another group has child poverty rates in solo mother families between roughly 20 and 40 percent but covers a wide range of rates in two parent families: Germany, Switzerland and Norway have quite low two parent rates. France has a middling rate and Israel, Italy and the United Kingdom higher rates for children in two-parent households. The combination of difference in the poverty rates of children in two parents compared to solo mother families and the smaller differences in the percentage of children who live in solo mother families has an important effect on the family type composition of the poor. In five countries, more than half of poor children live in solo mother families: the United States, Australia, Germany, Switzerland and Norway, with Canada coming close at around 40 percent. At the other extreme, fewer than 15 percent of poor children are in solo mother families in the Netherlands, Belgium, Italy and Israel. Children in solo mother families make up between 15 and 30 percent of the poor in Luxembourg, Ireland, France, the United Kingdom and Sweden. Thus the rate of feminization of poverty varies dramatically across these countries based on both the poverty rate for children in single parent units and on the percentage of children living in each type of unit. In summary, 1 of every 8 American children is a poor child living with a solo mother. Fewer than 1 in 100 children are in the same situation in Sweden, the Netherlands, Luxembourg, Italy, Finland and Belgium. In the United States, 1 of every 10 children is a poor child living in a two parent family and this ratio is not too different in three other countries: Ireland, Israel and Italy. In contrast, the ratio is about 1 in 50 in Finland, Germany, Norway, Sweden and Switzerland.
19 -18- The Role of Market Income and Income Transfers What are the roles of market income and transfers in producing the wide range in child poverty? To what extent would children be poor in the absence of transfers? Figures 9 and 10 plot the pre-government (market) income poverty rates of children (that is, poverty rates based on income from earnings and assets and before taxes and transfers including private transfers) against child poverty rates based on post-government (after tax and transfer or disposable) income. Two-Parent Units. For children in two parent families we find a wide range in pregovernment income poverty rates which can be summarized as follows: below 5 percent: Germany, Norway, Switzerland; between 5 percent and 10 percent: Finland, Luxembourg, the Netherlands; between 10 percent and 20 percent: Australia, Belgium, Canada, Denmark, Italy, Sweden, United States; and over 20 percent: France, Ireland, Israel and the United Kingdom (see the first three columns in Table 7). There is, similarly, a wide range in the degree to which market income poverty rates are reduced by transfers. The lines in the figure radiating from the origin indicate the extent of poverty reduction: (none, for no reduction), 25 percent, 50 percent, and 70 percent. In three countries, transfers reduce the poverty of children in two-parent families by 10 percent to 33 percent: Australia, Italy and the US. In nine countries, the reduction ranges from a little below half to not quite twothirds. Finally, in five countries the reductions are three-quarters or more: Finland, Belgium, France, Sweden and Denmark. The result is that the extremely low market income poverty rates for children in Norway and Switzerland are reduced to even lower rates by government programs, and the three countries with 5 to 10 percent market income based poverty rates find their disposable income rates reduced to below 5 percent. For the rest of the countries there is an even greater movement. Belgium has a higher market income poverty rate than the other European countries, but its transfers produce a very low disposable income rate of less than 5 percent. The shift for Canada is not as dramatic, but still considerable compared to the United States or Italy or Australia.
20 -19- There are also differences in the disposable income poverty rates among the countries with the highest market rates (above 20 percent). French children in two-parent families improve their situation a great deal through transfers, and children in the United Kingdom and Ireland improve more than those in Israel. Solo-Parent Units. The antipoverty effect of transfers for children in solo mother families is quite different from that of two-parent families (sec Figure 10). The pre-government poverty rates in all countries are very high. Only four have rates below 50 percent and two have rates close to 80 percent. Market income poverty rates for children in one-parent families are as follows: between 33 percent and 45 percent: Switzerland, Italy, Finland, Germany; between 55 percent and 62 percent: Luxembourg, Belgium, France, Denmark, Sweden, Norway, Germany, Israel; between 68 percent and 73 percent: Canada, United States, Australia, Ireland; and between 70 percent and 80 percent: Netherlands, United Kingdom. The antipoverty effect of transfers varies more widely across the countries in this case than for children in two-parent units. While only three counties had reductions in two-parent poverty of 75 percent or more, we find that much reduction for solo mothers children in six countries. However, there are also more countries with rates of poverty reduction around 25 percent or less for motheronly than for two-parent families. The result of this diversity in the proportion of children moved out of poverty by transfers is a very wide range in post-government income poverty rates. The five countries with postgovernment rates under 10 percent ranged across a fairly narrow range of market income rates: see Finland, Denmark, Belgium, Luxembourg and Sweden. We find greater diversity in market rates for the six countries with disposable income rates ranging from 14 percent (Italy) to 27 percent (Israel). Switzerland and Italy are among the nations with the lowest market based rates, Norway, France, and Israel are in the middle, and the United Kingdom has a high pre-government income based poverty rate for children in solo mother families. Disposable income poverty for children in motheronly families tends to be highest in those countries where the antipoverty reduction is only around 25 percent. The correlation between market income based poverty and disposable income based poverty among children
21 -20- in solo mother families is only 0.40, much less than the 0.73 rate for children living with two parents.

22
23

24

25
26
27

28
29
30
31
32 -31- BIBLIOGRAPHY Atkinson, A.B., L. Rainwater and T. Smeeding Income Distribution in Advanced Economies: The Evidence from The Luxembourg Income Study. Paris: OECD. Bradbury, B Family Size Equivalence and Survey Evaluations of Income and Well- Being. Journal of Social Policy 11: Buhmann, B., L. Rainwater, G. Schmaus, and T. Smeeding Equivalence Scales, Well- Being, Inequality and Poverty. Review of Income and Wealth, June: Citro, C, and R.T. Michael (eds.) Measuring Poverty: A New Approach. Washington, DC: National Academy Press. Coleman, J Social Capital in the Creation of Human Capital. American Journal of Sociology 94: S95-S120. Coleman, R., and L. Rainwater Social Standing in America. New York: Basic Books. Commission of the European Communities The Demographic Situation of the European Union. Report COM (94) 595 final. Brussels, December Social Protection in Europe, Directorate General for Employment, Industrial Relations and Social Affairs. Brussels. Förster, M Comparing Poverty in 13 OECD Countries: Traditional and Synthetic Approaches. Studies in Social Policy #10 (October 1993). Paris: OECD. Gottschalk, P., and T. Smeeding Cross-National Comparisons of Levels and Trends in Inequality. LIS Working Paper #127, May Hagenaars, A., K. De Vos and A. Zaidi Patterns of Poverty in Europe. Paper presented to the 23rd General Conference of the IARIW, St. Andrews, Canada, August. Hanratty, M., and R. Blank Down and Out in North America: Recent Trends in Poverty Rates in the U.S. and Canada. Quarterly Journal of Economics 10: Harrington, Michael The Other America: Poverty in the United States. London: Penguin Books. LIS User Guide User s Guide to The Luxembourg Income Study. LIS Working Paper No. 7, July.
33 -32- McLanahan, S., and G. Sandefur Growing Up with a Single Parent. Cambridge: Howard University Press. O'Hare, William What Does It Take to Get Along? American Demographics 12, 5: Organisation for Economic Co-operation and Development (OECD) New Orientations for Social Policy. Social Policy Studies No. 12. Paris: OECD. Rainwater, L What Money Buys. New York: Basic Books. Rainwater, L Poverty and Equivalence as Social Constructions. LIS Working Paper No. 91. Rainwater, Lee Poverty in American Eyes. Koelner Zeitschrift fuer Soziologie. Rainwater, L., and T. Smeeding Le Bien-Être Économique des Enfants: Une Perspective Comparatif. Population 6: Rainwater, Lee Poverty and the Income Package of Working Parents: The United States in Comparative Perspective. Children and Youth Services Review 17, 1-2: Rainwater, Lee Doing Poorly: The Real Income of American Children in Comparative Perspective. LIS Working Paper #127. Sen, A Inequality Reexamined. Cambridge: Harvard University Press. Smeeding, T U.S. Poverty and Income Security in a Cross-National Perspective: The War on Poverty: What Worked? Challenge (January/February): Smeeding, T., (ed.) Poor Children in Rich Countries. Syracuse, NY: Syracuse University and Russell Sage Foundation, mimeo. Smeeding, T., and Torrey Poor Children in Rich Countries. Science 242: Smeeding, T., L. Rainwater, and M. O Higgins. (eds.) Poverty, Inequality and Income Distribution in Comparative Perspective: The Luxembourg Income Study. London: Harvester Wheatsheaf; Washington, DC: Urban Institute Press. Smeeding, T., et al Noncash Income, Living Standards and Inequality: Evidence from the Luxembourg Income Study. Review of Income and Wealth (September): Smeeding, T., S. Danziger, and L. Rainwater The Western Welfare State in the 1990s: Toward a New Model of Anti-Poverty Policy for Families and Children. LIS Working Paper #126. Luxembourg: Luxembourg Income Study.
34 -33- Smeeding, T., and P. Gottschalk The International Evidence on Income Distribution in Modern Economies: Where Do We Stand? LIS Working Paper #137. Summers, R., and A. Heston The Penn World Table (Mark 5): An Expanded Set of International Comparisons, Quarterly Journal of Economics (May): Townsend, P Poverty in the United Kingdom. Harmondsworth: Penguin Books. U.S. Bureau of the Census Income Poverty and the Valuation of Noncash Benefits: Current Population Reports, Series P-60, No Washington, DC: U.S. Government Printing Office.
Widening of Inequality in Japan: Its Implications
 Widening of Inequality in Japan: Its Implications Jun Saito, Senior Research Fellow Japan Center for Economic Research December 11, 2017 Is inequality widening in Japan? Since the publication of Thomas
Where are the Middle Class in OECD Countries? Nathaniel Johnson (CUNY and LIS) David Johnson (University of Michigan)
 David Johnson (University of Michigan)") Where are the Middle Class in OECD Countries? Nathaniel Johnson (CUNY and LIS) David Johnson (University of Michigan) The Middle Class is all over the US Headlines A strong middle class equals a strong
Where are the Middle Class in OECD Countries? Nathaniel Johnson (CUNY and LIS) David Johnson (University of Michigan) The Middle Class is all over the US Headlines A strong middle class equals a strong
How does education affect the economy?
 2. THE ECONOMIC AND SOCIAL BENEFITS OF EDUCATION How does education affect the economy? More than half of the GDP growth in OECD countries over the past decade is related to labour income growth among
Is This Time Different? The Opportunities and Challenges of Artificial Intelligence
 Is This Time Different? The Opportunities and Challenges of Artificial Intelligence Jason Furman Chairman, Council of Economic Advisers The National Academies of Sciences, Engineering, and Medicine Washington,
U.S. Family Income Growth
 Figure 1.1 U.S. Family Income Growth Growth 140% 120% 100% 80% 60% 115.3% 1947 to 1973 97.1% 97.7% 102.9% 84.0% 40% 20% 0% Lowest Fifth Second Fifth Middle Fifth Fourth Fifth Top Fifth 70% 60% 1973 to
Inclusion and Gender Equality in China
 Inclusion and Gender Equality in China 12 June 2017 Disclaimer: The views expressed in this publication are those of the authors and do not necessarily reflect the views and policies of the Asian Development
GDP per capita was lowest in the Czech Republic and the Republic of Korea. For more details, see page 3.
 International Comparisons of GDP per Capita and per Hour, 1960 9 Division of International Labor Comparisons October 21, 2010 Table of Contents Introduction.2 Charts...3 Tables...9 Technical Notes.. 18
Convergence: a narrative for Europe. 12 June 2018
 Convergence: a narrative for Europe 12 June 218 1.Our economies 2 Luxembourg Ireland Denmark Sweden Netherlands Austria Finland Germany Belgium United Kingdom France Italy Spain Malta Cyprus Slovenia Portugal
OECD ECONOMIC SURVEY OF LITHUANIA 2018 Promoting inclusive growth
 OECD ECONOMIC SURVEY OF LITHUANIA 218 Promoting inclusive growth Vilnius, 5 July 218 http://www.oecd.org/eco/surveys/economic-survey-lithuania.htm @OECDeconomy @OECD 2 21 22 23 24 25 26 27 28 29 21 211
WORLDWIDE DISTRIBUTION OF PRIVATE FINANCIAL ASSETS
 WORLDWIDE DISTRIBUTION OF PRIVATE FINANCIAL ASSETS Munich, November 2018 Copyright Allianz 11/19/2018 1 MORE DYNAMIC POST FINANCIAL CRISIS Changes in the global wealth middle classes in millions 1,250
Globalization, Inequality and the Rich Countries of the G-20: Evidence from the Luxembourg Income Study (LIS)
") Globalization, Inequality and the Rich Countries of the G-20: Evidence from the Luxembourg Income Study (LIS) By Timothy M. Smeeding SPRC Discussion Paper No. 122 December 2002 Published by The Social
Globalization, Inequality and the Rich Countries of the G-20: Evidence from the Luxembourg Income Study (LIS) By Timothy M. Smeeding SPRC Discussion Paper No. 122 December 2002 Published by The Social
Lessons from the U.S. Experience. Gary Burtless
 Welfare Reform: The case of lone parents Lessons from the U.S. Experience Gary Burtless Washington, DC USA 5 April 2 The U.S. situation Welfare reform in the US is aimed mainly at lone-parent families
A COMPARISON OF ARIZONA TO NATIONS OF COMPARABLE SIZE
 A COMPARISON OF ARIZONA TO NATIONS OF COMPARABLE SIZE A Report from the Office of the University Economist July 2009 Dennis Hoffman, Ph.D. Professor of Economics, University Economist, and Director, L.
Taiwan s Development Strategy for the Next Phase. Dr. San, Gee Vice Chairman Taiwan External Trade Development Council Taiwan
 Taiwan s Development Strategy for the Next Phase Dr. San, Gee Vice Chairman Taiwan External Trade Development Council Taiwan 2013.10.12 1 Outline 1. Some of Taiwan s achievements 2. Taiwan s economic challenges
Trends in inequality worldwide (Gini coefficients)
") Section 2 Impact of trade on income inequality As described above, it has been theoretically and empirically proved that the progress of globalization as represented by trade brings benefits in the form
Section 2 Impact of trade on income inequality As described above, it has been theoretically and empirically proved that the progress of globalization as represented by trade brings benefits in the form
ISSUE BRIEF: U.S. Immigration Priorities in a Global Context
 Immigration Task Force ISSUE BRIEF: U.S. Immigration Priorities in a Global Context JUNE 2013 As a share of total immigrants in 2011, the United States led a 24-nation sample in familybased immigration
The Israeli Economy: Current Trends, Strength and Challenges
 The Israeli Economy: Current Trends, Strength and Challenges Dr. Karnit Flug Governor of the Bank of Israel 30.06.2017 1 GDP per capita Growth Rates 8 GDP per capita annual % change (2000-2018F) 6 4 2
Child and Family Poverty
 Child and Family Poverty Report, November 2009 Highlights In 2007, there were 35,000 (16.7%) children under age 18 living beneath the poverty line (before-tax Low Income Cut-off) in. has the third highest
Inclusive global growth: a framework to think about the post-2015 agenda
 Inclusive global growth: a framework to think about the post-215 agenda François Bourguignon Paris School of Economics Angus Maddison Lecture, Oecd, Paris, April 213 1 Outline 1) Inclusion and exclusion
OECD Health Data 2009 comparing health statistics across OECD countries
 OECD Centres Germany Berlin (49-3) 288 8353 Japan Tokyo (81-3) 5532-21 Mexico Mexico (52-55) 5281 381 United States Washington (1-22) 785 6323 AUSTRALIA AUSTRIA BELGIUM CANADA CZECH REPUBLIC DENMARK FINLAND
Immigration Reform, Economic Growth, and the Fiscal Challenge Douglas Holtz- Eakin l April 2013
 Immigration Reform, Economic Growth, and the Fiscal Challenge Douglas Holtz- Eakin l April 2013 Executive Summary Immigration reform can raise population growth, labor force growth, and thus growth in
Letter prices in Europe. Up-to-date international letter price survey. March th edition
 Letter prices in Europe Up-to-date international letter price survey. March 2014 13th edition 1 Summary This is the thirteenth time Deutsche Post has carried out a study, drawing a comparison between letter
HIGHLIGHTS. There is a clear trend in the OECD area towards. which is reflected in the economic and innovative performance of certain OECD countries.
 HIGHLIGHTS The ability to create, distribute and exploit knowledge is increasingly central to competitive advantage, wealth creation and better standards of living. The STI Scoreboard 2001 presents the
UNDER EMBARGO UNTIL 9 APRIL 2018, 15:00 HOURS PARIS TIME
 TABLE 1: NET OFFICIAL DEVELOPMENT ASSISTANCE FROM DAC AND OTHER COUNTRIES IN 2017 DAC countries: 2017 2016 2017 ODA ODA/GNI ODA ODA/GNI ODA Percent change USD million % USD million % USD million (1) 2016
CO3.6: Percentage of immigrant children and their educational outcomes
 CO3.6: Percentage of immigrant children and their educational outcomes Definitions and methodology This indicator presents estimates of the proportion of children with immigrant background as well as their
GDP per capita in purchasing power standards
 GDP per capita in purchasing power standards GDP per capita varied by one to six across the Member States in 2011, while Actual Individual Consumption (AIC) per capita in the Member States ranged from
INNOCENTI WORKING PAPER RELATIVE INCOME POVERTY AMONG CHILDREN IN RICH COUNTRIES
 UNICEF Innocenti Research Centre INNOCENTI WORKING PAPER RELATIVE INCOME POVERTY AMONG CHILDREN IN RICH COUNTRIES Jonathan Bradshaw, Yekaterina Chzhen, Gill Main, Bruno Martorano, Leonardo Menchini and
Luxembourg Income Study Working Paper Series
 Luxembourg Income Study Working Paper Series Working Paper No. 319 No Child Left Behind? Timothy Smeeding April 2002 Luxembourg Income Study (LIS), asbl DRAFT 4/11/02 No Child Left Behind? Timothy M. Smeeding
Europe in Figures - Eurostat Yearbook 2008 The diversity of the EU through statistics
 STAT/08/75 2 June 2008 Europe in Figures - Eurostat Yearbook 2008 The diversity of the EU through statistics What was the population growth in the EU27 over the last 10 years? In which Member State is
The Foreign-born Population in the EU and its contribution to National Tax and Benefit Systems. Andrew Dabalen World Bank
 The Foreign-born Population in the EU and its contribution to National Tax and Benefit Systems Andrew Dabalen World Bank Motivation Disagreements on the benefits of immigrants Welfarist view migrants are
A2 Economics. Standard of Living and Economic Progress. tutor2u Supporting Teachers: Inspiring Students. Economics Revision Focus: 2004
 Supporting Teachers: Inspiring Students Economics Revision Focus: 2004 A2 Economics Standard of Living and Economic Progress tutor2u (www.tutor2u.net) is the leading free online resource for Economics,
It s Time to Begin An Adult Conversation on PISA. CTF Research and Information December 2013
 It s Time to Begin An Adult Conversation on PISA CTF Research and Information December 2013 1 It s Time to Begin an Adult Conversation about PISA Myles Ellis, Acting Deputy Secretary General Another round
Civil and Political Rights
 DESIRED OUTCOMES All people enjoy civil and political rights. Mechanisms to regulate and arbitrate people s rights in respect of each other are trustworthy. Civil and Political Rights INTRODUCTION The
This document is available on the English-language website of the Banque de France
 JUNE 7 This document is available on the English-language website of the www.banque-france.fr Countries ISO code Date of entry into the euro area Fixed euro conversion rates France FR //999.97 Germany
Commentary: The Distribution of Income in Industrialized Countries
 Commentary: The Distribution of Income in Industrialized Countries Lawrence F. Katz Tony Atkinson has produced a first-rate paper carefully documenting recent trends in the distribution of income and earnings
Immigration Policy In The OECD: Why So Different?
 Immigration Policy In The OECD: Why So Different? Zachary Mahone and Filippo Rebessi August 25, 2013 Abstract Using cross country data from the OECD, we document that variation in immigration variables
An anatomy of inclusive growth in Europe*
 An anatomy of inclusive growth in Europe* Zsolt Darvas Bruegel and Corvinus University of Budapest * Based on a joint work with Guntram B.Wolff Inclusive growth: global and European lessons for Spain 31
Settling In 2018 Main Indicators of Immigrant Integration
 Settling In 2018 Main Indicators of Immigrant Integration Settling In 2018 Main Indicators of Immigrant Integration Notes on Cyprus 1. Note by Turkey: The information in this document with reference to
Russian Federation. OECD average. Portugal. United States. Estonia. New Zealand. Slovak Republic. Latvia. Poland
 INDICATOR TRANSITION FROM EDUCATION TO WORK: WHERE ARE TODAY S YOUTH? On average across OECD countries, 6 of -19 year-olds are neither employed nor in education or training (NEET), and this percentage
MEETING OF THE OECD COUNCIL AT MINISTERIAL LEVEL, PARIS 6-7 MAY 2014 REPORT ON THE OECD FRAMEWORK FOR INCLUSIVE GROWTH KEY FINDINGS
 MEETING OF THE OECD COUNCIL AT MINISTERIAL LEVEL, PARIS 6-7 MAY 2014 REPORT ON THE OECD FRAMEWORK FOR INCLUSIVE GROWTH KEY FINDINGS This document is published on the responsibility of the Secretary-General
Labour mobility within the EU - The impact of enlargement and the functioning. of the transitional arrangements
 Labour mobility within the EU - The impact of enlargement and the functioning of the transitional arrangements Tatiana Fic, Dawn Holland and Paweł Paluchowski National Institute of Economic and Social
Austerity and Gender Equality Policy: a Clash of Policies? Francesca Bettio University of Siena Italy ( ENEGE Network (
 Austerity and Gender Equality Policy: a Clash of Policies? Francesca Bettio University of Siena Italy (www.unisi.it) ENEGE Network (www.enege.eu) highlights Disentangling the impact of the crisis versus
Gender pay gap in public services: an initial report
 Introduction This report 1 examines the gender pay gap, the difference between what men and women earn, in public services. Drawing on figures from both Eurostat, the statistical office of the European
David Istance TRENDS SHAPING EDUCATION VIENNA, 11 TH DECEMBER Schooling for Tomorrow & Innovative Learning Environments, OECD/CERI
 TRENDS SHAPING EDUCATION DEVELOPMENTS, EXAMPLES, QUESTIONS VIENNA, 11 TH DECEMBER 2008 David Istance Schooling for Tomorrow & Innovative Learning Environments, OECD/CERI CERI celebrates its 40 th anniversary
Eurostat Yearbook 2006/07 A goldmine of statistical information
 25/2007-20 February 2007 Eurostat Yearbook 2006/07 A goldmine of statistical information What percentage of the population is overweight or obese? How many foreign languages are learnt by pupils in the
EDUCATION OUTCOMES EXPENDITURE ON EDUCATION INTERNATIONAL STUDENT ASSESSMENT TERTIARY ATTAINMENT
 EDUCATION OUTCOMES INTERNATIONAL STUDENT ASSESSMENT TERTIARY ATTAINMENT EXPENDITURE ON EDUCATION EXPENDITURE ON TERTIARY EDUCATION PUBLIC AND PRIVATE EDUCATION EXPENDITURE EDUCATION OUTCOMES INTERNATIONAL
Improving the accuracy of outbound tourism statistics with mobile positioning data
 1 (11) Improving the accuracy of outbound tourism statistics with mobile positioning data Survey response rates are declining at an alarming rate globally. Statisticians have traditionally used imputing
Relationship between Economic Development and Intellectual Production
 Relationship between Economic Development and Intellectual Production 1 Umut Al and Zehra Taşkın 2 1 umutal@hacettepe.edu.tr Hacettepe University, Department of Information Management, 06800, Beytepe Ankara,
Income Inequality in the United States Through the Lens of Other Advanced Economies
 Mia DeSanzo Wealth & Power Major Writing Assignment 3/3/16 Income Inequality in the United States Through the Lens of Other Advanced Economies Income inequality in the United States has become a political
Special Eurobarometer 471. Summary
 Fairness, inequality and intergenerational mobility Survey requested by the European Commission, Joint Research Centre and co-ordinated by the Directorate-General for Communication This document does not
Measuring Social Inclusion
 Measuring Social Inclusion Measuring Social Inclusion Social inclusion is a complex and multidimensional concept that cannot be measured directly. To represent the state of social inclusion in European
New York County Lawyers Association Continuing Legal Education Institute 14 Vesey Street, New York, N.Y (212)
") New York County Lawyers Association Continuing Legal Education Institute 14 Vesey Street, New York, N.Y. 10007 (212) 267-6646 Who is Who in the Global Economy And Why it Matters June 20, 2014; 6:00 PM-6:50
New York County Lawyers Association Continuing Legal Education Institute 14 Vesey Street, New York, N.Y. 10007 (212) 267-6646 Who is Who in the Global Economy And Why it Matters June 20, 2014; 6:00 PM-6:50
Upgrading workers skills and competencies: policy strategies
 Federation of Greek Industries Greek General Confederation of Labour CONFERENCE LIFELONG DEVELOPMENT OF COMPETENCES AND QUALIFICATIONS OF THE WORKFORCE; ROLES AND RESPONSIBILITIES Athens 23-24 24 May 2003
OECD Affordable Housing Database OECD - Social Policy Division - Directorate of Employment, Labour and Social Affairs
 HC2.1. LIVING SPACE Definitions and methodology Space is an important dimension of housing quality. Ample space for all household members can be defined in different ways (Indicator HC2.2 considers housing
Flash Eurobarometer 430. Summary. European Union Citizenship
 European Union Citizenship Survey requested by the European Commission, Directorate-General for Justice and Consumers and co-ordinated by the Directorate-General for Communication This document does not
Patterns of Economic Inequality in Western Democracies: Some Facts on Levels and Trends
 Patterns of Economic Inequality in Western Democracies: Some Facts on Levels and Trends Introduction by Andrea Brandolini, Banca d Italia, Economic Research Department Timothy M. Smeeding, Syracuse University
sanity, humanity and science post-autistic economics review
 sanity, humanity and science post-autistic economics review Issue no. 40, 1 December 2006 Subscribers: 9,410 from over 150 countries back issues at www.paecon.net Subscriptions are free. To subscribe,
Data Protection in the European Union. Data controllers perceptions. Analytical Report
 Gallup Flash Eurobarometer N o 189a EU communication and the citizens Flash Eurobarometer European Commission Data Protection in the European Union Data controllers perceptions Analytical Report Fieldwork:
Economics Of Migration
 Department of Economics and Centre for Macroeconomics public lecture Economics Of Migration Professor Alan Manning Professor of Economics and Director of the Centre for Economic Performance s research
EUROPEAN UNION CITIZENSHIP
 Flash Eurobarometer EUROPEAN UNION CITIZENSHIP REPORT Fieldwork: November 2012 Publication: February 2013 This survey has been requested by the European Commission, Directorate-General Justice and co-ordinated
EUROPEANS ATTITUDES TOWARDS SECURITY
 Special Eurobarometer 432 EUROPEANS ATTITUDES TOWARDS SECURITY REPORT Fieldwork: March 2015 Publication: April 2015 This survey has been requested by the European Commission, Directorate-General for Migration
Wages in utilities in 2010
 WAGEINDICATOR SUPPORT FOR BARGAINING IN THE UTILITIES SECTOR (WISUTIL) Supported by the European Commission in its Industrial Relations and Social Dialogue Program 1 Nov.2010-31 Oct.2011 (nr VS/2010/0382).
Income inequality the overall (EU) perspective and the case of Swedish agriculture. Martin Nordin
 perspective and the case of Swedish agriculture. Martin Nordin") Income inequality the overall (EU) perspective and the case of Swedish agriculture Martin Nordin Background Fact: i) Income inequality has increased largely since the 1970s ii) High-skilled sectors and
Income inequality the overall (EU) perspective and the case of Swedish agriculture Martin Nordin Background Fact: i) Income inequality has increased largely since the 1970s ii) High-skilled sectors and
IMF research links declining labour share to weakened worker bargaining power. ACTU Economic Briefing Note, August 2018
 IMF research links declining labour share to weakened worker bargaining power ACTU Economic Briefing Note, August 2018 Authorised by S. McManus, ACTU, 365 Queen St, Melbourne 3000. ACTU D No. 172/2018
SUMMARY. Migration. Integration in the labour market
 SUMMARY The purpose of this report is to compare the integration of immigrants in Norway with immigrants in the other Scandinavian countries and in Europe. The most important question was therefore: How
LANDMARKS ON THE EVOLUTION OF E-COMMERCE IN THE EUROPEAN UNION
 Studies and Scientific Researches. Economics Edition, No 21, 215 http://sceco.ub.ro LANDMARKS ON THE EVOLUTION OF E-COMMERCE IN THE EUROPEAN UNION Laura Cătălina Ţimiraş Vasile Alecsandri University of
Earnings Inequality: Stylized Facts, Underlying Causes, and Policy
 Earnings Inequality: Stylized Facts, Underlying Causes, and Policy Barry Hirsch W.J. Usery Chair of the American Workplace Department of Economics Andrew Young School of Policy Sciences Georgia State University
Earnings Mobility and Inequality in Europe
 Earnings Mobility and Inequality in Europe Ronald Bachmann Peggy David Sandra Schaffner EU-LFS and EU-SILC: 2nd European User Conference Mannheim March 31 - April 1, 2011 Introduction Motivation Motivation
Social Conditions in Sweden
 Conditions in Sweden Villa Vigoni Conference on Reporting in Europe Measuring and Monitoring Progress in European Societies Is Life Still Getting Better? March 9-11, 2010 Danuta Biterman The National Board
3.3 DETERMINANTS OF THE CULTURAL INTEGRATION OF IMMIGRANTS
 1 Duleep (2015) gives a general overview of economic assimilation. Two classic articles in the United States are Chiswick (1978) and Borjas (1987). Eckstein Weiss (2004) studies the integration of immigrants
NERO INTEGRATION OF REFUGEES (NORDIC COUNTRIES) Emily Farchy, ELS/IMD
 Emily Farchy, ELS/IMD") NERO INTEGRATION OF REFUGEES (NORDIC COUNTRIES) Emily Farchy, ELS/IMD Sweden Netherlands Denmark United Kingdom Belgium France Austria Ireland Canada Norway Germany Spain Switzerland Portugal Luxembourg
NERO INTEGRATION OF REFUGEES (NORDIC COUNTRIES) Emily Farchy, ELS/IMD Sweden Netherlands Denmark United Kingdom Belgium France Austria Ireland Canada Norway Germany Spain Switzerland Portugal Luxembourg
Special Eurobarometer 461. Report. Designing Europe s future:
 Designing Europe s future: Trust in institutions Globalisation Support for the euro, opinions about free trade and solidarity Fieldwork Survey requested by the European Commission, Directorate-General
Employment Outlook 2017
 Annexes Chapter 3. How technology and globalisation are transforming the labour market Employment Outlook 2017 TABLE OF CONTENTS ANNEX 3.A3 ADDITIONAL EVIDENCE ON POLARISATION BY REGION... 1 ANNEX 3.A4
Work and income SLFS 2016 in brief. The Swiss Labour Force Survey. Neuchâtel 2017
 03 Work and income 363-1600 SLFS 2016 in brief The Swiss Labour Force Survey Neuchâtel 2017 Published by: Information: Editors: Series: Topic : Original text: Translation: Layout: Graphics: Front page:
Context Indicator 17: Population density
 3.2. Socio-economic situation of rural areas 3.2.1. Predominantly rural regions are more densely populated in the EU-N12 than in the EU-15 Context Indicator 17: Population density In 2011, predominantly
Regional inequality and the impact of EU integration processes. Martin Heidenreich
 Regional inequality and the impact of EU integration processes Martin Heidenreich Table of Contents 1. Income inequality in the EU between and within nations 2. Patterns of regional inequality and its
A comparative analysis of poverty and social inclusion indicators at European level
 A comparative analysis of poverty and social inclusion indicators at European level CRISTINA STE, EVA MILARU, IA COJANU, ISADORA LAZAR, CODRUTA DRAGOIU, ELIZA-OLIVIA NGU Social Indicators and Standard
OECD SKILLS STRATEGY FLANDERS DIAGNOSTIC WORKSHOP
 OECD SKILLS STRATEGY FLANDERS DIAGNOSTIC WORKSHOP Dirk Van Damme Head of Division OECD Centre for Skills Education and Skills Directorate 15 May 218 Use Pigeonhole for your questions 1 WHY DO SKILLS MATTER?
The globalization of inequality
 The globalization of inequality François Bourguignon Paris School of Economics Public lecture, Canberra, May 2013 1 "In a human society in the process of unification inequality between nations acquires
Aid spending by Development Assistance Committee donors in 2015
 Aid spending by Development Assistance Committee donors in 2015 Overview of key trends in official development assistance emerging from the provisional 2015 Development Assistance Committee data release
TÁRKI Social Research Institute, 2006 Ildikó Nagy, 2006 Marietta Pongrácz, 2006 István György Tóth, 2006
 András Gábos. 2006. Gender Differences in Poverty in an International Comparison: An Analysis of the Laeken Indicators. in: Ildikó Nagy, Marietta Pongrácz, István György Tóth (eds.) Changing Roles: Report
The Extraordinary Extent of Cultural Consumption in Iceland
 1 Culture and Business Conference in Iceland February 18 2011 Prof. Dr. Ágúst Einarsson Bifröst University PP 1 The Extraordinary Extent of Cultural Consumption in Iceland Prof. Dr. Ágúst Einarsson, Bifröst
Emerging Asian economies lead Global Pay Gap rankings
 For immediate release Emerging Asian economies lead Global Pay Gap rankings China, Thailand and Vietnam top global rankings for pay difference between managers and clerical staff Singapore, 7 May 2008
Size and Development of the Shadow Economy of 31 European and 5 other OECD Countries from 2003 to 2013: A Further Decline
 January 31, 2013 ShadEcEurope31_Jan2013.doc Size and Development of the Shadow Economy of 31 European and 5 other OECD Countries from 2003 to 2013: A Further Decline by Friedrich Schneider *) In the Tables
How s Life in New Zealand?
 How s Life in New Zealand? November 2017 On average, New Zealand performs well across the different well-being indicators and dimensions relative to other OECD countries. It has higher employment and lower
8. REGIONAL DISPARITIES IN GDP PER CAPITA
 8. REGIONAL DISPARITIES IN GDP PER CAPITA GDP per capita varies significantly among OECD countries (Figure 8.1). In 2003, GDP per capita in Luxembourg (USD 53 390) was more than double the OECD average
Standard Note: SN/SG/6077 Last updated: 25 April 2014 Author: Oliver Hawkins Section Social and General Statistics
 Migration Statistics Standard Note: SN/SG/6077 Last updated: 25 April 2014 Author: Oliver Hawkins Section Social and General Statistics The number of people migrating to the UK has been greater than the
Special Eurobarometer 469. Report
 Integration of immigrants in the European Union Survey requested by the European Commission, Directorate-General for Migration and Home Affairs and co-ordinated by the Directorate-General for Communication
QGIS.org - Donations and Sponsorship Analysis 2016
 QGIS.org - Donations and Sponsorship Analysis 2016 QGIS.ORG received 1128 donations and 47 sponsorships. This equals to >3 donations every day and almost one new or renewed sponsorship every week. The
Extended Findings. Finland. ecfr.eu/eucoalitionexplorer. Question 1: Most Contacted
 Extended Findings Finland Preferences Question 1: Most Contacted Finland (2%) is not amongst the most contacted countries within the EU: Germany (22%), France (13%), the UK (11%), Poland (7%), Italy (6%),
Towards Consensus on a Decent Living Level in South Africa: Inequality beliefs and preferences for redistribution
 Towards Consensus on a Decent Living Level in South Africa: Inequality beliefs and preferences for redistribution Ben Roberts Democracy, Governance & Service Delivery (DSGD), Human Sciences Research Council
Regional and Sectoral Economic Studies
 PRODUCTION BY SECTOR IN THE EUROPEAN UNION: ANALISYS OF FRANCE, GERMANY, ITALY, SPAIN, POLAND AND THE UNITED KINGDOM, 2000-2005 GUISAN, M.C. * AGUAYO, E. Abstract: We analyze the evolution of sectoral
Educated Preferences: Explaining Attitudes Toward Immigration In Europe. Jens Hainmueller and Michael J. Hiscox. Last revised: December 2005
 Educated Preferences: Explaining Attitudes Toward Immigration In Jens Hainmueller and Michael J. Hiscox Last revised: December 2005 Supplement III: Detailed Results for Different Cutoff points of the Dependent
Flash Eurobarometer 364 ELECTORAL RIGHTS REPORT
 Flash Eurobarometer ELECTORAL RIGHTS REPORT Fieldwork: November 2012 Publication: March 2013 This survey has been requested by the European Commission, Directorate-General Justice and co-ordinated by Directorate-General
BUILDING RESILIENT REGIONS FOR STRONGER ECONOMIES OECD
 o: o BUILDING RESILIENT REGIONS FOR STRONGER ECONOMIES OECD Table of Contents Acronyms and Abbreviations 11 List of TL2 Regions 13 Preface 16 Executive Summary 17 Parti Key Regional Trends and Policies
POPULATION AND MIGRATION
 POPULATION AND MIGRATION POPULATION TOTAL POPULATION FERTILITY DEPENDENT POPULATION POPULATION BY REGION ELDERLY POPULATION BY REGION INTERNATIONAL MIGRATION IMMIGRANT AND FOREIGN POPULATION TRENDS IN
Luxembourg Income Study Working Paper Series
 Luxembourg Income Study Working Paper Series Working Paper No. 324 Regional Poverty and Income Inequality in Central and Eastern Europe: Evidence from the Luxembourg Income Study Michael Förster, David
UNDER EMBARGO UNTIL 10 APRIL 2019, 15:00 HOURS PARIS TIME. Development aid drops in 2018, especially to neediest countries
 Development aid drops in 2018, especially to neediest countries OECD Paris, 10 April 2019 OECD adopts new methodology for counting loans in official aid data In 2014, members of the OECD s Development
The Mystery of Economic Growth by Elhanan Helpman. Chiara Criscuolo Centre for Economic Performance London School of Economics
 The Mystery of Economic Growth by Elhanan Helpman Chiara Criscuolo Centre for Economic Performance London School of Economics The facts Burundi, 2006 Sweden, 2006 According to Maddison, in the year 1000
Territorial indicators for policy purposes: NUTS regions and beyond
 Territorial indicators for policy purposes: NUTS regions and beyond Territorial Diversity and Networks Szeged, September 2016 Teodora Brandmuller Regional statistics and geographical information unit,