Skill Mismatches in the EU: Immigrants vs. Natives
|
|
|
- Eustace Ross
- 5 years ago
- Views:
Transcription
1 DISCUSSION PAPER SERIES IZA DP No Skill Mismatches in the EU: Immigrants vs. Natives Sandra Nieto Alessia Matano Raul Ramos October 2013 Forschungsinstitut zur Zukunft der Arbeit Institute for the Study of Labor
2 Skill Mismatches in the EU: Immigrants vs. Natives Sandra Nieto AQR-IREA, University of Barcelona Alessia Matano AQR-IREA, University of Barcelona Raul Ramos AQR-IREA, University of Barcelona and IZA Discussion Paper No October 2013 IZA P.O. Box Bonn Germany Phone: Fax: Any opinions expressed here are those of the author(s) and not those of IZA. Research published in this series may include views on policy, but the institute itself takes no institutional policy positions. The IZA research network is committed to the IZA Guiding Principles of Research Integrity. The Institute for the Study of Labor (IZA) in Bonn is a local and virtual international research center and a place of communication between science, politics and business. IZA is an independent nonprofit organization supported by Deutsche Post Foundation. The center is associated with the University of Bonn and offers a stimulating research environment through its international network, workshops and conferences, data service, project support, research visits and doctoral program. IZA engages in (i) original and internationally competitive research in all fields of labor economics, (ii) development of policy concepts, and (iii) dissemination of research results and concepts to the interested public. IZA Discussion Papers often represent preliminary work and are circulated to encourage discussion. Citation of such a paper should account for its provisional character. A revised version may be available directly from the author.
3 IZA Discussion Paper No October 2013 ABSTRACT Skill Mismatches in the EU: Immigrants vs. Natives * The objective of this paper is to analyse and explain the factors behind the observed differences in skill mismatches (vertical and horizontal) between natives and immigrants in EU countries. Using microdata from the 2007 wave of the Adult Education Survey (AES), different probit models are specified and estimated to analyse differences in the probability of each type of skill mismatch between natives and immigrants. Next, Yun s decomposition method is used to identify the relative contribution of characteristics and returns to explain the differences between the two groups. Our analysis shows that immigrants are more likely to be skill mismatched than natives, being this difference much larger for vertical mismatch. In this case, the difference is higher for immigrants coming from non-eu countries than for those coming from other EU countries. We find that immigrants from non-eu countries are less valued in the EU labour markets than natives with similar characteristics, a result that is not observed for immigrants from EU countries. These results could be related to the limited transferability of the human capital acquired in non-eu countries. The findings suggest that specific programs to adapt immigrants human capital acquired in home country are required to reduce differences in the incidence of skill mismatch and a better integration in the EU labour markets. JEL Classification: J15, J24, J31 Keywords: immigrant overeducation, vertical mismatch, horizontal mismatch, human capital transferability Corresponding author: Raul Ramos Facultat d Economia i Empresa Universitat de Barcelona Avda. Diagonal Barcelona Spain rramos@ub.edu * The research leading to these results has received funding from the European Community s Seventh Framework Programme (FP7/ ) under grant agreement n o We make use of microdata from the European Commission, Eurostat, AES 2007 database made available by Eurostat under contract AES/2012/06. Eurostat has no responsibility for the results and conclusions reported here.
4 1. INTRODUCTION, BACKGROUND AND OBJECTIVES Human capital is one of the key factors in the determination of most of labour market outcomes (Card, 1999; Psacharopoulos and Patrinos, 2004). Consistent with this perspective, the analysis of the situation of immigrants within their host countries labour markets has also focused on their human capital. In particular, the two main empirical results from this literature the presence of a significant initial wage gap relative to native-born workers and the rapid wage growth from the moment of arrival can basically be explained by their human capital. Further, human capital partially explains most differences between immigrants and natives in terms of participation in labour market or job quality, among others. Thus, the disadvantage experienced by immigrants when they arrive in a new country can generally be attributed to the limited transferability of the human capital they have acquired in their home country. The reason may lie in the lower quality of the educational system there or in the different cultural background. Whatever the case, the relevant fact is that newly arrived immigrants seem to lack human capital adequate to the needs of the host country s labour market (Chiswick, 1978; Chiswick and Miller, 1985, 2009; Friedberg, 2000). Moreover, the explanatory factor behind the rapid growth in immigrant labour market outcomes over time, especially in wages, can be found in the accumulation of different types of human capital in the host country, which is particularly significant in the first years of residence in the host country (i.e., knowledge of the host country language). It is also noteworthy that this rapid growth in labour market outcomes generally leads to assimilation with the native population (Chiswick, 1978; Baker and Benjamin, 1994; Chiswick and Miller, 1995; and Bell, 1997; among others). Within this literature, recent studies have focused on the role played by educational (or vertical) mismatch and more specifically, on the level of overeducation. Although an extensive body of research has analysed overeducation 1 since the seminal contributions of Freeman (1976) and Duncan and Hoffman (1981), only a few recent studies have considered differences between natives and immigrants in terms of skill mismatches. 2 1 Surveys by Hartog (2000), Rubb (2003) and McGuiness (2006) have summarised the main findings of this literature. 2 See for instance, Piracha and Vadean (2012); Dustman and Glitz (2011) and Leuven and Oosterbeek (2011) 1
5 Overeducation is usually defined as the situation where workers have greater educational skills than their jobs require (Rumberger, 1981). The idea underpinning this new literature is thus that the imperfect portability of human capital acquired in origin countries forces immigrants to accept jobs requiring lower qualifications than those acquired in their country, making them formally overeducated workers. 3 The main outcomes of these recent studies can be summed up in two empirical regularities. First, there is evidence of a greater incidence of overeducation among immigrants than among the native population. Second, immigrant workers succeed in reducing the difference in overeducation with respect to the native population as their stay in the new country is prolonged, i.e. the phenomenon of assimilation takes place in overeducation (in a similar way to the one found for earnings assimilation). The literature on immigrant assimilation started with Chiswick (1978) who explained the lower marginal returns of immigrant human capital in the USA by the limited portability of their human capital. The results obtained for other economies confirm the differences between natives and immigrants in terms of the remuneration of their human capital, and also show the existence of assimilation processes (Chiswick and Miller, 1995, for Australia; Baker and Benjamin, 1994, for Canada; Bell, 1997, for the UK; Schmidt, 1992, and Constant and Massey, 2003, for Germany; and Longva and Raaum, 2003, for Norway). Shields and Wheatley Price (1998) and Friedberg (2000) obtain also interesting results separating the education acquired by immigrants in their country of origin from the education acquired in the country of destination. They find that the human capital imported from culturally distant countries receives a lower remuneration than the one acquired in the country of destination, and this remuneration differs depending on the characteristics of the origin country. Thus, the greater the distance in terms of language, culture, and economic development, the less portable the human capital acquired abroad becomes and the greater the initial inequality in the job market in comparison with members of the native population. Nonetheless, Duleep and Regets (1997) find out that those immigrants characterized by a lower portability of their human capital show a higher speed of assimilation. Other interesting results have been found when overeducation has been explicitly introduced into the analysis of the differences between natives and immigrants. Most of the literature concludes that immigrants have a higher rate of overeducation than natives 3 Possible differences in the quality of the different educational systems limit the comparison between native and immigrants workers. Nevertheless, many other factors (including a partial knowledge of the language, qualifications not being recognised and studies adapted to the new labour market) reduce the expected productivity of immigrants leading them to accept lower-paid jobs. 2
6 (Chiswick and Miller, 2010). For instance, using data from Australia, Kler (2006) and Green et al. (2007) point out that the incidence of overeducation is higher among immigrants from non- English-speaking countries, who also show lower returns for overeducation. In the case of the United Kingdom, Lindley and Lenton (2006) find a higher incidence of overeducation not just among immigrants but also for non-white members of the native-born population. Using data from United States, Chiswick and Miller (2008) claim that the educational mismatch explains almost two thirds of the differences in human capital returns between natives and immigrants. In the analysis of the incidence of overeducation among immigrants, other results related to the degree of transferability of human capital acquired in the origin country and the process of assimilation are also interesting. In particular, Chiswick and Miller (2007) find that the greater the work experience in the country of origin, the greater the probability of overeducation in the United States, which indicates low transferability not only of schooling but also of work experience acquired in origin countries. Sanromá et. al (2008) point out that immigrants living in Spain accumulate knowledge and experience that are perfectly adapted to the local labour market, thus making for an easier assimilation process that reduces the intensity of over-education. However, the pace of assimilation is notably slow -so that around fifteen years of living in Spain would be necessary to eliminate the educational mismatch- and differs depending on the origin country. Using data from New Zealand, Poot and Stillman (2010) also conclude that it is relevant to control for origin heterogeneity when analysing the pace of assimilation of immigrants in terms of overeducation. Last, Nielsen (2007) shows that overeducation in Denmark affects immigrants with education acquired abroad more than it does for natives and immigrants who have acquired their education in Denmark. According to this author, this fact reveals the partial portability of human capital acquired in migrants origin countries. Furthermore, immigrants with education acquired in their own country reduce their overeducation level as they increase their effective work experience in Denmark. Thus, they successfully assimilate. As for the returns to years of overeducation, Nielsen shows that immigrants who have studied abroad have the lowest returns, followed by immigrants with Danish qualifications, and by the native-born population who enjoy the highest returns On the other hand, there are some studies that have not found any evidence of a successful assimilation process by immigrants in the host country. Dell Aringa and Pagani (2010) shows that the catch-up by foreigners in Italy seems unachievable, even once they have adapted their skills to the host country s labour market. Comparing data from 25 countries, the OECD (2007) obtains similar results in most of the countries. A similar conclusion 3
7 is found by Aleksynska and Tritah (2013) when analysing data from the European Social Survey for 22 European countries for the period Most of these papers consider vertical mismatch, i.e. mismatch between worker s educational level and the one required for their job, as an indicator of skill mismatch. However, there are other indicators of skill mismatch that have not been used until now in the analysis of immigrants. In this paper, besides vertical mismatch, we are going to consider horizontal mismatch, which measures the degree of adjustment between the workers educational field and the one required for their job, as another form of skill mismatch. 4 With the purpose of analysing the role played by these two kinds of skill mismatches on native and immigrant population, we use a database which allows us to measure both vertical and horizontal mismatches. To the best of our knowledge, there are no previous studies that have analysed both types of skill mismatches separately for natives and immigrants using homogeneous information for a wide group of European Union countries. Taking this into account, the aim of this paper is twofold. First, we examine the determinants of being in a situation of vertical or horizontal mismatch for natives and immigrants from EU countries and from non-eu countries, focusing also on the process of assimilation. Second, we try to identify the explaining factors behind the observed differences in the probability of being mismatched between natives and both types of immigrants. The rest of the paper is organized as follows. Section 2 describes the database and defines the variables of interest. Section 3 shows descriptive evidence of the incidence of vertical and horizontal mismatches for natives and immigrants, focusing also on the analysis of the assimilation process of immigrants. Section 4 explains the applied methodology and shows the results. Last, section 5 summarises the findings of previous sections and point out the main policy conclusions of the analysis. 2. DATA SOURCES AND VARIABLES DEFINITION 2.1. Adult Education Survey We use microdata from the Adult Education Survey (AES) provided by Eurostat. It is a survey addressed to private households with members between 25 and 64 years old. The survey has 4 For instance, Robst (2007) and Wolbers (2003) use this measure as indicator of skill mismatch. 4
8 been carried out in 29 countries between 2005 and 2008 and the reference year is The main objective of the survey is to study lifelong learning, i.e., those training and learning activities that the adult population performs with the objective of improving or extending their knowledge, skills and competences from a personal, civil, social or work-related perspective. This database is particularly appropriate for our analysis because, as far as we know, is the only one that allows us measuring both vertical and horizontal mismatch in a homogeneous way for a wide set of European Union countries and making comparisons between immigrant (from EU countries and from non-eu countries) and native workers. As we focus our interest on immigrants living in EU countries, we only consider those countries where immigration is a relevant phenomenon (more than 4% of total population). Thus, as shown in Figure 1, we do not consider Bulgaria, Poland, Romania and Slovakia. We also have excluded from the analysis Hungary and the Netherlands because the immigrant population reported in the Adult Education Survey is underrepresented when compared with aggregate data from Eurostat 5.We also exclude Finland, Italy and the United Kingdom from the analysis because in their national surveys some relevant information for our analysis are missing (in particular, immigrants years of residence in the host country). So, after these restrictions, we finally consider the following 15 European Union countries in the analysis: Austria, Belgium, Cyprus, Czech Republic, Germany, Denmark, Estonia, Spain, France, Greece, Latvia, Lithuania, Portugal, Sweden and Slovenia. We restrict our analysis to men and women employed (excluding armed forces employees) at the time of the survey with reliable information about their occupation and level and field of education. We exclude from the analysis individuals below the ISCED 3 education level since the variable field of education is only defined for individuals with education levels higher than ISCED 2. The final sample consists of 30,149 native born workers and 2,699 immigrant workers, of which 929 come from European Union countries and 1,770 come from non-european Union countries. FIGURE 1 5 Immigrant population in AES is 4.8% in the Netherlands and 1.6% in Hungary while these percentages correspond in 11.1% and 4.3%, respectively, according to Eurostat data. 5
9 The variables used in the analysis are related to personal and job characteristics. As for personal characteristics, we use information related to the country of residence, gender, age, nationality, years of residence in the host country, level and type of education and participation in non-formal education activities during the last 12 months. As for job characteristics, we consider information about the tenure in the firm where they are currently employed, the economic activity of the firm, and the size of the firm. We also consider other variables related to personal and job characteristics such as the number of members of the household, children at home (13 years old or less) and the type and duration of the contract 6. Descriptive statistics for these variables are shown in Table A.1 of the Annex Measuring skill mismatches Three different methods have been proposed in the literature to measure vertical mismatch: objective, subjective and statistical method (in terms of the mean and the mode). Each procedure has its own advantages and weaknesses. 7 As a consequence, the used method generally depends on the nature of the data available. The objective method is based on dictionaries of jobs, compiled by job analysts who determine what level and type of education workers should have in order to perform a certain job. A person is then overeducated if their level of education is higher than the level the analysts define to be ideal for the occupation. The subjective method takes into account the perception of the workers to determine the educational mismatch. Last, the version of the statistical method based on the mean (Verdugo and Verdugo, 1989) considers that workers are overeducated if they have more years of education than the mean of the years of education (plus one standard deviation) of the workers in that occupation. Nevertheless, Kiker et al. (1997) propose the use of the mode instead of the mean; so they consider as overeducated a person who has more years of education than the mode of years of education in the job they perform. As for horizontal mismatch, most studies have applied similar methods to the ones used to analyse vertical mismatch. In particular, they use similar approaches but substitute the variable years of education with the variable field of education. In this paper, we use the statistical method in terms of the mode for two reasons. First, we cannot use the objective method because, unfortunately, this kind of indicator is not available for most countries, as 6 The latter information is not available for Denmark, Greece and Slovenia. 7 For a discussion, see Hartog (2000). 6
10 massive efforts are needed to build these dictionaries, which can easily become obsolete due to occupational change. We can neither use the subjective method because the Adult Education Survey does not provide this information. So, we measure vertical and horizontal mismatch using the statistical method based on the mode. The Adult Education Survey provides the needed information: occupations, educational levels and fields of education. It is worth mentioning that as we are working with immigrants from countries characterized by heterogeneous educational systems, we measure vertical mismatches considering the level of education instead of the years of schooling. With this way of proceeding, we expect to minimize potential measurement errors that can derive from the comparison of very heterogeneous educational systems. Taking into account these previous considerations, we define both types of mismatches as follows: workers will have vertical mismatch (overeducation) if their level of education is higher than the mode of the native workers level of education within each occupation whereas workers will have horizontal mismatch if their field or type of education is different from the mode of the native workers field of education within each occupation. 3. DESCRIPTIVE EVIDENCE In this section, we carry out a descriptive analysis on the differences between natives and immigrants regarding horizontal and vertical skill mismatches. The percentage of natives, immigrants from EU countries and immigrants from non-eu countries who show vertical and horizontal mismatch are displayed in figures 2 and 3, respectively. Some interesting insights can be derived from these figures. First, it is worth noting that the percentages of horizontal mismatch are higher than the percentages of vertical mismatch in all groups (39-46 versus respectively). Second, figure 2 shows that 24% of natives are overeducated whereas this percentage is 31% for immigrants from EU countries and 35% for immigrants coming from other countries. Nevertheless, in figure 3 we can see that the percentage of horizontal mismatch for natives and immigrants from EU countries is around 40% for both groups whilst for immigrants from countries outside EU is higher, 46%. Although the incidence of horizontal mismatch is higher than the incidence of vertical mismatch for all groups, we observe more differences between natives and immigrants in the incidence of vertical mismatch. FIGURES 2 and 3 7
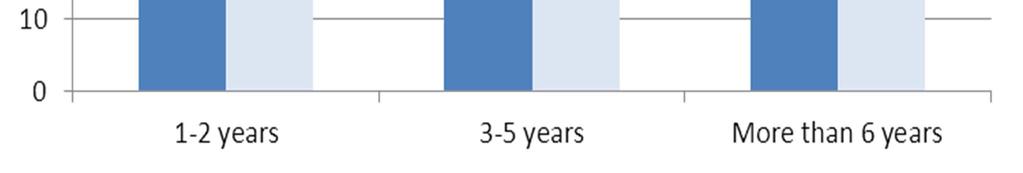
11 Focusing only on the immigrant population, we can see some interesting differences depending on the years of residence in their host country. Figures 4 and 5 show, respectively, the percentage of immigrant workers with vertical and horizontal mismatch by years of residence in the host country. In figure 5 we see that the incidence of horizontal mismatch decreases for both groups of immigrants as their years of residence increase. This result could be interpreted as evidence of immigrant assimilation. The outcomes are different, however, in relation to vertical mismatch (Figure 4). In fact, while for immigrants from countries outside the EU, the incidence of overeducation also reduces as the years of residence of these immigrants increase, the same is not valid for immigrants coming from EU countries. In particular, immigrants who reside less than 2 years in the host country present a lower percentage of overeducation than immigrants who reside between 3 to 5 years. In this case, it seems that the assimilation process in the first 5 years in the host country is not as clear for immigrants from EU countries as for the others. FIGURES 4 and 5 The descriptive analysis carried out in this section does not consider the effect of the characteristics of the individuals on the differences in overeducation. This aspect is considered in the following section. 4. METHODOLOGY AND RESULTS 4.1. Methodology In order to know whether there are differences in the probability of being overeducated and in the probability of having horizontal mismatch between natives and immigrants after controlling for observable characteristics, we estimate two binomial probit models. ( Xβ ) prob( V_ MISM) = Φ (1) ( Xβ ) prob( H_ MISM) = Φ (2) 8
12 where prob(v_mism) and prob(h_mism) denote the probability of being overeducated and the probability of having horizontal mismatch respectively, Φ is the standard normal cumulative distribution function, X represents the set of observable characteristics and β is the coefficients vector. The explanatory variables can be clustered in two groups. The first one is related to personal characteristics of individuals such as gender, age, immigrant condition (also by distinguishing immigrants from EU countries and from non-eu countries), years of residence in the host country, level of education (ISCED 3, ISCED 4 and ISCED 5 & 6), type or field of education (8 categories 8 ) and whether the workers have followed any non-formal education activity in the last 12 months. As we focus our interest on immigrants and their process of assimilation, we also include interactions between the variables related to their different origins (EU and non-eu countries) and their years of residence. The second group of characteristics is related to job characteristics such as tenure in the firm where they are currently employed (in years), economic activity of the firm (5 categories 9 ) and firm size (small: firms with 10 or less workers; big: firms with more than 10 workers). We also include country fixed-effects and controls for urban size. To decompose the differences in the probability of having vertical (horizontal) mismatch between immigrants and natives, we then apply Yun s (2004) methodology that is composed by two steps. The first one consists in estimating equation (1) separately for immigrants and natives: 10 ( β ) prob( V_ MISM) I = Φ X I I (3) ( β ) prob( V _ MISM) N = Φ X N N (4) The second step consists in decomposing the mean difference between immigrants (I) and natives (N) in the probability of having vertical (horizontal) mismatch as: 8 Education: Teacher training and education science / Humanities: Humanities, languages and arts; Foreign languages / Social Science: Social Science, business and law / Science: Science, mathematics and computing / Engineering: Engineering, manufacturing and construction. / Agriculture: Agriculture and veterinary. / Health: Health and welfare. / Services: Services. 9 Industry, agriculture, construction, market services and non-market services. 10 It is worth mentioning that in this kind of analysis it is not possible to include information on the years of residence as this characteristic is not shared also by natives. 9
13 [ Φ( X β ) Φ( X β )] + [ Φ( X β ) Φ( X β )] prob( V _ MISM) I prob( V _ MISM) N = I I I N I N I I (5) E C The component labelled E refers to the part of the difference in the probability of having a vertical (horizontal) mismatch between immigrants and natives due to differences in the observable characteristics. On the other hand, the C component refers to the part of this difference due to differences in coefficients (returns to characteristics). The method also proposes a detailed decomposition that allows understanding the unique contribution of each predictor to each component of the difference. As in the Oaxaca decomposition, Yun (2004) also highlights the need to normalize dummy variables as the results of the decomposition method are not invariant to the choice of the reference category. This correction is used in this paper Results The marginal effects of the probability of being overeducated (vertical mismatch) are shown in table 1. Columns (1) and (2) only include some personal characteristics as explanatory variables while in columns (3) to (5) additional controls are added sequentially. TABLE 1 Results from column (1) clearly show that immigrants are more likely to be overeducated than natives after controlling for some personal observable characteristics (the difference is of 44.4 percentage points). However, the negative sign of the variable years of residence indicates that the more are the years in the host country the less is the probability to be overeducated. For each additional year of residence in the host country, the probability of being overeducated is reduced by 2.8 percentage points. So, there seems to be an assimilation process in the host country in terms of overeducation. In column (2) we introduce two different dummies for immigrants in order to distinguish between immigrants coming from EU countries and immigrants coming from non-eu countries. We can see that immigrants from 10
14 non-eu countries are more likely to be overeducated than immigrants from EU countries. Concerning the process of assimilation of both types of immigrants, the results for the interactions between years of residence and immigrant dummies show that an additional year of residence reduces the probability to be overeducated for immigrants from outside EU countries more than for those coming from EU countries. In particular, the probability to be overeducated for an immigrant from EU country is reduced by 2.3 percentage points for each year of residence in the host country while this reduction is equal to 3.2 percentage points for immigrants from countries outside EU. Therefore, although immigrants from countries outside the EU have a higher probability to be overeducated, their process of assimilation is faster than the one for immigrants from EU countries. These differences between groups hold when additional personal and job controls are included in columns (3) to (5), although the coefficients are slightly reduced as more controls are included. It is important to notice that, as previously explained, column (5) includes some additional control variables that are not available for Denmark, Greece and Slovenia. We show this model just to check whether the inclusion of these variables change the impact of our variables of interest. The inclusion of these additional control variables does not change the main results of the variables related to immigrants. The marginal effects of the probit estimation related to the probability of having horizontal mismatch are shown in table 2. As in previous estimation, columns (1) and (2) include only some control variables while in columns (3) to (5) additional explanatory variables are included. TABLE 2 Column (1) shows that the probability of having a horizontal mismatch is 18 percentage points higher for immigrants than for natives. It is also worth noting that the difference in the probability of horizontal mismatch between immigrants and natives is much lower than the difference in the probability of overeducation (which is equal to 44.4 percentage points). Regarding the years of residence in the host country, we can see that the probability of having horizontal mismatch is only reduced by 1 percentage point for each additional year and this effect is also not statistically significant. Results from column (2) show that immigrants from non-ue countries are more likely to have horizontal mismatch than 11
15 natives (19.5 percentage points of difference). On the other hand the difference in the probability of horizontal mismatch between natives and immigrants from EU countries is not significant. Moreover, the interactions between years of residence and both types of immigrants are not significant. When additional variables are included (columns (3) to (5)), the higher probability of horizontal mismatch of immigrants from non-eu countries is slightly reduced (14.8 percentage points) but remains statistically significant. Once these differences between natives and immigrants in the probability of overeducation and horizontal mismatch have been detected, we apply the Yun decomposition (Yun, 2004) method in order to try to explain them. Given that there are no differences statistically significant in the probability of having horizontal mismatch between immigrants from UE and natives, we do not decompose this difference. This decomposition helps us identifying which factors influence the differences in the probability of being overeducated (or horizontal mismatched) between immigrants and natives. In particular, the method allows us detecting whether the differences in the probability of being overeducated (horizontal mismatched) between natives and immigrants are due to differences in the observable characteristics (worse endowment of human capital or worse job characteristics) or to differences in the returns to these characteristics between the two groups. Table 3 shows the aggregated results of Yun s (2004) decomposition. 11 From this table we can see that the differences in the probability of being overeducated between both types of immigrants and natives are statistically significant and consistent with the differences in the percentages of overeducation between groups observed in figure 2. The same consistency can be observed for the difference in the percentages of horizontal mismatch between immigrants from non-eu countries and natives and the ones observed in figure 3. In particular, we obtain that the difference in the probability of overeducation is of 7 percentage points for immigrants from EU countries, and of 11 percentage points when immigrants from non-eu countries are compared to natives. On the other hand, the horizontal mismatch s probability difference between non-eu countries and natives is of 7 percentage points. In both vertical and horizontal mismatch, immigrants experience a higher probability of being mismatched, but the causes of these differences differ between groups. In fact, in the case of the difference in the probability of being overeducated between immigrants from EU countries and natives, we can see that the 52% of this difference is explained by differences in characteristics. So, immigrants from EU countries have a higher probability of being 11 The results of the detailed decomposition are shown in Table A.2. in the Annex. 12
16 overeducated partly because they have worst observable characteristics than natives. Also, the 48% of this difference is due to differences in coefficients, even if the component is statistically significant only at the 10% level. Therefore, immigrants from EU and natives have a higher probability of being overeducated also because they are not equally remunerated (detailed Yun decomposition presented in table A.2. shows that each observed variable is significant to explain this difference). Concerning the difference in the probability of being overeducated between immigrants from non-eu countries and natives, the 87% of this difference can be explained by differences in coefficients (and it is statistically significant). This means that immigrants from non-eu countries are not remunerate at the same way than natives, while differences in characteristics do not play an important role. The detailed decomposition shows that the age of immigrants is very important to explain this difference. In fact, age could be an indicator of general human capital acquired in home country, so it may indicates that the general human capital of immigrants is worse valued than the one of natives. This may indicate a limited transferability of their human capital to the host country. Finally, the differences in the probability of horizontal mismatch between immigrants from non-eu countries and natives are due to differences in coefficients (90%). Detailed decomposition results show that this difference is highly related to the immigrants field of education. Immigrants who have coursed humanities or education studies are worse valued than natives who have studied the same fields. In this case, it may be also explain by a limited transferability of their human capital acquired in home country in general field of study (education and human studies). TABLE 3 5. FINAL REMARKS In this paper we have analysed differences in skill mismatches between immigrants and natives in EU countries. Using microdata from the Adult Education Survey (AES), we have analysed the incidence of different types of skill mismatches (vertical and horizontal) among native and immigrant workers. Our results show that immigrants are more likely to be overeducated than natives, and that this effect is higher for immigrants from non-eu countries than for those from other EU countries, although the pace of the assimilation process in the host country is faster for the 13
17 first group. On the other hand, we do not find such striking evidence in the case of horizontal mismatch. In particular, results show that only immigrants from non-eu countries have a higher probability of horizontal mismatch than natives. However, this effect does not vary when years of residence in host country increase. Applying Yun s decomposition, we also find that immigrants from the EU have a higher probability of being overeducated than natives because they are characterized by both worse observable characteristics and by a lower remuneration of (return to) the these characteristics, whereas results for immigrants from non-eu countries (also for horizontal mismatch) suggest that the gap is almost entirely explained by differences in the remuneration of observable characteristics. This result points out that especially immigrants from non-ue countries may have a limited transferability of their human capital that pushes their situation of overeducation and horizontal mismatch in the host country. To sum up, our results confirm that immigrants experience a higher overeducation penalty than natives due to the imperfect transferability of the human capital acquired in their origin countries. However, immigrants accumulate knowledge and experience in the host country that adapt to the local labour market, thus facilitating an assimilation process that reduces the intensity of overeducation. The pace of assimilation however is notably slow for immigrants. Therefore there is a certain risk that immigrants from outside the European Union remain permanently trapped in bad jobs, regardless of their levels of education. Taking into account the wage consequences of overeducation, this last result implies that the wage gap between native and immigrants will not disappear after several years of residence in the host country. Policy actions should focus on three different aspects: first, incorporating in the migration policy formal criteria related to educational levels and to the match with the current needs in the labour market (i.e., like the Australian points system); second, trying to design a system of assessment and recognition of foreign-acquired educational degrees in order to give an appropriate signal to the labour market and, third, providing publicly-provided informal training to recently arrived immigrants with appropriate skills in order to improve the transferability of their skills to the new labour market. 14
18 6. REFERENCES Aleksynska, M. and Tritah, A. (2013), Occupation-Education Mismatch of Immigrant Workers in Europe: Context and Policies, Economics of Education Review, 36, pp Baker, M. and Benjamin, D. (1994), The Performance of Immigrants in the Canadian Labor Market, Journal of Labor Economics, vol. 12(3), pp Bell, B. (1997), The Performance of Immigrants in the United Kingdom: Evidence from the GHS. Economic Journal, vol. 107(441), pp Card, D. (1999), Causal Effect of Education on Earnings, in Ashenfelter O, Card D (dir.), Handbook of Labor Economics, vol. 3, Elsevier Science: Amsterdam; Chiswick, B. R. (1978), The Effect of Americanization on the Earnings of Foreign-born Men, Journal of Political Economy, vol. 86(5), pp Chiswick, B. R. and Miller, P. (1985), Immigrant Generation and Income in Australia, Economic Record, vol. 61(173), pp Chiswick, B. R. and Miller, P. (1995), The endogeneity between language and earnings: an international analysis, Journal of Labor Economics, vol. 13(2), pp Chiswick, B. R. and Miller, P. (2007), The International Transferability of Immigrants Human Capital Skills, IZA Discussion paper n. 2670, March 2007, 27 p. Chiswick, B. and Miller, P. (2008), Why is the payoff to schooling smaller for immigrants?, Labour Economics, vol. 15, pp Chiswick, B. and Miller, P. (2009), The International Transferability of Immigrants Human Capital Skills, Economics of Education Review, vol. 28 (2), pp Chiswick, B. and Miller, P. (2010), The Effects of Educational-Occupational Mismatch on Immigrant Earnings in Australia, with International Comparisons, International Migration Review, vol. 44(4), pp Constant, A. and Massey, D. (2003), Self-selection, earnings, and out-migration: A longitudinal study of immigrants to Germany, Journal of Population Economics, vol. 16, pp Dell Aringa. C. and Pagani, L. (2010), Labour Market Assimilation and Over Education: The Case of Immigrant Workers in Italy, Quaderni dell Istituto di Economia dell Impresa e del Lavoro, 57. Duleep, H. and Regets, M. (1997), The Decline in Immigrant Entry Earnings: Less Transferable Skills or Lower Ability? The Quarterly Review of Economics and Finance, vol. 37, Special Issue, pp
19 Duncan, G. and Hoffman, S. (1981), The Economic Value of Surplus Education, Economics of Education Review vol. 1 (1), pp Dustman, C. and Glitz, A. (2011), Migration and Education, in Handbook of the Economics of Education, vol. 4, pp Freeman, R. B. (1976), The Overeducated American, London: Academic Press. Friedberg, R. (2000), You Can t Take It with You? Immigrant Assimilation and the Portability of Human Capital, Journal of Labor Economics, vol. 18, n. 2, pp Green, C., Kler, P. and Leeves, G. (2007), Immigrant overeducation: Evidence from recent arrivals to Australia, Economics of Education Review, 26, pp Hartog, J. (2000), Over-education and earnings: where are we, where should we go?, Economics of Education Review, vol. 19, pp Kiker, B.F., Santos, M.C. and Mendes de Oliveira, M. (1997), Overeducation and Undereducation: Evidence for Portugal, Economics of Education Review, vol. 16 (2), pp Kler, P. (2006), Overeducation among tertiary educated immigrants to Australia: A longitudinal study, Labour Economics Research Group, University of Queensland, Discussion Paper n. 9, January 2006, 39 p. Leuven, E. and Oosterbeek, H. (2011), Overeducation and Mismatch in the Labor Market in Handbook of the Economics of Education, vol. 4, pp Lindley, J. and Lenton, P. (2006). The Overeducation of UK Immigrants: Evidence from the Labour Force Survey, Sheffield Economic Research Paper Series n , 20 p. Longva, P. and Raaum, O. (2003), Earnings assimilation of immigrants in Norway - A reappraisal, Journal of Population Economics, vol. 16, pp Mcguinness, S. (2006), Overeducation in the labour market, Journal of Economic Surveys, Vol. 20 (3), pp Nielsen, Ch. P. (2007), Immigrant Overeducation: Evidence from Denmark, World Bank Policy Research Working Paper 4234, May 2007, 54 p. OECD (2007), International Migration Outlook, Annual Report OECD, Paris. Piracha, M. and Vadean, F. (2012), Migrant Educational Mismatch and the Labour Market, IZA DP Poot, J. and Stillman, S. (2010), The Importance of Heterogeneity When Examining Immigrant Education-Occupation Mismatch: Evidence from New Zealand, IZA DP Psacharopoulos, G. and Patrinos, H. A. (2004), Returns to investment in education: A further update, Education Economics, vol. 12(2), pp
20 Robst, J. (2007), Education and job match: The relatedness of college major and work, Economics of Education Review, vol. 26(4), pp Rumberger, R. (1981), Overeducation in the US Labor Market, Praeger, New York. Rubb, S. (2003), Overeducation in the labor market: A comment and re-analysis of a metaanalysis, Economics of Education Review, vol. 22 (6), pp Sanromá, E., Ramos, R. and Simón, H. (2008), The Portability of Human Capital and Immigrant Assimilation: Evidence for Spain, IZA Discussion Paper No Schmidt, C. (1992), Country of origin differences in the earnings of German immigrants, Discussion Paper 92-29, University of Munich. Shields, M. and Wheatley Price, S. (1998), The earnings of male immigrants in England: evidence from the quarterly LFS, Applied Economics, vol. 30, pp Verdugo, R. and Verdugo, N. (1989), The impact of surplus schooling on earnings, Journal of Human Resources, vol. 24 (4), pp Wolbers, M. (2003), Job Mismatches and their Labour-Market Effects among School-Leavers in Europe, European Sociological Review, vol. 19 (3), pp Yun, M. (2004), Decomposing differences in the first moment, Economics Letters, vol. 82(2), pp
21 7. FIGURES AND TABLES Figure 1. Proportion of immigrant population in total population (average ) Romania Slovakia Bulgaria Poland Czech Republic Finland Hungary Lithuania Portugal Italy Denmark Netherlands Greece France United Kingdom Slovenia Germany Spain Belgium Sweden Latvia Austria Estonia Cyprus Source: Eurostat. Figure 2. Percentage of vertical mismatch Natives Immigrants EU Immigrants outside EU Figure 3. Percentage of horizontal mismatch Natives Immigrants EU Immigrants outside EU Data: AES 2007 Data: AES


22 Figure 4. Percentage of immigrants with vertical mismatch by years of residence in the host country Data: AES 2007 Figure 5. Percentage of immigrants with horizontal mismatch by years of residence in the host country Data: AES
23 Table 1: Determinants of overeducation Probit marginal effects (1) (2) (3) (4) (5) Immigrant 0.444*** [0.0728] Immig. UE 0.357*** 0.350*** 0.309*** 0.285*** [0.102] [0.105] [0.0960] [0.0963] Immig. No-UE 0.508*** 0.508*** 0.473*** 0.459*** [0.0569] [0.0579] [0.0561] [0.0616] Male [0.0356] [0.0356] [0.0205] [0.0214] [0.0254] Age ** ** * [ ] [ ] [ ] [ ] [ ] Years of residence *** [ ] Years of residence x immig. UE *** *** *** *** [ ] [ ] [ ] [ ] Years of residence x immig. No-UE *** *** *** *** [ ] [ ] [ ] [ ] Educational level (ref. ISCED 3) ISCED *** 0.698*** 0.705*** 0.708*** 0.726*** [0.130] [0.130] [0.129] [0.130] [0.118] Educational level (ref. ISCED 3) ISCED 5& [0.167] [0.167] [0.178] [0.181] [0.190] Non formal education *** *** *** [0.0117] [0.0115] [0.0105] [ ] [0.0107] Field of education (ref. Education) - Humanities 0.257*** 0.225*** 0.217*** [0.0465] [0.0479] [0.0500] Field of education (ref. Education) - Social science 0.207*** 0.161*** 0.153*** [0.0395] [0.0408] [0.0414] Field of education (ref. Education) - Science 0.162*** 0.122*** 0.112*** [0.0327] [0.0333] [0.0335] Field of education (ref. Education) - Engineering 0.199*** 0.144*** 0.136** [0.0560] [0.0534] [0.0576] Field of Education (ref. Education) - Agriculture 0.296*** 0.230*** 0.216*** [0.0801] [0.0742] [0.0812] Field of Education (ref. Education) - Health 0.128* 0.128* 0.129* [0.0727] [0.0718] [0.0785] Field of Education (ref. Education) - Services 0.276*** 0.230*** 0.214*** [0.0729] [0.0708] [0.0785] Economic activity (ref. industry)- Agriculture [0.0379] [0.0392] Economic activity (ref. industry) - Construction e-05 [0.0123] [ ] Economic activity (ref. industry) - Services * * [ ] [ ] Economic activity (ref. industry)- No sale services *** *** [0.0123] [0.0132] Tenure *** *** [ ] [ ] Big company (more than 10 workers) ** * [0.0207] [0.0217] Household size (nº people at home) [ ] Children at home (ref: no children) [ ] Fulltime job (ref: part-time) [0.0174] Temporary contract (ref: permanent) ** [0.0149] Observations Robust standard errors clustered on the destination country are reported between brackets. All models are estimated using survey weights and include country fixed-effects and controls for urban size (3 categories). Model (5) does not include GR, DK and SI as data is not available for some control variables * p-value<10% ** p-value<5% *** p-value<1%. 20
24 Table 2: Determinants of horizontal mismatch Probit marginal effects (1) (2) (3) (4) (5) Immigrant 0.180** [0.0805] Immig. UE [0.0918] [0.0785] [0.0843] [0.0903] Immig. No-UE 0.195** 0.173** 0.148* 0.138* [0.0764] [0.0769] [0.0777] [0.0715] Male * * ** [0.0293] [0.0293] [0.0224] [0.0175] [0.0206] Age *** *** *** *** *** [ ] [ ] [ ] [ ] [ ] Years of residence [ ] Years of residence x immig. UE [0.0103] [ ] [ ] [ ] Years of residence x immig. No-UE [ ] [ ] [ ] [ ] Educational level (ref. ISCED 3) ISCED *** *** *** [0.0115] [0.0116] [0.0107] [0.0142] [0.0132] Educational level (ref. ISCED 3) ISCED 5& ** ** [0.0178] [0.0178] [0.0205] [0.0195] [0.0205] Non formal education * * [0.0131] [0.0134] [0.0145] [0.0135] [0.0121] Field of education (ref. Education) - Humanities 0.600*** 0.607*** 0.603*** [0.0201] [0.0197] [0.0219] Field of education (ref. Education) - Social science ** *** *** [0.0947] [0.0782] [0.0822] Field of education (ref. Education) - Science 0.625*** 0.630*** 0.628*** [0.0154] [0.0147] [0.0167] Field of education (ref. Education) - Engineering * [0.0467] [0.0352] [0.0392] Field of Education (ref. Education) - Agriculture 0.489*** 0.500*** 0.493*** [0.0395] [0.0347] [0.0392] Field of Education (ref. Education) - Health [0.0439] [0.0398] [0.0423] Field of Education (ref. Education) - Services 0.433*** 0.420*** 0.423*** [0.0342] [0.0431] [0.0453] Economic activity (ref. industry)- Agriculture [0.0414] [0.0463] Economic activity (ref. industry) - Construction *** *** [0.0284] [0.0296] Economic activity (ref. industry) - Services 0.108*** 0.108*** [0.0174] [0.0172] Economic activity (ref. industry)- No sale services 0.102*** 0.104*** [0.0224] [0.0232] Tenure *** *** [ ] [ ] Big company (more than 10 workers) [ ] [ ] Household size (nº people at home) [ ] Children at home (ref: no children) [0.0180] Fulltime job (ref: part-time) [0.0170] Temporary contract (ref: permanent) [0.0203] Observations Robust standard errors clustered on the destination country are reported between brackets. All models are estimated using survey weights and include country fixed-effects and controls for urban size (3 categories). Model (5) does not include GR, DK and SI as data is not available for some control variables * p-value<10% ** p-value<5% *** p-value<1%. 21
WP3/08 SEARCH WORKING PAPER
 WP3/08 SEARCH WORKING PAPER Skill mismatches in the EU: Immigrants vs. Natives Sandra Nieto, Alessia Matano, Raúl Ramos January 2013 SKILL MISMATCHES IN THE EU: IMMIGRANTS vs. NATIVES 1 Sandra Nieto, Alessia
EDUCATIONAL MISMATCHES IN THE EU: IMMIGRANTS vs. NATIVES
 EDUCATIONAL MISMATCHES IN THE EU: IMMIGRANTS vs. NATIVES Sandra Nieto (AQR-IREA, UB) Alessia Matano (AQR-IREA, UB) Raul Ramos (AQR-IREA, UB) Purpose: The purpose of this paper is to analyse and explain
Skill mismatches in the EU: Immigrants vs. natives
 Institut de Recerca en Economia Aplicada Regional i Pública Research Institute of Applied Economics Document de Treball 2013/18, 28 pàg. Working Paper 2013/18, 28 pag. Grup de Recerca Anàlisi Quantitativa
PORTABILITY OF HUMAN CAPITAL AND IMMIGRANT OVEREDUCATION IN SPAIN
 PORTABILITY OF HUMAN CAPITAL AND IMMIGRANT OVEREDUCATION IN SPAIN Esteve Sanromá Institut d Economia de Barcelona (IEB)-Universitat de Barcelona Raúl Ramos AQR-IREA-Universitat de Barcelona Dept. Econometria,
DETERMINANTS OF IMMIGRANTS EARNINGS IN THE ITALIAN LABOUR MARKET: THE ROLE OF HUMAN CAPITAL AND COUNTRY OF ORIGIN
 DETERMINANTS OF IMMIGRANTS EARNINGS IN THE ITALIAN LABOUR MARKET: THE ROLE OF HUMAN CAPITAL AND COUNTRY OF ORIGIN Aim of the Paper The aim of the present work is to study the determinants of immigrants
English Deficiency and the Native-Immigrant Wage Gap
 DISCUSSION PAPER SERIES IZA DP No. 7019 English Deficiency and the Native-Immigrant Wage Gap Alfonso Miranda Yu Zhu November 2012 Forschungsinstitut zur Zukunft der Arbeit Institute for the Study of Labor
The Portability of Human Capital and Immigrant Assimilation: Evidence for Spain
 DISCUSSION PAPER SERIES IZA DP No. 3649 The Portability of Human Capital and Immigrant Assimilation: Evidence for Spain Esteve Sanromá Raúl Ramos Hipólito Simón August 2008 Forschungsinstitut zur Zukunft
Why Are People More Pro-Trade than Pro-Migration?
 DISCUSSION PAPER SERIES IZA DP No. 2855 Why Are People More Pro-Trade than Pro-Migration? Anna Maria Mayda June 2007 Forschungsinstitut zur Zukunft der Arbeit Institute for the Study of Labor Why Are People
Data on gender pay gap by education level collected by UNECE
 United Nations Working paper 18 4 March 2014 Original: English Economic Commission for Europe Conference of European Statisticians Group of Experts on Gender Statistics Work Session on Gender Statistics
DANMARKS NATIONALBANK
 ANALYSIS DANMARKS NATIONALBANK 10 JANUARY 2019 NO. 1 Intra-EU labour mobility dampens cyclical pressures EU labour mobility dampens labour market pressures Eastern enlargements increase access to EU labour
INTEGRATION OF IMMIGRANTS INTO THE LABOUR MARKET IN EU AND OECD COUNTRIES
 INTEGRATION OF IMMIGRANTS INTO THE LABOUR MARKET IN EU AND OECD COUNTRIES AN OVERVIEW Brussels, 25 June 2015 Thomas Liebig International Migration Division Directorate for Employment, Labour and Social
Euro area unemployment rate at 9.9% EU27 at 9.4%
 STAT/11/76 April 2011 Euro area unemployment rate at 9.9% EU27 at 9.4% The euro area 1 (EA17) seasonally-adjusted 2 unemployment rate 3 was 9.9% in April 2011, unchanged compared with March 4. It was.2%
September 2012 Euro area unemployment rate at 11.6% EU27 at 10.6%
 STAT/12/155 31 October 2012 September 2012 Euro area unemployment rate at 11.6% at.6% The euro area 1 (EA17) seasonally-adjusted 2 unemployment rate 3 was 11.6% in September 2012, up from 11.5% in August
3.3 DETERMINANTS OF THE CULTURAL INTEGRATION OF IMMIGRANTS
 1 Duleep (2015) gives a general overview of economic assimilation. Two classic articles in the United States are Chiswick (1978) and Borjas (1987). Eckstein Weiss (2004) studies the integration of immigrants
The Components of Wage Inequality and the Role of Labour Market Flexibility
 Institutions and inequality in the EU Perugia, 21 st of March, 2013 The Components of Wage Inequality and the Role of Labour Market Flexibility Analyses for the Enlarged Europe Jens Hölscher, Cristiano
Labour market integration of low skilled migrants in Europe: Economic impact. Gudrun Biffl
 Labour market integration of low skilled migrants in Europe: Economic impact Gudrun Biffl Contribution to the Conference on Managing Migration and Integration: Europe & the US University of California-Berkeley,
Employment convergence of immigrants in the European Union
 Employment convergence of immigrants in the European Union Szilvia Hamori HWWI Research Paper 3-20 by the HWWI Research Programme Migration Research Group Hamburg Institute of International Economics (HWWI)
Employment and Unemployment in the EU. Structural Dynamics and Trends 1 Authors: Ph.D. Marioara Iordan 2
 Employment and Unemployment in the EU. Structural Dynamics and Trends 1 Authors: Ph.D. Marioara Iordan 2 Abstract Ph.D. Mihaela-Nona Chilian 3 Worldwide, employment trends are most often related to the
Discussion Paper. Draft Comments are welcome. Employment convergence of immigrants in the European Union SZILVIA HÁMORI*
 Discussion Paper Draft Comments are welcome Employment convergence of immigrants in the European Union SZILVIA HÁMORI* June 2009 ABSTRACT In light of the importance of immigrants labour market integration
CO3.6: Percentage of immigrant children and their educational outcomes
 CO3.6: Percentage of immigrant children and their educational outcomes Definitions and methodology This indicator presents estimates of the proportion of children with immigrant background as well as their
Size and Development of the Shadow Economy of 31 European and 5 other OECD Countries from 2003 to 2013: A Further Decline
 January 31, 2013 ShadEcEurope31_Jan2013.doc Size and Development of the Shadow Economy of 31 European and 5 other OECD Countries from 2003 to 2013: A Further Decline by Friedrich Schneider *) In the Tables
EARLY SCHOOL LEAVERS
 EUROPEAN SEMESTER THEMATIC FACTSHEET EARLY SCHOOL LEAVERS 1. INTRODUCTION Early school leaving 1 is an obstacle to economic growth and employment. It hampers productivity and competitiveness, and fuels
Settling In 2018 Main Indicators of Immigrant Integration
 Settling In 2018 Main Indicators of Immigrant Integration Settling In 2018 Main Indicators of Immigrant Integration Notes on Cyprus 1. Note by Turkey: The information in this document with reference to
LABOUR-MARKET INTEGRATION OF IMMIGRANTS IN OECD-COUNTRIES: WHAT EXPLANATIONS FIT THE DATA?
 LABOUR-MARKET INTEGRATION OF IMMIGRANTS IN OECD-COUNTRIES: WHAT EXPLANATIONS FIT THE DATA? By Andreas Bergh (PhD) Associate Professor in Economics at Lund University and the Research Institute of Industrial
Options for Romanian and Bulgarian migrants in 2014
 Briefing Paper 4.27 www.migrationwatchuk.com Summary 1. The UK, Germany, France and the Netherlands are the four major countries opening their labour markets in January 2014. All four are likely to be
WORKING PAPER SERIES
 DEPARTMENT OF ECONOMICS UNIVERSITY OF MILAN - BICOCCA WORKING PAPER SERIES Labour Market Assimilation and Over Education: The Case of Immigrant Workers in Italy Carlo Dell Aringa, Laura Pagani No. 178
Russian Federation. OECD average. Portugal. United States. Estonia. New Zealand. Slovak Republic. Latvia. Poland
 INDICATOR TRANSITION FROM EDUCATION TO WORK: WHERE ARE TODAY S YOUTH? On average across OECD countries, 6 of -19 year-olds are neither employed nor in education or training (NEET), and this percentage
Occupational Selection in Multilingual Labor Markets
 DISCUSSION PAPER SERIES IZA DP No. 3446 Occupational Selection in Multilingual Labor Markets Núria Quella Sílvio Rendon April 2008 Forschungsinstitut zur Zukunft der Arbeit Institute for the Study of Labor
EUROPEAN COMMISSION DIRECTORATE-GENERAL FOR AGRICULTURE AND RURAL DEVELOPMENT
 EUROPEAN COMMISSION DIRECTORATE-GENERAL FOR AGRICULTURE AND RURAL DEVELOPMENT Direcrate L. Economic analysis, perspectives and evaluations L.2. Economic analysis of EU agriculture Brussels, 5 NOV. 21 D(21)
NERO INTEGRATION OF REFUGEES (NORDIC COUNTRIES) Emily Farchy, ELS/IMD
 Emily Farchy, ELS/IMD") NERO INTEGRATION OF REFUGEES (NORDIC COUNTRIES) Emily Farchy, ELS/IMD Sweden Netherlands Denmark United Kingdom Belgium France Austria Ireland Canada Norway Germany Spain Switzerland Portugal Luxembourg
NERO INTEGRATION OF REFUGEES (NORDIC COUNTRIES) Emily Farchy, ELS/IMD Sweden Netherlands Denmark United Kingdom Belgium France Austria Ireland Canada Norway Germany Spain Switzerland Portugal Luxembourg
Population and Migration Estimates
 An Phríomh-Oifig Staidrimh Central Statistics Office 21 September 2010 Components of population growth Population and Migration Estimates April 2010 Natural increase Net migration 80 60 40 20 0 Year ending
Population and Migration Estimates
 22 September 2009 Components of population growth Population and Migration Estimates April 2009 Natural increase Net migration 80 60 40 20 0 Year ending April 2008 April 2009 Natural increase 44,600 45,100
OECD SKILLS STRATEGY FLANDERS DIAGNOSTIC WORKSHOP
 OECD SKILLS STRATEGY FLANDERS DIAGNOSTIC WORKSHOP Dirk Van Damme Head of Division OECD Centre for Skills Education and Skills Directorate 15 May 218 Use Pigeonhole for your questions 1 WHY DO SKILLS MATTER?
USING, DEVELOPING, AND ACTIVATING THE SKILLS OF IMMIGRANTS AND THEIR CHILDREN
 USING, DEVELOPING, AND ACTIVATING THE SKILLS OF IMMIGRANTS AND THEIR CHILDREN 29 October 2015 Thomas Liebig International Migration Division Directorate for Employment, Labour and Social Affairs, OECD
OECD/EU INDICATORS OF IMMIGRANT INTEGRATION: Findings and reflections
 OECD/EU INDICATORS OF IMMIGRANT INTEGRATION: Findings and reflections Meiji University, Tokyo 26 May 2016 Thomas Liebig International Migration Division Overview on the integration indicators Joint work
The new demographic and social challenges in Spain: the aging process and the immigration
 International Geographical Union Commission GLOBAL CHANGE AND HUMAN MOBILITY The 4th International Conference on Population Geographies The Chinese University of Hong Kong (10-13 July 2007) The new demographic
IMMIGRATION IN THE EU
 IMMIGRATION IN THE EU Source: Eurostat 10/6/2015, unless otherwise indicated Data refers to non-eu nationals who have established their usual residence in the territory of an EU State for a period of at
Widening of Inequality in Japan: Its Implications
 Widening of Inequality in Japan: Its Implications Jun Saito, Senior Research Fellow Japan Center for Economic Research December 11, 2017 Is inequality widening in Japan? Since the publication of Thomas
PUBLIC PERCEPTIONS OF SCIENCE, RESEARCH AND INNOVATION
 Special Eurobarometer 419 PUBLIC PERCEPTIONS OF SCIENCE, RESEARCH AND INNOVATION SUMMARY Fieldwork: June 2014 Publication: October 2014 This survey has been requested by the European Commission, Directorate-General
F E M M Faculty of Economics and Management Magdeburg
 OTTO-VON-GUERICKE-UNIVERSITY MAGDEBURG FACULTY OF ECONOMICS AND MANAGEMENT The Immigrant Wage Gap in Germany Alisher Aldashev, ZEW Mannheim Johannes Gernandt, ZEW Mannheim Stephan L. Thomsen FEMM Working
Gender pay gap in public services: an initial report
 Introduction This report 1 examines the gender pay gap, the difference between what men and women earn, in public services. Drawing on figures from both Eurostat, the statistical office of the European
Standard Note: SN/SG/6077 Last updated: 25 April 2014 Author: Oliver Hawkins Section Social and General Statistics
 Migration Statistics Standard Note: SN/SG/6077 Last updated: 25 April 2014 Author: Oliver Hawkins Section Social and General Statistics The number of people migrating to the UK has been greater than the
The United Kingdom in the European context top-line reflections from the European Social Survey
 The United Kingdom in the European context top-line reflections from the European Social Survey Rory Fitzgerald and Elissa Sibley 1 With the forthcoming referendum on Britain s membership of the European
Between brain drain and brain gain post-2004 Polish migration experience
 Between brain drain and brain gain post-2004 Polish migration experience Paweł Kaczmarczyk Centre of Migration Research University of Warsaw Conference Fachkräftebedarf und Zuwanderung IAB, Nuernberg May
SPANISH NATIONAL YOUTH GUARANTEE IMPLEMENTATION PLAN ANNEX. CONTEXT
 2013 SPANISH NATIONAL YOUTH 2013 GUARANTEE IMPLEMENTATION PLAN ANNEX. CONTEXT 2 Annex. Context Contents I. Introduction 3 II. The labour context for young people 4 III. Main causes of the labour situation
Appendix to Sectoral Economies
 Appendix to Sectoral Economies Rafaela Dancygier and Michael Donnelly June 18, 2012 1. Details About the Sectoral Data used in this Article Table A1: Availability of NACE classifications by country of
"Science, Research and Innovation Performance of the EU 2018"
 "Science, Research and Innovation Performance of the EU 2018" Innovation, Productivity, Jobs and Inequality ERAC Workshop Brussels, 4 October 2017 DG RTD, Unit A4 Key messages More robust economic growth
TRIPS OF BULGARIAN RESIDENTS ABROAD AND ARRIVALS OF VISITORS FROM ABROAD TO BULGARIA IN AUGUST 2015
 TRIPS OF BULGARIAN RESIDENTS ABROAD AND ARRIVALS OF VISITORS FROM ABROAD TO BULGARIA IN AUGUST 2015 In August 2015, the number of the trips of Bulgarian residents abroad was 512.0 thousand (Annex, Table
TRIPS OF BULGARIAN RESIDENTS ABROAD AND ARRIVALS OF VISITORS FROM ABROAD TO BULGARIA IN AUGUST 2016
 TRIPS OF BULGARIAN RESIDENTS ABROAD AND ARRIVALS OF VISITORS FROM ABROAD TO BULGARIA IN AUGUST 2016 In August 2016, the number of the trips of Bulgarian residents abroad was 590.6 thousand (Annex, Table
TRIPS OF BULGARIAN RESIDENTS ABROAD AND ARRIVALS OF VISITORS FROM ABROAD TO BULGARIA IN MAY 2017
 TRIPS OF BULGARIAN RESIDENTS ABROAD AND ARRIVALS OF VISITORS FROM ABROAD TO BULGARIA IN MAY 2017 In May 2017, the number of the trips of Bulgarian residents abroad was 653.3 thousand (Annex, Table 1) or
TRIPS OF BULGARIAN RESIDENTS ABROAD AND ARRIVALS OF VISITORS FROM ABROAD TO BULGARIA IN MARCH 2016
 TRIPS OF BULGARIAN RESIDENTS ABROAD AND ARRIVALS OF VISITORS FROM ABROAD TO BULGARIA IN MARCH 2016 In March 2016, the number of the trips of Bulgarian residents abroad was 354.7 thousand (Annex, Table
TRIPS OF BULGARIAN RESIDENTS ABROAD AND ARRIVALS OF VISITORS FROM ABROAD TO BULGARIA IN FEBRUARY 2017
 TRIPS OF BULGARIAN RESIDENTS ABROAD AND ARRIVALS OF VISITORS FROM ABROAD TO BULGARIA IN FEBRUARY 2017 In February 2017, the number of the trips of Bulgarian residents abroad was 366.8 thousand (Annex,
TRIPS OF BULGARIAN RESIDENTS ABROAD AND ARRIVALS OF VISITORS FROM ABROAD TO BULGARIA IN SEPTEMBER 2015
 TRIPS OF BULGARIAN RESIDENTS ABROAD AND ARRIVALS OF VISITORS FROM ABROAD TO BULGARIA IN SEPTEMBER 2015 In September 2015, the number of the trips of Bulgarian residents abroad was 450.9 thousand (Annex,
EUROPEAN ECONOMY VS THE TRAP OF THE EUROPE 2020 STRATEGY
 EUROPEAN ECONOMY VS THE TRAP OF THE EUROPE 2020 STRATEGY Romeo-Victor IONESCU * Abstract: The paper deals to the analysis of Europe 2020 Strategy goals viability under the new global socio-economic context.
DETERMINANTS OF INTERNATIONAL MIGRATION: A SURVEY ON TRANSITION ECONOMIES AND TURKEY. Pınar Narin Emirhan 1. Preliminary Draft (ETSG 2008-Warsaw)
") DETERMINANTS OF INTERNATIONAL MIGRATION: A SURVEY ON TRANSITION ECONOMIES AND TURKEY Pınar Narin Emirhan 1 Preliminary Draft (ETSG 2008-Warsaw) Abstract This paper aims to test the determinants of international
DETERMINANTS OF INTERNATIONAL MIGRATION: A SURVEY ON TRANSITION ECONOMIES AND TURKEY Pınar Narin Emirhan 1 Preliminary Draft (ETSG 2008-Warsaw) Abstract This paper aims to test the determinants of international
Migration Challenge or Opportunity? - Introduction. 15th Munich Economic Summit
 Migration Challenge or Opportunity? - Introduction 15th Munich Economic Summit Clemens Fuest 30 June 2016 What do you think are the two most important issues facing the EU at the moment? 40 35 2014 2015
Globalization and the portuguese enterprises
 International Sourcing 2009-2011, 2012-2015 25 November, 2013 Globalization and the portuguese enterprises In the period 2009-2011, 15.3% of Portuguese enterprises with 100 or more persons employed carried
EARLY SCHOOL LEAVERS
 EUROPEAN SEMESTER THEMATIC FACTSHEET EARLY SCHOOL LEAVERS 1. INTRODUCTION Early school leaving 1 is an obstacle to economic growth and employment. It hampers productivity and competitiveness, and fuels
Convergence: a narrative for Europe. 12 June 2018
 Convergence: a narrative for Europe 12 June 218 1.Our economies 2 Luxembourg Ireland Denmark Sweden Netherlands Austria Finland Germany Belgium United Kingdom France Italy Spain Malta Cyprus Slovenia Portugal
TRIPS OF BULGARIAN RESIDENTS ABROAD AND ARRIVALS OF VISITORS FROM ABROAD TO BULGARIA IN DECEMBER 2016
 TRIPS OF BULGARIAN RESIDENTS ABROAD AND ARRIVALS OF VISITORS FROM ABROAD TO BULGARIA IN DECEMBER 2016 In December 2016, the number of the trips of Bulgarian residents abroad was 397.3 thousand (Annex,
Migration, Mobility and Integration in the European Labour Market. Lorenzo Corsini
 Migration, Mobility and Integration in the European Labour Market Lorenzo Corsini Content of the lecture We provide some insight on -The degree of differentials on some key labourmarket variables across
Romania's position in the online database of the European Commission on gender balance in decision-making positions in public administration
 Romania's position in the online database of the European Commission on gender balance in decision-making positions in public administration Comparative Analysis 2014-2015 Str. Petofi Sandor nr.47, Sector
The evolution of turnout in European elections from 1979 to 2009
 The evolution of turnout in European elections from 1979 to 2009 Nicola Maggini 7 April 2014 1 The European elections to be held between 22 and 25 May 2014 (depending on the country) may acquire, according
Overeducation among Immigrants in Sweden: Incidence, Wage Effects and State-Dependence
 D I S C U S S I O N P A P E R S E R I E S IZA DP No. 6695 Overeducation among Immigrants in Sweden: Incidence, Wage Effects and State-Dependence Pernilla Andersson Joona Nabanita Datta Gupta Eskil Wadensjö
Directorate E: Social and regional statistics and geographical information system
 EUROPEAN COMMISSION EUROSTAT Directorate E: Social and regional statistics and geographical information system 8QLWÃ(Ã(GXFDWLRQÃKHDOWKÃDQGÃRWKHUÃVRFLDOÃILHOGV ESTAT/E3/ETS/2001/09 Original: EN Working
Special Eurobarometer 440. Report. Europeans, Agriculture and the CAP
 Survey requested by the European Commission, Directorate-General for Agriculture and Rural Development and co-ordinated by the Directorate-General for Communication This document does not represent the
Flash Eurobarometer 364 ELECTORAL RIGHTS REPORT
 Flash Eurobarometer ELECTORAL RIGHTS REPORT Fieldwork: November 2012 Publication: March 2013 This survey has been requested by the European Commission, Directorate-General Justice and co-ordinated by Directorate-General
European Union Passport
 European Union Passport European Union Passport How the EU works The EU is a unique economic and political partnership between 28 European countries that together cover much of the continent. The EU was
Improving the accuracy of outbound tourism statistics with mobile positioning data
 1 (11) Improving the accuracy of outbound tourism statistics with mobile positioning data Survey response rates are declining at an alarming rate globally. Statisticians have traditionally used imputing
Employment Outlook 2017
 Annexes Chapter 3. How technology and globalisation are transforming the labour market Employment Outlook 2017 TABLE OF CONTENTS ANNEX 3.A3 ADDITIONAL EVIDENCE ON POLARISATION BY REGION... 1 ANNEX 3.A4
The European emergency number 112
 Flash Eurobarometer The European emergency number 112 REPORT Fieldwork: December 2011 Publication: February 2012 Flash Eurobarometer TNS political & social This survey has been requested by the Directorate-General
WOMEN IN DECISION-MAKING POSITIONS
 Special Eurobarometer 376 WOMEN IN DECISION-MAKING POSITIONS SUMMARY Fieldwork: September 2011 Publication: March 2012 This survey has been requested by Directorate-General Justice and co-ordinated by
Upgrading workers skills and competencies: policy strategies
 Federation of Greek Industries Greek General Confederation of Labour CONFERENCE LIFELONG DEVELOPMENT OF COMPETENCES AND QUALIFICATIONS OF THE WORKFORCE; ROLES AND RESPONSIBILITIES Athens 23-24 24 May 2003
Spot on! Identifying and tracking skill needs
 Spot on! Identifying and tracking skill needs Fabio Manca Labour Market Economist, Employment, Labour, and Social Affairs Directorate, Skills and Employability Division, OECD What do we mean by Skill mismatch?
3.1. Importance of rural areas
 3.1. Importance of rural areas 3.1.1. CONTEXT 1 - DESIGNATION OF RURAL AREAS A consistent typology of 'predominantly rural', 'intermediate' or 'predominantly urban' regions for EC statistics and reports
EUROPEAN UNION CITIZENSHIP
 Flash Eurobarometer EUROPEAN UNION CITIZENSHIP REPORT Fieldwork: November 2012 Publication: February 2013 This survey has been requested by the European Commission, Directorate-General Justice and co-ordinated
Migration as an Adjustment Mechanism in a Crisis-Stricken Europe
 Migration as an Adjustment Mechanism in a Crisis-Stricken Europe Martin Kahanec Central European University (CEU), Budapest Institute for the Study of Labor (IZA), Bonn Central European Labour Studies
Special Eurobarometer 474. Summary. Europeans perceptions of the Schengen Area
 Summary Europeans perceptions of the Schengen Area Survey requested by the European Commission, Directorate-General for Migration and Home Affairs and co-ordinated by the Directorate-General for Communication
Europe in Figures - Eurostat Yearbook 2008 The diversity of the EU through statistics
 STAT/08/75 2 June 2008 Europe in Figures - Eurostat Yearbook 2008 The diversity of the EU through statistics What was the population growth in the EU27 over the last 10 years? In which Member State is
in focus Statistics How mobile are highly qualified human resources in science and technology? Contents SCIENCE AND TECHNOLOGY 75/2007
 How mobile are highly qualified human resources in science and technology? Statistics in focus SCIENCE AND TECHNOLOGY 75/2007 Author Tomas MERI Contents In Luxembourg 46% of the human resources in science
Occupational Mobility of Immigrants in a Low Skilled Economy: The Spanish Case
 DISCUSSION PAPER SERIES IZA DP No. 5581 Occupational Mobility of Immigrants in a Low Skilled Economy: The Spanish Case Hipólito Simón Raúl Ramos Esteban Sanromá March 2011 Forschungsinstitut zur Zukunft
Migration and Labor Market Outcomes in Sending and Southern Receiving Countries
 Migration and Labor Market Outcomes in Sending and Southern Receiving Countries Giovanni Peri (UC Davis) Frederic Docquier (Universite Catholique de Louvain) Christian Dustmann (University College London)
Gender effects of the crisis on labor market in six European countries
 Gender effects of the crisis on labor market in six European countries Hélène Périvier Marion Cochard et Gérard Cornilleau OECD meeting, 06-20-2011 helene.perivier@ofce.sciences-po.fr marion.cochard@ofce.sciences-po.fr
3 Wage adjustment and employment in Europe: some results from the Wage Dynamics Network Survey
 3 Wage adjustment and in Europe: some results from the Wage Dynamics Network Survey This box examines the link between collective bargaining arrangements, downward wage rigidities and. Several past studies
Special Eurobarometer 469. Report
 Integration of immigrants in the European Union Survey requested by the European Commission, Directorate-General for Migration and Home Affairs and co-ordinated by the Directorate-General for Communication
Migrant population of the UK
 BRIEFING PAPER Number CBP8070, 3 August 2017 Migrant population of the UK By Vyara Apostolova & Oliver Hawkins Contents: 1. Who counts as a migrant? 2. Migrant population in the UK 3. Migrant population
Migration and the European Job Market Rapporto Europa 2016
 Migration and the European Job Market Rapporto Europa 2016 1 Table of content Table of Content Output 11 Employment 11 Europena migration and the job market 63 Box 1. Estimates of VAR system for Labor
Women in the EU. Fieldwork : February-March 2011 Publication: June Special Eurobarometer / Wave 75.1 TNS Opinion & Social EUROPEAN PARLIAMENT
 EUROPEAN PARLIAMENT Women in the EU Eurobaromètre Spécial / Vague 74.3 TNS Opinion & Social Fieldwork : February-March 2011 Publication: June 2011 Special Eurobarometer / Wave 75.1 TNS Opinion & Social
WHY IS THE PAYOFF TO SCHOOLING SMALLER FOR IMMIGRANTS? *
 Revised January 2008 WHY IS THE PAYOFF TO SCHOOLING SMALLER FOR IMMIGRANTS? * Barry R. Chiswick Department of Economics University of Illinois at Chicago and IZA-Institute for the Study of Labor and Paul
Eurostat Yearbook 2006/07 A goldmine of statistical information
 25/2007-20 February 2007 Eurostat Yearbook 2006/07 A goldmine of statistical information What percentage of the population is overweight or obese? How many foreign languages are learnt by pupils in the
Monthly Inbound Update June th August 2017
 Monthly Inbound Update June 217 17 th August 217 1 Contents 1. About this data 2. Headlines 3. Journey Purpose: June, last 3 months, year to date and rolling twelve months by journey purpose 4. Global
3Z 3 STATISTICS IN FOCUS eurostat Population and social conditions 1995 D 3
 3Z 3 STATISTICS IN FOCUS Population and social conditions 1995 D 3 INTERNATIONAL MIGRATION IN THE EU MEMBER STATES - 1992 It would seem almost to go without saying that international migration concerns
LABOUR MARKETS PERFORMANCE OF GRADUATES IN EUROPE: A COMPARATIVE VIEW
 LABOUR MARKETS PERFORMANCE OF GRADUATES IN EUROPE: A COMPARATIVE VIEW Dr Golo Henseke, UCL Institute of Education 2018 AlmaLaurea Conference Structural Changes, Graduates and Jobs, 11 th June 2018 www.researchcghe.org
This refers to the discretionary clause where a Member State decides to examine an application even if such examination is not its responsibility.
 2.6. Dublin Information collected by Eurostat is the only comprehensive publicly available statistical data source that can be used to analyse and learn about the functioning of Dublin system in Europe.
2. The table in the Annex outlines the declarations received by the General Secretariat of the Council and their status to date.
 Council of the European Union Brussels, 10 June 2016 (OR. en) 9603/16 COPEN 184 EUROJUST 69 EJN 36 NOTE From: To: Subject: General Secretariat of the Council Delegations Council Framework Decision 2008/909/JHA
The Structure of the Permanent Job Wage Premium: Evidence from Europe
 DISCUSSION PAPER SERIES IZA DP No. 7623 The Structure of the Permanent Job Wage Premium: Evidence from Europe Lawrence M. Kahn September 2013 Forschungsinstitut zur Zukunft der Arbeit Institute for the
Context Indicator 17: Population density
 3.2. Socio-economic situation of rural areas 3.2.1. Predominantly rural regions are more densely populated in the EU-N12 than in the EU-15 Context Indicator 17: Population density In 2011, predominantly
Special Eurobarometer 461. Report. Designing Europe s future:
 Designing Europe s future: Trust in institutions Globalisation Support for the euro, opinions about free trade and solidarity Fieldwork Survey requested by the European Commission, Directorate-General
Special Eurobarometer 467. Report. Future of Europe. Social issues
 Future of Europe Social issues Fieldwork Publication November 2017 Survey requested by the European Commission, Directorate-General for Communication and co-ordinated by the Directorate- General for Communication
The effect of migration in the destination country:
 The effect of migration in the destination country: This topic can be broken down into several issues: 1-the effect of immigrants on the aggregate economy 2-the effect of immigrants on the destination