The dynamics of employment, the labour market and the economy in Nepal
|
|
|
- Nelson Willis
- 5 years ago
- Views:
Transcription

1 Employment Sector Employment Working Paper No The dynamics of employment, the labour market and the economy in Nepal Shagun Khare Anja Slany Employment
2 Copyright International Labour Organization 2011 First published 2011 Publications of the International Labour Office enjoy copyright under Protocol 2 of the Universal Copyright Convention. Nevertheless, short excerpts from them may be reproduced without authorization, on condition that the source is indicated. For rights of reproduction or translation, application should be made to ILO Publications (Rights and Permissions), International Labour Office, CH-1211 Geneva 22, Switzerland, or by pubdroit@ilo.org. The International Labour Office welcomes such applications. Libraries, institutions and other users registered with reproduction rights organizations may make copies in accordance with the licences issued to them for this purpose. Visit to find the reproduction rights organization in your country. ILO Cataloguing in Publication Data The dynamics of employment, the labour market and the economy in Nepal / International Labour Office. - Geneva: ILO, v. ISBN: (print); (web pdf) ISSN: (print); (web pdf) International Labour Office employment / unemployment / underemployment / labour force participation / child labour / low income / educational level / Nepal ILO Cataloguing in Publication Data The designations employed in ILO publications, which are in conformity with United Nations practice, and the presentation of material therein do not imply the expression of any opinion whatsoever on the part of the International Labour Office concerning the legal status of any country, area or territory or of its authorities, or concerning the delimitation of its frontiers. The responsibility for opinions expressed in signed articles, studies and other contributions rests solely with their authors, and publication does not constitute an endorsement by the International Labour Office of the opinions expressed in them. Reference to names of firms and commercial products and processes does not imply their endorsement by the International Labour Office, and any failure to mention a particular firm, commercial product or process is not a sign of disapproval. ILO publications and electronic products can be obtained through major booksellers or ILO local offices in many countries, or direct from ILO Publications, International Labour Office, CH-1211 Geneva 22, Switzerland. Catalogues or lists of new publications are available free of charge from the above address, or by pubvente@ilo.org Visit our website: Printed in Switzerland ii
3 Preface The primary goal of the ILO is to contribute, with member States, to achieve full and productive employment and decent work for all, including women and young people, a goal embedded in the ILO Declaration 2008 on Social Justice for a Fair Globalization, and 1 which has now been widely adopted by the international community. In order to support member States and the social partners to reach the goal, the ILO pursues a Decent Work Agenda which comprises four interrelated areas: Respect for fundamental worker s rights and international labour standards, employment promotion, social protection and social dialogue. Explanations of this integrated approach and related challenges are contained in a number of key documents: in those explaining and elaborating the concept of decent work 2, in the Employment Policy Convention, 1964 (No. 122), and in the Global Employment Agenda. The Global Employment Agenda was developed by the ILO through tripartite consensus of its Governing Body s Employment and Social Policy Committee. Since its adoption in 2003 it has been further articulated and made more operational and today it constitutes the basic framework through which the ILO pursues the objective of placing employment at the centre of economic and social policies. 3 The Employment Sector is fully engaged in the implementation of the Global Employment Agenda, and is doing so through a large range of technical support and capacity building activities, advisory services and policy research. As part of its research and publications programme, the Employment Sector promotes knowledge-generation around key policy issues and topics conforming to the core elements of the Global Employment Agenda and the Decent Work Agenda. The Sector s publications consist of books, monographs, working papers, employment reports and policy briefs. 4 The Employment Working Papers series is designed to disseminate the main findings of research initiatives undertaken by the various departments and programmes of the Sector. The working papers are intended to encourage exchange of ideas and to stimulate debate. The views expressed are the responsibility of the author(s) and do not necessarily represent those of the ILO. José Manuel Salazar-Xirinachs Executive Director Employment Sector 1 See 2 See the successive Reports of the Director-General to the International Labour Conference: Decent work (1999); Reducing the decent work deficit: A global challenge (2001); Working out of poverty (2003). 3 See And in particular: Implementing the Global Employment Agenda: Employment strategies in support of decent work, Vision document, ILO, See iii
4
5 Foreword There are many ports of entry to understanding how countries arrive at and sustain growth for the well-being of their populations, or, conversely, how they fail to do so. Shagun Khare s and Anja Slany s paper explores the entry point of employment, and through an employment diagnostic analysis endeavors to explain the pronounced deficit in productive employment in Nepal. In the run-up to the fourth conference of Least Developed Countries in Istanbul, May 2011, the paper offers a timely contribution to the analysis of a problem afflicting most LDCs work of an unproductive nature that leaves millions in poverty. Beset over a decade by a bloody civil conflict, there has been a return to peace, but only much slower progress toward political stability. Unsurprisingly, economic growth has been a casualty of this strife and instability. Yet it has also been a cause of the same. The low rate of growth and its pattern, the predominantly poor and rural nature of the economy, the high level of illiteracy, the several impediments to structural transformation, and, in fact, the deindustrialization of the economy are reflected in the high level of underemployment and working poverty, and constitute a strong motivation for the outbound migration of the Nepalese workers. Providing adequate opportunity at home for the productive employment of the young Nepalese workforce has to be the centerpiece of macroeconomic policy in Nepal, a country that considerably trails its neighbours in South Asia in terms of output and productivity growth. The policy need implies inter alia a focus on productivity, both on the supply- and demand sides of the labour market. And, in a country where more than three quarters of the workforce live and work in rural areas, it implies a strong focus on agriculture, among other sectors infrastructure, tourism, hydropower, and others as policy targets. The employment challenge is a national one, but one also with stark regional differences in a country of vast geographic diversity. There are sharp, sex-based differences in the labour market as well. Women account for half of the labour force, yet they are twice as likely to be illiterate than men, and earn a fraction of what men are paid. Khare and Slany present the Nepalese labour market in analytical detail in this paper. Further work will explore the specific constraints that will need to be overcome in order to set the country firmly on the path to productive employment. Duncan Campbell Director for Policy Planning Employment Sector Per Ronnas Senior Employment and Development Specialist Employment Sector v
6
7 Contents Preface... iii Foreword... v 1. Introduction Demographic structure Population Age composition of the population Migration Main findings Labour Force Characteristics Working age population Labour force participation Main findings Unemployment and Employment Unemployment Employment Page Sectoral breakup of employment Status of employment Box 1: A note on child labour Informal Employment Main findings Working poverty and underemployment Working Poverty Box 2: A note on inequality Underemployment Wages and income Main findings Development of the human resource base Education and Skills Literacy Enrolment levels Educational attainment Education and Employment linkages Health vii
8 6.3 Main findings Macroeconomic Structure Growth Macroeconomic fundamentals Sectoral composition and productivity Productivity Main findings Disaggregation of growth Conclusion References A.1. Decomposition of GDP growth from labour perspective A.2. Tables viii
9 1. Introduction The last two decades have been marked by much political tumult in Nepal, with many constitutional amendments and changes of government. More recently, the transformation of Nepal to a federal republic in has altered the nature of politics in the country though political instability remains. Economic growth has been slow in comparison with neighbouring countries, with GDP growth under 4.5 per cent p.a. between to Given an expanding population, average income per capita has risen at a sluggish 2 per cent p.a., and is the lowest in South Asia. 5 Though remittances from emigrants have injected resources into the economy, the poverty incidence remains high with 30.8 per cent of the population living under the national poverty line. 6 Since unemployment ranks at only 2.1 per cent, the main contributor to the high poverty figure has been working poverty the lack of productive employment. The present study offers an employment diagnostic analysis of Nepal. The overall objective is to understand the deficiency of productive employment and to identify critical constraints to inclusive and sustainable growth. Much of the study has been structured in line with the following stylized formula: 7 Or In other words, change in GDP per capita is the sum of the changes the following: 1. Age structure, 2. Activity rate, 3. Employment rate, 8 4. Labour productivity, 5 Economic Survey Figure for , LSS Formula adapted from the World Bank s draft publication The role of employment and labour income in shared growth: what to look for and how, 14 December, A more detailed explanation of the formula can be found in appendix A.1. 8 Note that this is not exactly how employment rate is defined, but it expresses the same information. 1
10 The first three components of this formula provide a basis for structuring an overview of the main employment and labour market dynamics. This is followed by an analysis of the fourth component that includes the economic structure and the interplay between economic and employment growth and labour productivity, corresponding to the final component of the formula above. The distributional aspects of the economic and labour market developments and the issues of inequality and poverty are also brought into the picture. Accordingly, the first part of the study considers given factors those that cannot be changed by us, at least in the short run. It consists of the demographic structure including population, age composition and migration aspects ( 2); and labour force characteristics such as age, sex and location ( 3). One also looks at the nature of unemployment and employment ( 4) disaggregated by sectors, status and formality of work. Subsequently, attention is also paid to the problem of working poverty and labour underutilization ( 5). One then turns to study the qualitative aspects of human capital ( 6) such as education and health. Once a broad understanding of the human resource base has been developed, the opportunities and challenges posed by the economy on the base are considered ( 7). Finally, a brief disaggregation of income growth into the above factors ( 8) is undertaken to consolidate our understanding of the main contributors and suppressors of employmentrich growth. This study thus aims at coming to a broad understanding of where the challenges to productive employment lie in Nepal in order to aid further policy advice. 2
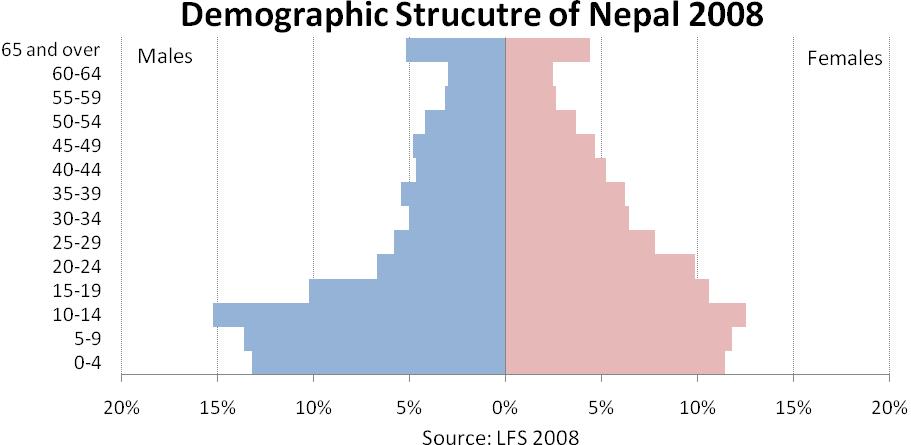
11 2. Demographic structure 2.1 Population Nepal, at the time of the last Labour Force Survey in 2008, had a population of 23.5 million. The gender distribution of the population was quite balanced with 52.8 per cent women and 47.2 per cent men. Eighty five per cent of the Nepalese population still lived in rural areas. Population growth had been high, with a per annum increase of 2.11 per cent between and 2008, during which population increased by 4.4 million (Table 2.1). Despite the fall in the birth rate from 33.1 births per 1000 population in 2001 to 27.7 in 2008, 9 it remained significantly higher than the death rate of 8.3 causing an expansion in population. However, this fall in the birth rate did lead to a shrinking in the natural rate of population increase. In 2008, the natural increase of population amounted to 1.94 per cent, lower than the average increase of 2.11 per cent per year over the past ten years. Table 2.1: Population and percentage distribution of population 1998/ / Annual growth rate (1998/ ) ('000) % ('000) % % Nepal 19' ' Men 9' ' Women 9' ' Urban 2' ' Rural 16' ' Source: LFS and Age composition of the population Over the past decade, the age structure of the population has not changed too much: the share of the youth (under 15) has fallen marginally from 41 per cent to 39 per cent. This decrease has been offset by the increase by a percentage point each in the shares of the working age population (15-64) and the old (65 and over). However, the resilience of the age structure hides some important transformations. The high but falling population rate of growth has three important consequences, two or which can be seen in Figure 1a and 1b. First, there is a young population represented by the population pyramid bulging at the bottom. Second, that the shape of this pyramid is changing with a falling birth rate; the bulge is moving upward. 9 Nepal in Figures

12 Figure 1a Figure 1b 4
13 This implies that within the next 15 years, Nepal is going to reap a large part of its demographic advantage as 38.2 per cent of its present population will enter the working age. 10 If the present trend of a fall in the birth rate continues, within these 15 years Nepal will witness its most favourable ratio of working age to non-working age population. The third, and related, consequence is for the age-based dependency ratio. It was 0.7 in and has further fallen to 0.63 in Therefore, each (potentially) productive member of society has a smaller burden to support. As more young Nepalese enter the workforce, this burden will further reduce, provided there is an expansion in productive employment large enough to absorb these workers. A favourable age-based dependency ratio would also potentially imply a more favourable savings rate, leading to higher investment in the economy. 2.3 Migration Migration has changed the population structure in the past and will continue to do so in the future. Many Nepalese have left the country in search of better economic opportunities. Looking at Figure 1b, one can note the missing middle among men, i.e. in the age groups of Indeed, their share in the total male population (28 per cent) is quite lower than the corresponding share of females in that age group (36 per cent). According to the World Bank (The Migration and Remittances Factbook 2011), by 2010, 982,200 (3.3 per cent of total population) Nepalese had emigrated to India, Qatar, Thailand, Saudi Arabia, United States and other countries. The World Bank Report also indentified the emigration rate of tertiary educated people as 5.3 per cent in However, these numbers seem to be very conservative when one considers the role of remittances in the country. Calculations using LFS 2008 data show that total remitters abroad, i.e. migrants and absentees 12 are around 1.3 million or equal to 5.5 per cent of the population (Table 2.2). 13 In 2008, 30 per cent of all households received financial help from migrants and absentees within Nepal or abroad (23 per cent). Per household remittances from abroad amounted to NRs 80,462 in 2008; which on aggregate meant an equivalent amount of as much as 9 per cent of the GDP in that year. 14 This is, however, a conservative estimate as reported incomes in general tend to be lower than actual incomes. Looking from the perspective of the balance of payments, remittances in 2008 accounted for as high as Projection made taking into account infant mortality rate of 79/100 (Nepal in Figures 2008). 11 Age-based dependency ratio considers the proportion of minors (under 15) to working age population (15+). 12 Defined as those that have left the country for or are expected to be gone for more than 6 months of a year but are not life.time migrants. 13 Assuming that each remitter contributes only to one household, total migrants abroad comes to 1.3 million (or about 5.5 per cent of the population). It might be that one migrant remits money to more than one household, but since only 23 per cent or 1.11 million households report that they receive remittances from abroad, this is not the case here. 14 GDP at factor cost 5
14 per cent of GDP. 15 This is line with the 2009 World Bank figure that put remittances as 22.9 per cent of GDP (A.2.,Table 7). This figure is the highest in South Asia and the fifth highest in the world. Table 2.2: Remittances 2008* Total Average remittance in last 12 months by receiving Households (HHs) (NRs) 65'755 Per capita remittance (NRs) 4'042 % of HHs receiving remittances 30 Total estimated HHs in Nepal (1) 4'825'116 Average no. of remittances per receiving HH 1.28 From abroad Average remittance in last 12 months by receiving HHs from abroad (NRs) 80'462 Per capita remittance from abroad (NRs) 3'352 % of HHs receiving remittances from abroad (2a) 23 Average no. of remittances among HHs from abroad (3a) 1.16 Total remitters abroad^ = (2a)/100* (1)*(3a) 1'287'341 From within Nepal Average remittance in last 12 months by receiving HHs from within Nepal (NRs) 28'976 Per capita remittance from within Nepal (NRs) 690 % of HHs receiving remittances from within Nepal (2b) 12.6 Average no. of remittances among HHs from within Nepal (3b) 1.26 Total remitters in Nepal^ = (2b)/100* (1)*(3b) 766'035 * From migrants and absentees A remittance is all money received by a HH from a single source individual or household ^Assuming each remitter contributes to only one HH. Source: LFS 2008 Recently, IMF in its Article IV consultation on Nepal again pegged this figure at 19.5 per cent of GDP (Table 2.3). Moreover, these remittances have grown unrelentingly, even during the crisis years (Figure 2). Only in has one witnessed some slowing down of remittance growth. Table 2.3: Inflow of remittances, % of GDP USD bn South Asia Bangladesh India Nepal Pakistan Sri Lanka Philippines Source: IMF Article IV Taking worker s remittances as a percentage of GDP at factor cost. 6
15 Figure 2 Internal mobility is also high in Nepal. According to LFS 2008, a third of the population consisted of life-time migrants those that have moved to their current location at some time (Table 2.4). However, unlike external migration, the larger part of the internal migrants (69.8 per cent) was composed of women. The main prompting reasons for women s migration were marriage and other family reason, which accounted, together, for 91.3 per cent of female migration. These same reasons prompted 45.4 per cent of the male migration (A.2., Table 10). 16 Table 2.4: Distribution of migrants (all ages) by sex and locality 2008 Migrants as % of total for Migrants ('000) each group Total Men Women Total Men Women Total Urban Rural Source: LFS 2008 This fact of large migration of women for marriage or other family reasons rather than economic reasons also meant the rural-to-rural migration was the major stream of internal migration (71.6 per cent, Table 2.5), followed by rural-to-urban (20.3 per cent). Urban-torural and urban-to-urban migrations were marginal, 4.8 per cent and 3.4 per cent respectively. 16 Between marriage and other family reason, the former contributes to 2.6 per cent of migration among men, while the latter contributes to 42.8 per cent. For women, the former accounts for 67.3 per cent of migration, and the latter 24 per cent. 7
16 Interestingly, men were more likely to migrate from villages to cities than women were, while women were more likely to migrate to other villages. Table 2.5: Internal migrant flows Total Male Female Rural to rural 71.6% 57.4% 77.5% Rural to urban 20.3% 31.2% 15.7% Urban to rural 4.8% 6.3% 4.1% Urban to urban 3.4% 5.1% 2.7% Total 100.0% 100.0% 100.0% Source: LFS 2008 Village-to-village migration for marriage also implied that 76.9 per cent of migrants currently live in a rural area. However, due to the higher rural-urban migration vis-à-vis urban-rural migration (20.3 per cent as compared to 4.8 per cent); the rural population is younger on average than the urban population, as Figure 3 demonstrates. This also means that the share of those above 65 years is higher in the countryside than in the cities, as many migrants return to their villages upon retirement from the labour force. Figure 3 Another pertinent issue when one considers Nepal is immigration. The Migration and Remittances Factbook 2011 reports around thousand immigrants in Nepal (3.2 per cent of the population); mostly originating from neighbouring countries - India, Bhutan, China and Pakistan. As data from the LFS 2008 in Table 2.6 shows, 12.7 per cent of all immigrants were from abroad. Their share of the population was more or less equally distributed among urban and rural areas. Interestingly, most of these immigrants were women (63.4 per cent A.2., Table 9), who have possibly immigrated to Nepal for marriage. 8
17 Table 2.6: Distribution of migrants by current and last location, and sex. Current location ('000) % Last location Rural Urban Total Rural Urban Total All migrants From rural From urban From outside % All migrants From rural From urban From outside Source: LFS Main findings For its size, Nepal has a large population that has been growing at a high pace. It is a young country as about 40 per cent of the population is under the age of 15 years. In the coming years, as these young people enter the workforce, new opportunities and challenges will arise for the country. The Nepalese population is highly mobile, with one-third of residents having migrated from somewhere else, and over a million people having left the country. Most of those who have left the country are men, while most of the foreigners who have entered the country are women for marriage. The large diaspora of Nepalese abroad supports the country by remitting as much as 20 per cent of the Nepalese GDP back home. This figure is the highest in the South Asian region and the fifth highest in the world. 9
18 3. Labour Force Characteristics 3.1 Working age population The working age population 17 in 2008 consisted of million (Table 3.1), which was 61.4 per cent of its total population. The fact that a large proportion of the population is of working age implies that the age-based dependency ratio was quite favourable. This figure was 0.63 in 2008 for Nepal. This segment of the population increased by 28 per cent over a period of 10 years, from million in In 2008, nearly half of them (46 per cent) were in the ages of years, while another 30.7 per cent were aged between years. The remaining quarter of them were over 50 years old. Women had a higher share in the working age population than men (56 per cent) visà-vis their share in the population as a total (52 per cent), confirming outbound migration in Nepal. Moreover, the urban areas had a slightly larger proportion of working age population (17 per cent) as compared to the population in general (15 per cent), which tells us that those of working age are more likely to migrate to cities than others. Table 3.1: Working age population 2008, by gender and location Working age population (million) Males Females Of working age population: 100% 100% 100% 100% 100% Males 42% 43% 51% 51% 44% Females 58% 57% 49% 49% 56% Working age population (million) Urban Rural Of working age population: 100% 100% 100% 100% 100% Urban 18% 18% 14% 13% 17% Rural 82% 82% 86% 87% 83% Source: LFS 2008 As Nepal is a relatively young country, as shown in Figure 1 (and Table 3.2); about 40 per cent of its population is under 15 now and will enter the working age in the near future. Figure 4 projects the growth in the working-age population in the coming 15 years. 18 While having such a large productive base implies demographic dividends in 17 Those above 15 years of age. 18 The projection has been made by adding to the present working-age population those who will be 15 by the year, and subtracting those that wil be over 6, for each year. The data is population data 10
19 terms of cheap and available labour; it also means a responsibility to provide many more productive jobs each year. Figure 4 19,20 Table 3.2: Working age population and labour force (15-64) projection (millions) Working age population Labour force Entrants in the labour force: Total period Per year Source: LFS , 2008 disaggregated by age from the LFS Infant mortality rates have been taken into account. See A.2., Table These projections have been made taking into account infant mortality rates but disregarding possible deaths among those in the ages above 5 years. However, as the death rate is likely to increase as one gets to old age, in order to have a more accurate projection, working age population has here been considered as rather than Labour force participation rates have been assumed to be the same for as in

20 3.2 Labour force participation Of the working age population of 14.4 million in 2008, million were actively engaged in the labour force (Table 3.3). That is, they were either employed or actively seeking work. These active members amounted to 82.1 per cent of those in the working age. This proportion has not changed over the years. Among different age groups of the working age, people between the ages of 25 and 59 were most active (Figure 5). Those between years were more inactive than others; followed by those in the ages of 20 and 24 and those above 65 years. One figure worth noting is that activity rates among those in the ages of years were quite high, indicating the presence of child labour (A.2., Table 13). Figure 5 Table 3.3: Summary of the labour force (usual activity status) (millions) Total population Working age population (15+) Labour force Employed Unemployed Inactive % Dependency ratio, actual 114.9% 103.8% Dependency ratio, age based 70.1% 63.2% Activity rate 81.7% 82.1% Employment rate 79.1% 80.1% Unemployment rate 3.1% 2.5% Source: LFS , 2008 Gender differences are apparent when considering the issue. Women were more likely to be inactive than men (Table 3.4), especially women in the ages of 25 years onwards the prime working years (A.2., Table 16). It is only until about 20 years that women had higher participation rates than men. This is indicative of gender inequality as when one finds unequal access for women to education when they are young, and employment when they are older. 12
21 Table 3.4: Labor Force characteristics by sex in Nepal - usual activity status Men 1998/ Total population (million) Working age population Labour force Employed Unemployed Inactive ('000) Activity rate 85.4% 85.6% Employment rate 82.2% 83.4% Unemployment rate 3.7% 2.6% Women 1998/ Total population (million) Working age population Labour force Employed Unemployed Inactive ('000) Activity rate 78.3% 79.3% Employment rate 76.4% 77.4% Unemployment rate 2.5% 2.4% Source: LFS , 2008 Gender inequality can again be noticed in the reasons provided for non-participation. Women were most likely to stay away from the labour market for household duties, while men were most likely to withhold for educational purposes (Figure 6). Overall, of those inactive, 31.8 per cent were inactive because of studies, 27.8 per cent because of household duties and 30.4 per cent due to health or old age. Other reasons had a marginal impact on overall activity levels (A.2., Table 17). The youth those between 15 and 29 years and accounting for over half of the inactive working age population, were mainly absent from the workforce for studies. Sixty per cent of the inactive youth (mainly men) cited this reason, and were entirely responsible for studies being the largest cause for inactivity. Around 26.7 per cent of them also cited household duties as the reason, these were almost exclusively young women. Old age and sickness was one of the main reason for absence from the workforce (about a third of all inactive persons). Ninety per cent of those above 60 were absent for this reason, which is understandable. It is however worrying that 44 per cent of those between the ages of 45 and 59 years also cited this as the reason for absence. 13
22 Figure 6 As concerning the impact of location on labour force participation rates, it is seen that rural areas had a much higher activity rate than urban areas (86.8 as compared to 67.3 per cent, A.2., Table 18). This is probably due to the fact that those in urban areas earn higher wages (so they can afford to be unemployed) and enjoy more opportunities for education and training, while those in rural areas are dependent on agriculture and their own manpower rather than education. While all age groups display this rural-urban divide, it is especially stark for the youth (15-24) and those above 60 years of age. The future for Nepal shows a continuous and high increase of the labour force (Figure 4). Assuming the same labour participation rates as in 2008, by 2023 there will be million people active in the ages of This is over 50 per cent larger than the labour force in This implies a great deal for policy makers who must ensure for each year that the 377,000 new entrants on average to the labour force have opportunities for productive employment, as well as that these new entrants are prepared to take advantage of those jobs (A.2., Table 19). This challenge takes on more immediacy if one considers that the number of entrants in the coming few years are more concentrated in the beginning (400,000 p.a. from and 323,000 p.a. from ). 3.3 Main findings The working age population of Nepal is a young one three-fourth of them are under the age of 50 years. In the next 15 years, about 40 per cent of the population will enter the working age, expanding the productive base of the economy considerably. To take advantage of the possible demographic dividends, opportunities must be created for these entrants. It is estimated that within the period of , 400,000 new workers will join the labour force each year. This means a need of 400,000 new jobs per year. Progress too needs to be made on the qualitative aspects of the Nepalese labour force. Data shows us gender inequalities in the decision to work. While most men were absent from the labour force for education, women stayed back due to household duties. Furthermore, 30 per cent of those who chose not to participate did so because they were either ill or too old. This is too large a figure considering that those above 65 years constituted only 8 per cent of the working age. 14
23 4. Unemployment and Employment 4.1 Unemployment The unemployment rate in Nepal by usual activity status 21 was a mere 2.5 per cent in While there has been an improvement in the rate over the level when it was 3.1 per cent (Table 3.3), the actual number of unemployed have risen from 178,000 to 253,000. Unemployment is more of an urban phenomenon. The urban unemployment rate was a high 7.5 per cent in 2008 by the relaxed definition for current unemployment (as compared to 1.2 per cent in rural areas, Table 4.1). 22 Moreover, there seem to be barriers to entering the labour force in urban areas, as the unemployment rate for youth in cities was even worse 13.0 per cent for those in the ages of and 11.8 per cent for those in the ages of This barrier to entering the labour market is corroborated by the data that 47 per cent of the unemployed had never worked before (LFS 2008). There was equality among genders on the whole, but women had a higher unemployment rate than men in the cities, and a lower rate in the villages. Table 4.1: Current unemployment rates* by sex, age group and locality and 2008 (%) Age Group Nepal Urban Rural Both sexes Men Women Both Sexes Men Women Both Sexes Men Women Total Age Group Nepal Urban Rural Both sexes Men Women Both Sexes Men Women Both Sexes Men Women Total *Relaxed definition Source: LFS and Usual activity status takes into account the respondent s economic activities in the past 12 months, while current activity status takes into account only the past one week. 22 Under the relaxed definition, a person who has been unemployed (not even one hour of work in the past one week) needn t have been searching for work to qualify as unemployed. 15
24 Most of the unemployment (30.8 per cent) was long term over two years (Table 4.2). Only 4.3 per cent of the unemployed had been so for under a month. Females were more likely to be unemployed for a longer time than males. Unemployment was also more persistent in urban areas than rural areas. Table 4.2: Duration of unemployment* by sex and location, 2008 (%) Total Urban Rural Total Male Female Total Male Female Total Male Female Total unemployed Less than 1 month month < 3 months months < 6 months months < 1 year year < 2 years years or more *Relaxed definition - one needn't be looking for work to be considered unemployed. Source: LFS Employment Eighty per cent of Nepalese of working-age were employed in Of the remaining 20 per cent, a large majority were inactive mainly for education or family related reasons. This structure of the working-age population had remained more or less stable over the past ten years. Majority of the employed were women (Table 4.3). Together they constituted 53.1 per cent of all employed. However, the employment rate or the employment-to-population (15+) ratio was lower for women than men (78.5 per cent versus 85.5 per cent). This is because women constituted 55.2 per cent of the population above 15 years, which is considerably higher than their average share of the population, which was 52.8 per cent (Table 2.1). This again indicates the presence of outbound migration among men, as discussed in previous sections. Table 4.3: Currently employed, 15+ and employment rates by sex and location, 2008 Number of employed 15+ (million) Total population 15+ (million) Employment rate (%) Total Male Female Total Male Female Total Male Female Nepal % 85.5% 78.5% Urban % 71.5% 53.4% Rural % 88.7% 83.3% Source: LFS 2008 When considering the distribution of employment across ages (Table 4.4), one finds that in 2008, the workers were young as was characteristic of the Nepalese population as a whole. Those under 45 years of age constituted roughly 75 per cent of all workers. Within this group however, one finds employment rates were stronger for those aged over 25 years of age. This is mostly explained by inactivity among the year olds due to education and other reasons, but it is also true that the unemployment rate for this age group was the highest pointing to barriers to entering the labour market. 16
25 Table 4.4: Currently employed persons disaggregated by age and sex Age group Total employed ('000) Total employed (%) Male Female Total Male Female Total '138 2' '353 1'859 3' '168 2'738 4' '264 1'165 2' ' Total 15+ 5'474 6'233 11' Total (5+) 6'433 7'371 13' Child labour as % of total labour Age group Total population ( 000) Employment rates (%) Male Female Total Male Female Total '200 3'029 6' '879 2'551 4' '318 3'198 5' '348 1'364 2' ' Total 15+ 6'452 7'973 14' Total (5+) 9'652 11'002 20' Source: LFS Sectoral breakup of employment The picture that emerges when one considers employment in Nepal is that it is overwhelmingly agricultural. Majority of the Nepalese populace lived in villages (87 per cent, Figure 7), and most of them derived their livelihood from the land (80.2 per cent, Table 4.5). Services was a compelling avenue for urban workers and 50 per cent of them were employed by it in Industry was still miniscule and was not a viable option for a vast majority. Overall, we see that agriculture employed an overwhelming three-quarter of all Nepalese workers in 2008, and had been womanized with a large majority of female labour. Services supplied around 20 per cent of the jobs and industry only 6.8 per cent. 23 More on child labour in a separate note. 24 The figures are slightly different from Table 4.3 as Table 4.4 data is taken from the breakdown of current employment by age and activity. Discrepancies exist within the LFS. 17
 Total Urban Rural Total Male Female Total Male Female Total Male Female Share of males and female in current employment,")
26 Figure 7 Industry Table 4.5: Sectoral and gender based decomposition of employment, 2008 (%) Total Urban Rural Total Male Female Total Male Female Total Male Female Share of males and female in current employment, disaggregated by sector Agriculture Industry Services Total* Share of industries in current employment, disaggregated by sex Agriculture Industry Services Total* * Without extra-territorial organizations Source: LFS

27 Turning to the data, we see that agriculture employed an overwhelming three-quarter of all Nepalese workers in 2008 (Table 4.6). Services supplied around 20 per cent of the jobs, while industry only employed 6.8 per cent of workers. Within the sectors, there were large discrepancies across genders and location. More women than men worked in agriculture, while industry and services employed more men than women (Table 4.5). These differences were maintained across cities and villages both. Most rural employment was provided by agriculture (80.2 per cent). Services provided 14.1 per cent of rural jobs while industry was barely an option for rural Nepalese to search for work only 5.7 per cent of rural employment was provided by it. In urban areas however, services contributed to a significant share of employment 53.4 per cent. Agriculture provided 32.2 per cent while industry only 14.2 per cent. Table 4.6: Sectoral composition of employment (%) Agriculture Industry Services Total Source: LFS , 2008 Box 1: A note on child labour The data in Table 4.4 shows a disturbingly high level of child labour children under 15 years of age constituted as much as 15.2 per cent of all workers in When broken down by activities, one finds that most child labour (57.8 per cent) worked in agriculture. Children comprised as much as 20 per cent of total labourers in that sector (A.2.,Table 24). They were also often involved in activities such as fetching water and collecting firewood. These activities were performed as work and not as contribution to the household. One caveat that we must adopt, however, is that the time spent by children under 14 years of age at work was about half that of the adults child labour spent 12.4 hours a week on the activities, while adults spent 25.6 hours. Certain works, such as fetching water and collecting firewood seemed less detrimental with only half an hour to one hour spent on them a day, but others such as wage jobs (especially in agriculture) were very demanding in terms of time. (Source: LFS 2008) Status of employment Among the 11.8 million employed Nepalese, only about 2 million were paid employees while the rest 9.8 million - 83 per cent - were self-employed, mostly in the informal sector. Paid employment only contributed to 16.9% of total employment, and within paid employment, one observed large gender differences as three quarters of all paid employees were men (Table 4.7). There had, however, been some improvements in the employment of women over the levels in
28 Table 4.7: Paid employment 1998/ Paid employees as % of total employed Of which: Men 75, Women Average monthly income of paid employees (Constant NRs*) Of which: Men Women *Discounted by the urban CPI, see A.2., Table 25 Source:LFS 2008 Another source of gender inequality in paid employment was the wage gap between women and men. In 2008, women earned 60 per cent of men s wages. Again, however, there was a slight trend towards equality in the past 10 years ( ), men s wages had risen by 55.7 per cent, while women s had increased by 61.7 per cent. Informal Employment Most of the Nepalese economy is informal 25 an overwhelming 96.2 per cent of all workers worked in the informal sector in 2008 (Table 4.8). This is not surprising considering the share of agriculture (and more specifically, small-scale agriculture) in the country, where 99.7 per cent of all workers are informally employed (LFS 2008). Over three-fourths of the informal workers were linked to the primary sector (A.2., Table 24). Informal employment was thus more of a rural phenomenon than an urban one. There were more women than men in informal activities and women had a lower chance of finding formal employment than men. Youth and those above 60 years of age were also more likely to be informally engaged in their professions (A.2., Table 27). Table 4.8: Currently employed working population by sex 2008, 15+ ('000) Informal sector Whole economy Share of informal sector Total 11'332 11' % Men 5'163 5' % Women 6'169 6' % Source: LFS , 2008 Considering the non-agricultural sector, we find that the informal sector employed about 70 per cent of all workers (Table 4.9). Over 70 per cent of this was in the sector of services, and the remaining in industry (A.2., Table 26). Despite this - owing to the large share of services in the economy - informal employment accounted for 84 per cent of all 25 The LFS and 2008 do not take registration as a criterion of informality but nature of employment and number of employees (under 10). Only non-agricultural sector is considered in the case of informal employment. It includes all own account workers, micro-enterprises owned by informal employers who hire one or more employees on a continuing basis, family workers and all kind of jobs not having paid annual leave and/or social security. 20
29 employment in the sector, while it contributed to 93.5 per cent of employment in industry. These informal workers were possibly employed in small scale manufacturing and cottage industries. Table 4.9 Currently employed disagreggated by sector and formality 2008 Total Male Female Total Male Female Total Male Female ('000) (%) (%) Total Agriculture Non agriculture Of which: Formal Informal Of which: Without paid employees With 1-9 paid employees Total Male Female Total Male Female Total Male Female ('000) (%) (%) Total Agriculture Non agriculture Of which: Formal Informal Of which: Without paid employees With 1-9 paid employees Source: LFS , 2008 Among those informally employed, 81.7 per cent were self-employed or paid employees with informal job conditions, i.e. no paid leaves or social security contributions by the employer. The remaining 18.3 per cent employed up to nine persons regularly but on similar informal conditions. Roughly 40 per cent of non-agricultural informal labour worked without formal conditions such as paid leave and social security. Another 36.5 per cent were self-employed and 19.8 worked for family. The rest (4 per cent) were employers in the informal sector e.g. private unregistered companies (LFS 2008). For women, the informal sector was an even more important employer. The chances of finding informal employment as compared to formal employment were higher for women than men. Though the informal sector has had such a large role in the Nepalese economy, it is heartening to know that the formal sector grew faster than the informal sector over the period to 2008 (Table 4.10) in terms of employment. The formal non-agricultural sector grew at 4.45 per cent per year while the informal sector grew at a slower 2.6 per cent. The relatively slower growth of agricultural employment also meant that the share of the formal sector grew from 6 to 8 per cent in overall employment. Even among the informal sector, the small entrepreneurs grew at the fastest rate of over 10 per cent per year over that period. Employment for women in the formal sector grew faster than that for men, as did entrepreneurship among women. 21
30 Table 4.10: Rate of growth of types of employment between and 2008 (%) p.a.) Total Male Female Total Agriculture Non agriculture Of which: Formal Informal Of which: Without regular paid employees With 1-9 regular paid employees Source: LFS , Main findings Unemployment is rare in Nepal, and it is mostly an urban phenomenon. However, there do exist barriers to entering the labour market for the youth as almost half of those unemployed had never worked before. There are more women workers in the country than men, mainly due to the emigration of men from the country. Agriculture, which is the main employer in the country, employs double the number of women as men. However, in urban areas where about 70 per cent of employment is in the non-agricultural sector, there are more male workers than female workers. The informal economy in Nepal is massive. Since agricultural employment is entirely informal, more women work in the informal sector than men. Almost 99 per cent of women workers are vulnerable to the irregularities of the informal sector. However, there is a positive trend as the share of the formal sector has grown over and formal employment for women has grown faster than that for men. Only 2 million of the 11.8 million workers in Nepal are paid employees. Men dominate this privileged category of employment with three-fourths of all jobs. Men also earn higher wages about 1.7 times what women do. 22
31 5. Working poverty and underemployment 5.1 Working Poverty A third of all Nepalese lived in poverty in Despite poor economic growth however, there had been a marked fall in this figure from 41.8 per cent in to 30.8 per cent in (Table 5.1). This reduction was possibly aided by large increase in remittances over the same period and an increase in wages (See 5.3). However, the national poverty line of NRs 7696 an annum is a mere fraction of the international poverty line which is set at US$ 1.25 per day or about NRs 12,900 per year. 26 According to the international poverty line, the 2005 Headcount Poverty Rate of 53 per cent is higher than in India (41.6 per cent) and Bangladesh (49.6 per cent) 27. Table 5.1. Headcount Poverty Rates by location Headcount Poverty Rates Distribution of the Poor 1995/ /04 Change in % 1995/ /04 Change in % Urban Rural Total Source: Poverty trends in Nepal Box 2: A note on inequality Along with poverty, inequality is also prevalent in Nepal and has in fact increased over the last decade. The income related Gini coefficient rose from 0.38 ( ) to 0.47 ( ). The population in urban areas has been relatively better off than those in rural areas. Regional income inequalities also exist within rural areas. For instance, the poverty increase in Rural Eastern Hill compensated the reduction in Rural Western Terai (Poverty Trends in Nepal ). Gender inequality exists as women are disadvantaged in terms of education, employment, mobility and access to financial resources. The illiteracy rate of females is 20 percentage points higher than that of males. The number of women who have never attended school is twice as high as that of men. Discrimination among ethnic groups is also a major problem within the society. Furthermore, Nepal s Human Development Index is with 0.53 the lowest in South Asia, ranking 138th out of 169 surveyed countries, the lowest in South Asia except for Afghanistan (HDR 2010). Between and , real per-capita expenditures increased by 43 per cent but with high disparities across regions. Though poverty declined, this resulted in a negative elasticity of poverty reduction of 0.6, whereas 1 per cent growth in per capita expenditure results in 0.6 per cent poverty decline. Poverty in Nepal is homogenously distributed along all age groups 28 so that 30.8 per cent poverty implies that moreor-less 30.8 per cent of those of working age are poor. Since in developing countries it is usually the poor who are forced to work rather than be absent from the labour force, we can assume that an even greater proportion of the labour force is poor. Moreover, since unemployment is negligible in the country; one can say that most of the poverty comes from working poverty. People who work are not able to earn sufficiently to ensure a good life for themselves and their dependents. Most of the working poverty is concentrated in 26 Converted with the 2009 conversion rate between a PPP international dollar and NRs 27 WDI Employment-led Growth in Nepal
32 agriculture, as demonstrated in Table 5.1 (Also, A.2., Table 28) where one can see that rural areas are poorer than urban areas on average, and that this divide is widening. 5.2 Underemployment Working poverty is deeply related to the concept of underemployment as 15 per cent of the labour force is either not working enough or not earning enough (Table 5.2). Underemployment 29 implies a lack of productive employment. Productive employment ensures that a person is able to attain his or her productive potential and that he or she can make a decent living. Increasing productive employment is, thus, one way of tackling working poverty. The other part of the solution lies in legislations laws enforcing maximum hours, minimum wages and social security among other standards are a way to ensure that work is distributed fairly and one earns what one deserves. Table 5.2: Labour underutilization rate as % of labour force (2008) 30 Labour underutilization rate as % of labour force 30.0 Men 38.2 Women 22.8 Urban 49.9 Rural 26.9 By type Unemployed 2.1 Urban 7.5 Rural 1.2 Time-related underemployment 6.7 Urban 6.3 Rural 6.7 Inadequate earnings 8.1 Urban 10.1 Rural 7.8 Skill Mismatches 13.2 Urban 26.0 Rural 11.1 Source: LFS 2008 Table 5.2 accounts for the various sources of underemployment in the economy. Thirty per cent of Nepalese who were employed in 2008 were underemployed. The problem was much more severe in urban areas than rural areas (nearly half of the urban workforce was underutilized), and among men rather than women. The main contributors to underemployment were skills mismatches (13.2 per cent of all employed) and inadequate earnings (8.10 per cent). Since earnings of the self-employed were not counted, this figure would tend to be a gross underestimation. About 6.7 per cent of the workforce did not work as many hours as they would have liked to. This group on average worked for 23 hours a week, as against the norm of 40 hours. Furthermore, this figure had increased from 4.1 per cent a decade before (LFS ). Ninety per cent of time related underemployed were family workers without pay and other self employed (A.2., Table 29), mostly employed in subsistence agriculture. Though labour underutilization affected all age groups, it was more severe for those under 45 years of age and most severe for those in the ages of years (46 per cent of all labour force in that age group). Employment-led Growth in Nepal 2010 describes the deficit of productive employment in the country and projects how many productive jobs must be created in order to attain the millennium development goal of halving poverty by It is estimated that over 3 million new productive jobs would be needed between the current period of Underemployment is work that is either insufficient in terms of hours worked (visible underemployment) or in wages; or work where there is a skills mismatch. Along with unemployment, they both count as underutilization of labour. 30 For the definition of labour underutilization see the above footnote. 24
33 and 2015 to absorb new entrants as well as to convert previously unproductive jobs to productive jobs, in order to attain the target. 5.3 Wages and income Considering that insufficient earnings is one of the biggest factors in underemployment, it is worth a look. Real agricultural wages, which tend to be highly correlated with poverty levels, 31 rose over the period to by between per cent depending upon the region. This implied a per annum growth rate of between 1.2 and 4.8 per cent which was much higher than the growth in productivity in the sector. Reasons for this could be growing demand due to a rise in remittances, increasing urbanization and inflation ( 7.2). The World Economic Forum 2009 also reported that payments in Nepal are marginally related to worker productivity. 32 In all, income based poverty fell by over 12 percentage points, with urban areas leading the way. 33 Despite this reduction in poverty, inequality increased. 5.4 Main findings Poverty in Nepal has been on the decline aided by remittance growth and increasing wages. However, at least one-third of Nepalese still live under the poverty line. The main cause of poverty in the country is working poverty. Most Nepalese of the working age are employed but they are still unable to earn enough to lift themselves out of poverty. The problem is especially acute in rural areas where most people are involved in subsistence agriculture. The issue of working poverty is deeply related to the issue of underemployment as people either do not find work for as many hours as they would like to, or are not paid sufficiently. About 15 per cent of the labour force falls into either of these categories. Overall, 30 per cent of the labour force is underutilized in some way or the other. In order to halve poverty by 2015 as determined by the Million Development Goals, it is estimated that 3 million new productive jobs are needed during the ongoing period of 2009 and Poverty Trends in Nepal Pay and productivity Index : 2.9 (where (1 = not related to worker productivity; 7 = strongly related to worker productivity); Rank 125 out of Poverty Trends in Nepal
34 6. Development of the human resource base 6.1 Education and Skills Literacy The human resource base in Nepal is inadequately developed and underutilized. In , only half the Nepalese population aged 5 and over were educated (Table 6.1). Moreover, there was a wide skew in literacy rates between the sexes 64.5 per cent for men and 35.8 per cent for women. Over the following years, literacy attainment rates rose and by 2008, 63.2 per cent of the population was educated. This can partially be attributed to the increasing public expenditures on education amounting to 3.93 per cent of GDP in Though the gender differences remained, they did narrow down slightly. The growth rate for literacy rate among women during this period was 4.02 per cent per year, while it was 1.48 per cent for men (A.2., Table 32). Most of the gains in literacy were in the youth between the ages of 5 and 15 and so in 2008, the literacy rate among those in the working age population (15+) was a lower 55.6 per cent. Table 6.1: Literacy rates by age and sex Literacy rates 1998/ , Men , Women , Men , Women Source: LFS and 2008 The urban literacy rate was higher than the rural literacy rate (Table 6.2). The urbanrural divide was largest for women and for those in the working age population vis-à-vis the general population. This indicates migration of literate workers from rural to urban regions. Table 6.2: Literacy rates by sex and location (%) Nepal Urban (1) Rural (2) Difference Urban- Rural (1-2) 5+ Male Female Total Male Female Total Source: LFS Calculated by figures for spending from the Fiscal Budget and from GDP estimates in National Accounts
35 Enrolment levels As recounted in LSS , great progress was made over the eight years from to in the improvement of the net primary enrolment rate from 57 per cent to 72 per cent. 35 More commendable was the 21 percentage point improvement of female primary enrolment from 46 to 67 per cent. However, the primary enrolment rates in Nepal were still found to be lagging behind at those of neighbours such as India (89.8 per cent in 2004), Bhutan (73.6 per cent in 2005) and Bangladesh (87.2 per cent in 2005, WDI 2010). Primary enrolment was different across rural and urban areas, and gender differences were visible in the rural regions (Table 6.3). Table 6.3: Net Enrolment Rates by sex and location (%) Primary Secondary Tertiary Boys Girls Total Boys Girls Total Boys Girls Total Urban Rural Nepal Source: LSS Net enrolment in secondary education was an alarmingly low 15 per cent and by this age one witnessed gender differences also in urban areas. Only 3 per cent of all students enrolled into university. Figure 8 35 Net primary enrolment rate in primary education is the number of children of official primary school age who are enrolled in primary education as a percentage of the total children of the official school age population (same age group). Total net primary enrolment rate also includes children of primary school age enrolled in secondary education. 27
36 LSS data also give us an interesting comparison among enrolment rates across different consumption quintiles (Figure 8). We find that across all levels of schooling, enrolment rises quite sharply with a rise in consumption of the family; or in other words, with the income of the family. This is especially true of the poorer families. Gender differences too narrow as incomes rise. Educational attainment Only about half (53.3 per cent) of the working age population in 2008 had attended school (Table 6.4). Looking at education attainment among those who have received some education (Table 6.5); one finds that about one-fifth of them dropped out before even reaching the primary education level. Forty two per cent attained the primary education level while 32.6 per cent attained a secondary education. Only 3.7 per cent went on to attain a university degree. Table 6.4: Level of education among working age population by sex and location, 2008 (%) Completed Total Urban Rural education level Male Female Total Male Female Total Male Female Total Total Never attended Less than primary Primary Lower secondary Secondary Higher secondary Degree level Others Not stated Source: LFS 2008 Table 6.5: Distribution of educational attainment among those who attended school, by sex and location, 2008 (%) Education Total Urban Rural attainment Male Female Total Male Female Total Male Female Total Attended school Less than primary Primary Secondary Tertiary Others + not stated Source: LFS 2008 Considering gender differences, females were almost twice more likely than males to never attend school. However, interestingly, if they did enter school, they were as probable as their male classmates to go on to attain a primary or secondary education. That is, the distribution of educational attainment as described above was similar across both genders. The differences again cropped up at the tertiary level, where males were more than twice as likely as females to complete university. Looking at the rural-urban divide, it was twice as likely that a child in rural Nepal would never attend school than a child in urban Nepal. If that child did enter school, he or she was more than twice as likely to drop out before getting a primary education than his or her contemporary in a city. There was almost a 50 per cent chance that he or she would drop out after getting a primary education and only 30 per cent chance that he/she would 28
37 complete school. His or her contemporary in the city was about 6 times as likely than him/her to go on to get a university degree. Education and Employment linkages Among the working age population, 47 per cent have never attended any school or education programs. Merely 13.5 per cent has completed primary school and the share of people with a degree level was a fraction at 2 per cent. Again, there are huge differences between men and women, and urban and rural regions (A.2., Table 29). Skills and Training Over a million (1030 thousand) Nepalese over 14 years of age or 8.7 per cent of the labour force had received vocational or professional training by 2008 (A.2., Table 34). This figure stood at 403 thousand in , so there had been a large expanse in the spread of vocational facilities (LFS ). Training for mathematics and computer skills grew almost ten-fold. About 47.4 per cent of the beneficiaries of training were women. Most of the training was short term and about half of the trained persons had undergone training for between 1-6 months. 6.2 Health Though Nepal performed better than South Asia as a whole on health related indicators (Table 6.6), there was still much scope for improvement. Infant mortality rates fell quite drastically from 64 per 1000 in 2001 but remained quite high at 48 per 1000 in A fifth of Nepalese babies were born underweight and about half of all children under five years of age were malnourished. An average Nepalese was expected to live up to 64 years of age (Nepal in Figures 2008). However, HIV prevalence rates were still low at 2.5 per 1000 persons in 2007 (Key Indicators for Asia and the Pacific 2010). Table 6.6: Comparison of health indicators for Nepal with other countries* Nepal India Bangladesh Bhutan South Asia World Health expenditure per capita, PPP (2005 int l $) Health expenditure, private (% of GDP) Health expenditure, public (% of GDP) Improved sanitation facilities (% of pop. with access) Rural Urban Improved water source (% of pop. with access) Rural Urban Low-birth weight babies (% of births) Malnutrition prevalence, height for age (% of < 5) Malnutrition prevalence, weight for age (% of < 5) Prevalence of undernourishment (% of pop.) Prevalence of wasting (% of < 5) *Data is for latest available year since 2005 Source: WDI
38 Health expenditure both public and private was low (Table 6.6). There was one hospital bed for every 3,800 Nepalese in and one government employed doctor for every 19,380 people (Nepal in Figures 2008). 6.3 Main findings Though Nepal is one of the healthiest countries in South Asia with healthy children and low HIV prevalence, the human resource of Nepal is still underdeveloped and underutilized with regard to education. Little over half of the working age population is literate. Though progress has been made in this area over the past decade, the situation remains grim. Of the half of the working age population that attended school, only 42 per cent attained primary education and only 3.7 per cent a university degree. Women and people living in rural areas are particularly disadvantaged in this respect. A girl is only half as likely as a boy to attend school. A child in the village is also only half as likely as a child in the city to attend school and twice as likely to drop out within the first few years. Vocational training has, however, been on the rise, especially in mathematics and computer skills. Since until 2008, 627 thousand Nepalese or 5.3 per cent of the 2008 labour force gained vocational training. Almost half of the trainees were women. 30
39 7. Macroeconomic Structure While the human capital is underdeveloped ( 5), when one considers the high underutilization of already present human resources it seems that the lack of opportunities for utilization of those resources is a critical constraint as well. 36 That is, it is the structural problems that have been hindering growth which are the main limitation. We turn to some of these in this section. 37 In the 1990s, Nepal followed the path of liberalization with important reforms such as deregulation of trade, industry and finance, privatization of enterprises, and a sharp reduction of import tariffs. Despite this, economic growth and structural transformation has remained slow. 7.1 Growth GDP grew at an average of 3.9 per cent per annum since 2002 (Figure 9). This rate was considerably lower than that of other South Asian economies over the same period (A.2., Table 36). Given a large population growth rate, this implied that per capita income grew even more slowly, at 2 per cent an annum. ADB-ILO 2009 argued that at a constant growth rate Nepal would need an additional 36 years to double their per capita GDP and 31 years to arrive at Bangladesh s level. Longstanding structural problems are often cited as the cause for this lackluster growth poor energy supply and infrastructure, a lacking business climate and political instability. GDP growth has also been relatively volatile - in the pre-crisis year of , one witnessed a peak GDP growth rate of 5.8 per cent. The crisis brought this growth rate down again, but it remains above the pre-crisis growth levels. Figure 9 36 Unemployment rate for higher-educated workers is quite high, indicating that the supply is larger than demand. Moreover, ADB-ILO 2009 finds that Nepal s enterprise structure does not depend on a highly educated workforce and that returns to education are not disproportionately high which would not have been the case had an educated workforce been a constraint to growth. 37 For a detailed analysis on these constraints to growth and investment, see ADB-ILO 2009 and Nepal Country Profile


40 Figure When one considers what has been driving growth, the emerging results are not very encouraging. Private consumption accounted for the largest share - 80 per cent - of GDP in 38 GFCF stands for gross fixed capital formation. 32
41 but it grew the slowest at 3.5 per cent an annum over to (Figure 10). This slow growth in domestic demand has been despite the increasing injection of remittances (Figure 2) in the economy. Some of these remittances were absorbed by growth in imports (5.3 per cent), while others are possibly reflected in the residual term which has shown an exponential rise. Gross capital formation had a high growth rate of 8.7 per cent an annum. However, this has mainly been due to growth in stocks (23.3 per cent) rather than fixed capital formation (3.1 per cent, A.2., Table 37). Both government and private fixed investment grew much slower than stocks. This implies that actual investment in terms of production capacity in the economy has been quite low, and low real investment has kept growth prospects low. 39 Figure Despite an increasing degree of integration in the world economy via several regional trade agreements such as the Nepal-India Trade Agreement of and membership to the WTO in 2004, export earnings fluctuated a lot over the past decade and actually fell overall (Figure 11). On the other hand, imports consistently rose so that the trade balance fell to per cent of GDP in (Economic Survey ). Exports today account for only per cent and imports as much as per cent of GDP. It seems 39 The exponential growth of stocks also indicates an error in estimation. If it were purely inventories of materials, then there would be fluctuations in the value as estimates of future sales might be more or less than actual sales. Consistent and large growth in the item is not credible. In fact, the stock component in Nepalese national accounts is used as a residual item to balance the expenditure and income side. One may infer that the noninvestment data and anomalies included under this item are accumulating each year. This further implies either an erroneous method of computing national accounts or the increasing presence of another expenditure item that does not fit into other main categories. 40 RoW stands for Rest of the world. 41 Aimed to stabilize trading provisions and to develop tariff free facilities to export primary goods. India will exempt the additional tariff levied on Nepalese products (Ministry of Commerce and Supplies, 2010) and both agreed to implement an Intergovernmental Committee. 33
42 that the only export of Nepal that has really taken off during this time of increasing liberalization has been labour! The recent crisis has brought about a further worsening in the export balance as lower international demand and an appreciating rupee have led to a further fall in export demand. Imports have increased during the crisis, on the other hand, as remittances have continued to rise. 7.2 Macroeconomic fundamentals The Nepalese rupee is pegged to the Indian rupee (1.60 NRs = 1 INR) so that Nepal imports inflation into the country. Inflation was historically single-digit in Nepal due to this peg and a prudent fiscal policy, but with rising food and oil prices, inflation had been on the rise since early 2007 (Figure 12). Moreover, for a period of two years between 2007 and 2009, inflation in Nepal was higher than inflation in India (due to loose monetary policy), indicating a loss of competitiveness of exports vis-à-vis its main trade partner. The Nepalese government has maintained fiscal moderation despite the political transition and the national debt had been reduced until about Since then, the deficit as percentage of GDP has risen, partly due to an expansionary fiscal policy during the crisis. Figure 12 Though the trade balance has been worsening (Economic Survey ), the current account deficit has been under check due to the large inflow of remittances. As reported in IMF Article IV 2010 By the end of 2008/09, remittances at 21 per cent of GDP were three times exports and covered two thirds of imports. Remittances have sustained consumption and to a lesser extent investment. Over 80 per cent of remittances come from the Gulf countries (GCCs) and Malaysia: migrants are employed mainly as construction workers, security guards, drivers and cooks, etc. Estimates of the number of migrants to India vary widely, but remittances from India are less than 15 per cent of the total. With a slowing 34


43 growth of remittances in and a further decline in exports, the current account is expected to shift to a GDP deficit for the first time in years. Remittances have also fuelled an asset price boom as there was rapid credit growth and proliferation of institutions such as in real estate. In 2009, domestic credit expanded by an astounding 26.6 per cent. 42 The IMF finds that Nepalese banks are vulnerable to liquidity crunches like the recent one and to a deterioration in the quality of assets. According to the IMF, banks overextended themselves and credit-to-deposit ratios climbed to nearly 90 per cent by January Sectoral composition and productivity More than half of the Nepalese GDP came from services in 2009 while agriculture contributed to 36 per cent of it. Industry only constituted 7.6 per cent of the economy. Structural transition away from agriculture towards other sectors has been slow and the structural breakup of the economy has almost remained stagnant over the past 10 years (Figure 13a). Figure 13a 42 Economic Survey
44 Figure 13b Industry Moreover, whatever shift there has been, has not been one from agriculture towards industry, but instead towards services which have grown the fastest. Industry has stagnated (A.2., Table 43). Agriculture, though monsoon dependent and thus capricious in output, has grown at an average of 3.05 per year over the last decade (A.2., Table 44). The main growth generator services, has grown at 5 per cent a year and this growth has also been the most stable. Industry has been dismal in performance, growing at just under 2 per cent an annum in the pre-crisis years ( ) and at 0.43 per cent per year since. It was the only sector in Nepal to really be affected by the crisis, affected by reduced export demand. The lack of a strong structural transition has also meant that those engaged in lowproductivity sectors like agriculture are not being moved towards more productive ones. Indeed, the mismatch between employment and productivity is a fixture in the Nepalese set-up (Figure 13b). On one hand, 74 per cent of people work in agriculture, but only produce 37 per cent of output, while on the other hand, 19.3 per cent of Nepalese work in services and produce as much as 55.5 per cent of output! This implies great inequalities among workers in agriculture and those in services. Table 7.1: Sectoral breakdown of GDP and employment and productivity Share of Share of Annual real growth Employment employment ment 2000/01- GDP Employ- Production* 000 elasticity NRs (%) (%) / Productivity Change Agriculture ' Agriculture, fishing ' Industry ' Mining and quarrying ' Manufacturing ' Services ' Electricity, gas and ' Construction ' Trade: wholesale, retail ' Hotels and restaurants ' Transport, storage ' Financial intermediation ' Real estate, renting ' Public administration ' Education ' Health care ' Other ' Private household Total/average ' *Growth for production is considered for slightly different years as employment as there was no continuity between in the GDP deflator used. Source: LFS , 2008 and Economic Survey Productivity When one looks at a more detailed break-up of employment elasticity and productivity (Table 7.1), one finds that most of the employment gains were in services where employment grew almost as much as production. The gains were mostly in the subsectors of trade, hotels and restaurants, education and transport and storage. Of these, the largest 36
45 contributor was trade (37 per cent of all gains) with an employment elasticity as high as which means people were most likely absorbed in low-level services such as street vending and other last-resort activities that people are forced into out of need rather than want. Hotels and restaurants and real estate and renting too had elasticities of employment above one indicating increases in employment at the expense of productivity. Despite this, productivity in services remained the highest much higher than agriculture or industry. There were some gains in employment in industry, but entirely at the expense of productivity and efficiency. Productivity fell by 3.1 per cent per annum during the last decade. While output in the sector remained stagnant, employment grew at 3.61 per year. This was mainly due to manufacturing rather than mining and quarrying, as it constituted most of the industrial sector. However, productivity in industry was still about double of agriculture and so this shift of labour from agriculture to industry was welcome in creating more income equality. In agriculture, increases in output could be equally attributed to increases in employment and productivity as the employment elasticity was 0.51 Overall, total employment growth averaged 2.22 per cent per year between and 2008, while the GDP during the same period grew at 3.67 per cent implying a health overall employment elasticity of 0.61 every additional unit of output was composed of 60 per cent productivity gains and 40 per cent employment gains. Most of the productivity gains in the economy were in agriculture where growth was not at the cost of productivity and where most of the jobs are. 7.4 Main findings Economic growth has been low in Nepal, despite liberalization and economic reforms. Both private consumption and fixed investment grew at dismal rates. Export earnings fell overall during the past decade, while imports rose unceasingly. Though the trade balance has been falling, remittances have maintained the current account balance. Remittances have also fuelled an asset price boom in the country. Though the government has maintained fiscal prudence, inflation has been high. Most of it was imported from India or driven by food and oil prices. Services is the largest economic sector, contributing to over half the GDP. Agriculture too is large, while industry holds only a single-digit share. Structural transformation from agriculture to non-agriculture sectors has been slow and there is a productivity-mismatch in the country as the majority of people are engaged in agriculture while it produces only a third of GDP. Overall, over the past decade, a 1 per cent growth in GDP led to a 0.6 per cent increase in employment. This is a healthy employment elasticity overall as economic growth has meant both increases in employment and in efficiency. However, this figure is mainly contributed by agriculture that had a healthy growth pattern. Employment growth in other sectors especially manufacturing and trade was at the expense of productivity. 37

46 8. Disaggregation of growth In the introduction, the equation for decomposition of growth from a labour perspective was presented. The results for Nepalese growth over to 2008 are presented in Table 8.1. Over the decade, GDP per capita grew by 30 per cent. Most of this 78 per cent came from gains in productivity which grew by over 23 per cent. The other big contributor was the age structure (14 per cent of total GDP per capita growth) wherein an improvement in the ratio of working age population to total population increased income per capita. Labour force participation and employment rate improvements were miniscule and did not have a big role in economic progress. Table 8.1: Disaggregation of growth between and Growth (%) 1 GDP per capita, 000 NRs * 18,542 24, Age structure, ratio Labour force participation, ratio Employment rate, ratio Productivity, 000 NRs * 39,850 49, Sum (Error = 1.32) *base year Source: LFS , 2008, Economic Survey , Source:WDI 2010 Figure 14 This trend is likely to continue into the future as the age structure will become more favourable while there remains no real scope for gains in labour force participation or employment rates. Productivity gains the largest driver of growth will determine the magnitude of future economic progress. This is the most effective policy instrument available as it is the only point that one can influence. A word of caution though is that this black box that contains many factors such as external shocks, inflationary pressures, new technologies and in fact real productivity improvement; is very volatile. Figure 14 presents this volatility using yearly data from the World Bank. 38
Executive summary. Strong records of economic growth in the Asia-Pacific region have benefited many workers.
 Executive summary Strong records of economic growth in the Asia-Pacific region have benefited many workers. In many ways, these are exciting times for Asia and the Pacific as a region. Dynamic growth and
Conference on What Africa Can Do Now To Accelerate Youth Employment. Organized by
 Conference on What Africa Can Do Now To Accelerate Youth Employment Organized by The Olusegun Obasanjo Foundation (OOF) and The African Union Commission (AUC) (Addis Ababa, 29 January 2014) Presentation
Creating Youth Employment in Asia
 WP-2014-041 Creating Youth Employment in Asia S.Mahendra Dev Indira Gandhi Institute of Development Research, Mumbai October 2014 http://www.igidr.ac.in/pdf/publication/wp-2014-041.pdf Creating Youth Employment
The Demography of the Labor Force in Emerging Markets
 The Demography of the Labor Force in Emerging Markets David Lam I. Introduction This paper discusses how demographic changes are affecting the labor force in emerging markets. As will be shown below, the
THE DEMOGRAPHIC PROFILE OF THE ARAB COUNTRIES
 Distr. LIMITED E/ESCWA/SDD/2013/Technical paper.14 24 December 2013 ORIGINAL: ENGLISH ECONOMIC AND SOCIAL COMMISSION FOR WESTERN ASIA (ESCWA) THE DEMOGRAPHIC PROFILE OF THE ARAB COUNTRIES New York, 2013
Case Study on Youth Issues: Philippines
 Case Study on Youth Issues: Philippines Introduction The Philippines has one of the largest populations of the ASEAN member states, with 105 million inhabitants, surpassed only by Indonesia. It also has
The Jordanian Labour Market: Multiple segmentations of labour by nationality, gender, education and occupational classes
 The Jordanian Labour Market: Multiple segmentations of labour by nationality, gender, education and occupational classes Regional Office for Arab States Migration and Governance Network (MAGNET) 1 The
GLOBALIZATION, DEVELOPMENT AND POVERTY REDUCTION: THEIR SOCIAL AND GENDER DIMENSIONS
 TALKING POINTS FOR THE EXECUTIVE SECRETARY ROUNDTABLE 1: GLOBALIZATION, DEVELOPMENT AND POVERTY REDUCTION: THEIR SOCIAL AND GENDER DIMENSIONS Distinguished delegates, Ladies and gentlemen: I am pleased
ILO Global Estimates on International Migrant Workers
 ILO Global Estimates on International Migrant Workers Results and Methodology Executive Summary Labour Migration Branch Conditions of Work and Equality Department Department of Statistics ILO Global Estimates
Youth labour market overview
 1 Youth labour market overview Youth aged 15-24 account for more than 17 million of the overall 92.3 million Filipino population i. With the 25-29 age group, the young generation in the Philippines comes
STRUCTURAL TRANSFORMATION AND WOMEN EMPLOYMENT IN SOUTH ASIA
 International Journal of Human Resource & Industrial Research, Vol.3, Issue 2, Feb-Mar, 2016, pp 01-15 ISSN: 2349 3593 (Online), ISSN: 2349 4816 (Print) STRUCTURAL TRANSFORMATION AND WOMEN EMPLOYMENT IN
The Poor in the Indian Labour Force in the 1990s. Working Paper No. 128
 CDE September, 2004 The Poor in the Indian Labour Force in the 1990s K. SUNDARAM Email: sundaram@econdse.org SURESH D. TENDULKAR Email: suresh@econdse.org Delhi School of Economics Working Paper No. 128
DECENT WORK IN TANZANIA
 International Labour Office DECENT WORK IN TANZANIA What do the Decent Work Indicators tell us? INTRODUCTION Work is central to people's lives, and yet many people work in conditions that are below internationally
Sri Lanka. Country coverage and the methodology of the Statistical Annex of the 2015 HDR
 Human Development Report 2015 Work for human development Briefing note for countries on the 2015 Human Development Report Sri Lanka Introduction The 2015 Human Development Report (HDR) Work for Human Development
ILO Sub Regional Office for East Asia
 ILO policy brief on youth employment in Cambodia ILO Sub Regional Office for East Asia ILO policy brief on youth employment in Cambodia 2007 ILO Sub Regional Office for East Asia Copyright International
INTERNATIONAL MIGRATION AND DEVELOPMENT IN THE ARAB STATES
 Distr. LIMITED E/ESCWA/SDD/2007/Brochure.1 5 February 2007 ENGLISH ORIGINAL: ARABIC ECONOMIC AND SOCIAL COMMISSION FOR WESTERN ASIA (ESCWA) INTERNATIONAL MIGRATION AND DEVELOPMENT IN THE ARAB STATES United
Inclusive growth and development founded on decent work for all
 Inclusive growth and development founded on decent work for all Statement by Mr Guy Ryder, Director-General International Labour Organization International Monetary and Financial Committee Washington D.C.,
POLICY BRIEF. Assessing Labor Market Conditions in Madagascar: i. World Bank INSTAT. May Introduction & Summary
 World Bank POLICY INSTAT BRIEF May 2008 Assessing Labor Market Conditions in Madagascar: 2001-2005 i Introduction & Summary In a country like Madagascar where seven out of ten individuals live below the
Migration and Families The multiple role of youth in family migration
 OECD Development Centre Migration and Families The multiple role of youth in family migration Jason Gagnon International Dialogue on Migration Geneva 7/8 October 2014 What are the current dynamics of youth
Population Composition
 Unit-II Chapter-3 People of any country are diverse in many respects. Each person is unique in her/his own way. People can be distinguished by their age, sex and their place of residence. Some of the other
The Demographic Profile of Saudi Arabia
 Infant mortality rate (per 1 live births) UNITED NATIONS The Demographic Profile of Saudi Arabia Population Trends - Mortality - Fertility - Age Structure - Urbanization - International Migration - Education
People. Population size and growth. Components of population change
 The social report monitors outcomes for the New Zealand population. This section contains background information on the size and characteristics of the population to provide a context for the indicators
Levels and trends in international migration
 Levels and trends in international migration The number of international migrants worldwide has continued to grow rapidly over the past fifteen years reaching million in 1, up from million in 1, 191 million
The Demographic Profile of Qatar
 UNITED NATIONS The Demographic Profile of Qatar Population Trends - Mortality - Fertility - Age Structure - Urbanization - International Migration - Education and Youth Unemployment Population Trends Population
Youth labour market overview
 1 Youth labour market overview With 1.35 billion people, China has the largest population in the world and a total working age population of 937 million. For historical and political reasons, full employment
Gender, labour and a just transition towards environmentally sustainable economies and societies for all
 Response to the UNFCCC Secretariat call for submission on: Views on possible elements of the gender action plan to be developed under the Lima work programme on gender Gender, labour and a just transition
Global Employment Trends for Women
 December 12 Global Employment Trends for Women Executive summary International Labour Organization Geneva Global Employment Trends for Women 2012 Executive summary 1 Executive summary An analysis of five
Overseas Filipino Workers and their Impact on Household Poverty
 ILO Asian Regional Programme on Governance of Labour Migration Working Paper No.5 Overseas Filipino Workers and their Impact on Household Poverty Geoffrey Ducanes and Manolo Abella January 2008 Copyright
11. Demographic Transition in Rural China:
 11. Demographic Transition in Rural China: A field survey of five provinces Funing Zhong and Jing Xiang Introduction Rural urban migration and labour mobility are major drivers of China s recent economic
Understanding Employment Situation of Women: A District Level Analysis
 International Journal of Gender and Women s Studies June 2014, Vol. 2, No. 2, pp. 167-175 ISSN: 2333-6021 (Print), 2333-603X (Online) Copyright The Author(s). 2014. All Rights Reserved. Published by American
Gender Perspectives in South Asian Political Economy
 Gender Perspectives in South Asian Political Economy Amir Mustafa, Aneesa Rahman and Saeeda Khan 1 Postmodernist era has generated a debate on the male and female participation in political economy in
The Demographic Profile of Oman
 UNITED NATIONS The Demographic Profile of Oman Population Trends - Mortality - Fertility - Age Structure - Urbanization - International Migration - Education and Youth Unemployment Population Trends Population
The Global Economic Crisis Sectoral coverage
 Working Paper No. 271 The Global Economic Crisis Sectoral coverage Trends in Employment and Working Conditions by Economic Activity Statistical Update Third quarter 2009 Sectoral Activities Department
The Demographic Profile of the State of Palestine
 UNITED NATIONS The Demographic Profile of the State of Palestine Population Trends - Mortality - Fertility - Age Structure - Urbanization - International Migration - Education and Youth Unemployment Population
National Assessments on Gender and Science, Technology and Innovation (STI) Overall Results, Phase One September 2012
 Overall Results, Phase One September 2012") National Assessments on Gender and Science, Technology and Innovation (STI) Scorecard on Gender Equality in the Knowledge Society Overall Results, Phase One September 2012 Overall Results The European
National Assessments on Gender and Science, Technology and Innovation (STI) Scorecard on Gender Equality in the Knowledge Society Overall Results, Phase One September 2012 Overall Results The European
Challenges in Creating Employment Opportunities for Youths in Nepal
 Challenges in Creating Employment Opportunities for Youths in Nepal Devendra Pd. Shrestha Central Department of Economics Tribhuvan University Email: devendra1shrestha@gmail.com Prepared for presentation
Rural and Urban Migrants in India:
 Rural and Urban Migrants in India: 1983-2008 Viktoria Hnatkovska and Amartya Lahiri July 2014 Abstract This paper characterizes the gross and net migration flows between rural and urban areas in India
A COMPARISON OF ARIZONA TO NATIONS OF COMPARABLE SIZE
 A COMPARISON OF ARIZONA TO NATIONS OF COMPARABLE SIZE A Report from the Office of the University Economist July 2009 Dennis Hoffman, Ph.D. Professor of Economics, University Economist, and Director, L.
Persistent Inequality
 Canadian Centre for Policy Alternatives Ontario December 2018 Persistent Inequality Ontario s Colour-coded Labour Market Sheila Block and Grace-Edward Galabuzi www.policyalternatives.ca RESEARCH ANALYSIS
Growth and Job Quality in South Asia. Questions and Findings
 CHAPTER 2 Questions and Findings Growth and Job Quality in South Asia Questions What is South Asia s recent track record with regard to the quantity and quality of job creation? What needs to be done to
GLOBAL ECONOMIC CRISIS & GENDER EQUALITY THREATS, OPPORTUNITIES AND NECESSITIES
 GLOBAL ECONOMIC CRISIS & GENDER EQUALITY THREATS, OPPORTUNITIES AND NECESSITIES ICA Gender Equality Committee Seminar: Global Crisis: Gender Opportunity? 17 November 2009 Eva Majurin COOPAfrica, ILO Dar
Quarterly Labour Market Report. February 2017
 Quarterly Labour Market Report February 2017 MB14052 Feb 2017 Ministry of Business, Innovation and Employment (MBIE) Hikina Whakatutuki - Lifting to make successful MBIE develops and delivers policy, services,
People. Population size and growth
 The social report monitors outcomes for the New Zealand population. This section provides background information on who those people are, and provides a context for the indicators that follow. People Population
Migrant Youth: A statistical profile of recently arrived young migrants. immigration.govt.nz
 Migrant Youth: A statistical profile of recently arrived young migrants. immigration.govt.nz ABOUT THIS REPORT Published September 2017 By Ministry of Business, Innovation and Employment 15 Stout Street
CURRENT ANALYSIS. Growth in our own backyard... March 2014
 93619 CURRENT ANALYSIS March 14 Composition of the Canadian population % of total adult population 15+ 8 6 4 2 14.1.9 14.9 42.5 * Labour Force Participation Rate % of Population in the Labour Force 69
Pakistan s Economy: Opportunities and Challenges I have been asked to speak today on the subject of Opportunities and Challenges for Pakistan s
 Pakistan s Economy: Opportunities and Challenges I have been asked to speak today on the subject of Opportunities and Challenges for Pakistan s Economy. I have a very simple take on this. The current economic
DRIVERS OF DEMOGRAPHIC CHANGE AND HOW THEY AFFECT THE PROVISION OF EDUCATION
 DRIVERS OF DEMOGRAPHIC CHANGE AND HOW THEY AFFECT THE PROVISION OF EDUCATION This paper provides an overview of the different demographic drivers that determine population trends. It explains how the demographic
Migrant Domestic Workers Across the World: global and regional estimates
 RESEARCH SERIES GLOBAL ACTION PROGRAMME ON MIGRANT DOMESTIC WORKERS AND THEIR FAMILIES Migrant Domestic Workers Across the World: global and regional estimates Based on the ILO report on Global estimates
Youth labour market overview
 0 Youth labour market overview Turkey is undergoing a demographic transition. Its population comprises 74 million people and is expected to keep growing until 2050 and begin ageing in 2025 i. The share
The Role of Labor Market in Explaining Growth and Inequality: The Philippines Case. Hyun H. Son
 The Role of Labor Market in Explaining Growth and Inequality: The Philippines Case Hyun H. Son Economic and Research Department Asian Development Bank Abstract: This paper analyzes the relationship between
Human Population Growth Through Time
 Human Population Growth Through Time Current world population: 7.35 Billion (Nov. 2016) http://www.worldometers.info/world-population/ 2012 7 billion 1999 13 years 12 years 1974 1927 1804 13 years 14 years
The Demographic Profile of Kuwait
 UNITED NATIONS The Demographic Profile of Kuwait Population Trends - Mortality - Fertility - Age Structure - Urbanization - International Migration - Education and Youth Unemployment Population Trends
STRENGTHENING RURAL CANADA: Fewer & Older: The Coming Demographic Crisis in Rural Ontario
 STRENGTHENING RURAL CANADA: Fewer & Older: The Coming Demographic Crisis in Rural Ontario An Executive Summary 1 This paper has been prepared for the Strengthening Rural Canada initiative by: Dr. Bakhtiar
Employment and Unemployment Scenario of Bangladesh: A Trends Analysis
 Employment and Unemployment Scenario of Bangladesh: A Trends Analysis Al Amin Al Abbasi 1* Shuvrata Shaha 1 Abida Rahman 2 1.Lecturer, Department of Economics, Mawlana Bhashani Science and Technology University,Santosh,
The business case for gender equality: Key findings from evidence for action paper
 The business case for gender equality: Key findings from evidence for action paper Paris 18th June 2010 This research finds critical evidence linking improving gender equality to many key factors for economic
YOUTH EMPLOYMENT REPORT IN INDONESIA. an update
 YOUTH EMPLOYMENT REPORT IN INDONESIA an update 1 Copyright@International Labour Organization 2004 First published 2004 Publications of the International Labour Office enjoy copyright under Protocol 2 of
Labour and Social Trends in Nepal 2010
 Labour and Social Trends in Nepal 2010 National Planning Commission Government of Nepal International Labour Office ILO Country Office for Nepal Copyright International Labour Organization 2010 First published
Employment opportunities and challenges in an increasingly integrated Asia and the Pacific
 Employment opportunities and challenges in an increasingly integrated Asia and the Pacific KEIS/WAPES Training on Dual Education System and Career Guidance Kee Beom Kim Employment Specialist ILO Bangkok
Youth and Employment in North Africa: A Regional Overview
 Youth and Employment in North Africa: A Regional Overview A Report Prepared for the Conference on Youth and Employment in North Africa Geneva, September 2017 September 2017 Contents 1. Introduction 5
Short-Term Migrant Workers: The Case of Ukraine
 Short-Term Migrant Workers: The Case of Ukraine Department of Statistics Conditions of Work and Equality Department Labour Migration Branch Short-Term Migrant Workers: The Case of Ukraine Short-Term Migrant
Internal Migration to the Gauteng Province
 Internal Migration to the Gauteng Province DPRU Policy Brief Series Development Policy Research Unit University of Cape Town Upper Campus February 2005 ISBN 1-920055-06-1 Copyright University of Cape Town
The Demographic Profile of the United Arab Emirates
 UNITED NATIONS The Demographic Profile of the United Arab Emirates Population Trends - Mortality - Fertility - Age Structure - Urbanization - International Migration - Education and Youth Unemployment
Migrant Workers: The Case of Moldova
 TECHNICAL REPORT Migrant Workers: The Case of Moldova The ILO Labour Force Migration Survey (LFMS) was conducted in the Republic of Moldova in the last quarter of 2012 in order to assess the extent of
ASSESSING THE ECONOMIC IMPACT OF FOREIGN WORKERS IN MALTA
 ASSESSING THE ECONOMIC IMPACT OF FOREIGN WORKERS IN MALTA Article published in the Quarterly Review 2016:1, pp. 39-44 BOX 3: ASSESSING THE ECONOMIC IMPACT OF FOREIGN WORKERS IN MALTA 1 Between the late
Is Economic Development Good for Gender Equality? Income Growth and Poverty
 Is Economic Development Good for Gender Equality? February 25 and 27, 2003 Income Growth and Poverty Evidence from many countries shows that while economic growth has not eliminated poverty, the share
The Demographic Profile of Somalia
 UNITED NATIONS The Demographic Profile of Somalia Population Trends - Mortality - Fertility - Age Structure - Urbanization - International Migration - Education and Youth Unemployment Population Trends
Chapter 1. Why Focus on Youth Employment?
 Chapter 1 Why Focus on Youth Employment? Chapter Highlights High youth unemployment, regardless of education level, is an important issue for middle-income countries. In low-income countries, youth from
Rural and Urban Migrants in India:
 Rural and Urban Migrants in India: 1983 2008 Viktoria Hnatkovska and Amartya Lahiri This paper characterizes the gross and net migration flows between rural and urban areas in India during the period 1983
Full employment and decent work for all: Regional Highlights
 The ECA Region The ECE Region The ECLAC Region The ESCAP Region The ESCWA Region Full employment and decent work for all: Regional Highlights Most countries are, at varying degrees, confronted with the
Jens Thomsen: The global economy in the years ahead
 Jens Thomsen: The global economy in the years ahead Statement by Mr Jens Thomsen, Governor of the National Bank of Denmark, at the Indo- Danish Business Association, Delhi, 9 October 2007. Introduction
Fiscal Impacts of Immigration in 2013
 www.berl.co.nz Authors: Dr Ganesh Nana and Hugh Dixon All work is done, and services rendered at the request of, and for the purposes of the client only. Neither BERL nor any of its employees accepts any
Human Development Indices and Indicators: 2018 Statistical Update. Pakistan
 Human Development Indices and Indicators: 2018 Statistical Update Briefing note for countries on the 2018 Statistical Update Introduction Pakistan This briefing note is organized into ten sections. The
LABOUR AND EMPLOYMENT
 5 LABOUR AND EMPLOYMENT The labour force constitutes a key resource that is vital in the growth and development of countries. An overarching principle that guides interventions affecting the sector aims
Livelihood And Employment Creation. Women's entrepreneurship development in refugee contexts
 Livelihood And Employment Creation Women's entrepreneurship development in refugee contexts Copyright@International Labour Organization 2005 First published 2005 Publications of the International Labour
Impact of Economic Freedom and Women s Well-Being
 Impact of Economic Freedom and Women s Well-Being ROSEMARIE FIKE Copyright Copyright 2018 by the Fraser Institute. All rights reserved. No part of this publication may be reproduced in any manner whatsoever
PRI Working Paper Series No. 2
 PRI Working Paper Series No. 2 Input Text i Contents List of Tables... ii List of Figures... iii ABSTRACT... iv Employment, Productivity, Real Wages and Labor Markets in Bangladesh... 1 A. Overview and
Regional Disparities in Employment and Human Development in Kenya
 Regional Disparities in Employment and Human Development in Kenya Jacob Omolo 1 jackodhong@yahoo.com; omolo.jacob@ku.ac.ke ABSTRACT What are the regional disparities in employment and human development
Belize. (21 session) (a) Introduction by the State party
 (a) Introduction by the State party") Belize st (21 session) 31. The Committee considered the combined initial and second periodic reports of Belize (CEDAW/C/BLZ/1-2) at its 432nd, 433rd and 438th meetings, on 14 and 18 June 1999. (a) Introduction
Belize st (21 session) 31. The Committee considered the combined initial and second periodic reports of Belize (CEDAW/C/BLZ/1-2) at its 432nd, 433rd and 438th meetings, on 14 and 18 June 1999. (a) Introduction
A Preliminary Snapshot
 The Economic and Social Impact of the Global Crisis in the Philippines: A Preliminary Snapshot Forum on Decent Work and Social Justice in Times of Crisis 22 April 2009 SMX Convention Center Pasay City
United Nations Economic and Social Commission for Asia and the Pacific (ESCAP) A. INTRODUCTION
 A. INTRODUCTION") FOLLOW-UP ACTIVITIES RELATING TO THE 2006 HIGH-LEVEL DIALOGUE ON INTERNATIONAL MIGRATION AND DEVELOPMENT United Nations Economic and Social Commission for Asia and the Pacific (ESCAP) A. INTRODUCTION As
FOLLOW-UP ACTIVITIES RELATING TO THE 2006 HIGH-LEVEL DIALOGUE ON INTERNATIONAL MIGRATION AND DEVELOPMENT United Nations Economic and Social Commission for Asia and the Pacific (ESCAP) A. INTRODUCTION As
I. LEVELS AND TRENDS IN INTERNATIONAL MIGRANT STOCK
 I. LEVELS AND TRENDS IN INTERNATIONAL MIGRANT STOCK A. INTERNATIONAL MIGRANT STOCK BY DEVELOPMENT GROUP The Population Division estimates that, worldwide, there were 214.2 million international migrants
Rev. soc. polit., god. 25, br. 3, str , Zagreb 2018.
 doi: 10.3935/rsp.v25i3.1522 ESTIMATING LABOUR MARKET SLACK IN THE EUROPEAN UNION John Hurley and Valentina Patrini Dublin: Eurofound, 2017., 56 str. In the social policy and political discussions sufficient
Human development in China. Dr Zhao Baige
 Human development in China Dr Zhao Baige 19 Environment Twenty years ago I began my academic life as a researcher in Cambridge, and it is as an academic that I shall describe the progress China has made
MAGNET Migration and Governance Network An initiative of the Swiss Development Cooperation
 International Labour Organization ILO Regional Office for the Arab States MAGNET Migration and Governance Network An initiative of the Swiss Development Cooperation The Kuwaiti Labour Market and Foreign
About half the population of the Kyrgyz
 Building a fair society Kyrgyzstan s unions and poverty reduction In Kyrgyzstan, trade unions have been closely involved in drawing up and implementing the National Poverty Reduction Programme. They believe
Trends in international migration and remittance flows: Case of Bangladesh
 J. Bangladesh Agril. Univ. 7(2): 387 394, 2009 ISSN 1810-3030 Trends in international migration and remittance flows: Case of Bangladesh K. S. Farid, L. Mozumdar, M. S. Kabir and K. B. Hossain 1 Department
Regional Consultation on International Migration in the Arab Region
 Distr. LIMITED RC/Migration/2017/Brief.1 4 September 2017 Advance copy Regional Consultation on International Migration in the Arab Region In preparation for the Global Compact for Safe, Orderly and Regular
Determinants of International Migration in Egypt: Results of the 2013 Egypt-HIMS
 Determinants of International Migration in Egypt: Results of the 2013 Egypt-HIMS Rawia El-Batrawy Egypt-HIMS Executive Manager, CAPMAS, Egypt Samir Farid MED-HIMS Chief Technical Advisor ECE Work Session
EXECUTIVE SUMMARY. Executive Summary
 Executive Summary This report is an expedition into a subject area on which surprisingly little work has been conducted to date, namely the future of global migration. It is an exploration of the future,
Introduction and overview
 Introduction and overview 1 Sandrine Cazes Head, Employment Analysis and Research Unit, International Labour Office Sher Verick Senior Employment Specialist, ILO Decent Work Team for South Asia PERSPECTIVES
Decent Work and Sustainable Development Goals Baseline Indicators 1
 Decent Work and Sustainable Development Goals Baseline Indicators 1 May 2018 In September 2015, the 193 Member States of the United Nations, including Myanmar, adopted the landmark 2030 Sustainable Development
Reducing Poverty in the Arab World Successes and Limits of the Moroccan. Lahcen Achy. Beirut, Lebanon July 29, 2010
 Reducing Poverty in the Arab World Successes and Limits of the Moroccan Experience Lahcen Achy Beirut, Lebanon July 29, 2010 Starting point Morocco recorded an impressive decline in monetary poverty over
Human Development Indices and Indicators: 2018 Statistical Update. Indonesia
 Human Development Indices and Indicators: 2018 Statistical Update Briefing note for countries on the 2018 Statistical Update Introduction Indonesia This briefing note is organized into ten sections. The
Labor Migration in the Kyrgyz Republic and Its Social and Economic Consequences
 Network of Asia-Pacific Schools and Institutes of Public Administration and Governance (NAPSIPAG) Annual Conference 200 Beijing, PRC, -7 December 200 Theme: The Role of Public Administration in Building
Long-term unemployment in Central Europe: A review of its nature and determinants in five countries
 EMPLOYMENT E Employment Policy Department EMPLOYMENT Working Paper No. 218 2017 Long-term unemployment in Central Europe: A review of its nature and determinants in five countries Alena Nesporova Employment
QUANTITATIVE ANALYSIS OF RURAL WORKFORCE RESOURCES IN ROMANIA
 QUANTITATIVE ANALYSIS OF RURAL WORKFORCE RESOURCES IN ROMANIA Elena COFAS University of Agricultural Sciences and Veterinary Medicine of Bucharest, Romania, 59 Marasti, District 1, 011464, Bucharest, Romania,
Ghana Lower-middle income Sub-Saharan Africa (developing only) Source: World Development Indicators (WDI) database.
 Source: World Development Indicators (WDI) database.") Knowledge for Development Ghana in Brief October 215 Poverty and Equity Global Practice Overview Poverty Reduction in Ghana Progress and Challenges A tale of success Ghana has posted a strong growth performance
Knowledge for Development Ghana in Brief October 215 Poverty and Equity Global Practice Overview Poverty Reduction in Ghana Progress and Challenges A tale of success Ghana has posted a strong growth performance
Changing Times, Changing Enrollments: How Recent Demographic Trends are Affecting Enrollments in Portland Public Schools
 Portland State University PDXScholar School District Enrollment Forecast Reports Population Research Center 7-1-2000 Changing Times, Changing Enrollments: How Recent Demographic Trends are Affecting Enrollments
Chapter One: people & demographics
 Chapter One: people & demographics The composition of Alberta s population is the foundation for its post-secondary enrolment growth. The population s demographic profile determines the pressure points
Following are the introductory remarks on the occasion by Khadija Haq, President MHHDC. POVERTY IN SOUTH ASIA: CHALLENGES AND RESPONSES
 The Human Development in South Asia Report 2006 titled Poverty in South Asia:Challenges and Responses, was launched on May 25, 2007 in Islamabad, Pakistan. The Prime Minister of Pakistan, Mr. Shaukat Aziz