Asylum Levels and Trends in Industrialized Countries. Statistical overview of asylum applications lodged in Europe and selected non-european countries
|
|
|
- Thomas Holmes
- 5 years ago
- Views:
Transcription


1 2011 Asylum Levels and Trends in Industrialized Countries Statistical overview of asylum applications lodged in Europe and selected non-european countries
2 Trends at a Glance 2011 in review 20% An estimated 441,300 asylum applications were registred in 2011 in the 44 countries included in this report, some 73,300 claims or 20 per cent more than in 2010 (368,000). The 2011 level is the highest since 2003 when 505,000 asylum applications were lodged in the industrialized countries. 327,200 10% The 38 countries in Europe received 327,200 claims, an increase of 19 per cent compared to 2010 (274,700 claims). In the Nordic countries, the number of newly registered asylum-seekers decreased by 10 per cent to 45,700, a similar level to those of 2007 and The decrease was uniform across all countries. +19% 87% 15% The 27 Member States of the European Union registered 277,400 asylum claims in 2011, a 15 per cent increase compared to 2010 (240,400). The EU-27 together accounted for 85 per cent of all asylum claims in Europe. In Europe, the largest relative increase in annual asylum levels occurred in the eight Southern European countries which received 66,800 asylum requests during 2011, an 87 per cent increase compared to This increase is due mainly to boat arrivals in Italy and Malta and to the registration of greater numbers of individual requests for international protection in Turkey (+74%). 2 Asylum Levels and Trends in Industrialized Countries
3 77% Who is an asylum-seeker? 13,000 The number of asylum-seekers in Australia and New Zealand decreased by 9 per cent during 2011 (11,800 claims) compared to the previous year (13,000). This is the first decrease in six years. 1/4 In North America, an estimated 99,400 new asylum applications were submitted in 2011, almost a quarter (+20,700 claims) more than in The figures for Canada and the United States of America show a similar trend. 16,700 11,800 For asylum-seekers from Côte d Ivoire, Libya, the Syrian Arab Republic, and Tunisia, levels were at a record high among the industrialized countries. Asylumseekers originating from these four countries submitted in total 16,700 claims more than in Japan and the Republic of Korea registered a combined number of 2,900 new asylum claims in 2011, a 77 per cent increase compared to 2010 (1,600 claims) and the highest on record. 1. USA 2. FRA 3. GER 4. ITA 5. SWE 53 % 47 % others With an estimated 74,000 asylum applications, the United States of America was the largest single recipient of new asylum claims among the 44 industrialized countries. France was second with 51,900 asylum applications, followed by Germany (45,700), Italy (34,100) (1), and Sweden (29,600). The top five receiving countries together accounted for more than half (53%) of all asylum claims received in the countries included in this report. Top 5 An asylum-seeker is an individual who has sought international protection and whose claim for refugee status has not been determined yet. As part of its obligation to protect refugees on its territory, the country of asylum is normally responsible for determining whether an asylumseeker is a refugee or not. This responsibility is often incorporated in national legislation of the country and, for State Parties, is derived from the 1951 Convention Relating to the Satus of Refugees. 1. afghanistan 2. china 3. IRAQ 4. serbia (and Kosovo: S/RES/1244 (1999)) 5. PAKISTAN With 35,700 asylum claims lodged in 2011, Afghanistan was the most important source country of asylum-seekers in the 44 industrialized countries, followed by China (24,400 claims), Iraq (23,500), Serbia (and Kosovo: Security Council resolution 1244 (1999)) (2) (21,200), and Pakistan (18,100). Slightly less than half of all asylum claims were submitted by individuals originating from Asia (45%). Africa was the second most important source continent (27% of all claims), followed by Europe (15%), and the Americas (8%). 1 This figure is provisional and subject to change since the Government of Italy is still processing asylum claims received in Henceforth referred to in this document as Serbia (and Kosovo: S/RES/1244 (1999)). Asylum Levels and Trends in Industrialized Countries

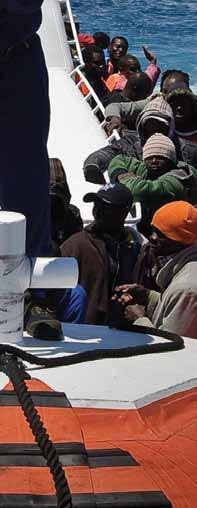
4 Refugees in the Loran reception centre on the Italian island of Lampedusa. 4 Asylum Levels and Trends in Industrialized Countries
5 I Introduction This report summarizes patterns and trends in the number of individual asylum claims (3) submitted in Europe and selected non-european countries during The data presented are based on information available as of 14 March 2012, unless otherwise indicated. The report covers the 38 European and six non-european States that currently provide monthly asylum statistics to UNHCR. Figures are mostly based on official asylum statistics, reflecting national laws and procedures. In addition, UNHCR conducted refugee status determination under its mandate in a number of countries included in this report. (4) Annex Table 2 provides trends in selected Eastern European countries, based on annual data. UNHCR / L. Senigalliesi The group of countries analysed is referred to collectively as the 44 industrialized countries and is defined as such for the purposes of this report only. The 44 countries are: 27 Member States of the European Union (5), Albania, Bosnia and Herzegovina, Croatia, Iceland, Liechtenstein, Montenegro, Norway, Serbia (and Kosovo: S/RES/1244 (1999)), Switzerland, The former Yugoslav Republic of Macedonia, and Turkey, as well as Australia, Canada, Japan, New Zealand, the Republic of Korea and the United States of America. The group of 44 countries received an estimated 441,300 asylum applications in The numbers in this report reflect asylum claims made at the first instance of asylum procedures. Applications on appeal or review are not included, nor is information on the outcome of asylum procedures or on the admission of refugees through resettlement programmes, as such details are available in other UNHCR reports. (6) To the extent possible, the statistics presented reflect the number of individuals lodging an asylum application for the first time. However, some of the figures quoted in this report are likely to include repeat applications, and therefore may not reflect the actual number of new asylum-seekers. Also, the number of asylum applications may not reflect the number of asylumseekers, as some individuals seek asylum in more than one country during the same year. (7) All data refer to the number of individuals with the exception of asylumseekers in the United States of America where figures are available only for the number of cases (which may include several individuals) for applications submitted to the United States Department of Homeland Security (DHS). However, applications submitted to the United States Department of Justice, Executive Office of Immigration Review (EOIR), are recorded as individuals. To allow comparability across countries of asylum, UNHCR uses a figure of 1.4 individuals per case to estimate the number of people reported by DHS, because historical data suggest that, on average, one asylum case contains 1.4 individuals. In the country of origin tables, figures for the United States of America are a combination of the number of cases (DHS) and the number of individuals (EOIR), owing to the large variation in family size by nationality. All figures in this report should be considered as provisional and subject to change. Due to retroactive changes and adjustments, some of the data included in this publication may differ slightly from that reported in previous UNHCR documents or from the official figures published by States. 3 An asylum-seeker is an individual who has sought international protection and whose claim for refugee status has not yet been determined. As part of its obligation to protect refugees on its territory, the country of asylum is normally responsible for determining whether an asylum-seeker is a refugee or not. This responsibility is often incorporated in national legislation of the country and, for State Parties, is derived from the 1951 Convention Relating to the Status of Refugees. 4 During the period , UNHCR conducted refugee status determination under its mandate in Cyprus (northern part of Cyprus only), Montenegro, Serbia (and Kosovo: S/RES/1244 (1999)), and Turkey (see notes in Annex Table 1 for more details). 5 See Annex Table 1 for a list of countries. 6 See UNHCR s 2010 Statistical Yearbook at 7 According to EURODAC s Central Unit, the verification of asylum claims in 2010 showed that 24.2 per cent of all asylum claims registered in the system were multiple claims, i.e. the applicant had submitted at least one previous application in the same or another Member State of the European Union. (Source: eu/home-affairs/doc_centre/asylum/asylum_identification_en.htm) Asylum Levels and Trends in Industrialized Countries

6 People queuing outside the Belgian Department of Immigration in Brussels waiting to file an asylum application. The Department takes photos, fingerprints and a chest-x-ray. Personal data are also registered. 6 Asylum Levels and Trends in Industrialized Countries
7 II Global and Regional Trends(8) The year 2011 was characterized by a significant number of people seeking asylum or refugee status from countries experiencing recent or ongoing conflict, turmoil or security concerns. This applies in particular to asylum-seekers originating from Afghanistan, Côte d Ivoire, Libya, the Syrian Arab Republic, and Tunisia. UNHCR / D. Telemans Following averages of roughly 370,000 asylum applications per year in the 44 industrialized countries since 2008, significant increases were registered in An estimated 441,300 asylum applications were recorded in the 44 countries, representing some 73,300 claims (+20%) more than in 2010 (368,000). The 2011 level was the highest since 2003 when more than 505,000 asylum applications were lodged in the industrialized countries. As shown in Figure 1, the overall increase observed in 2011 applies to most major regions analysed in this report. Out of a total of 441,300 asylum applications registered in 2011, the 38 countries in Europe (9) received 327,200 claims, an increase of 19 per cent compared to 2010 (274,700 claims). However, the figures show variations in asylum trends at the regional and country level. For example, the 27 Member States of the European Union registered 277,400 asylum claims in 2011, a 15 per cent increase compared to 2010 (240,400). Within this group, the 15 pre-2004 ( old ) EU Member States registered 37,300 more claims during 2011 (+17%), while the 12 new EU Fig. 1 Change in asylum claims in selected regions EU-27 Europe Canada/USA Australia/ New Zealand Japan/ Rep. of Korea -44% -41% -45% -44% -3% -5% -4% -9% -5% Member States, who joined the EU in or after 2004, registered 400 fewer claims, a drop of 2 per cent. The EU-27 together accounted for 85 per cent of all asylum claims in Europe. Among the European regions, the largest relative increase in annual asylum levels was reported by the eight 15% 19% 26% 67% 77% % Southern European countries (10) which received 66,800 asylum requests during 2011, an 87 per cent increase compared to This increase is mainly due to boat arrivals in Italy and Malta and the registration of more individual requests for international protection in Turkey (+74%). despite this recent increase, 8 See notes in Annex Table 1 for a list of countries included under each regional grouping. 9 When including the countries listed in Annex Table 2, the total number of asylum claims in 2011 amounts to 444,000, compared to 372,400 the previous year. 10 Refers to Albania, Cyprus, Greece, Italy, Malta, Portugal, Spain and Turkey. Asylum Levels and Trends in Industrialized Countries
8 When comparing the share of the 44 industrialized countries to the global number of registered asylum-seekers between 2007 and 2010, the relative importance of the 44 countries as a destination region has declined. In 2007, the 44 countries received roughly 65 per cent of all new asylum applications worldwide. By 2010, this percentage had fallen to about 50, with sub-saharan Africa emerging as a major destination region for people seeking international protection. (a) The global number of asylum applications registered in 2011 is not yet available. a See UNHCR s 2010 Statistical Yearbook TABLE 1 Asylum claims lodged in selected regions Regions Change Europe 287, , ,190 19% - EU-total 247, , ,370 15% - EU- old 222, , ,190 17% - EU- new 25,200 15,560 15,180-2% USA/Canada 82,270 78,690 99,370 26% Australia/New Zealand 7,760 12,980 11,820-9% Japan/Rep. of Korea 1,710 1,630 2,880 77% Total 379, , ,260 20% See notes in Annex Table 1 for list of countries included. levels remain below the latest peak in 2008 (74,400 claims). Italy was the main recipient of asylum applications in the region (34,100 claims) (11), followed by Turkey (16,000) and Greece (9,300). In the Nordic countries (12), on the other hand, the number of newly registered asylum-seekers decreased by 10 per cent to 45,700, almost the 2007 and 2008 levels. With the exception of Iceland, the decrease was uniform among all countries. Overall, Sweden remained the most important destination for asylum-seekers in the region with 29,600 asylum applications, followed by Norway (9,100) and denmark (3,800). The number of asylum-seekers in Australia and New Zealand decreased by 9 per cent during 2011 (11,800 claims) compared to the previous year (13,000). It is primarily in Australia that the decrease occurred with 11,500 claims, down 9 per cent from It is the first decrease observed in six years, and is due to fewer asylum-seekers arriving to Australia by boat. One third of asylum-seekers in Australia originate from Afghanistan or the Islamic Republic of Iran. Asylum levels in Australia remain below those recorded by many other industrialized and non-industrialized countries. In New Zealand, levels have remained fairly stable in the past six years (on average 300 new claims per year). Japan and the Republic of Korea registered a combined number of 2,900 new asylum claims in 2011, a 77 per cent increase compared to 2010 (1,600 claims). Although it is the highest level on record in both countries, numbers continue to be modest in comparison with other industrialized countries. Japan registered 1,900 (13) new asylum applications (+56%) and the Republic of Korea 1,000 claims (+135%) in People seeking international protection in Japan were predominantly from Myanmar while Pakistan was the main country of origin of asylum-seekers in the Republic of Korea. In North America, an estimated 99,400 new asylum applications were submitted in 2011, one quarter (+20,700 claims) more than in The figures show a similar trend for Canada and the United States of America. The former registered 25,300 new applications, 9 per cent more than in 2010 (23,200), while the latter recorded approximately 74,000 (14) claims, a 33 per cent increase (55,500 claims in 2010). Although 2011 is the highest level in almost a decade for this region, it is two thirds that of 2001 when close to 150,000 applications in total were lodged in Canada and the United States of America. III Levels and Patterns in Countries of Asylum With 235,400 registered asylum claims in 2011, the United States of America, France, Germany, Italy, and Sweden were the top five receiving countries, together accounting for more than half (53%) of all new asylum claims submitted in the 44 industrialized countries covered by this report. In comparison, some 186,800 claims were registered in these five countries in This figure is provisional and subject to change since the Government of Italy is still processing asylum claims received in Refers to Denmark, Finland, Iceland, Norway and Sweden. 13 Monthly asylum data for Japan is available from Figures for Japan are UNHCR estimates. 14 Estimated number of individuals based on the number of new cases (37,100) and multiplied by 1.4 to reflect the average number of individuals per case (Source: US Department of Homeland Security); and the number of new defensive asylum requests lodged with the Executive Office of Immigration Review (22,100; reported by individuals). 8 Asylum Levels and Trends in Industrialized Countries
9 For the sixth consecutive year, the United States of America remained the largest single recipient of new asylum claims, accounting for one out of six claims lodged in the 44 countries included in Annex Table 1. An estimated 74,000 individuals submitted an application, 18,500 claims more than the year before. Asylum-seekers from China (+20%), Mexico (+94%) and India (+241%) accounted primarily for this increase. Almost half of all asylum claims in the country were lodged by asylum-seekers from China (26%), Mexico (14%), or El Salvador (7%). The annual share of the United States of America in the number of asylum claims received among the group of industrialized countries 80,000 70,000 60,000 50,000 40,000 30,000 20,000 10,000 0 has fluctuated in recent years, ranging between 13 and 17 per cent. France was the second largest recipient of applications among the group of 44 countries with 51,900 new applications registered during This is not only an 8 per cent increase over 2010 (48,100 claims), but also the fourth consecutive rise. The higher level in 2011 is partly attributable to a doubling of asylum claims from Armenians: from 1,800 in 2010 to more than 3,600 claims a year later. Similarly, asylum claims from citizens of Côte d Ivoire tripled, from 500 to almost 1,700 during the same period. The Russian Federation was the top country of origin of asylumseekers in France, with 4,000 asylum claims registered in 2011, followed by Fig. 2 Asylum claims submitted in 10 major receiving countries United France Germany Italy Sweden Belgium United Canada Switzer- Turkey States Kingdom land the Democratic Republic of the Congo (3,800 claims) and Armenia (3,600 claims). On average, every eighth application in the 44 industrialized countries was received by France. Germany was the third largest recipient of applications among the 44 countries, with 45,700 new asylum requests registered during This is an 11 per cent increase compared to 2010 (41,300 claims) and the highest value since 2003 (50,600 claims). The increase in 2011 is partly attributed to a higher number of asylum-seekers from Afghanistan (+32%), the Syrian Arab Republic (+77%), and Pakistan (+202%). Afghanistan was also the top country of origin of asylumseekers in Germany with 7,800 claims registered in On average, three out of ten applications in the country were lodged by Afghans. Following significantly increased numbers of new asylum applicants in 2008 (30,300 claims), many of them arriving by sea, the number of persons requesting international protection in Italy descended to a five-year low in 2010 (10,000 claims). However, in 2011, this trend was reversed with an estimated 34,100 (15) asylum applications registered (+240%). This figure constitutes an all-time-high for Italy, making it the fourth largest recipient of asylumseekers in the industrialized world in Tunisia became the main country of origin of asylum-seekers in Italy 15 This figure is provisional and subject to change since the Government of Italy is still processing asylum claims received in The country of origin breakdown is available for 18,100 out of the 34,100 asylum applications. Asylum Levels and Trends in Industrialized Countries

10 A Chechen asylum-seeker women in the Linin Reception Centre in Linin, Poland. 10 Asylum Levels and Trends in Industrialized Countries
11 Map 1 Asylum applications lodged in 44 industrialized countries Absolute and relative increase or decrease 2011 compared to ,170 +2, , , , , ,740 +1,420-1,340 +4,410 +4, ,920 +3,840 +3, ,070* , ,800 U NHC R / b. sz a n delszk y +1,710 with 3,500 claims registered (up from 140 a year earlier). Tunisia was followed by Nigeria (2,900 claims), Ghana (1,300) and Pakistan (1,200). Sweden ranked fifth among the 44 industrialized countries with 29,600 applications received during the year. In contrast to the top four receiving countries, Sweden experienced a 7 per cent drop compared to 2010 (31,800 claims). It is mainly the fall in numbers of asylum-seekers from Serbia (and Kosovo: S/ RES/1244 (1999)) and from Somalia who accounted for this drop. In the case of Serbia, figures halved during 2011 (3,000 fewer claims), while 1,600 fewer claims from Somalis were registered (-28%). In contrast, the number of Afghans seeking international protection in Sweden increased from 2,400 in 2010 to more than 4,100 (+72%). Afghanistan thus became the main country of origin of asylum-seekers in Sweden. During the same period, asylum claims from people originating from Bosnia and Herzegovina went up from 120 to almost 1,000. Increase and decrease of asylum claims Increase over 100% Increase 50% to 100% Increase 1% to 50% Decrease 1% to 50% Decrease 50% to 100% Decrease over 100% -1, Note: This map is limited to the 44 countries which provide monthly asylum statistics to UNHCR. All figures are rounded off to the closest ten. * Provisional figure subject to change. The 26,000 asylum applications registered in Belgium in 2011 were at the highest level for more than a decade. The number increased by one fifth (+19%) compared to 2010, making Belgium the sixth largest receiving country during the reporting period. Figures in Belgium have gone up for the fourth consecutive year. It is mainly Afghan asylum-seekers who account for this -1, Asylum Levels and Trends in Industrialized Countries
12 rise, due to a more than doubling of asylum claims from 1,100 in 2010 to close to 2,800 one year later. The number of Albanian asylum-seekers quintupled from 210 claims in 2010 to more than 1,100 in Serbia (and Kosovo: S/RES/1244 (1999)) remained the leading country of origin of asylum-seekers in Belgium with roughly 3,100 claims registered. The United Kingdom was the seventh largest recipient of new asylum-seekers in 2011 with 25,400 claims. This was the second lowest level in two decades. Compared to 2010, figures increased by 12 per cent. The United Kingdom was followed by Canada (25,300 claims), Switzerland (19,400 claims), Turkey (16,000 claims), and Austria (14,400). All four countries witnessed increases during the year ranging from 9 per cent (Canada) to 74 per cent (Turkey). TABLE 2 Changes in the ranking of the top-15 receiving countries Countries United States France Germany Italy Sweden Belgium United Kingdom Canada Switzerland Turkey Austria Netherlands Australia Greece Norway Ranking of countries The numbers of people requesting international protection have fluctuated significantly between countries and years, largely depending on political developments in countries of origin or changes in asylum polices in receiving countries. However, other factors may also be of relevance, including the existence of social networks of certain communities in destination countries, improved capacity to register asylumseekers, and the fact that some countries are perceived as being more likely to grant refugee status than others. These factors are reflected in the current and past rankings of some of the countries included in this report. Italy, for instance, saw a sharp increase in new asylum applicants in 2008 (30,300 claims), many arriving by sea. In 2008, Italy was the fifth largest recipient of asylum-seekers among the group of 44 industrialized countries. In 2009, Italy and Libya concluded an agreement to turn boats back to the latter. As a consequence, the numbers of people requesting international protection in Italy dropped by almost half between 2008 and 2009 (17,600 applications). In 2010, this trend continued, with only 10,400 individuals seeking asylum in Italy and the country then ranked as the 14 th most popular destination among the group of industrialized countries. Following the Arab Spring in North Africa in early 2011, arrivals by boat in Italy resumed, resulting in triple the number of asylum applications in 2011 (34,100 claims) (16). As a result, the country moved up in its ranking to become the 4 th highest destination country. Greece introduced special procedures at the end of 2006 to clear the backlog of asylum-seekers waiting to register claims. As a consequence, the number of applicants registered rose sharply in 2007, making Greece the 6 th largest receiving country that year (25,100 claims). Since then, the number has decreased steadily to 9,300 applications in 2011, partly due to the slow pace of registration of claims. As a consequence, Greece dropped to 14 th place. In 2008 and 2009, Canada was, respectively, the second and third highest destination country for asylum-seekers among the group of industrialized countries. The relatively high number of Czech asylum applications during this period partly contributed to Canada s high ranking. In the second half of 2009, Canada introduced visa requirements for Czech citizens. As a result, the number of asylum-seekers from the Czech Republic dropped from more than 2,000 in 2009, to almost zero in both 2010 and Canada s ranking subsequently dropped to 8 th place in Provisional figure subject to change. TABLE 3 Share of main receiving countries of asylumseekers in total number of applications Countries United States 15% 13% 13% 15% 17% France 9% 9% 11% 13% 12% Germany 6% 6% 7% 11% 10% Italy 4% 8% 5% 3% 8% Sweden 11% 6% 6% 9% 7% Belgium 3% 3% 5% 6% 6% United Kingdom 8% 8% 8% 6% 6% Canada 8% 10% 9% 6% 6% Switzerland 3% 4% 4% 4% 4% Turkey 2% 3% 2% 3% 4% Austria 4% 3% 4% 3% 3% Netherlands 2% 4% 4% 4% 3% Australia 1% 1% 2% 3% 3% Greece 8% 5% 4% 3% 2% Norway 2% 4% 5% 3% 2% Trends over the past five years Between 2007 and 2011, the United States of America received the largest number of new asylum-seekers (278,800 claims), followed by France (206,900 claims), Germany (156,000 claims), Canada (147,000 claims), and Sweden (146,400 claims). Together, the three leading asylum countries received one-third of all asylum requests submitted in the 44 industrialized countries listed in Annex Table 1. The countries individual share in the total number of applications received reveals a changing pattern over time. As a result of significantly more people seeking asylum in the United States of America, the country s share as the main recipient over the five-year period from 2007 to 2011 increased from 13 per cent in to 17 per cent in A similar trend has been observed for Germany and Belgium where both countries shares have gradually increased: in the case of Germany, from 6 per cent in 2007 to 10 per cent in 2011; in the case of Belgium, from 3 to 6 per cent. The share of Italy, on the other hand, stood at 8 per cent in 2008 as a result of major arrivals of asylum-seekers by boat. Two years later, it had dropped to 3 per cent. With asylum levels in Italy picking up again in 2011, the country s share increased to 8 per cent. 12 Asylum Levels and Trends in Industrialized Countries
13 during 2007, Greece s share had increased to 8 per cent following the introduction of special procedures at the end of 2006 to clear the backlog of asylum-seekers waiting to register asylum claims. However, by the end of 2011, its share was down to 2 per cent. The trends described above are based on the absolute numbers of reported asylum claims. The analysis changes when comparing the number of asylum-seekers to the size of the national population or the Gross domestic Product (gdp) (PPP) (17). These measures may allow for a better comparison among countries as they may more accurately reflect the capacity of a country to host asylum-seekers. (18) Based on the first indicator (national population), between 2007 and 2011 the two Mediterranean islands of Malta and Cyprus received, on average, the highest number of asylum-seekers compared to their national population: 20.1 and 17.1 applicants per 1,000 inhabitants, respectively. Sweden ranked third (15.6 applicants per 1,000 inhabitants), followed by Liechtenstein (14.7 applicants per 1,000 inhabitants), Norway (11.7 applicants per 1,000 inhabitants), and Switzerland (9.8 applicants per 1,000 inhabitants) [see Figure 3]. The United States of America and France, the two main recipients of new asylum-seekers during this period, were ranked respectively 24 th and 14 th, with an average of one and three asylum-seekers per 1,000 inhabitants. Comparing the number of asylumseekers to the Gross domestic Product (PPP) of a country reveals a different picture. Here, the United States of America and France are the countries with the highest number of asylum-seekers (5.9 and 6.1 applicants per capita each) compared to the national economy, followed by Germany (4.4 applicants per capita), Turkey (4.1 applicants per capita), and the United Kingdom (4.0 applicants per capita) [see Figure 4]. (19) It is interesting to note that out of the five main destination countries of asylum-seekers in 2011 (United States of America, France, Germany, Italy, and Sweden), only Sweden features among the top ten when compared against population size. But all five feature when compared against gdp (PPP) per capita. Fig. 3 Number of asylum-seekers per 1,000 inhabitants Malta Cyprus Sweden Liechtenstein Norway Switzerland Luxembourg Belgium Austria Greece Fig. 4 Number of asylum-seekers per 1 USD GDP (PPP) per capita France United States Germany Turkey United Kingdom This may be explained by the relatively large variation in national population size among the industrialized countries. The top five destination countries have a significantly larger population size compared to Cyprus, Malta, or Liechtenstein. In the case of the gdp (PPP) per capita ratio, the countries included can be considered as all having highly developed economies and the variation in gdp figures between them is not that significant. With this important difference in mind, the gdp indicator might be more meaningful and interesting when making comparisons among these 44 countries. 17 In order to compare countries, the Purchasing Power Parity (PPP) GDP is considered (Source: International Monetary Fund, World Economic Outlook Database, April 2011). Source for national population: United Nations Population Division, World Population Prospects: The 2010 Revision, New York, For the purposes of this type of analysis, the number of asylum applications registered over a five-year period has been considered to account for some extreme fluctuations in the values. 19 Among the 44 countries included in this report, the number of asylum-seekers per 1 USD GDP (PPP) per capita appears as rather modest when compared to the burden some developing countries shoulder in receiving asylum-seekers. For instance, Ghana and Uganda, two major asylum-seeker receiving countries with 20,100 and 12,700 asylum applications respectively registered in 2011, received 8 and 10 asylum-seekers respectively per 1 USD GDP (PPP) per capita in 2011 only Sweden Canada Italy Greece 2.9 Belgium Asylum Levels and Trends in Industrialized Countries

14 An Afghan asylum-seeking family in the Radauti Reception Centre in Radauti, Romania. 14 Asylum Levels and Trends in Industrialized Countries
15 IV Origin of asylum-seekers In 2011, people from 200 different countries or territories submitted asylum claims in one of the 44 countries presented in this report. Slightly less than half of all asylum applications were submitted by individuals from Asia (45%). Africa was the second most important source continent (27% of all claims), followed by Europe (15%), and the Americas (8%). (20) The country of origin of some 19,500 asylum-seekers was unknown. All major source regions of asylum applications showed either an increase or remained stable in Because significantly fewer people from Serbia (and Kosovo: S/RES/1244 (1999)) and The former Yugoslav Republic of Macedonia requested refugee status in 2011, Europe was the only continent to show a decrease as a source region of asylum applications in 2011 (-9%). UNHCR / B. Szandelszky Out of the 40 main a s y l u m - s e e k e r nationalities, 32 registered a rise during 2011 amounting to 68,000 claims. This is significantly more than in 2010 when 17 asylum-seeker nationalities recorded an increase. The eight nationalities registering a decline in 2011 submitted a total of 14,000 claims less than in Among the major countries of origin of asylum-seekers, significant increases were registered from Tunisia (+769%), Pakistan (+66%), Mexico (+62%), and Afghanistan (+34%). Conversely, of the eight nationalities that recorded a decrease in 2011 as compared to 2010, only two registered a drop of more than 10 per cent: Serbia TABLE 4 Distribution of asylum claims by region of origin Regions Africa 29.9% 28.4% 25.7% 26.7% Americas 10.9% 8.8% 7.8% 8.0% Asia 44.8% 45.1% 45.3% 45.4% Europe 12.7% 15.4% 19.2% 14.6% Oceania 0.1% 0.1% 0.2% 0.1% Unknown * 1.5% 2.2% 1.9% 5.2% * Includes stateless asylum-seekers. (and Kosovo: S/RES/1244 (1999)) (-28%) and The former Yugoslav Republic of Macedonia (-11%). Afghanistan, China, Iraq, Serbia (and Kosovo: S/RES/1244 (1999)) and Pakistan were the five top source countries of asylum-seekers in the 44 industrialized countries in This is comparable to 2010, when Serbia, Afghanistan, China, Iraq, and the Russian Federation were the top-ranking source countries. In 2011, Afghanistan again became the main country of origin of asylumseekers in industrialized countries. 20 The geographical regions used are those of the UN Statistics Division ( Asylum Levels and Trends in Industrialized Countries
16 Fig. 5 Main nationalities of asylum-seekers 2011 Fig. 6 Asylum requests from Afghanistan, China, Iraq and Serbia ,000 50,000 40,000 30,000 20,000 10,000 0 Other 63% * Serbia (and Kosovo: S/RES/1244 (1999)) * Serbia (and Kosovo: S/RES/1244 (1999)) Afghanistan Iraq Serbia * China The last time Afghanistan was at the top of the list was in 2009 when some 27,200 Afghan citizens sought asylum. Provisional data indicate that some 35,700 Afghans requested refugee status in This was 34 per cent more than in 2010 (26,600 claims). It is believed that the continued volatile situation in the country may be one reason why Afghans increasingly seek asylum abroad. The share of asylum-seekers from Afghanistan in the total number of asylum claims has remained stable between 8% Afghanistan 6% 4% 6% China 4% 5% 4% Iraq Serbia * Pakistan Islamic Rep. of Iran Russian Fed and 2010 (7% each). However, in 2011, they constituted almost 9 per cent of all asylum applications lodged in the 44 industrialized countries [see Figure 5]. Afghan asylum-seekers sought international protection in 42 out of the 44 industrialized countries. The levels were highest in Germany (7,800 claims) and Sweden (4,100 claims). In Germany, the number of Afghan asylum claims went up by 32 per cent while in Sweden by 72 per cent. Other important destination countries were Austria (3,600 claims), Belgium (2,800), and Turkey (2,500; UNHCR procedure). In all three cases, figures more than doubled in Serbia (and Kosovo: S/RES/1244 (1999)) emerged as a new destination country for Afghan asylum-seekers: 1,700 asylum claims were lodged in 2011 compared to only 320 a year earlier (+432%). In contrast, significant decreases in the number of Afghan asylum applications were registered in Australia (-45%) due to fewer boat arrivals. With 24,400 asylum applications submitted by Chinese asylum-seekers in 2011, the figure is at its highest since 2003 (25,600 claims). The number increased by 13 per cent compared to 2010 (21,600 claims). This made China the second highest-ranking source country of asylum-seekers among the 44 industrialized countries. Similar to previous years, the United States of America registered more than half of all Chinese asylum applications (15,450). France was the second largest recipient with 2,200 Chinese asylum requests, slightly more than a year earlier (1,900 claims) [see Figure 6]. After having constituted the main group of asylum-seekers in industrialized countries in 2008 (40,400 claims), the number of Iraqis seeking asylum had halved by 2010 (20,600 claims). This trend was reversed in 2011 with 23,500 Iraqis requesting international protection, 2,900 claims more (+14%) than the year before [see Figure 6]. Iraq thus became the third highest country of origin of asylum-seekers among the group of industrialized countries. The increase was particularly significant in Turkey where UNHCR conducts refugee status determination under its mandate. Here, the figure more than doubled from 3,700 in 2010 to 7,900 in Germany registered 5,800 new Iraqi asylum claims, virtually unchanged from Sweden, on the other hand, experienced a rather dramatic decrease in Iraqi claims in the past years, with figures having fallen from as high as 18,600 in Sweden registered 1,600 Iraqi claims in Other important destination countries were Belgium (2,000 claims) and the Netherlands (1,400 claims). Serbia (and Kosovo: S/RES/1244 (1999)) was the main country of origin of asy- UNHCR / D. Telemans 16 Asylum Levels and Trends in Industrialized Countries

17 Children in a playing field at the Fedasil asylum centre in Bovigny, Belgium. Belgium has 45 reception centres for asylum-seekers. They are managed by Fedasil or the Belgian Red Cross. lum-seekers in 2010 with 29,600 asylum claims registered, 50 per cent higher than in This significant increase was widely attributed to the European Union s introduction as of 19 december 2009 of visa-free entry for holders of Serbian passports. In 2011, however, Serbia (and Kosovo: S/RES/1244 (1999)) dropped to fourth place with 21,200 registered claims during the year [see Figure 6]. This constituted a decrease of 8,400 claims (-28%) when compared to The drop was particularly significant in Sweden and France. In the former, 4,000 fewer claims were lodged in 2011 (-50%) while in the latter, there were 2,300 fewer claims submitted (-40%). In Luxembourg, however, the number of asylum claims from people originating from Serbia (and Kosovo: S/RES/1244 (1999)) more than tripled from 300 in 2010 to 1,100 a year later, stretching reception facilities for asylum-seekers to a maximum. Overall, Germany was the prime destination for asylum-seekers from Serbia (and Kosovo: S/RES/1244 (1999)) in 2011 (6,000 claims). About four-fifths of the countries reporting monthly asylum statistics to UNHCR distinguish applicants originating from Kosovo (S/RES/1244 (1999) in their data. The available evidence shows that the proportion of asylumseekers from Kosovo in these countries has decreased over the past three years. In 2009, on average, 74 per cent of applicants from Serbia came from Kosovo. This figure dropped to 45 per cent in 2010 and to a further 41 per cent in Among the main receiving countries, the proportion of people from Serbia originating from Kosovo is highest in France (84%), Austria (66%), and Belgium (48%). It is relatively low in Luxembourg (13%), Germany (23%), Sweden (31%), and Switzerland (35%). With 18,100 applications submitted by asylum-seekers from Pakistan in 2011, the figure is the highest on record. The number increased by two-thirds (+66%) compared to 2010 (11,000 claims). This made Pakistan the fifth highest source country of asylum-seekers in the industrialized world. The increase was particularly significant in the United Kingdom and Germany, the two main destination countries. In the former, close to 4,000 asylum applications were registered, up 86 per cent from 2,100 the year earlier. In the latter, figures tripled from 840 claims to more than 2,500 during the same period. Among the 19 countries registering 100 or more Asylum Levels and Trends in Industrialized Countries
18 TABLE 5 Changes in the ranking of the top-15 countries of origin Countries of origin Afghanistan China Iraq Serbia* Pakistan Islamic Rep. of Iran Russian Federation Somalia Eritrea Nigeria Mexico Sri Lanka Syrian Arab Rep Tunisia Bangladesh * Serbia (and Kosovo: SC/RES/1244 (1999)). For asylum-seekers from Côte d Ivoire, Libya, the Syrian Arab Republic, and Tunisia, levels were at a record high among the industrialized countries. asylum claims by Pakistani citizens in 2011, 16 reported an increase. With 2,300 claims registered, Greece was the only major destination country showing a drop in Pakistani asylum claims (-16%). The number of asylum-seekers originating from the Islamic Republic of Iran increased by one fifth in 2011 (+19%), the highest for more than a decade. Some 18,100 asylum-seekers were registered during the year in the 44 countries covered by this report. Turkey remained the prime destination with 3,400 asylum claims or almost one fifth of all Iranian requests being lodged. Germany and the United Kingdom also received a significant number of Iranian asylum-seekers with 3,400 and 3,000 claims respectively. In both cases, the numbers went up by about one third compared to Other significant source countries of asylum-seekers in the 44 industrialized countries in 2011 were the Russian Federation (17,000 claims), Somalia (15,500), Eritrea (10,600), Nigeria (10,500), and Mexico (8,900). For asylum-seekers from Côte d Ivoire, Libya, the Syrian Arab Republic, and Tunisia, levels were at a record high among the industrialized countries. For Tunisia, figures went up nine-fold, from 900 in 2010 to 7,900 in Italy and Switzerland together received three quarters of those claims. In the case of Côte d Ivoire, figures stood at 5,200 asylum applications during 2011 (+180%) with France being the prime destination (1,700 claims). Out of the 8,400 Syrian asylum claims in 2011 (+68%), one third were submitted in Germany alone. The almost five-fold increase in Libyan asylum-seekers (3,800 claims) was concentrated in the United Kingdom which registered one third of all claims. Over the last five years, some changes have occurred in the ranking of the main countries of origin of asylum applicants. In 2007, Afghanistan ranked as the 8 th highest source country. Over the last three years, it has moved up the list occupying either the 1 st or 2 nd position. The Russian Federation was the 2 nd largest source country in 2007 but fell to 7 th place in 2011, while the Islamic Republic of Iran moved up from 11 th in 2008 to 6 th place in Tunisia saw a significant change, moving from 66 th in 2010 to 14 th place in 2011, only one year later. 18 Asylum Levels and Trends in Industrialized Countries


19 V Annex Asylum Levels and Trends in Industrialized Countries
20 TABLE 1 Asylum applications submitted in Europe and selected non-european countries For country notes and regional classification, see next page. Country/region of asylum Total Annual change Per 1,000 inhabitants Per 1 USD/GDP per capita * Share Rank Total Rank Total Rank Albania % 0% 0% Australia 3,980 4,770 7,420 12,640 11,510 40,320-9% 3% 2% Austria 11,920 12,840 15,820 11,010 14,430 66,020 31% 3% 3% Belgium 11,120 12,250 17,190 21,760 25,980 88,300 19% 6% 5% Bosnia and Herzegovina % 0% 0% Bulgaria , ,500-14% 0% 0% Canada 28,340 36,900 33,250 23,160 25, ,000 9% 6% 8% Croatia , % 0% 0% Cyprus 6,790 3,920 3,200 3,160 1,770 18,840-44% 0% 1% Czech Rep. 1,880 1,710 1, ,930 0% 0% 0% denmark 1,850 2,360 3,820 4,970 3,810 16,810-23% 1% 1% Estonia % 0% 0% Finland 1,430 4,020 5,910 4,020 3,090 18,470-23% 1% 1% France 29,390 35,400 42,120 48,070 51, ,890 8% 12% 11% Germany 19,160 22,090 27,650 41,330 45, ,970 11% 10% 8% Greece 25,110 19,880 15,930 10,270 9,310 80,500-9% 2% 4% Hungary 3,430 3,120 4,670 2,100 1,690 15,010-20% 0% 1% Iceland % 0% 0% Ireland 3,990 3,870 2,690 1,940 1,290 13,780-34% 0% 1% Italy 14,050 30,320 17,600 10,050 34, , % 8% 6% Japan 820 1,600 1,390 1,200 1,870 6,880 56% 0% 0% Latvia % 0% 0% Liechtenstein % 0% 0% Lithuania ,340 11% 0% 0% Luxembourg ,160 4, % 0% 0% Malta 1,380 2,610 2, ,850 8, % 0% 0% Montenegro % 0% 0% Netherlands 7,100 13,400 14,910 13,330 11,590 60,330-13% 3% 3% New Zealand ,490-9% 0% 0% Norway 6,530 14,430 17,230 10,060 9,050 57,300-10% 2% 3% Poland 7,210 7,200 10,590 6,530 5,190 36,720-21% 1% 2% Portugal % 0% 0% Rep. of Korea ,010 2, % 0% 0% Romania 660 1, ,720 5, % 0% 0% Serbia (and Kosovo: S/RES/1244 (1999)) ,320 4, % 1% 0% of which Kosovo % Slovakia 2, ,360-17% 0% 0% Slovenia ,410 24% 0% 0% Spain 7,660 4,520 3,010 2,740 3,410 21,340 24% 1% 1% Sweden 36,370 24,350 24,190 31,820 29, ,380-7% 7% 8% Switzerland 10,840 16,610 14,490 13,520 19,440 74,900 44% 4% 4% The former Yugoslav Rep. of , % 0% 0% Macedonia Turkey 7,650 12,980 7,830 9,230 16,020 53,710 74% 4% 3% United Kingdom 28,300 31,320 30,670 22,640 25, ,350 12% 6% 7% United States 50,720 49,560 49,020 55,530 74, ,850 33% 17% 15% EU- Old (15) 198, , , , ,190 1,124,510 17% 59% 59% EU- New (12) 25,570 21,910 25,200 15,560 15, ,420-2% 3% 5% EU-Total (27) 223, , , , ,370 1,227,930 15% 63% 65% Nordic countries (5) 46,220 45,240 51,190 50,920 45, ,240-10% 10% 13% Western Europe (19) 215, , , , ,820 1,257,520 17% 66% 66% Southern Europe (8) 62,890 74,400 50,100 35,760 66, ,930 87% 15% 15% Former Yugoslavia (6) 1, ,300 5,270 9, % 1% 0% Total Europe (38) 249, , , , ,190 1,423,090 19% 74% 75% Canada/USA 79,060 86,460 82,270 78,690 99, ,850 26% 23% 22% Australia/ New Zealand 4,230 5,020 7,760 12,980 11,820 41,810-9% 3% 2% Japan/Rep. of Korea 1,540 1,960 1,710 1,630 2,880 9,720 77% 1% 1% Total (44) 334, , , , ,260 1,900,470 20% Asylum Levels and Trends in Industrialized Countries
21 Notes Source: Governments, UNHCR. This table includes final data for 2007 to In the following tables, the 2010 figures are based on the monthly database. This results in some discrepancies. All figures in this table have been rounded to the closest ten. * This refers to Gross Domestic Product (GDP), Purchasing Power Parity (PPP), per capita. Table 1. Notes a. Country notes Australia. Figures for are based on the number of applications for protection visas lodged, not asylum applications. Belgium. Figures include accompanying children since Data include repeat applications (2,800 in 2007; 3,330 in 2008; 4,260 in 2009). Canada. Source: Citizenship and Immigration Canada. Cyprus. In addition, UNHCR registered asylum applications in the northern part of Cyprus in 2007 (44) and 2008 (19). Denmark. Figures for exclude Iraqi interpreters who worked for the Danish Forces in Iraq. France. Includes asylum applications of minors. Japan. Figures are UNHCR estimates. Italy. The 2011 figure is provisional and subject to change since the Government of Italy is still processing asylum claims received in Montenegro. Data prior to 2008 are UNHCR figures. Poland. Data excludes a significant number of repeat applications. December 2011 data estimated by UNHCR. Serbia. Source: UNHCR ( ). Spain. Includes applications lodged at Spanish embassies. Switzerland. Figures exclude repeat applications. Turkey. Source: UNHCR. United States. Figures include (1) statistics from the US Department of Homeland Security (DHS), based on the number of cases and multiplied by 1.4 to reflect the estimated number of individuals; and (2) the number of new («defensive») requests lodged with the Department of Justice, Executive Office for Immigration Review (EOIR), based on the number of individuals. b. Regional classification EU- old (15). Austria, Belgium, Denmark, Finland, France, Germany, Greece, Ireland, Italy, Luxembourg, Netherlands, Portugal, Spain, Sweden and United Kingdom. EU- new (12). Bulgaria, Cyprus, Czech Republic, Estonia, Hungary, Latvia, Lithuania, Malta, Poland, Romania, Slovakia and Slovenia. EU-Total (27). EU- old and EU- new. Nordic countries (5). Denmark, Finland, Iceland, Norway and Sweden. Western Europe (19). EU- old plus Iceland, Norway, Liechtenstein and Switzerland. Southern Europe (8). Albania, Cyprus, Greece, Italy, Malta, Portugal, Spain and Turkey. Former Yugoslavia (6). Bosnia and Herzegovina, Croatia, Montenegro, Serbia (and Kosovo: S/RES/1244 (1999)), Slovenia, and The former Yugoslav Republic of Macedonia. Total Europe (38). All European countries listed. Source for national population: United Nations, Population Division, World Population Prospects: The 2010 Revision, New York, Source for Gross Domestic Product (PPP): International Monetary Fund, World Economic Outlook Database, April TABLE 2 Asylum applications submitted in selected countries in Eastern Europe All figures are based on annual data Country of asylum Total Annual change Per 1,000 inhabitants Per 1 USD/GDP per capita Share Rank Total Rank Total Rank Armenia % 3% 3% Azerbaijan ,660-19% 8% 6% Belarus % 3% 2% Georgia % 3% 1% Rep. of Moldova % 3% 2% Russian Federation 3,370 5,420 2,710 2,180 1,270 14,950-42% 47% 56% Ukraine 2,270 2,240 1,360 1, ,260-41% 33% 31% Total 6,630 8,440 4,680 4,350 2,690 26,790-38% Notes Source: Governments, UNHCR All figures in this table have been rounded to the closest ten. Azerbaijan. Source: Government and UNHCR. Russian Federation. In addition, 2,990 persons applied for temporary asylum in 2009, 1,710 in 2010 and 1,030 in Source for national population: United Nations, Population Division, World Population Prospects: The 2010 Revision, New York, Source for Gross Domestic Product (PPP): International Monetary Fund, World Economic Outlook Database, April Asylum Levels and Trends in Industrialized Countries
22 TABLE 3 Origin of asylum applications lodged in 44 industrialized countries 2010 and 2011 Covering all 44 countries which provided monthly data to UNHCR. Ranking based on 2011 data. Annual Share Rank Origin Total change Total Afghanistan 26,619 35,729 62,348 34% China 21,597 24,446 46,043 13% Iraq 20,572 23,469 44,041 14% Serbia (and Kosovo: S/RES/1244(1999)) 29,605 21,246 50,851-28% Pakistan 10,959 18,141 29,100 66% Islamic Rep. of Iran 15,185 18,128 33,313 19% Russian Federation 18,542 16,977 35,519-8% Somalia 17,005 15,482 32,487-9% Eritrea 8,521 10,616 19,137 25% Nigeria 9,668 10,498 20,166 9% Mexico 5,497 8,906 14,403 62% Sri Lanka 9,073 8,521 17,594-6% Syrian Arab Rep. 4,996 8,383 13,379 68% Tunisia 910 7,907 8, % Bangladesh 6,195 7,644 13,839 23% India 4,899 6,772 11,671 38% Georgia 7,381 6,700 14,081-9% Turkey 6,509 6,688 13,197 3% dem. Rep. of the Congo 5,834 6,574 12,408 13% Armenia 5,288 6,220 11,508 18% Guinea 5,352 6,113 11,465 14% The former Yugoslav Rep. of Macedonia 6,289 5,607 11,896-11% Côte d Ivoire 1,852 5,192 7, % Algeria 3,917 4,982 8,899 27% El Salvador 3,366 4,610 7,976 37% Hungary 2,424 4,488 6,912 85% Haiti 4,176 3,915 8,091-6% Egypt 2,135 3,841 5,976 80% Libya 823 3,825 4, % Guatemala 2,562 3,656 6,218 43% Stateless 3,731 3,344 7,075-10% Albania 2,227 3,330 5,557 50% Sudan 2,694 3,236 5,930 20% Ethiopia 3,092 3,180 6,272 3% Nepal 2,118 2,913 5,031 38% Ghana 1,757 2,817 4,574 60% Bosnia and Herzegovina 2,326 2,732 5,058 17% Morocco 1,369 2,696 4,065 97% Mali 1,255 2,363 3,618 88% Azerbaijan 1,996 2,363 4,359 18% Other * 65,189 82, ,323 26% Total 355, , ,889 20% * The country of origin of 16,000 asylum-seekers in Italy in 2011 is unknown. 22 Asylum Levels and Trends in Industrialized Countries
23 TABLE 4 Origin of asylum applications lodged in Europe 2010 and 2011 Covering 38 European countries which provided monthly data to UNHCR. Ranking based on 2011 data. Annual Share Rank Origin Total change Total Afghanistan 22,922 33,317 56,239 45% Iraq 19,142 22,315 41,457 17% Serbia (and Kosovo: S/RES/1244(1999)) 29,266 20,910 50,176-29% Russian Federation 17,257 15,667 32,924-9% Pakistan 9,227 15,212 24,439 65% Islamic Rep. of Iran 12,923 14,985 27,908 16% Somalia 16,070 14,778 30,848-8% Eritrea 7,865 9,739 17,604 24% Nigeria 8,517 9,406 17,923 10% Syrian Arab Rep. 4,782 7,845 12,627 64% Tunisia 865 7,786 8, % Sri Lanka 6,669 6,917 13,586 4% Bangladesh 5,716 6,905 12,621 21% Georgia 7,263 6,592 13,855-9% dem. Rep. of the Congo 5,406 6,065 11,471 12% Armenia 5,059 6,037 11,096 19% Turkey 5,888 5,941 11,829 1% China 5,928 5,907 11,835 0% Guinea 4,876 5,712 10,588 17% The former Yugoslav Rep. of Macedonia 6,251 5,562 11,813-11% Algeria 3,777 4,784 8,561 27% Côte d Ivoire 1,545 4,571 6, % Libya 761 3,277 4, % Sudan 2,474 2,941 5,415 19% Albania 1,861 2,915 4,776 57% India 3,085 2,732 5,817-11% Stateless 2,606 2,707 5,313 4% Morocco 1,296 2,604 3, % Ghana 1,585 2,587 4,172 63% Bosnia and Herzegovina 2,182 2,515 4,697 15% Azerbaijan 1,928 2,274 4,202 18% Egypt 1,147 2,118 3,265 85% Haiti 2,041 2,048 4,089 0% Mali 957 2,037 2, % Ethiopia 1,656 1,811 3,467 9% Senegal 1,260 1,671 2,931 33% Cameroon 1,463 1,609 3,072 10% Viet Nam 2,163 1,560 3,723-28% Mongolia 1,670 1,559 3,229-7% Belarus 941 1,441 2,382 53% Other * 35,609 49,807 85,416 40% Total 273, , ,065 19% * The country of origin of 16,000 asylum-seekers in Italy in 2011 is unknown. Asylum Levels and Trends in Industrialized Countries
24 TABLE 5 Origin of asylum applications lodged in the European Union (27) 2010 and 2011 Covering 27 European Union countries which provided monthly data to UNHCR. Ranking based on 2011 data. Annual Share Rank Origin Total change Total Afghanistan 19,442 26,159 45,601 35% Serbia (and Kosovo: S/RES/1244 (1999)) 27,429 19,072 46,501-30% Russian Federation 16,266 15,045 31,311-8% Pakistan 8,936 14,386 23,322 61% Iraq 14,448 13,623 28,071-6% Islamic Rep. of Iran 9,291 10,789 20,080 16% Somalia 13,844 10,656 24,500-23% Nigeria 6,536 7,824 14,360 20% Bangladesh 5,659 6,787 12,446 20% Syrian Arab Rep. 4,228 6,725 10,953 59% Sri Lanka 5,699 6,431 12,130 13% Georgia 6,641 6,252 12,893-6% Armenia 4,965 5,929 10,894 19% dem. Rep. of the Congo 5,080 5,800 10,880 14% Turkey 5,345 5,376 10,721 1% Guinea 4,555 5,340 9,895 17% Tunisia 519 5,248 5, % Eritrea 4,406 5,208 9,614 18% China 5,392 5,084 10,476-6% The former Yugoslav Rep. of Macedonia 5,711 4,699 10,410-18% Côte d Ivoire 1,419 4,262 5, % Algeria 3,296 4,062 7,358 23% Albania 1,820 2,822 4,642 55% Libya 690 2,710 3, % India 3,012 2,612 5,624-13% Sudan 2,177 2,558 4,735 18% Stateless 2,129 2,418 4,547 14% Ghana 1,408 2,381 3,789 69% Bosnia and Herzegovina 1,998 2,275 4,273 14% Azerbaijan 1,850 2,190 4,040 18% Haiti 2,032 2,043 4,075 1% Egypt 1,079 1,994 3,073 85% Mali 905 1,980 2, % Morocco 1,061 1,859 2,920 75% Viet Nam 2,135 1,527 3,662-28% Senegal 1,141 1,501 2,642 32% Cameroon 1,359 1,468 2,827 8% Mongolia 1,559 1,456 3,015-7% Comoros 756 1,390 2,146 84% Mauritania 1,196 1,378 2,574 15% Other * 32,194 46,024 78,218 43% Total 239, , ,951 16% * The country of origin of 16,000 asylum-seekers in Italy in 2011 is unknown. 24 Asylum Levels and Trends in Industrialized Countries
25 TABLE 6 Applications submitted by country of asylum and origin 2010 Covering all 44 asylum countries which provided monthly data to UNHCR. See notes in Annex Table 1. Top-20 ranking of countries based on applications lodged in all countries. An asterisk (*) denotes between 1 and 4 applications. Origin Albania Australia Austria Belgium Bosnia and H. Bulgaria Canada Croatia Cyprus Czech Rep. Denmark Estonia Finland France Germany Serbia (and Kosovo: S/RES/1244(1999)) * , * * ,754 6,546 Afghanistan - 3,129 1,582 1, , ,905 China - 1, * 1, , Iraq * ,637 * ,555 Russian Federation - 5 2,322 1, ,302 1,199 Somalia * * * ,235 Islamic Rep. of Iran * 1, * ,475 Pakistan * * Nigeria * * Sri Lanka , * 21 2, Eritrea * * 76 - * Georgia - * * , Turkey * * 117 1,402 1,340 The former Yugoslav Rep. of * * * 14 * ,466 Macedonia Bangladesh , dem. Rep. of the Congo - * * , Mexico , * Guinea - * 35 1,455 - * , Armenia - * 278 1, * 11 1, Syrian Arab Rep * * ,490 Origin Greece Hungary Iceland Ireland Italy Japan Latvia Liechtenstein Lithuania Luxembourg Malta Montenegro Netherlands New Zealand Norway Serbia (and Kosovo: S/RES/1244(1999)) * Afghanistan * ,364 * 979 China * Iraq * - * * , Russian Federation * * 207 * 628 Somalia * ,372 * 1,397 Islamic Rep. of Iran * * * 31 * Pakistan 2, * * Nigeria * 387 1, * * 354 Sri Lanka * Eritrea 59 - * * 1,711 Georgia 1, * * * 85 Turkey * * * 92 * 74 The former Yugoslav Rep. of * 8 * * Macedonia Bangladesh * * dem. Rep. of the Congo 15 * * * - 40 * 86 Mexico - * - - * * * * 13 Guinea * 167 * * - - * Armenia * * Syrian Arab Rep * * * * 119 / Asylum Levels and Trends in Industrialized Countries
26 TABLE 6 Applications submitted by country of asylum and origin 2010 (ctnd) Covering all 44 asylum countries which provided monthly data to UNHCR. See notes in Annex Table 1. Top-20 ranking of countries based on applications lodged in all countries. An asterisk (*) denotes between 1 and 4 applications. Origin Poland Portugal Rep. of Korea Romania Serbia (1) Slovakia Slovenia Spain Sweden Switzerland TfYR Macedonia (2) Turkey United Kingdom Serbia (and Kosovo: S/RES/1244(1999)) * ,907 1,358 * Afghanistan 25 * , ,248 1, China 9 * * ,215 12,850 Iraq 27 - * , * 3, Russian Federation 4, * * Somalia 5 * * , Islamic Rep. of Iran , * 2,881 2, Pakistan 27 * , Nigeria * , , Sri Lanka 6 * * , Eritrea * - - * - - * 8 1,444 1, Georgia 1,083 * - 9 * 66 * Turkey 19 * - 68 * The former Yugoslav Rep. of * * * Macedonia Bangladesh * dem. Rep. of the Congo * * * Mexico * ,225 Guinea 6 43 * * * * Armenia Syrian Arab Rep * 5 * * Serbia (and Kosovo: S/RES/1244 (1999)) 2 The former Yugoslav Republic of Macedonia 3 Combination of number of persons (EOIR) and cases (DHS). United States (3) TABLE 7 Applications submitted by country of asylum and origin 2011 Covering all 44 asylum countries which provided monthly data to UNHCR. See notes in Annex Table 1. Top-20 ranking of countries based on applications lodged in all countries. An asterisk (*) denotes between 1 and 4 applications. Origin Albania Australia Austria Belgium Bosnia and H. Bulgaria Canada Croatia Cyprus Czech Rep. Denmark Estonia Finland France Germany Afghanistan - 1,721 3,623 2,773 * ,767 China * 1, , * , Iraq * , * ,831 Serbia (and Kosovo: S/RES/1244 (1999)) 8 * 541 3,067 8 * * ,458 5,974 Pakistan * * ,432 2,539 Islamic Rep. of Iran - 2, * ,352 Russian Federation - 7 2,319 1,747 - * * 294 4,042 1,689 Somalia * * * Eritrea * Nigeria * * Mexico - * * * * - - * - - Sri Lanka * , Syrian Arab Rep ,634 Tunisia * * * Bangladesh * * * 20 3, India * 751 * 134 * 32 * Georgia * , Turkey * * 74 1,737 1,578 dem. Rep. of the Congo , * , Armenia - * , Asylum Levels and Trends in Industrialized Countries /
27 TABLE 7 Applications submitted by country of asylum and origin 2011 (ctnd) Covering all 44 asylum countries which provided monthly data to UNHCR. See notes in Annex Table 1. Top-20 ranking of countries based on applications lodged in all countries. An asterisk (*) denotes between 1 and 4 applications. Origin Greece Hungary Iceland Ireland Italy (1) Japan (2) Latvia Liechtenstein Lithuania Luxembourg Malta Montenegro Netherlands Afghanistan * * * * , China * * * * Iraq * * * * 1, Serbia (and Kosovo: S/RES/1244 (1999)) * , Pakistan 2, * 175 1, * - - * 45 * Islamic Rep. of Iran * * - 35 * Russian Federation * 365 Somalia * * * 1,415 * 2,216 Eritrea 37 * * ,256 Nigeria , * * * 129 * 240 Mexico * - - * * * * - - * - 8 Sri Lanka 45 * - * * - - * Syrian Arab Rep * * 16 - * * 168 * 198 Tunisia , * 76 Bangladesh 615 * * * - - * India * * 56 Georgia 1, * * * Turkey * 22 - * 96 * 42 dem. Rep. of the Congo * * 39 - * * 47 Armenia * * 28 * New Zealand Norway Origin Poland Portugal Rep. of Korea Romania Serbia (3) Slovakia Slovenia Spain Sweden Switzerland TfYR Macedonia (4) Turkey United Kingdom United States (5) Afghanistan 29 * , ,120 1, ,486 1, China * ,450 Iraq 20 5 * , , Serbia (and Kosovo: S/RES/1244 (1999)) ,915 1, Pakistan , Islamic Rep. of Iran 8 11 * , ,411 3, Russian Federation 2,784 8 * 8 * 35 * * Somalia , Eritrea ,649 3,224 * Nigeria * * , , Mexico * ,186 Sri Lanka * * * * 5 2, Syrian Arab Rep * * Tunisia * - * * ,324 * Bangladesh 5 * India * * ,457 Georgia 1, * * Turkey 11 * - 28 * dem. Rep. of the Congo * * * Armenia This table excludes some 16,000 asylum applications lodged in Italy due to lack of breakdown by country of origin. 2 UNHCR estimates. 3 Serbia (and Kosovo: S/RES/1244 (1999)). 4 The former Yugoslav Republic of Macedonia. 5 Combination of number of persons (EOIR) and cases (DHS). Asylum Levels and Trends in Industrialized Countries
28 TABLE 8 Quarterly asylum applications lodged in 44 industrialized countries Covering 44 countries which provided monthly data to UNHCR. Asylum Quarterly change 2011 country Q1 Q2 Q3 Q4 Q1 Q2 Q3 Q4 Q2-Q1 Q3-Q2 Q4-Q3 Albania % 200% -67% Australia 2,375 3,762 3,274 3,262 2,623 2,332 2,769 3,789-11% 19% 37% Austria 2,464 2,565 3,109 2,874 2,757 3,055 4,547 4,067 11% 49% -11% Belgium 5,655 3,807 5,491 6,803 6,260 5,719 6,816 7,189-9% 19% 5% Bosnia and Herzegovina % 157% -50% Bulgaria % 17% -11% Canada 6,086 5,048 6,029 5,994 5,949 5,567 6,368 7,463-6% 14% 17% Croatia % -15% 83% Cyprus , % 2% -5% Czech Rep % 39% -8% denmark 1,194 1,058 1,340 1, ,154-14% 6% 32% Estonia % 32% -68% Finland 1,191 1, % 27% 3% France 12,261 11,368 11,154 13,008 13,386 13,499 12,065 12,963 1% -11% 7% Germany 7,885 7,768 12,250 13,429 10,896 9,787 11,811 13,247-10% 21% 12% Greece 2,194 2,507 3,186 2,386 2,529 1,953 2,428 2,401-23% 24% -1% Hungary % -17% 60% Iceland % -9% -5% Ireland % 6% -11% Italy * 2,721 2,647 2,139 2,545 3,987 6,873 4,184 3,065 72% -39% -27% Japan ** % 3% 7% Latvia % 104% -59% Liechtenstein % 22% -68% Lithuania % 216% 18% Luxembourg % 75% -17% Malta , % -96% 188% Montenegro % -10% 11% Netherlands 3,803 2,598 3,137 3,795 2,862 2,848 3,083 2,797-0% 8% -9% New Zealand % -16% -16% Norway 2,516 2,014 2,909 2,625 2,143 2,359 2,436 2,115 10% 3% -13% Poland *** 1,403 1,521 1,826 1, ,036 1,487 1,951 45% 44% 31% Portugal % 74% -5% Rep. of Korea % 2% 68% Romania % 96% 2% Serbia (and Kosovo: S/RES/1244 (1999)) , % 18% -44% - of which Kosovo % -69% 77% Slovakia % 23% 2% Slovenia % -21% 5% Spain , % -18% -22% Sweden 8,117 5,933 8,517 9,252 6,214 6,381 7,425 9,628 3% 16% 30% Switzerland 3,283 3,101 3,359 3,778 3,722 4,758 4,727 6,232 28% -1% 32% The former Yugoslav Rep. of Macedonia % -2% -24% Turkey 1,701 1,634 2,593 3,298 2,653 2,528 4,013 6,827-5% 59% 70% United Kingdom 5,405 5,460 5,465 5,755 6,075 6,100 6,450 6,790 0% 6% 5% United States 12,427 14,670 14,336 14,099 17,301 19,364 18,912 18,443 12% -2% -2% EU- Old (15) 54,208 48,009 58,269 63,533 58,502 59,461 62,453 65,758 2% 5% 5% EU- New (12) 3,662 3,659 4,074 4,194 2,505 4,399 3,804 4,457 76% -14% 17% EU-Total (27) 57,870 51,668 62,343 67,727 61,007 63,860 66,257 70,215 5% 4% 6% Nordic countries (5) 13,025 10,062 13,750 14,080 10,037 10,250 11,599 13,784 2% 13% 19% Western Europe (19) 60,073 53,151 64,568 69,976 64,403 66,619 69,659 74,132 4% 5% 7% Southern Europe (8) 6,227 6,416 6,805 6,785 8,011 11,913 8,035 6,785 49% -33% -16% Total Europe (38) 65,623 58,664 71,612 78,000 70,433 75,016 79,095 86,618 7% 5% 10% Canada/USA 18,513 19,718 20,365 20,093 23,250 24,931 25,280 25,906 7% 1% 2% Australia/New Zealand 2,453 3,858 3,348 3,339 2,698 2,422 2,845 3,853-10% 17% 35% Japan/Rep. of Korea % 3% 27% Total non-europe (6) 21,253 23,878 24,215 23,975 26,510 28,047 28,840 30,666 6% 3% 6% Total (44) 86,876 82,542 95, ,975 96, , , ,284 6% 5% 9% * Italy: This table excludes some 16,000 asylum applications lodged in Italy in 2011 due to lack of detailed data. ** Japan: UNHCR estimate. *** Poland: December 2011 data estimated by UNHCR. 28 Asylum Levels and Trends in Industrialized Countries
29 TABLE 9 Origin of asylum applicants in 44 industrialized countries by quarter 2010 Covering 44 countries which provided monthly data to UNHCR. Origin No. of applications Change (%) Share (%) Q1 Q2 Q3 Q4 Total Q2-Q1 Q3-Q2 Q4-Q3 Q1 Q2 Q3 Q4 Serbia (and Kosovo: S/RES/1244 (1999)) 6,202 4,785 7,642 10,976 29,605-23% 60% 44% Afghanistan 6,533 6,315 7,109 6,662 26,619-3% 13% -6% China 4,819 5,377 5,637 5,764 21,597 12% 5% 2% Iraq 4,883 4,212 5,467 6,010 20,572-14% 30% 10% Russian Federation 4,507 4,288 4,943 4,804 18,542-5% 15% -3% Somalia 4,168 3,828 5,129 3,880 17,005-8% 34% -24% Islamic Rep. of Iran 3,099 2,982 4,283 4,821 15,185-4% 44% 13% Pakistan 2,103 2,429 3,102 3,325 10,959 16% 28% 7% Nigeria 2,511 2,332 2,292 2,533 9,668-7% -2% 11% Sri Lanka 2,134 2,059 2,468 2,412 9,073-4% 20% -2% Eritrea 1,773 1,834 2,534 2,380 8,521 3% 38% -6% Georgia 2,061 1,858 1,814 1,648 7,381-10% -2% -9% Turkey 1,504 1,476 1,714 1,815 6,509-2% 16% 6% The former Yugoslav Rep. of Macedonia 1, ,781 2,710 6,289-58% 232% 52% Bangladesh 1,233 1,576 1,569 1,817 6,195 28% -0% 16% dem. Rep. of the Congo 1,389 1,411 1,536 1,498 5,834 2% 9% -2% Mexico 1,228 1,414 1,397 1,458 5,497 15% -1% 4% Guinea 1,484 1,174 1,257 1,437 5,352-21% 7% 14% Armenia 1, ,335 1,605 5,288-32% 41% 20% Syrian Arab Rep. 1,257 1,066 1,310 1,363 4,996-15% 23% 4% India 1,054 1,123 1,319 1,403 4,899 7% 17% 6% Haiti 1,206 1, ,176-0% -26% 0% Algeria ,119 3,917-11% 7% 20% Stateless ,006 1,162 3,731 14% 21% 16% El Salvador ,366 10% -3% -1% Ethiopia ,092-3% 12% -6% Sudan ,694-5% 21% -2% Zimbabwe ,609-4% -33% -12% Guatemala ,562 5% 11% -4% Colombia ,481-13% -6% -1% Hungary ,424-41% -24% 87% Viet Nam ,378 12% -1% -8% Bosnia and Herzegovina ,326-19% -27% 71% Albania ,227 3% -10% -7% Egypt ,135 6% 2% 17% Nepal ,118 13% 18% 8% Cameroon ,052-9% 19% -13% Azerbaijan ,996-36% 10% 18% Mongolia ,934-3% -6% 15% Côte d Ivoire ,852 5% 1% -9% Other 14,798 14,171 15,093 15,787 59,849-4% 7% 5% Total 84,324 79,456 92,749 98, ,505-6% 17% 7% Asylum Levels and Trends in Industrialized Countries
30 TABLE 10 Origin of asylum applicants in 44 industrialized countries by quarter 2011 Covering 44 countries which provided monthly data to UNHCR. Origin No. of applications Change (%) Share (%) Q1 Q2 Q3 Q4 Total Q2-Q1 Q3-Q2 Q4-Q3 Q1 Q2 Q3 Q4 Afghanistan 6,995 8,415 10,514 9,805 35,729 20% 25% -7% China 5,685 6,031 6,491 6,239 24,446 6% 8% -4% Iraq 5,421 4,639 5,865 7,544 23,469-14% 26% 29% Serbia (and Kosovo: S/RES/1244 (1999)) 6,383 4,015 3,347 7,501 21,246-37% -17% 124% Pakistan 3,459 3,915 5,238 5,529 18,141 13% 34% 6% Islamic Rep. of Iran 4,015 3,571 4,630 5,912 18,128-11% 30% 28% Russian Federation 3,822 3,688 4,820 4,647 16,977-4% 31% -4% Somalia 2,917 3,940 4,155 4,470 15,482 35% 5% 8% Eritrea 2,369 3,360 2,563 2,324 10,616 42% -24% -9% Nigeria 2,128 3,299 2,546 2,525 10,498 55% -23% -1% Mexico 1,935 2,237 2,297 2,437 8,906 16% 3% 6% Sri Lanka 2,302 2,042 1,957 2,220 8,521-11% -4% 13% Syrian Arab Rep. 1,403 1,629 2,600 2,751 8,383 16% 60% 6% Tunisia 2,768 1,869 1,736 1,534 7,907-32% -7% -12% Bangladesh 1,689 2,303 1,823 1,829 7,644 36% -21% 0% India 1,613 1,666 1,840 1,653 6,772 3% 10% -10% Georgia 1,353 1,455 1,971 1,921 6,700 8% 35% -3% Turkey 1,840 1,553 1,432 1,863 6,688-16% -8% 30% dem. Rep. of the Congo 1,596 1,571 1,636 1,771 6,574-2% 4% 8% Armenia 1,331 1,641 1,633 1,615 6,220 23% -0% -1% Guinea 1,624 1,416 1,531 1,542 6,113-13% 8% 1% The former Yugoslav Rep. of Macedonia 1,532 2, ,178 5,607 35% -60% 43% Côte d Ivoire 1,326 2,028 1, ,192 53% -49% -22% Algeria 1,038 1,127 1,376 1,441 4,982 9% 22% 5% El Salvador 1,181 1,183 1,141 1,105 4,610 0% -4% -3% Hungary ,015 1,858 4,488 27% 12% 83% Haiti 1,156 1, ,915-5% -25% 2% Egypt ,005 1,244 3,841 3% 25% 24% Libya 477 1,485 1, , % -13% -56% Guatemala ,037 3,656 5% 9% 10% Stateless ,344-14% 13% -10% Albania ,474 3,330 18% 33% 90% Sudan ,236 21% 4% -8% Ethiopia ,180 10% 8% -15% Nepal ,913 0% 27% -4% Ghana 405 1, , % -41% -32% Bosnia and Herzegovina ,184 2,732 10% 84% 56% Morocco ,696 8% 46% 11% Mali , % -22% -44% Azerbaijan ,363-20% 27% 11% Other * 16,317 16,194 16,115 17,500 66,126-1% -0% 9% Total 93,674 99, , , ,376 6% 5% 9% * This table excludes some 16,000 asylum applications lodged in Italy due to lack of breakdown by country of origin. 30 Asylum Levels and Trends in Industrialized Countries
31 TABLE 11 Origin of asylum applicants in Europe by quarter 2010 Covering 38 European countries which provided monthly data to UNHCR. Origin No. of applications Change (%) Share (%) Q1 Q2 Q3 Q4 Total Q2-Q1 Q3-Q2 Q4-Q3 Q1 Q2 Q3 Q4 Serbia (and Kosovo: S/RES/1244 (1999)) 6,121 4,678 7,561 10,906 29,266-24% 62% 44% Afghanistan 5,858 4,772 6,136 6,156 22,922-19% 29% 0% Iraq 4,580 3,917 5,084 5,561 19,142-14% 30% 9% Russian Federation 4,216 3,848 4,674 4,519 17,257-9% 21% -3% Somalia 3,986 3,572 4,842 3,670 16,070-10% 36% -24% Islamic Rep. of Iran 2,761 2,524 3,661 3,977 12,923-9% 45% 9% Pakistan 1,720 2,085 2,664 2,758 9,227 21% 28% 4% Nigeria 2,244 2,071 1,977 2,225 8,517-8% -5% 13% Eritrea 1,615 1,694 2,388 2,168 7,865 5% 41% -9% Georgia 2,026 1,826 1,787 1,624 7,263-10% -2% -9% Sri Lanka 1,720 1,469 1,531 1,949 6,669-15% 4% 27% The former Yugoslav Rep. of Macedonia 1, ,768 2,702 6,251-58% 235% 53% China 1,287 1,374 1,599 1,668 5,928 7% 16% 4% Turkey 1,359 1,342 1,548 1,639 5,888-1% 15% 6% Bangladesh 1,130 1,434 1,454 1,698 5,716 27% 1% 17% dem. Rep. of the Congo 1,318 1,325 1,383 1,380 5,406 1% 4% -0% Armenia 1, ,288 1,563 5,059-35% 49% 21% Guinea 1,334 1,035 1,162 1,345 4,876-22% 12% 16% Syrian Arab Rep. 1,211 1,002 1,259 1,310 4,782-17% 26% 4% Algeria ,069 3,777-11% 6% 18% India ,085 13% 10% 15% Stateless ,606-19% 25% 10% Sudan ,474-7% 25% -4% Bosnia and Herzegovina ,182-20% -29% 70% Viet Nam ,163 14% -2% -14% Zimbabwe ,124-6% -32% -10% Haiti ,041 51% -31% -13% Azerbaijan ,928-38% 12% 19% Albania ,861 5% -12% -5% Mongolia ,670-7% 0% 14% Ethiopia ,656-7% 16% -3% Ghana ,585 17% -23% 3% Occupied Palestinian Territory ,554 4% -2% 2% Côte d Ivoire ,545 2% 2% -7% Rwanda ,515-29% 15% 15% Cameroon ,463-13% 24% -16% Gambia ,336-9% 5% 18% Kyrgyzstan ,314 85% 176% 40% Morocco ,296-2% 15% 30% Angola ,282-24% 5% 7% Other 8,399 7,622 7,946 8,448 32,415-9% 4% 6% Total 65,621 58,663 71,613 78, ,899-11% 22% 9% Asylum Levels and Trends in Industrialized Countries
32 TABLE 12 Origin of asylum applicants in Europe by quarter 2011 Covering 38 European countries which provided monthly data to UNHCR. Origin No. of applications Change (%) Share (%) Q1 Q2 Q3 Q4 Total Q2-Q1 Q3-Q2 Q4-Q3 Q1 Q2 Q3 Q4 Afghanistan 6,640 7,935 9,997 8,745 33,317 20% 26% -13% Iraq 5,075 4,397 5,595 7,248 22,315-13% 27% 30% Serbia (and Kosovo: S/RES/1244 (1999)) 6,314 3,926 3,271 7,399 20,910-38% -17% 126% Russian Federation 3,536 3,268 4,499 4,364 15,667-8% 38% -3% Pakistan 2,845 3,256 4,483 4,628 15,212 14% 38% 3% Islamic Rep. of Iran 3,255 2,981 3,837 4,912 14,985-8% 29% 28% Somalia 2,742 3,786 3,951 4,299 14,778 38% 4% 9% Eritrea 2,069 3,107 2,363 2,200 9,739 50% -24% -7% Nigeria 1,868 3,051 2,277 2,210 9,406 63% -25% -3% Syrian Arab Rep. 1,343 1,526 2,443 2,533 7,845 14% 60% 4% Tunisia 2,730 1,852 1,702 1,502 7,786-32% -8% -12% Sri Lanka 1,926 1,648 1,591 1,752 6,917-14% -3% 10% Bangladesh 1,515 2,144 1,595 1,651 6,905 42% -26% 4% Georgia 1,321 1,427 1,946 1,898 6,592 8% 36% -2% dem. Rep. of the Congo 1,455 1,453 1,494 1,663 6,065-0% 3% 11% Armenia 1,277 1,603 1,585 1,572 6,037 26% -1% -1% Turkey 1,647 1,393 1,265 1,636 5,941-15% -9% 29% China 1,462 1,407 1,561 1,477 5,907-4% 11% -5% Guinea 1,516 1,321 1,437 1,438 5,712-13% 9% 0% The former Yugoslav Rep. of Macedonia 1,517 2, ,161 5,562 36% -61% 42% Algeria 992 1,084 1,337 1,371 4,784 9% 23% 3% Côte d Ivoire 1,191 1, ,571 50% -50% -21% Libya 417 1,253 1, , % -13% -52% Sudan ,941 23% 4% -10% Albania ,363 2,915 22% 37% 104% India ,732 6% 8% -13% Stateless ,707 6% -0% -19% Morocco ,604 7% 49% 13% Ghana 348 1, , % -44% -34% Bosnia and Herzegovina ,159 2,515 9% 109% 64% Azerbaijan ,274-21% 28% 14% Egypt ,118 9% 35% 28% Haiti ,048 4% -24% -6% Mali , % -20% -49% Ethiopia ,811 42% 1% -25% Senegal ,671-16% 3% 40% Cameroon ,609-6% 0% 37% Viet Nam ,560-9% 8% -23% Mongolia ,559 6% 11% 20% Belarus ,441-20% 101% 13% Other * 8,303 8,163 8,230 9,103 33,799-2% 1% 11% Total 70,432 75,017 79,093 86, ,158 7% 5% 10% * This table excludes some 16,000 asylum applications lodged in Italy due to lack of breakdown by country of origin. 32 Asylum Levels and Trends in Industrialized Countries
33 TABLE 13 Origin of asylum applicants in the European Union (27) by quarter 2010 Covering 27 European Union countries which provided monthly data to UNHCR. Origin No. of applications Change (%) Share (%) Q1 Q2 Q3 Q4 Total Q2-Q1 Q3-Q2 Q4-Q3 Q1 Q2 Q3 Q4 Serbia (and Kosovo: S/RES/1244 (1999)) 5,697 4,189 7,200 10,343 27,429-26% 72% 44% Afghanistan 5,106 4,034 5,089 5,213 19,442-21% 26% 2% Russian Federation 3,941 3,629 4,418 4,278 16,266-8% 22% -3% Iraq 3,689 3,164 3,851 3,744 14,448-14% 22% -3% Somalia 3,495 3,141 4,222 2,986 13,844-10% 34% -29% Islamic Rep. of Iran 2,030 1,827 2,641 2,793 9,291-10% 45% 6% Pakistan 1,677 2,023 2,576 2,660 8,936 21% 27% 3% Georgia 1,857 1,655 1,616 1,513 6,641-11% -2% -6% Nigeria 1,756 1,617 1,500 1,663 6,536-8% -7% 11% The former Yugoslav Rep. of Macedonia ,727 2,609 5,711-49% 271% 51% Sri Lanka 1,457 1,241 1,298 1,703 5,699-15% 5% 31% Bangladesh 1,119 1,420 1,442 1,678 5,659 27% 2% 16% China 1,180 1,264 1,441 1,507 5,392 7% 14% 5% Turkey 1,221 1,230 1,406 1,488 5,345 1% 14% 6% dem. Rep. of the Congo 1,241 1,252 1,291 1,296 5,080 1% 3% 0% Armenia 1, ,271 1,535 4,965-35% 50% 21% Guinea 1, ,081 1,246 4,555-22% 11% 15% Eritrea ,257 1,260 4,406 1% 32% 0% Syrian Arab Rep. 1, ,115 1,147 4,228-15% 23% 3% Algeria ,296-12% -1% 21% India ,012 13% 8% 16% Sudan ,177-8% 21% -5% Viet Nam ,135 13% -2% -15% Stateless ,129-14% 21% 20% Zimbabwe ,075-6% -32% -9% Haiti ,032 53% -31% -13% Bosnia and Herzegovina ,998-16% -34% 86% Azerbaijan ,850-39% 14% 16% Albania ,820 6% -14% -4% Mongolia ,559-7% 3% 16% Rwanda ,479-29% 15% 13% Côte d Ivoire ,419 0% 3% -7% Ghana ,408 17% -25% -5% Cameroon ,359-15% 32% -17% Occupied Palestinian Territory ,268 11% -15% -16% Angola ,200-26% 6% 7% Mauritania ,196-11% 4% 9% Senegal ,141 13% -1% 6% Gambia ,086-7% -3% 12% Egypt ,079 6% -14% 22% Other 7,434 6,706 7,157 7,720 29,017-10% 7% 8% Total 57,868 51,667 62,344 67, ,608-11% 21% 9% Asylum Levels and Trends in Industrialized Countries
34 TABLE 14 Origin of asylum applicants in the European Union (27) by quarter 2011 Covering 27 European Union countries which provided monthly data to UNHCR. Origin No. of applications Change (%) Share (%) Q1 Q2 Q3 Q4 Total Q2-Q1 Q3-Q2 Q4-Q3 Q1 Q2 Q3 Q4 Afghanistan 5,547 6,200 7,514 6,898 26,159 12% 21% -8% Serbia (and Kosovo: S/RES/1244 (1999)) 5,973 3,634 3,011 6,454 19,072-39% -17% 114% Russian Federation 3,376 3,149 4,314 4,206 15,045-7% 37% -3% Pakistan 2,726 2,980 4,183 4,497 14,386 9% 40% 8% Iraq 3,479 3,103 3,799 3,242 13,623-11% 22% -15% Islamic Rep. of Iran 2,463 2,214 2,932 3,180 10,789-10% 32% 8% Somalia 2,128 2,820 2,558 3,150 10,656 33% -9% 23% Nigeria 1,506 2,754 1,870 1,694 7,824 83% -32% -9% Bangladesh 1,494 2,125 1,573 1,595 6,787 42% -26% 1% Syrian Arab Rep. 1,131 1,331 2,061 2,202 6,725 18% 55% 7% Sri Lanka 1,760 1,565 1,493 1,613 6,431-11% -5% 8% Georgia 1,252 1,339 1,855 1,806 6,252 7% 39% -3% Armenia 1,252 1,580 1,546 1,551 5,929 26% -2% 0% dem. Rep. of the Congo 1,376 1,406 1,432 1,586 5,800 2% 2% 11% Turkey 1,508 1,263 1,130 1,475 5,376-16% -11% 31% Guinea 1,411 1,243 1,330 1,356 5,340-12% 7% 2% Tunisia 2,464 1,027 1, ,248-58% 4% -35% Eritrea 1,079 1,500 1,433 1,196 5,208 39% -4% -17% China 1,326 1,235 1,287 1,236 5,084-7% 4% -4% The former Yugoslav Rep. of Macedonia 1,341 1, ,699 28% -59% 35% Côte d Ivoire 1,087 1, ,262 57% -51% -23% Algeria ,134 1,155 4,062 5% 25% 2% Albania ,336 2,822 25% 34% 111% Libya 384 1, , % -24% -56% India ,612 7% 3% -8% Sudan ,558 28% 4% -12% Stateless ,418 9% -4% -18% Ghana 317 1, , % -46% -44% Bosnia and Herzegovina ,041 2,275 6% 117% 60% Azerbaijan ,190-19% 31% 11% Haiti ,043 4% -24% -6% Egypt ,994 14% 38% 30% Mali , % -21% -50% Morocco ,859 3% 72% 3% Viet Nam ,527-9% 9% -25% Senegal ,501-18% 3% 41% Cameroon ,468 4% 5% 31% Mongolia ,456 4% 11% 16% Comoros ,390-1% -16% -30% Mauritania ,378 12% -16% 21% Other * 7,150 7,332 7,524 8,010 30,016 3% 3% 6% Total 61,006 63,861 66,255 70, ,335 5% 4% 6% * This table excludes some 16,000 asylum applications lodged in Italy due to lack of breakdown by country of origin. 34 Asylum Levels and Trends in Industrialized Countries
35 TABLE 15 Origin of asylum applicants in Canada and the United States of America 2010 Origin No. of applications Change (%) Share (%) Q1 Q2 Q3 Q4 Total Q2-Q1 Q3-Q2 Q4-Q3 Q1 Q2 Q3 Q4 China 3,235 3,672 3,739 3,786 14,432 14% 2% 1% Mexico 1,214 1,389 1,383 1,437 5,423 14% -0% 4% El Salvador ,228 10% -3% 0% Guatemala ,541 5% 11% -5% Hungary ,350-41% -24% 93% Haiti ,135-32% -20% 15% Colombia ,981-14% -1% -16% Sri Lanka ,408 9% 199% -69% Honduras ,384-2% -1% -3% Ethiopia ,378 2% 7% -10% India ,313-13% 28% -0% Russian Federation ,276 51% -39% 5% Nepal ,160 1% 9% -12% Nigeria ,066-4% 21% 3% Pakistan ,043 2% 13% 25% Somalia % 17% -28% Venezuela (Bolivarian Republic of) % 10% 16% Islamic Rep. of Iran % -1% -7% United States * % 78% -34% Saint Vincent and the Grenadines % 34% -22% Egypt % 15% 2% Eritrea % 1% 46% Jamaica % 16% 15% Iraq % -5% -15% Cameroon % 0% 3% Afghanistan % 36% -36% Kenya % 6% -26% Ecuador % 5% 22% Saint Lucia % 20% 19% Guinea % -31% -6% Cuba % 2% 7% dem. Rep. of the Congo % 71% -24% Turkey % -2% 24% Ukraine % -42% 43% Indonesia % -14% 7% Albania % -1% -13% Philippines % -24% 28% Serbia (and Kosovo: S/RES/1244 (1999)) % -25% -14% Brazil % -37% 9% Peru % 30% -10% Other 5,850 6,664 6,764 6,863 26,141 14% 2% 1% Total 15,963 16,633 17,286 17,092 66,974 4% 4% -1% * Refers to applications lodged in Canada. Asylum Levels and Trends in Industrialized Countries
36 TABLE 16 Origin of asylum applicants in Canada and the United States of America 2011 Origin No. of applications Change (%) Share (%) Q1 Q2 Q3 Q4 Total Q2-Q1 Q3-Q2 Q4-Q3 Q1 Q2 Q3 Q4 China 3,905 4,376 4,607 4,415 17,303 12% 5% -4% Mexico 1,918 2,221 2,279 2,421 8,839 16% 3% 6% Hungary ,009 1,843 4,452 26% 13% 83% El Salvador 1,135 1,149 1,083 1,073 4,440 1% -6% -1% Guatemala ,027 3,618 5% 9% 11% India ,208-6% 10% -10% Haiti ,867-14% -26% 12% Honduras ,860 24% -7% -1% Colombia ,520 5% -13% -3% Pakistan ,486-3% 26% -1% Nepal ,430-2% 20% -8% Ethiopia ,318-20% 18% -2% Russian Federation ,298 46% -24% -11% Egypt ,280 16% 16% 17% Nigeria % 0% 7% Islamic Rep. of Iran % 31% 4% Sri Lanka % 15% -5% Eritrea % -23% -36% Venezuela (Bolivarian Rep. of) % -3% -0% Namibia % -51% -24% Ecuador % -17% 38% Jamaica % -14% -6% Somalia % 32% -13% Saint Vincent and the Grenadines % 45% -21% Iraq % 0% -5% Cameroon % -1% -5% United States * % 20% 5% Afghanistan % 20% -7% Côte d Ivoire % -33% -36% Saint Lucia % 12% 22% dem. Rep. of the Congo % 18% -29% Bangladesh % 26% -35% Syrian Arab Rep % 36% 54% Kenya % 0% 2% Turkey % -10% 47% Cuba % -17% 1% Brazil % -12% -15% Albania % 7% 6% Romania % 49% 30% dem. People s Rep. of Korea % 1% 23% Other 3,518 3,787 3,597 3,587 14,489 8% -5% -0% Total 19,982 21,112 21,358 22,070 84,522 6% 1% 3% * Refers to applications lodged in Canada. 36 Asylum Levels and Trends in Industrialized Countries
37 TABLE 17 Origin of asylum applicants in Australia and New Zealand 2010 Origin No. of applications Change (%) Share (%) Q1 Q2 Q3 Q4 Total Q2-Q1 Q3-Q2 Q4-Q3 Q1 Q2 Q3 Q4 Afghanistan 536 1, , % -44% -51% Islamic Rep. of Iran , % 69% 58% China ,213 12% -10% 3% Stateless , % 15% 30% Iraq % 71% 36% Sri Lanka % -47% 3% Fiji % -22% -31% Pakistan % 45% 6% India % 16% -12% Egypt % 24% 30% Zimbabwe % -50% -40% Malaysia % 23% -41% Lebanon % -29% 30% Indonesia % 33% -41% Nepal % 33% 43% Myanmar % -11% -36% Turkey % 94% 3% Bangladesh % -4% 24% Viet Nam % 186% 195% Rep. of Korea % -36% -24% Other ,012 27% -11% 4% Total 2,453 3,858 3,348 3,339 12,998 57% -13% -0% TABLE 18 Origin of asylum applicants in Australia and New Zealand 2011 Origin No. of applications Change (%) Share (%) Q1 Q2 Q3 Q4 Total Q2-Q1 Q3-Q2 Q4-Q3 Q1 Q2 Q3 Q4 Islamic Rep. of Iran ,185-29% 34% 39% Afghanistan ,732 43% -1% 183% China ,208-23% 33% 8% Pakistan % -7% 52% India % 14% -2% Stateless % 348% 51% Iraq % 30% 25% Egypt % 7% 23% Sri Lanka % -66% 231% Fiji % 25% 60% Nepal % 48% -36% Libya % 127% -80% Zimbabwe % 18% -41% Malaysia % 8% 26% Indonesia % -20% -5% Lebanon % 26% 36% Bangladesh % 74% 45% Viet Nam % 40% -43% Syrian Arab Rep % 144% -13% Turkey % -8% -14% Other ,286 20% -1% -1% Total 2,698 2,422 2,845 3,853 11,818-10% 17% 35% Asylum Levels and Trends in Industrialized Countries
38 TABLE 19 Origin of asylum applicants in Japan and the Republic of Korea 2010 An asterisk (*) denotes between 1 and 4 applications. Origin No. of applications Change (%) Share (%) Q1 Q2 Q3 Q4 Total Q2-Q1 Q3-Q2 Q4-Q3 Q1 Q2 Q3 Q4 Myanmar % 0% 23% Pakistan % 109% 122% Sri Lanka % 41% 35% Turkey % 65% -28% Nepal % 94% 79% India % 242% -54% Kyrgyzstan % Bangladesh % -20% 38% Nigeria % 31% -35% Islamic Rep. of Iran % 38% 9% Uganda * % 38% 0% Cameroon * % 86% -46% China % 0% 40% Ethiopia * * % 233% -40% dem. Rep. of the Congo * * % 350% -22% Afghanistan * * % 400% 20% Ghana * * * % 0% 350% Philippines 7 * * * 12-86% 100% 0% Indonesia * % Angola * * * - 8 0% 100% -100% Other % 65% 0% Total ,634 5% 66% 8% Asylum Levels and Trends in Industrialized Countries
39 TABLE 20 Origin of asylum applicants in Japan and the Republic of Korea 2011 An asterisk (*) denotes between 1 and 4 applications Origin No. of applications Change (%) Share (%) Q1 Q2 Q3 Q4 Total Q2-Q1 Q3-Q2 Q4-Q3 Q1 Q2 Q3 Q4 Pakistan % 20% 33% Myanmar % -46% 30% Sri Lanka % 45% 10% Nepal % -10% 13% Turkey % 53% 38% Bangladesh % 93% -30% Uganda % 38% 177% Nigeria % 73% 116% India % 145% -19% Afghanistan % 73% -62% Cameroon * % 243% -13% Islamic Rep. of Iran % 114% -27% Côte d Ivoire * 27 * % -96% 800% Kyrgyzstan * 17 * % -76% 50% China % -44% 0% Liberia * % -17% 80% Ethiopia 8 * 6 * 17-88% 500% -67% Philippines 8 * 5 * 16-88% 400% -60% Ghana * * * % 0% 300% Guinea * * * % 300% 50% Other % -47% 195% Total ,878 23% 3% 27% Asylum Levels and Trends in Industrialized Countries
40 TABLE 21 Asylum applications lodged in 44 industrialized countries by origin fourth quarter 2011 Covering all 44 asylum countries which provided monthly data to UNHCR. See notes in Annex Table 1. Top-20 ranking of countries based on applications lodged in all countries. An asterisk (*) denotes between 1 and 4 applications. Origin Albania Australia Austria Belgium Bosnia and H. Bulgaria Canada Croatia Cyprus Czech Rep. Denmark Estonia Finland France Germany Afghanistan , ,671 Iraq * * * ,336 Serbia (and Kosovo: S/RES/1244 (1999)) * - 48 * ,757 China * * * - * Islamic Rep. of Iran * * Pakistan * * 19 - * 435 1,142 Russian Federation - * * , Somalia * * * * Syrian Arab Rep * 85 * Nigeria * 190 * 5 * Mexico - - * Eritrea * Sri Lanka * Georgia * * - * * Turkey * 109 * * * Hungary , Bangladesh * 26 * * dem. Rep. of the Congo - * , India * * Armenia - * * * 19 * * Origin Greece Hungary Iceland Ireland Italy (1) Japan (2) Latvia Afghanistan * * * * 255 Iraq * * 79 * * * 314 * 60 Serbia (and Kosovo: S/RES/1244(1999)) * 57 - * China 67 * * - * * 21 Islamic Rep. of Iran * * * * * Pakistan * * 16 Russian Federation 17 * * * Somalia * Syrian Arab Rep * * 107 * Nigeria 95 6 * * * * - 21 * 63 Mexico * * * Eritrea * * - * * * Sri Lanka * Georgia * * * - 19 * * 44-7 Turkey * 9 Hungary * 6 Bangladesh 94 * * * 6 35 dem. Rep. of the Congo * 18 - * India * * * 6 Armenia 15 * - * * - - * Lithuania Malta Liechtenstein Luxembourg Montenegro Netherlands New Zealand Norway / 40 Asylum Levels and Trends in Industrialized Countries
41 TABLE 21 Asylum applications lodged in 44 industrialized countries by origin fourth quarter 2011 (ctnd) Covering all 44 asylum countries which provided monthly data to UNHCR. See notes in Annex Table 1. Top-20 ranking of countries based on applications lodged in all countries. An asterisk (*) denotes between 1 and 4 applications. Origin Poland Portugal Rep. of Korea Romania Serbia (3) Slovakia Slovenia Spain Sweden Switzerland TfYR Macedonia (4) Turkey United Kingdom United States (5) Afghanistan - * * 1, Iraq * * * * , Serbia (and Kosovo: S/RES/1244(1999)) * - 1, China * - * 7 - * ,925 Islamic Rep. of Iran * * - * * * * * 1, Pakistan * * * , Russian Federation * * Somalia , Syrian Arab Rep * * Nigeria * * * - * Mexico * * ,257 Eritrea * Sri Lanka * * * Georgia 371 * - * * Turkey * * Hungary Bangladesh - * * - * dem. Rep. of the Congo - * * - * * India * Armenia * - * This table excludes a significant number of asylum applications lodged in Italy due to lack of data. 2 UNHCR estimates. 3 Serbia (and Kosovo: S/RES/1244 (1999)). 4 The former Yugoslav Republic of Macedonia. 5 Combination of number of cases (DHS) and persons (EOIR). Asylum Levels and Trends in Industrialized Countries
42 TABLE 22 Top-10 populations of origin of asylum applicants by country of asylum 2010 Covering 44 industrialized countries which provided monthly data to UNHCR. See notes in Annex Table 1. An asterisk (*) denotes between 1 and 4 applications. Albania Australia Austria Belgium Bosnia and Herzegovina Serbia (1) * Afghanistan 3,129 Russian Fed. 2,322 Serbia (1) 4,545 Afghanistan 11 Iraq * Islamic Rep. of Iran 1,354 Afghanistan 1,582 Iraq 1,637 Serbia (1) 10 Islamic Rep. of Iran * China 1,191 Serbia (1) 972 Guinea 1,455 Islamic Rep. of Iran * TfYR Macedonia (2) * Stateless 1,035 Nigeria 573 Armenia 1,266 Iraq * Bosnia-Herzegovina * Iraq 856 India 433 Russian Fed. 1,141 Cameroon * Egypt * Sri Lanka 796 Islamic Rep. of Iran 387 Afghanistan 1,124 Ethiopia * Tunisia * Fiji 547 Georgia 370 Rwanda 1,065 Pakistan * Libya * Pakistan 470 Turkey 369 TfYR Macedonia (2) 980 Syrian Arab Rep. * Saudi Arabia * India 412 Iraq 336 dem. Rep. of Congo 813 Algeria * Egypt 328 Algeria 304 Madagascar 653 Eritrea * Bulgaria Canada Croatia Cyprus Czech Republic Iraq 452 Hungary 2,321 Afghanistan 107 Iraq 343 Ukraine 64 Stateless 100 China 1,582 Occup. Palest. Territ. 48 India 318 Mongolia 44 Armenia 62 Colombia 1,354 Islamic Rep. of Iran 21 Viet Nam 227 Myanmar 42 Islamic Rep. of Iran 61 Sri Lanka 1,203 Bosnia-Herzegovina 13 Egypt 211 Russian Fed. 36 Afghanistan 58 Mexico 1,198 Western Sahara 13 Sri Lanka 187 Viet Nam 26 Syrian Arab Rep. 52 Haiti 1,061 Somalia 11 Pakistan 155 Belarus 26 Algeria 35 Nigeria 860 Serbia (1) 11 Bangladesh 148 Nigeria 25 Sudan 20 United States 767 Algeria 10 Nigeria 133 Stateless 21 Pakistan 17 St Vincent & the Grenadines 689 Iraq 9 China 123 Kyrgyzstan 18 Georgia 14 India 593 Pakistan 5 Nepal 121 Turkey 17 Denmark Estonia Finland France Germany Afghanistan 1,476 Afghanistan 9 Iraq 575 Serbia (1) 5,754 Serbia (1) 6,546 Syrian Arab Rep. 821 Russian Fed. 7 Somalia 571 Russian Fed. 4,302 Afghanistan 5,905 Islamic Rep. of Iran 597 Sri Lanka * Bulgaria 485 dem. Rep. of Congo 3,395 Iraq 5,555 Serbia (1) 402 Nigeria * Russian Fed. 436 Bangladesh 3,140 Islamic Rep. of Iran 2,475 Russian Fed. 340 Belarus * Serbia (1) 325 Sri Lanka 2,827 TfYR Macedonia (2) 2,466 Iraq 237 Stateless * Afghanistan 265 Guinea 2,012 Somalia 2,235 Somalia 110 Turkey * Islamic Rep. of Iran 142 Haiti 1,992 Syrian Arab Rep. 1,490 Occup. Palest. Territ. 106 Sudan * Turkey 117 China 1,933 Turkey 1,340 Turkey 51 Armenia * Romania 94 Armenia 1,766 Russian Fed. 1,199 India 48 Pakistan * Nigeria 84 Turkey 1,402 Viet Nam 1,009 Greece Hungary Iceland Ireland Italy Pakistan 2,748 Afghanistan 796 Afghanistan 7 Nigeria 387 Nigeria 1,385 Georgia 1,162 Serbia (1) 637 Islamic Rep. of Iran 6 China 228 Pakistan 929 Bangladesh 987 Occup. Palest. Territ. 209 Iraq 5 Pakistan 200 Afghanistan 873 Albania 693 Turkey 95 Somalia 5 dem. Rep. of Congo 70 Turkey 854 China 549 Georgia 76 TfYR Macedonia (2) * Afghanistan 69 Bosnia-Herzegovina 816 Afghanistan 524 Islamic Rep. of Iran 72 Spain * Ghana 57 Serbia (1) 795 Nigeria 393 Iraq 55 Nigeria * Rep. of Moldova 56 Iraq 380 India 381 Somalia 53 Syrian Arab Rep. * Cameroon 56 Ghana 278 Senegal 381 Nigeria 42 Rep. of Moldova * Georgia 53 Islamic Rep. of Iran 269 Iraq 342 Viet Nam 42 Nepal * South Africa 53 Côte d Ivoire 235 Japan Latvia Liechtenstein Lithuania Luxembourg Myanmar 345 Afghanistan 23 TfYR Macedonia (2) 38 Georgia 235 Serbia (1) 301 Sri Lanka 173 Russian Fed. 7 Russian Fed. 32 Russian Fed. 40 Iraq 79 Turkey 127 Kyrgyzstan 7 Nigeria 11 Afghanistan 26 Algeria 43 Nepal 110 dem. Rep. of Congo * Serbia (1) 6 Armenia 21 Islamic Rep. of Iran 31 Pakistan 83 Ghana * Belarus * Viet Nam 10 Somalia 29 India 82 Cameroon * Iraq * Belarus 9 Russian Fed. 25 Islamic Rep. of Iran 35 Belarus * Somalia * Tajikistan 5 Albania 23 Nigeria 34 Uzbekistan * Uzbekistan * Azerbaijan * Syrian Arab Rep. 19 Bangladesh 27 Nepal * Egypt * Kyrgyzstan * Turkey 19 Uganda 21 Islamic Rep. of Iran * Syrian Arab Rep. * Rep. of Moldova * Belarus 15 / 42 Asylum Levels and Trends in Industrialized Countries
43 TABLE 22 Top-10 populations of origin of asylum applicants by country of asylum 2010 (ctnd) Covering 44 industrialized countries which provided monthly data to UNHCR. See notes in Annex Table 1. An asterisk (*) denotes between 1 and 4 applications. Malta Montenegro Netherlands New Zealand Norway Somalia 34 Algeria * Somalia 3,372 Fiji 65 Eritrea 1,711 Pakistan 16 Russian Fed. * Iraq 1,383 Islamic Rep. of Iran 42 Somalia 1,397 Syrian Arab Rep. 8 Turkey * Afghanistan 1,364 Sri Lanka 23 Afghanistan 979 Nigeria 8 Croatia * Islamic Rep. of Iran 785 China 22 Russian Fed. 628 Iraq 7 Armenia 611 South Africa 19 Ethiopia 505 Ethiopia 7 Georgia 587 Saudi Arabia 15 Iraq 460 Libya 7 Eritrea 392 Czech Rep. 14 Stateless 448 Eritrea 6 TfYR Macedonia (2) 389 Iraq 10 Serbia (1) 444 Sudan 6 China 302 Zimbabwe 8 Islamic Rep. of Iran 429 Morocco 5 Guinea 230 Pakistan 7 Nigeria 354 Poland Portugal Rep. of Korea Romania Serbia (1) Russian Fed. 4,796 Guinea 43 Pakistan 129 Afghanistan 120 Afghanistan 425 Georgia 1,083 Colombia 16 Kyrgyzstan 77 Rep. of Moldova 109 Occup. Palest. Territ. 138 Armenia 107 Angola 12 Bangladesh 41 Iraq 75 Iraq 53 Viet Nam 47 Guinea-Bissau 10 Myanmar 34 Turkey 68 Somalia 42 Belarus 46 dem. Rep. of Congo 9 Nigeria 19 China 67 Pakistan 30 Ukraine 45 Nigeria 7 Afghanistan 15 Pakistan 62 dem. Rep. of Congo 13 Kyrgyzstan 37 Sierra Leone 7 Uganda 12 Islamic Rep. of Iran 35 Islamic Rep. of Iran 12 Iraq 27 Islamic Rep. of Iran 6 Cameroon 11 Nigeria 22 Morocco 10 Pakistan 27 Russian Fed. 5 dem. Rep. of Congo 9 Myanmar 21 Tunisia 10 Afghanistan 25 Georgia * China 7 Syrian Arab Rep. 19 Algeria 9 Slovakia Slovenia Spain Sweden Switzerland Afghanistan 76 Serbia (1) 28 Cuba 406 Serbia (1) 7,907 Sri Lanka 892 Georgia 66 Turkey 27 Nigeria 237 Somalia 5,560 Afghanistan 632 Russian Fed. 65 Bosnia-Herzegovina 24 Algeria 175 Afghanistan 2,397 Georgia 531 Rep. of Moldova 41 Afghanistan 23 Guinea 166 Iraq 1,978 Iraq 501 India 38 Nigeria 11 Cameroon 155 Eritrea 1,444 Turkey 462 China 35 Occup. Palest. Territ. 10 Colombia 123 Islamic Rep. of Iran 1,183 TfYR Macedonia (2) 403 Pakistan 34 Islamic Rep. of Iran 9 Côte d Ivoire 119 Stateless 1,026 Syrian Arab Rep. 387 Viet Nam 32 Russian Fed. 8 Morocco 116 Russian Fed. 987 China 333 Somalia 23 Somalia 8 Occup. Palest. Territ. 101 TfYR Macedonia (2) 908 Russian Fed. 315 Ukraine 21 Sudan 8 dem. Rep. of Congo 88 Mongolia 727 Algeria 313 TfYR Macedonia (2) Turkey United Kingdom United States (3) Somalia 18 Iraq 3,656 Afghanistan 1,835 China 12,850 Eritrea 5 Islamic Rep. of Iran 2,881 Sri Lanka 1,625 Mexico 4,225 Serbia (1) * Afghanistan 1,248 China 1,215 El Salvador 2,703 Bosnia-Herzegovina * Somalia 448 Nigeria 1,100 Guatemala 2,235 Iraq * Kyrgyzstan 246 Eritrea 760 Ethiopia 1,163 Russian Fed. * Uzbekistan 101 Somalia 675 Haiti 1,074 Algeria * dem. Rep. of Congo 66 Sudan 640 Nepal 1,063 Islamic Rep. of Iran * Occup. Palest. Territ. 64 India 600 Honduras 1,036 Morocco * Sudan 48 Bangladesh 495 Russian Fed. 817 Syrian Arab Rep. * Pakistan 42 Iraq 475 India Serbia (and Kosovo: S/RES/1244 (1999)). 2 The former Yugoslav Republic of Macedonia. 3 Combination of cases (DHS) and persons (EOIR). Asylum Levels and Trends in Industrialized Countries
44 TABLE 23 Top-10 populations of origin of asylum applicants by country of asylum 2011 Covering 44 industrialized countries which provided monthly data to UNHCR. An asterisk (*) denotes between 1 and 4 applications. Albania Australia Austria Belgium Bosnia and Herzegovina Serbia (1) 8 Islamic Rep. of Iran 2,156 Afghanistan 3,623 Serbia (1) 3,067 Algeria 9 Somalia * Afghanistan 1,721 Russian Fed. 2,319 Afghanistan 2,773 Serbia (1) 8 Iraq * China 1,188 Pakistan 952 Guinea 2,046 Morocco 6 China * Pakistan 817 Somalia 611 Iraq 2,004 Pakistan * Pakistan * India 765 Serbia (1) 541 Russian Fed. 1,747 Occup. Palest. Territ. * Bangladesh * Stateless 530 Iraq 484 Albania 1,152 Islamic Rep. of Iran * Algeria * Iraq 491 India 463 TfYR Macedonia (2) 1,117 Afghanistan * Egypt 417 Islamic Rep. of Iran 457 dem. Rep. of Congo 1,084 Cameroon * Sri Lanka 370 Algeria 446 Pakistan 924 Tunisia * Fiji 276 Syrian Arab Rep. 423 Armenia 556 Somalia * Bulgaria Canada Croatia Cyprus Czech Republic Iraq 344 Hungary 4,409 Afghanistan 487 Viet Nam 212 Ukraine 101 Afghanistan 92 China 1,853 Pakistan 70 Syrian Arab Rep. 187 Belarus 38 Syrian Arab Rep. 85 Colombia 892 Somalia 42 Egypt 184 Viet Nam 27 Stateless 66 Namibia 831 Islamic Rep. of Iran 40 Bangladesh 182 Afghanistan 25 Somalia 42 Pakistan 828 Occup. Palest. Territ. 19 Pakistan 148 Russian Fed. 25 Islamic Rep. of Iran 37 India 751 Russian Fed. 15 India 134 Uzbekistan 24 Armenia 37 Nigeria 685 Libya 14 Sri Lanka 114 Myanmar 23 Pakistan 27 St Vincent & the Grenadines 654 Tunisia 14 Nepal 102 Kyrgyzstan 21 Algeria 23 Mexico 653 Morocco 13 Philippines 84 Cuba 20 Morocco 20 Sri Lanka 629 Turkey 9 Islamic Rep. of Iran 68 Turkey 17 Denmark Estonia Finland France Germany Afghanistan 903 dem. Rep. of Congo 11 Iraq 588 Russian Fed. 4,042 Afghanistan 7,767 Islamic Rep. of Iran 461 Afghanistan 8 Somalia 365 dem. Rep. of Congo 3,804 Serbia (1) 5,974 Syrian Arab Rep. 428 Armenia 7 Russian Fed. 294 Armenia 3,638 Iraq 5,831 Serbia (1) 325 Georgia 6 Afghanistan 292 Bangladesh 3,568 Islamic Rep. of Iran 3,352 Russian Fed. 304 Russian Fed. * Serbia (1) 160 Serbia (1) 3,458 Syrian Arab Rep. 2,634 Iraq 115 Belarus * Islamic Rep. of Iran 125 Sri Lanka 3,183 Pakistan 2,539 Somalia 107 Somalia * Syrian Arab Rep. 109 China 2,184 Russian Fed. 1,689 Algeria 103 Libya * Nigeria 105 Guinea 2,017 Turkey 1,578 Occup. Palest. Territ. 68 Stateless * Belarus 83 Haiti 2,010 TfYR Macedonia (2) 1,131 Libya 67 Cameroon * Turkey 74 Turkey 1,737 Somalia 984 Greece Hungary Iceland Ireland Italy Pakistan 2,309 Afghanistan 649 Russian Fed. 7 Nigeria 182 Unknown 16,008 Georgia 1,121 Serbia (1) 238 Nigeria 6 Pakistan 175 Tunisia 3,531 Afghanistan 637 Pakistan 121 Algeria 5 China 142 Nigeria 2,876 Bangladesh 615 Syrian Arab Rep. 91 Iraq 5 dem. Rep. of Congo 70 Ghana 1,263 China 406 Somalia 61 Georgia * Afghanistan 67 Pakistan 1,150 Senegal 375 Algeria 56 India * Zimbabwe 67 Mali 1,001 Nigeria 362 Iraq 54 Ethiopia * Algeria 48 Côte d Ivoire 935 Syrian Arab Rep. 352 Occup. Palest. Territ. 36 Belarus * South Africa 45 Afghanistan 880 Egypt 306 Islamic Rep. of Iran 33 Afghanistan * Albania 34 Bangladesh 734 Albania 276 Morocco 30 Islamic Rep. of Iran * Rep. of Moldova 28 Somalia 513 Japan (3) Latvia Liechtenstein Lithuania Luxembourg Myanmar 489 Georgia 176 Serbia (1) 31 Georgia 202 Serbia (1) 1,097 Nepal 250 dem. Rep. of Congo 39 Russian Fed. 14 Russian Fed. 58 TfYR Macedonia (2) 446 Turkey 235 Russian Fed. 18 Islamic Rep. of Iran * Afghanistan 45 Montenegro 103 Sri Lanka 226 Islamic Rep. of Iran 16 Afghanistan * Kyrgyzstan 30 Bosnia-Herzegovina 51 Pakistan 170 Syrian Arab Rep. 16 Nigeria * Armenia 28 Russian Fed. 49 Bangladesh 98 Cameroon 10 Kyrgyzstan * Belarus 12 Iraq 43 Nigeria 51 Lebanon 10 Georgia * Uzbekistan 7 Tunisia 42 India 51 Turkey 5 Stateless * Stateless * Islamic Rep. of Iran 35 Islamic Rep. of Iran 48 Côte d Ivoire 5 Turkmenistan * Tajikistan * Algeria 30 Cameroon 48 Libya 5 Armenia * dem. Rep. of Congo * Albania 27 / 44 Asylum Levels and Trends in Industrialized Countries
45 TABLE 23 Top-10 populations of origin of asylum applicants by country of asylum 2011 (ctnd) Covering 44 industrialized countries which provided monthly data to UNHCR. An asterisk (*) denotes between 1 and 4 applications. Malta Montenegro Netherlands New Zealand Norway Somalia 454 Morocco 84 Afghanistan 1,885 Islamic Rep. of Iran 29 Somalia 2,216 Eritrea 306 Algeria 65 Iraq 1,435 Fiji 29 Eritrea 1,256 Nigeria 246 Tunisia 31 Somalia 1,415 Pakistan 22 Afghanistan 979 Syrian Arab Rep. 122 Occup. Palest. Territ. 21 Islamic Rep. of Iran 929 Bahrain 22 Russian Fed. 365 Ethiopia 113 Afghanistan 8 Armenia 471 China 20 Iraq 357 Côte d Ivoire 110 Islamic Rep. of Iran 7 Eritrea 458 Egypt 20 Islamic Rep. of Iran 355 Mali 92 Libya * Russian Fed. 451 Sri Lanka 19 Ethiopia 293 Ghana 76 Pakistan * China 276 South Africa 14 Stateless 262 Libya 66 Nigeria * TfYR Macedonia (2) 266 Afghanistan 11 Nigeria 240 Sudan 58 Iraq * Belarus 256 Iraq 11 Serbia (1) 240 Poland Portugal Rep. of Korea Romania Serbia (1) Russian Fed. 2,784 Guinea 46 Pakistan 434 Algeria 456 Afghanistan 1,757 Georgia 1,240 Somalia 26 Sri Lanka 100 Morocco 219 Somalia 501 Armenia 162 Nigeria 22 Uganda 78 Tunisia 218 Pakistan 356 Belarus 57 Côte d Ivoire 18 Myanmar 64 Pakistan 144 Libya 145 Ukraine 39 dem. Rep. of Congo 14 Afghanistan 60 Afghanistan 107 Occup. Palest. Territ. 129 Kyrgyzstan 35 Colombia 13 Nigeria 39 Rep. of Moldova 61 Morocco 95 Afghanistan 29 Pakistan 11 Bangladesh 38 Iraq 59 Tunisia 77 Viet Nam 25 Islamic Rep. of Iran 11 Côte d Ivoire 36 China 47 Algeria 65 Iraq 20 Guinea-Bissau 11 Kyrgyzstan 28 Occup. Palest. Territ. 43 Islamic Rep. of Iran 37 Kazakhstan 17 Russian Fed. 8 Liberia 20 Syrian Arab Rep. 36 Syrian Arab Rep. 33 Slovakia Slovenia Spain Sweden Switzerland Somalia 76 Afghanistan 57 Côte d Ivoire 550 Afghanistan 4,120 Eritrea 3,224 Afghanistan 73 Turkey 39 Cuba 440 Somalia 3,979 Tunisia 2,324 Georgia 57 Serbia (1) 35 Nigeria 259 Serbia (1) 3,915 Serbia (1) 1,539 Russian Fed. 35 Pakistan 26 Guinea 150 Eritrea 1,649 Nigeria 1,303 Rep. of Moldova 33 Tunisia 24 Occup. Palest. Territ. 131 Iraq 1,634 Afghanistan 1,006 India 19 Somalia 17 Western Sahara 131 Islamic Rep. of Iran 1,118 TfYR Macedonia (2) 838 Viet Nam 17 Syrian Arab Rep. 10 Cameroon 129 Stateless 1,105 Syrian Arab Rep. 688 Islamic Rep. of Iran 13 Morocco 9 Algeria 122 Bosnia-Herzegovina 981 China 688 China 12 Islamic Rep. of Iran 8 Colombia 104 Russian Fed. 930 Somalia 558 Pakistan 11 Algeria 8 Syrian Arab Rep. 97 TfYR Macedonia (2) 885 Turkey 508 TfYR Macedonia (2) Turkey United Kingdom United States (4) Afghanistan 427 Iraq 7,912 Pakistan 3,945 China 15,450 Pakistan 172 Islamic Rep. of Iran 3,411 Islamic Rep. of Iran 3,045 Mexico 8,186 Somalia 53 Afghanistan 2,486 Sri Lanka 2,125 El Salvador 4,011 Occup. Palest. Territ. 15 Somalia 744 Afghanistan 1,525 Guatemala 3,363 Iraq 13 Syrian Arab Rep. 188 Libya 1,185 India 2,457 India 11 Kyrgyzstan 169 Nigeria 1,055 Honduras 1,528 Islamic Rep. of Iran 10 Occup. Palest. Territ. 157 China 920 Nepal 1,384 Morocco 8 Uzbekistan 147 Eritrea 835 Haiti 1,348 Sudan 6 dem. Rep. of Congo 76 Sudan 790 Egypt 1,131 Serbia (1) 5 Yemen 72 Zimbabwe 735 Ethiopia 1,056 1 Serbia (and Kosovo: S/RES/1244 (1999)). 2 The former Yugoslav Republic of Macedonia. 3 UNHCR estimates. 4 Combination of cases (DHS) and persons (EOIR). Asylum Levels and Trends in Industrialized Countries
46 TABLE 24 Monthly asylum applications lodged in 44 industrialized countries 2011 Covering 44 countries which provided monthly data to UNHCR. Asylum country Jan. Feb. Mar. Apr. May Jun. Jul. Aug. Sep. Oct. Nov. Dec. Change Nov-Dec Albania Australia 1, ,000 1,226 1,170 1,349 1,270-6% Austria ,079 1,499 1,588 1,460 1,570 1,243 1,254 1% Belgium 1,934 1,931 2,395 2,105 1,876 1,738 1,848 2,339 2,629 2,718 2,272 2,199-3% Bosnia and H % Bulgaria % Canada 1,875 1,936 2,138 1,836 1,815 1,916 1,529 2,127 2,712 2,745 2,622 2,096-20% Croatia % Cyprus % Czech Rep % denmark % Estonia % Finland % France 4,153 4,323 4,910 4,778 4,618 4,103 4,202 3,680 4,183 4,583 3,921 4,459 14% Germany 3,901 3,370 3,625 3,031 3,501 3,255 3,556 4,065 4,190 4,184 4,889 4,174-15% Greece , % Hungary % Iceland % Ireland % Italy * 589 1,623 1,775 1,458 3,304 2,111 1,515 1,230 1,439 1, % Japan % Latvia % Liechtenstein % Lithuania % Luxembourg % Malta , % Montenegro % Netherlands 1, , ,015 1,053 1,015 1, % New Zealand % Norway % Poland % Portugal % Rep. of Korea % Romania % Serbia (and Kosovo: S/RES/1244 (1999)) % - of which Kosovo % Slovakia % Slovenia % Spain % Sweden 1,963 1,948 2,303 2,040 2,378 1,963 2,063 2,567 2,795 3,022 3,112 3,494 12% Switzerland 1,058 1,062 1,602 1,303 2,019 1,436 1,468 1,485 1,774 1,826 2,219 2,187-1% The former Yugoslav Rep. of Macedonia % Turkey ,030 1,167 1,501 1,345 1,365 1,186 4, % United Kingdom 2,045 1,890 2,140 1,940 2,005 2,155 2,285 2,000 2,160 2,115 2,540 2,135-16% United States 5,546 5,002 6,753 5,672 6,362 7,329 6,011 6,875 6,026 6,170 6,200 6,073-2% EU- Old (15) 18,244 18,943 21,315 18,771 21,671 19,019 19,939 20,363 22,146 22,529 21,944 21,285-3% EU- New (12) ,967 1,307 1,125 1,163 1,356 1,285 1,691 1,552 1,214-22% EU-Total (27) 18,962 19,785 22,260 20,738 22,978 20,144 21,102 21,719 23,431 24,220 23,496 22,499-4% Nordic countries (5) 3,399 3,082 3,556 3,198 3,780 3,272 3,283 3,953 4,363 4,508 4,424 4,852 10% Western Europe (19) 20,124 20,656 23,623 20,755 24,585 21,279 22,134 22,699 24,821 25,133 24,841 24,158-3% Southern Europe (8) 2,553 3,908 4,203 4,320 5,820 4,301 4,029 3,822 4,197 3,903 3,462 6,247 80% Total Europe (38) 21,995 22,651 25,787 23,828 27,158 24,030 24,946 26,147 27,997 28,559 28,021 30,038 7% Canada/USA 7,421 6,938 8,891 7,508 8,177 9,245 7,540 9,002 8,738 8,915 8,822 8,169-7% Australia/New Z. 1, ,020 1,257 1,196 1,376 1,281-7% Japan/Rep. of Korea % Total non-europe (6) 8,673 7,877 9,960 8,665 9,368 10,013 8,345 10,268 10,227 10,446 10,475 9,745-7% Total (44) 30,668 30,528 35,747 32,493 36,526 34,043 33,291 36,415 38,224 39,005 38,496 39,783 3% Notes * This table excludes some 16,000 asylum applications lodged in Italy in 2011 due to lack of detailed data. See notes Table Asylum Levels and Trends in Industrialized Countries
47 2012 United Nations High Commissioner for Refugees All rights reserved. Reproductions and translations are authorized, provided UNHCR is acknowledged as the source. For more information, please contact: Field Information and Coordination Support Section division of Programme Support and Management Case Postale Geneva, Switzerland This document along with further information on global displacement is available on UNHCR s Statistics website: and UNHCR s Statistical Online Population database: Cover photo: An Italian coastguard boat approaches the island of Lampedusa to disembark 142 persons, including some asylum-seekers, mostly from West Africa. Their boat sank on its way from North Africa to Lampedusa. unhcr / F.NOY page design and layout: julie schneider produced and printed by unhcr (27 march 2012). Asylum Levels and Trends in Industrialized Countries

48 With ever tighter border controls thousands of refugees cannot reach safety. 1 refugee denied a safe haven is too many. UNHCR / S. Rich
Asylum Trends Levels and Trends in Industrialized Countries
 Asylum Trends 2012 Levels and Trends in Industrialized Countries Trends at a Glance 2012 in review 38% 8% An estimated 479,300 asylum applications were registered in the 44 industrialized countries in
Asylum Levels and Trends in Industrialized Countries. First Half
 First Half 2011 Asylum Levels and Trends in Industrialized Countries Statistical overview of asylum applications lodged in Europe and selected non-european countries Trends at a Glance First half 2011
Cover photo: A 21-year old Somali outside the hangar of Hal Far, Malta. UNHCR / M. EDSTRÖM
 Cover photo: A 21-year old Somali outside the hangar of Hal Far, Malta. UNHCR / M. EDSTRÖM 2 Asylum Levels and Trends in Industrialized Countries, 2009 I. Introduction 1 This report summarizes patterns
ASYLUM LEVELS AND TRENDS IN INDUSTRIALIZED COUNTRIES, 2007
 ASYLUM LEVELS AND TRENDS IN INDUSTRIALIZED COUNTRIES, 2007 Statistical Overview of Asylum Applications Lodged in Europe and Selected Non-European Countries 18 March 2008 I. INTRODUCTION 1 This document
Asylum Levels and Trends in Industrialized Countries. First Quarter, 2005
 Asylum Levels and Trends in Industrialized Countries First Quarter, 2005 Comparative Overview of Asylum Applications Lodged in 31 European and 5 Non-European Countries May 2005 Statistics PGDS/DOS UNHCR
ASYLUM LEVELS AND TRENDS IN INDUSTRIALIZED COUNTRIES, 2005
 ASYLUM LEVELS AND TRENDS IN INDUSTRIALIZED COUNTRIES, 2005 OVERVIEW OF ASYLUM APPLICATIONS LODGED IN EUROPE AND NON-EUROPEAN INDUSTRIALIZED COUNTRIES IN 2005 Click here to download the tables in zipped
Asylum Levels and Trends: Europe and non-european Industrialized Countries, 2003
 Asylum Levels and Trends: Europe and non-european Industrialized Countries, 2003 A comparative overview of asylum applications submitted in 44 European and 6 non-european countries in 2003 and before 24
ASYLUM LEVELS AND TRENDS IN INDUSTRIALIZED COUNTRIES, 2006
 ASYLUM LEVELS AND TRENDS IN INDUSTRIALIZED COUNTRIES, 2006 OVERVIEW OF ASYLUM APPLICATIONS LODGED IN EUROPEAN AND NON-EUROPEAN INDUSTRIALIZED COUNTRIES IN 2006 23 MARCH 2007 FIELD INFORMATION AND COORDINATION
ASYLUM LEVELS AND TRENDS IN INDUSTRIALIZED COUNTRIES FIRST HALF 2009
 ASYLUM LEVELS AND TRENDS IN INDUSTRIALIZED COUNTRIES FIRST HALF 2009 Statistical overview of asylum applications lodged in Europe and selected non-european countries 21 OCTOBER 2009 I. Introduction 1 This
ASYLUM IN THE EU Source: Eurostat 4/6/2013, unless otherwise indicated ASYLUM APPLICATIONS IN THE EU27
 ASYLUM IN THE EU Source: Eurostat 4/6/2013, unless otherwise indicated ASYLUM APPLICATIONS IN THE EU27 Total number of asylum applications in 2012 335 365 450 000 400 000 350 000 300 000 250 000 200 000
UNHCR Statistical Yearbook 2013
 These asylum-seekers have been forced to occupy a former slaughterhouse in Dijon, France due to an acute shortage of accommodation for asylum-seekers in the country. The former meat-packing plant, dubbed
Migration Report Central conclusions
 Migration Report 2013 Central conclusions 2 Migration Report 2013 - Central conclusions Migration Report 2013 Central conclusions The Federal Government s Migration Report aims to provide a foundation
VISA POLICY OF THE REPUBLIC OF KAZAKHSTAN
 VISA POLICY OF THE REPUBLIC OF KAZAKHSTAN Country Diplomatic Service National Term of visafree stay CIS countries 1 Azerbaijan visa-free visa-free visa-free 30 days 2 Kyrgyzstan visa-free visa-free visa-free
Delays in the registration process may mean that the real figure is higher.
 Monthly statistics December 2013: Forced returns from Norway The National Police Immigration Service (NPIS) forcibly returned 483 persons in December 2013. 164 of those forcibly returned in December 2013
Translation from Norwegian
 Statistics for May 2018 Forced returns from Norway The National Police Immigration Service (NPIS) forcibly returned 402 persons in May 2018, and 156 of these were convicted offenders. The NPIS is responsible
Asylum in the EU28 Large increase to almost asylum applicants registered in the EU28 in 2013 Largest group from Syria
 STAT/14/46 24 March 2014 Asylum in the EU28 Large increase to almost 435 000 asylum applicants registered in the EU28 in 2013 Largest group from Syria In 2013, 435 000 asylum applicants 1 were registered
The National Police Immigration Service (NPIS) forcibly returned 412 persons in December 2017, and 166 of these were convicted offenders.
 forcibly returned 412 persons in December 2017, and 166 of these were convicted offenders.") Monthly statistics December 2017: Forced returns from Norway The National Police Immigration Service (NPIS) forcibly returned 412 persons in December 2017, and 166 of these were convicted offenders. The
Monthly statistics December 2017: Forced returns from Norway The National Police Immigration Service (NPIS) forcibly returned 412 persons in December 2017, and 166 of these were convicted offenders. The
AUSTRALIA S REFUGEE RESPONSE NOT THE MOST GENEROUS BUT IN TOP 25
 19 July 2013 AUSTRALIA S REFUGEE RESPONSE NOT THE MOST GENEROUS BUT IN TOP 25 Australia is not the world s most generous country in its response to refugees but is just inside the top 25, according to
I N T R O D U C T I O N
 REFUGEES by numbers 2002 I N T R O D U C T I O N At the start of 2002 the number of people of concern to UNHCR was 19.8 million roughly one out of every 300 persons on Earth compared with 21.8 million
Migration Report Central conclusions
 Migration Report 2012 Central conclusions 2 Migration Report 2012: Central conclusions Migration Report 2012 Central conclusions The Federal Government s Migration Report aims to provide a foundation for
The NPIS is responsible for forcibly returning those who are not entitled to stay in Norway.
 Monthly statistics December 2014: Forced returns from Norway The National Police Immigration Service (NPIS) forcibly returned 532 persons in December 2014. 201 of these returnees had a criminal conviction
The National Police Immigration Service (NPIS) returned 444 persons in August 2018, and 154 of these were convicted offenders.
 returned 444 persons in August 2018, and 154 of these were convicted offenders.") Monthly statistics August 2018 Forced returns from Norway The National Police Immigration Service (NPIS) returned 444 persons in August 2018, and 154 of these were convicted offenders. The NPIS is responsible
Monthly statistics August 2018 Forced returns from Norway The National Police Immigration Service (NPIS) returned 444 persons in August 2018, and 154 of these were convicted offenders. The NPIS is responsible
Return of convicted offenders
 Monthly statistics December : Forced returns from Norway The National Police Immigration Service (NPIS) forcibly returned 869 persons in December, and 173 of these were convicted offenders. The NPIS forcibly
SLOW PACE OF RESETTLEMENT LEAVES WORLD S REFUGEES WITHOUT ANSWERS
 21 June 2016 SLOW PACE OF RESETTLEMENT LEAVES WORLD S REFUGEES WITHOUT ANSWERS Australia and the world s wealthiest nations have failed to deliver on promises to increase resettlement for the world s neediest
The National Police Immigration Service (NPIS) forcibly returned 375 persons in March 2018, and 136 of these were convicted offenders.
 forcibly returned 375 persons in March 2018, and 136 of these were convicted offenders.") Statistics March 2018: Forced returns from Norway The National Police Immigration Service (NPIS) forcibly returned 375 persons in March 2018, and 136 of these were convicted offenders. The NPIS is responsible
Statistics March 2018: Forced returns from Norway The National Police Immigration Service (NPIS) forcibly returned 375 persons in March 2018, and 136 of these were convicted offenders. The NPIS is responsible
BULGARIAN TRADE WITH EU IN JANUARY 2017 (PRELIMINARY DATA)
") BULGARIAN TRADE WITH EU IN JANUARY 2017 (PRELIMINARY DATA) In January 2017 Bulgarian exports to the EU increased by 7.2% month of 2016 and amounted to 2 426.0 Million BGN (Annex, Table 1 and 2). Main trade
BULGARIAN TRADE WITH EU IN JANUARY 2017 (PRELIMINARY DATA) In January 2017 Bulgarian exports to the EU increased by 7.2% month of 2016 and amounted to 2 426.0 Million BGN (Annex, Table 1 and 2). Main trade
BULGARIAN TRADE WITH EU IN THE PERIOD JANUARY - MARCH 2016 (PRELIMINARY DATA)
") BULGARIAN TRADE WITH EU IN THE PERIOD JANUARY - MARCH 2016 (PRELIMINARY DATA) In the period January - March 2016 Bulgarian exports to the EU grew by 2.6% in comparison with the same 2015 and amounted to
BULGARIAN TRADE WITH EU IN THE PERIOD JANUARY - MARCH 2016 (PRELIMINARY DATA) In the period January - March 2016 Bulgarian exports to the EU grew by 2.6% in comparison with the same 2015 and amounted to
Asylum decisions in the EU28 EU Member States granted protection to asylum seekers in 2013 Syrians main beneficiaries
 STAT/14/98 19 June 2014 Asylum decisions in the EU28 EU Member States granted to 135 700 asylum seekers in 2013 Syrians main beneficiaries The EU28 Member States granted to 135 700 asylum seekers in 2013,
Quarterly Asylum Report
 European Asylum Support Office EASO Quarterly Asylum Report Quarter 4, 2013 SUPPORT IS OUR MISSION EASO QUARTERLY REPORT Q4 2013 2 Contents Summary... 4 Numbers of asylum applicants in EU+... 5 Main countries
HUMAN RESOURCES IN R&D
 HUMAN RESOURCES IN R&D This fact sheet presents the latest UIS S&T data available as of July 2011. Regional density of researchers and their field of employment UIS Fact Sheet, August 2011, No. 13 In the
Cambridge International Examinations Cambridge International Advanced Subsidiary and Advanced Level
 Cambridge International Examinations Cambridge International Advanced Subsidiary and Advanced Level *4898249870-I* GEOGRAPHY 9696/31 Paper 3 Advanced Human Options October/November 2015 INSERT 1 hour 30
Asylum decisions in the EU EU Member States granted protection to more than asylum seekers in 2014 Syrians remain the main beneficiaries
 82/2015-12 May 2015 Asylum decisions in the EU EU Member States granted to more than 185 000 asylum seekers in 2014 Syrians remain the main beneficiaries The 27 EU Member States 1 for which data are available
Asylum Trends. Appendix: Eurostat data
 Asylum Trends Appendix: Eurostat data Contents Colophon 2 First asylum applications in Europe (EU, Norway and Switzerland) Monthly asylum applications in the EU, Norway and Switzerland 3 First asylum applications
Asylum Trends. Appendix: Eurostat data
 Asylum Trends Appendix: Eurostat data Contents Colophon 2 First asylum applications in Europe (EU, Norway and Switzerland) Monthly asylum applications in the EU, Norway and Switzerland 3 First asylum applications
Asylum Trends. Appendix: Eurostat data
 Asylum Trends Appendix: Eurostat data Contents Colophon 2 First asylum applications in Europe (EU, Norway and Switzerland) Monthly asylum applications in the EU, Norway and Switzerland 3 First asylum applications
Asylum Trends. Appendix: Eurostat data
 Asylum Trends Appendix: Eurostat data Contents Colophon 2 First asylum applications in Europe (EU, Norway and Switzerland) Monthly asylum applications in the EU, Norway and Switzerland 3 First asylum applications
UNHCR Statistical Yearbook 2012
 A refugee from Iraq at the emergency transit centre in Timisoara, Romania. Through an agreement established with UNHCR in 2009, Romania provides a temporary haven for refugees in urgent need of evacuation
The National Police Immigration Service (NPIS) forcibly returned 429 persons in January 2018, and 137 of these were convicted offenders.
 forcibly returned 429 persons in January 2018, and 137 of these were convicted offenders.") Monthly statistics January 2018: Forced returns from Norway The National Police Immigration Service (NPIS) forcibly returned 429 persons in January 2018, and 137 of these were convicted offenders. The
Monthly statistics January 2018: Forced returns from Norway The National Police Immigration Service (NPIS) forcibly returned 429 persons in January 2018, and 137 of these were convicted offenders. The
A GLOBAL PERSPECTIVE ON RESEARCH AND DEVELOPMENT
 UNESCO Institute for Statistics A GLOBAL PERSPECTIVE ON RESEARCH AND DEVELOPMENT The UNESCO Institute for Statistics (UIS) works with governments and diverse organizations to provide global statistics
Inform on migrants movements through the Mediterranean
 D Inform on migrants movements through the Mediterranean 1. KEY POINTS TO NOTE THIS EMN INFORM SUMMARISES THE MAIN FINDINGS OF THE EMN POLICY BRIEF STUDY ON MIGRANTS MOVEMENTS THROUGH THE MEDITERRANEAN.
Mustafa, a refugee from Afghanistan, living in Hungary since 2009 has now been reunited with his family EUROPE
 Mustafa, a refugee from Afghanistan, living in Hungary since 2009 has now been reunited with his family EUROPE 164 UNHCR Global Report 2013 OPERATIONAL HIGHLIGHTS UNHCR made progress in its efforts to
MIGRATION IN SPAIN. "Facebook or face to face? A multicultural exploration of the positive and negative impacts of
 "Facebook or face to face? A multicultural exploration of the positive and negative impacts of Science and technology on 21st century society". MIGRATION IN SPAIN María Maldonado Ortega Yunkai Lin Gerardo
Migration Challenge or Opportunity? - Introduction. 15th Munich Economic Summit
 Migration Challenge or Opportunity? - Introduction 15th Munich Economic Summit Clemens Fuest 30 June 2016 What do you think are the two most important issues facing the EU at the moment? 40 35 2014 2015
Quarterly Asylum Report
 European Asylum Support Office EASO Quarterly Asylum Report Quarter 1, 2014 SUPPORT IS OUR MISSION EASO QUARTERLY REPORT Q1 2014 2 Contents Summary... 4 Asylum applicants in the EU+... 5 Main countries
Contracting Parties to the Ramsar Convention
 Contracting Parties to the Ramsar Convention 14/12/2016 Number of Contracting Parties: 169 Country Entry into force Notes Albania 29.02.1996 Algeria 04.03.1984 Andorra 23.11.2012 Antigua and Barbuda 02.10.2005
2nd Ministerial Conference of the Prague Process Action Plan
 English version 2nd Ministerial Conference of the Prague Process Action Plan 2012-2016 Introduction We, the Ministers responsible for migration and migration-related matters from Albania, Armenia, Austria,
2014 BELGIAN FOREIGN TRADE
 2014 BELGIAN FOREIGN TRADE 2 3 01 \\ EXPORTS 6 1.1 Geographical developments 1.2 Sectoral developments 02 \\ IMPORTS 14 2.1 Geographical developments 2.2 Sectoral developments 03 \\ GEOGRAPHICAL TRADE
Trademarks FIGURE 8 FIGURE 9. Highlights. Figure 8 Trademark applications worldwide. Figure 9 Trademark application class counts worldwide
 Trademarks Highlights Applications grew by 16.4% in 2016 An estimated 7 million trademark applications were filed worldwide in 2016, 16.4% more than in 2015 (figure 8). This marks the seventh consecutive
EASO EU+ asylum trends 2018 overview
 EASO EU+ asylum trends 2018 overview Support is our Mission 2 EU+ ASYLUM TRENDS - 2018 OVERVIEW EASO EU+ asylum trends 2018 overview EU+ ASYLUM TRENDS - 2018 OVERVIEW 3 Source: EASO EPS, December 2016
European patent filings
 Annual Report 07 - European patent filings European patent filings Total filings This graph shows the geographic origin of the European patent filings. This is determined by the country of residence of
Asylum Trends. Appendix: Eurostat data
 Asylum Trends Appendix: Eurostat data Contents Colophon 2 First asylum applications in Europe (, Norway and Switzerland) Monthly asylum applications in the, Norway and Switzerland 3 First asylum applications
Asylum Trends. Appendix: Eurostat data
 Asylum Trends Appendix: Eurostat data Contents Colophon 2 First asylum applications in Europe (, Norway and Switzerland) Monthly asylum applications in the, Norway and Switzerland 3 First asylum applications
The Madrid System. Overview and Trends. Mexico March 23-24, David Muls Senior Director Madrid Registry
 The Madrid System Overview and Trends David Muls Senior Director Madrid Registry Mexico March 23-24, 2015 What is the Madrid System? A centralized filing and management procedure A one-stop shop for trademark
THE EUROPEAN COURT OF HUMAN RIGHTS IN FACTS & FIGURES
 THE EUROPEAN COURT OF HUMAN RIGHTS IN FACTS & FIGURES 2017 This document has been prepared by the Public Relations Unit of the Court, and does not bind the Court. It is intended to provide basic general
EuCham Charts. October Youth unemployment rates in Europe. Rank Country Unemployment rate (%)
") EuCham Charts October 2015 Youth unemployment rates in Europe Rank Country Unemployment rate (%) 1 Netherlands 5.0 2 Norway 5.5 3 Denmark 5.8 3 Iceland 5.8 4 Luxembourg 6.3... 34 Moldova 30.9 Youth unemployment
EuCham Charts October 2015 Youth unemployment rates in Europe Rank Country Unemployment rate (%) 1 Netherlands 5.0 2 Norway 5.5 3 Denmark 5.8 3 Iceland 5.8 4 Luxembourg 6.3... 34 Moldova 30.9 Youth unemployment
Europe. Eastern Europe South-Eastern Europe Central Europe and the Baltic States Western Europe
 Europe Eastern Europe South-Eastern Europe Central Europe and the Baltic States Western Europe Europe Operational highlights Based on its Ten-Point Plan of Action, in October UNHCR issued an overview of
TRIPS OF BULGARIAN RESIDENTS ABROAD AND ARRIVALS OF VISITORS FROM ABROAD TO BULGARIA IN SEPTEMBER 2015
 TRIPS OF BULGARIAN RESIDENTS ABROAD AND ARRIVALS OF VISITORS FROM ABROAD TO BULGARIA IN SEPTEMBER 2015 In September 2015, the number of the trips of Bulgarian residents abroad was 450.9 thousand (Annex,
Asylum Trends. Appendix: Eurostat data
 Asylum Trends Appendix: Eurostat data Contents Colophon 2 First asylum applications in Europe (, Norway and Switzerland) Monthly asylum applications in the, Norway and Switzerland 3 First asylum applications
Acquisition of citizenship in the European Union
 Population and social conditions Authors: Katya VASILEVA, Fabio SARTORI Statistics in focus 108/2008 Acquisition of citizenship in the European Union The act of acquisition of citizenship is often viewed
BULGARIAN TRADE WITH EU IN THE PERIOD JANUARY - FEBRUARY 2017 (PRELIMINARY DATA)
") BULGARIAN TRADE WITH EU IN THE PERIOD JANUARY - FEBRUARY 2017 (PRELIMINARY DATA) In the period January - February 2017 Bulgarian exports to the EU increased by 9.0% to the same 2016 and amounted to 4 957.2
BULGARIAN TRADE WITH EU IN THE PERIOD JANUARY - FEBRUARY 2017 (PRELIMINARY DATA) In the period January - February 2017 Bulgarian exports to the EU increased by 9.0% to the same 2016 and amounted to 4 957.2
EMN Policy brief on migrant s movements through the Mediterranean
 EMN Policy brief on migrant s movements through the Mediterranean Full report accompanying the Inform on migrant s movements through the Mediterranean 23 December 2015 EXECUTIVE SUMMARY When this analysis
TRIPS OF BULGARIAN RESIDENTS ABROAD AND ARRIVALS OF VISITORS FROM ABROAD TO BULGARIA IN MARCH 2016
 TRIPS OF BULGARIAN RESIDENTS ABROAD AND ARRIVALS OF VISITORS FROM ABROAD TO BULGARIA IN MARCH 2016 In March 2016, the number of the trips of Bulgarian residents abroad was 354.7 thousand (Annex, Table
TRIPS OF BULGARIAN RESIDENTS ABROAD AND ARRIVALS OF VISITORS FROM ABROAD TO BULGARIA IN AUGUST 2016
 TRIPS OF BULGARIAN RESIDENTS ABROAD AND ARRIVALS OF VISITORS FROM ABROAD TO BULGARIA IN AUGUST 2016 In August 2016, the number of the trips of Bulgarian residents abroad was 590.6 thousand (Annex, Table
TRIPS OF BULGARIAN RESIDENTS ABROAD AND ARRIVALS OF VISITORS FROM ABROAD TO BULGARIA IN AUGUST 2015
 TRIPS OF BULGARIAN RESIDENTS ABROAD AND ARRIVALS OF VISITORS FROM ABROAD TO BULGARIA IN AUGUST 2015 In August 2015, the number of the trips of Bulgarian residents abroad was 512.0 thousand (Annex, Table
TRIPS OF BULGARIAN RESIDENTS ABROAD AND ARRIVALS OF VISITORS FROM ABROAD TO BULGARIA IN FEBRUARY 2017
 TRIPS OF BULGARIAN RESIDENTS ABROAD AND ARRIVALS OF VISITORS FROM ABROAD TO BULGARIA IN FEBRUARY 2017 In February 2017, the number of the trips of Bulgarian residents abroad was 366.8 thousand (Annex,
TRIPS OF BULGARIAN RESIDENTS ABROAD AND ARRIVALS OF VISITORS FROM ABROAD TO BULGARIA IN MAY 2017
 TRIPS OF BULGARIAN RESIDENTS ABROAD AND ARRIVALS OF VISITORS FROM ABROAD TO BULGARIA IN MAY 2017 In May 2017, the number of the trips of Bulgarian residents abroad was 653.3 thousand (Annex, Table 1) or
Shaping the Future of Transport
 Shaping the Future of Transport Welcome to the International Transport Forum Over 50 Ministers Shaping the transport policy agenda The International Transport Forum is a strategic think tank for the transport
Details of the largest operations in the region and its subregions in 2014 are presented on the Global Focus website at
 This chapter provides a summary of the general environment in which UNHCR operated in Europe in 2014. It presents the main challenges and constraints that affected the organization s operational response,
BULGARIAN TRADE WITH EU IN THE PERIOD JANUARY - JUNE 2014 (PRELIMINARY DATA)
") BULGARIAN TRADE WITH EU IN THE PERIOD JANUARY - JUNE 2014 (PRELIMINARY DATA) In the period January - June 2014 Bulgarian exports to the EU increased by 2.8% to the corresponding the year and amounted to
BULGARIAN TRADE WITH EU IN THE PERIOD JANUARY - JUNE 2014 (PRELIMINARY DATA) In the period January - June 2014 Bulgarian exports to the EU increased by 2.8% to the corresponding the year and amounted to
PROTOCOL RELATING TO AN AMENDMENT TO THE CONVENTION ON INTERNATIONAL CIVIL AVIATION ARTICLE 45, SIGNED AT MONTREAL ON 14 JUNE parties.
 PROTOCOL RELATING TO AN AMENDMENT TO THE CONVENTION ON INTERNATIONAL CIVIL AVIATION ARTICLE 45, SIGNED AT MONTREAL ON 14 JUNE 1954 State Entry into force: The Protocol entered into force on 16 May 1958.
Countries for which a visa is required to enter Colombia
 Albania EASTERN EUROPE Angola SOUTH AFRICA Argelia (***) Argentina SOUTH AMERICA Australia OCEANIA Austria Azerbaijan(**) EURASIA Bahrain MIDDLE EAST Bangladesh SOUTH ASIA Barbados CARIBBEAN AMERICA Belgium
TRIPS OF BULGARIAN RESIDENTS ABROAD AND ARRIVALS OF VISITORS FROM ABROAD TO BULGARIA IN DECEMBER 2016
 TRIPS OF BULGARIAN RESIDENTS ABROAD AND ARRIVALS OF VISITORS FROM ABROAD TO BULGARIA IN DECEMBER 2016 In December 2016, the number of the trips of Bulgarian residents abroad was 397.3 thousand (Annex,
UNHCR, United Nations High Commissioner for Refugees
 States Parties to the 1951 Convention relating to the Status of Refugees and the 1967 Protocol Date of entry into force: 22 April 1954 (Convention) 4 October 1967 (Protocol) As of 1 February 2004 Total
Gender pay gap in public services: an initial report
 Introduction This report 1 examines the gender pay gap, the difference between what men and women earn, in public services. Drawing on figures from both Eurostat, the statistical office of the European
Index for the comparison of the efficiency of 42 European judicial systems, with data taken from the World Bank and Cepej reports.
 FB Index 2012 Index for the comparison of the efficiency of 42 European judicial systems, with data taken from the World Bank and Cepej reports. Introduction The points of reference internationally recognized
Population levels and trends
 unhcr Statistical Yearbook 2008 23 Chapter 2 Population levels and trends Introduction This chapter reviews and analyses the trends and changes in 2008 in the global populations for which UNHCR has a responsibility.
Mapping physical therapy research
 Mapping physical therapy research Supplement Johan Larsson Skåne University Hospital, Revingevägen 2, 247 31 Södra Sandby, Sweden January 26, 2017 Contents 1 Additional maps of Europe, North and South
Human Resources in R&D
 NORTH AMERICA AND WESTERN EUROPE EAST ASIA AND THE PACIFIC CENTRAL AND EASTERN EUROPE SOUTH AND WEST ASIA LATIN AMERICA AND THE CARIBBEAN ARAB STATES SUB-SAHARAN AFRICA CENTRAL ASIA 1.8% 1.9% 1. 1. 0.6%
GLOBAL RISKS OF CONCERN TO BUSINESS WEF EXECUTIVE OPINION SURVEY RESULTS SEPTEMBER 2017
 GLOBAL RISKS OF CONCERN TO BUSINESS WEF EXECUTIVE OPINION SURVEY RESULTS SEPTEMBER 2017 GLOBAL RISKS OF CONCERN TO BUSINESS Results from the World Economic Forum Executive Opinion Survey 2017 Survey and
Collective Intelligence Daudi Were, Project
 Collective Intelligence Daudi Were, Project Director, @mentalacrobatic Kenya GDP 2002-2007 Kenya General Election Day 2007 underreported unreported Elections UZABE - Nigerian General Election - 2015
8193/11 GL/mkl 1 DG C I
 COUNCIL OF THE EUROPEAN UNION Brussels, 25 March 2011 8193/11 AVIATION 70 INFORMATION NOTE From: European Commission To: Council Subject: State of play of ratification by Member States of the aviation
World Refugee Survey, 2001
 World Refugee Survey, 2001 Refugees in Africa: 3,346,000 "Host" Country Home Country of Refugees Number ALGERIA Western Sahara, Palestinians 85,000 ANGOLA Congo-Kinshasa 12,000 BENIN Togo, Other 4,000
REPORT OF THE FOURTH SPECIAL SESSION OF THE CONFERENCE OF THE STATES PARTIES
 OPCW Conference of the States Parties Fourth Special Session C-SS-4/3 26 and 27 June 2018 27 June 2018 Original: ENGLISH REPORT OF THE FOURTH SPECIAL SESSION OF THE CONFERENCE OF THE STATES PARTIES 1.
Contributions to UNHCR For Budget Year 2014 As at 31 December 2014
 1 UNITED STATES OF AMERICA 1,280,827,870 2 EUROPEAN UNION 271,511,802 3 UNITED KINGDOM 4 JAPAN 5 GERMANY 6 SWEDEN 7 KUWAIT 8 SAUDI ARABIA *** 203,507,919 181,612,466 139,497,612 134,235,153 104,356,762
Italy Luxembourg Morocco Netherlands Norway Poland Portugal Romania
 1. Label the following countries on the map: Albania Algeria Austria Belgium Bulgaria Czechoslovakia Denmark East Germany Finland France Great Britain Greece Hungary Iceland Ireland Italy Luxembourg Morocco
Europe. Eastern Europe South-Eastern Europe Central Europe and the Baltic States Western Europe. Restricted voluntary contributions (USD)
") Eastern South-Eastern Central and the Baltic States Western Restricted voluntary contributions (USD) Earmarking Donor Annual budget overall United States 100,000 Sub-total 100,000 Total 100,000 Operational
Eastern South-Eastern Central and the Baltic States Western Restricted voluntary contributions (USD) Earmarking Donor Annual budget overall United States 100,000 Sub-total 100,000 Total 100,000 Operational
0% 10% 20% 30% 40% 50% 10% 60% 20% 70% 30% 80% 40% 90% 100% 50% 60% 70% 80%
 0% 10% 20% 30% 40% 50% 10% 0% 60% 20% 30% 70% 80% 40% 100% 90% 50% 60% 70% 80% 90% 100% Note: See table II.2 and II.3 for numbers. * Refers to Palestinian refugees under the UNHCR mandate. Table of Contents
Proposed Indicative Scale of Contributions for 2016 and 2017
 October 2015 E Item 16 of the Provisional Agenda SIXTH SESSION OF THE GOVERNING BODY Rome, Italy, 5 9 October 2015 Proposed Indicative Scale of Contributions for 2016 and 2017 Note by the Secretary 1.
Figure 2: Range of scores, Global Gender Gap Index and subindexes, 2016
 Figure 2: Range of s, Global Gender Gap Index and es, 2016 Global Gender Gap Index Yemen Pakistan India United States Rwanda Iceland Economic Opportunity and Participation Saudi Arabia India Mexico United
Country pairings for the second cycle of the Mechanism for the Review of Implementation of the United Nations Convention against Corruption
 Country pairings for the second cycle of the Mechanism for the Review of Implementation of the United Nations Convention against Corruption In year 1, a total of 29 reviews will be conducted: Regional
GDP per capita in purchasing power standards
 GDP per capita in purchasing power standards GDP per capita varied by one to six across the Member States in 2011, while Actual Individual Consumption (AIC) per capita in the Member States ranged from
Refugees and migrant workers in Benghazi port, Libya waiting in line for their passport to be checked by an international organization before
 Refugees and migrant workers in Benghazi port, Libya waiting in line for their passport to be checked by an international organization before boarding a boat to Alexandria, Egypt. Hundreds of thousands
1994 No DESIGNS
 1994 No. 3219 DESIGNS The Designs (Convention Countries) Order 1994 Made 14th December 1994 Coming into force 13th January 1995 At the Court at Buckingham Palace, the 14th day of December 1994 Present,
UNIDEM CAMPUS FOR THE SOUTHERN MEDITERRANEAN COUNTRIES
 UNIDEM CAMPUS FOR THE SOUTHERN MEDITERRANEAN COUNTRIES Venice Commission of Council of Europe STRENGTHENING THE LEGAL CAPACITIES OF THE CIVIL SERVICE IN THE SOUTHERN MEDITERRANEAN COUNTRIES Administrations
SCALE OF ASSESSMENT OF MEMBERS' CONTRIBUTIONS FOR 1994
 International Atomic Energy Agency GENERAL CONFERENCE Thirtyseventh regular session Item 13 of the provisional agenda [GC(XXXVII)/1052] GC(XXXVII)/1070 13 August 1993 GENERAL Distr. Original: ENGLISH SCALE
INTERNATIONAL AIR SERVICES TRANSIT AGREEMENT SIGNED AT CHICAGO ON 7 DECEMBER 1944
 INTERNATIONAL AIR SERVICES TRANSIT AGREEMENT SIGNED AT CHICAGO ON 7 DECEMBER 1944 State Entry into force: The Agreement entered into force on 30 January 1945. Status: 131 Parties. This list is based on
Management Systems: Paulo Sampaio - University of Minho. Pedro Saraiva - University of Coimbra PORTUGAL
 Management Systems: A Path to Organizational Sustainability Paulo Sampaio - University of Minho paulosampaio@dps.uminho.ptuminho pt Pedro Saraiva - University of Coimbra pas@eq.uc.pt PORTUGAL Session learning
2016 Europe Travel Trends Report
 2016 Europe Travel Trends Report One-third of worldwide travellers report1 they ll spend more on travel in 2016 than the year previous. Of those big spenders, Europeans dominate the list, with Switzerland,
2018 Social Progress Index
 2018 Social Progress Index The Social Progress Index Framework asks universally important questions 2 2018 Social Progress Index Framework 3 Our best index yet The Social Progress Index is an aggregate
Europe. Eastern Europe South-Eastern Europe Central Europe and the Baltic States Western Europe
 Eastern Europe South-Eastern Europe Central Europe and the Baltic States Western Europe Working environment UNHCR s operations in Europe, covering 48 countries, respond to a wide variety of challenges