Summer School Europe Inside Out
|
|
|
- Avice Arnold
- 5 years ago
- Views:
Transcription
1 Summer School Europe Inside Out EU External Trade Policy in Times of Regional Trade Agreements Prof. Dr. Jan Van Hove KU Leuven and INFER 1
2 Structure Europe s Recent Trade Performance in a Global Perspective EU External Trade Policy as motor behind globalization Implications for the Future 2
3 EU External Trade Policy in Times of Regional Trade Agreements EUROPE S RECENT TRADE PERFORMANCE IN A GLOBAL PERSPECTIVE 3
4 Evolution in world exports, production and GDP, (level 1950=100) Exports Production GDP
5 Evolutions in World Trade Trade is an important phenomenon and a crucial reflection of globalization World trade boosted, in particular in recent decades thanks to many driving forces Policy = liberalisation of world trade Transportation: reduced costs, new technologies (including e.g. ICT) Entrepreneurship New players (e.g., emerging countries, multinationals ) New products, innovation etc. The global financial crisis of caused a major disruption in global trade. 5
6 Total World Exports (billion USD), (source: WTO (2013))

7 15.0 Annual growth in World Exports and World GDP (source: WTO, 2014) Exports GDP
8 Crisis and Global Trade Historical disruption due to the global crisis : sharp decline in world trade BUT: equally surprisingly fast recovery! Causes of the crisis (cfr. literature): Changes in world demand Reductions in capital expenditures Restrictions in trade finance Vertical specialisation and internationalisation of production 8
9 Crisis and Global Trade Given the spectacular recovery, should we decide that world trade is again what it used to be? Well actually it is not! 9
10 The Crisis and Exports by Region Level in 2005Q1=100 Source: WTO (2012) 10

11 Regions shares in global exports (source: WTO, 2014) North America South and Central America Europe CIS Africa Middle East Asia 11
12 The Crisis and Imports by Region Level in 2005Q1=100 Source: WTO (2012) 12
13 Watching Europe (1) Share of each region in total world exports Q1 2005Q2 2005Q3 2005Q4 2006Q1 2006Q2 2006Q3 2006Q4 2007Q1 2007Q2 2007Q3 2007Q4 2008Q1 2008Q2 2008Q3 2008Q4 2009Q1 2009Q2 2009Q3 2009Q4 2010Q1 2010Q2 2010Q3 2010Q4 2011Q1 2011Q2 2011Q3 North America South and Central America Europe CIS Asia Other countries Declining position of Europe versus Fast rise of emerging economies, in particular Asia 13
14 Watching Europe (2) Evolution in total EU trade + evolution in intra-eu27 and extra- EU27 trade Q1 2005Q2 2005Q3 2005Q4 2006Q1 2006Q2 2006Q3 2006Q4 2007Q1 2007Q2 2007Q3 2007Q4 2008Q1 2008Q2 2008Q3 2008Q4 2009Q1 2009Q2 2009Q3 2009Q4 2010Q1 2010Q2 2010Q3 2010Q4 2011Q1 2011Q2 2011Q3 Total EU27 export Intra-EU27 export Extra-EU27 export 1. Intra-EU trade is very important for EU! 2. Similar crisis-effect on intra-eu and extra-eu trade, although extra- EU trade shows better recovery! 14
15 Watching Europe (3) Evolution in the percentage of intra- EU27 and extra EU27 exports in total EU27 exports Intra-EU27 export Extra-EU27 export Q1 2005Q2 2005Q3 2005Q4 2006Q1 2006Q2 2006Q3 2006Q4 2007Q1 2007Q2 2007Q3 2007Q4 2008Q1 2008Q2 2008Q3 2008Q4 2009Q1 2009Q2 2009Q3 2009Q4 2010Q1 2010Q2 2010Q3 2010Q4 2011Q1 2011Q2 2011Q3 Gradual, but clear tendency that extra- EU exports become more important 15
16 Watching Europe (4) Evolution in percentage of intra-eu27 and extra-eu27 imports in total EU27 imports Intra-EU27 import Extra-EU27 import Q1 2005Q2 2005Q3 2005Q4 2006Q1 2006Q2 2006Q3 2006Q4 2007Q1 2007Q2 2007Q3 2007Q4 2008Q1 2008Q2 2008Q3 2008Q4 2009Q1 2009Q2 2009Q3 2009Q4 2010Q1 2010Q2 2010Q3 2010Q4 2011Q1 2011Q2 2011Q3 Analogous to exports: gradual, but clear tendency that extra-eu imports become more important 16
17 Europe in Global Trade World trade used to be dominated by western countries, but gradually emerging markets are taking over. The global crisis seems to reshape global trade pattern: winners and losers! The crisis strengthens, rather than causes, this pattern. In particular, the share of Europe in world trade is declining, making the non-eu markets increasingly crucial for EU exporters and importers. Nevertheless, for now, the EU internal market remains the main market for EU traders. and EU remains a very important trader in the world economy! 17
18 Global trade network (2012, billion USD, source: WTO, 2014) Origin Destination World North America South and Central America Europe CIS Africa Middle East World North America South and Central America Europe CIS Africa Middle East Asia Asia 18
19 TOP 10 Exporters of the World (2012, % in total world export, source: WTO (2014))
) 14.0 12.0 10.0 8.0 6.0 4.0 2.")
20 TOP 10 Importers of the World (2012, % in total world imports, source: WTO (2014))
 China United States 20.0 15.0 10.0 EXPORT 5.0 0.0 United States Extra-EU (27) China 21")
21 TOP 3 Exporters en Importers (EU as a whole, only extra-eu, 2012, source: WTO, 2014)) IMPORT Extra-EU (27) China United States EXPORT United States Extra-EU (27) China 21
22 Geographical Orientation of EU Trade What are the main EU trading partners? (outside EU) 22

23 20 TOP-15 EU Export Partners (2014, % of total EU exports, Eurostat (2015)) Transatlantic exports remain dominant! Neighbouring countries are important trading partners. 8 6 Emerging economies become important destination markets

24 18 TOP-15 EU Import Partners 16 (2014, % of total EU imports, Eurostat (2015)) Emerging markets become really main import partners. US and neighbours are much less important. Imports strongly driven by energy
25 Trade Balance Is the EU trade balance in equilibrium? And did the crisis affect the EU trade balance? 25
26 Evolution in EU28 Trade Balance (billions euro, Eurostat (2015)) Total EU Trade Balance (Goods & Services) Total EU Trade Balance (Goods) Total EU Trade Balance (Services) 26
27 EU Trade Balance: Main Findings EU trade balance shows a clear deficit, but recently recovery. Deficit was reduced during and after the global crisis. Deficit is caused by trade in goods and compensated by trade in services. Mainly driven by energy imports (and global energy prices) No problematic deficit! 27

28 Trade Balance EU27 Member States (mio euro, Eurostat (2012)) United Kingdom Spain Greece Poland Austria Cyprus Bulgaria Latvia Estonia Slovakia Czech Republic Belgium Ireland Germany
29 Evolution in Current Account Balance (% of GDP, source IMF) Total EU trade balance is only slightly negative. Hence trade deficit with some Asian countries, in particular with China, can easily be absorbed (<-> USA!). Note: within Asia, especially India has a substantial trade deficit. Hence: crisis contributed to a restoration of global trade balances EU27 USA China India Japan South Korea 29
30 Sectoral Specialization What are the main sectors of EU exports and imports? Any crisis effect? 30

31 Composition of EU Trade in Goods (2012, mio euro source: Eurostat, 2014) Lack of endowments (raw materials and energy) cause a trade deficit in the corresponding sectors almost completely compensated by trade surpluses in other sectors. Jan Van Hove (2014) - The European Business Context Exports Imports Balance 31
32 Main Sectors Industrial exports and imports remain very important Energy imports are very substantial. Same import as export sectors are important Hence: substantial degree of intra-industry trade and hence (horizontal and vertical) diversification in traded goods. Hence: substantial and increasing degree of competition in many sectors and products 32
33 Sectoral EU Export Performance Concept of revealed comparative advantage (RCA) Values larger than 1 indicate an advantage Values smaller than 1 indicate a disadvantage Focus on the period to look for crisis effects (European Competitiveness Report) EU performance relative to the world 33
34 EU RCAs (source: European Competitiveness Report, 2012) Manufacture of food products Manufacture of beverages Manufacture of tobacco products Manufacture of textiles Manufacture of wearing apparel Manufacture of leather and related products Manufacture of wood and of products of wood and cork, except furni-ture; manufacture of articles of straw and plaiting materials Manufacture of paper and paper products Printing and reproduction of recorded media Manufacture of coke and refined petroleum products
35 EU RCAs (source: European Competitiveness Report, 2012) Manufacture of chemicals and chemical products Manufacture of basic pharmaceutical products and pharmaceutical preparations Manufacture of rubber and plastic products Manufacture of other non-metallic mineral products Manufacture of basic metals Manufacture of fabricated metal products, except machinery and equipment Manufacture of computer, electronic and optical products Manufacture of electrical equipment Manufacture of machinery and equipment n.e.c Manufacture of motor vehicles, trailers and semitrailers Manufacture of other transport equipment Manufacture of furniture Other manufacturing
36 EU Export Performance by Sector Clearly the EU has a comparative advantage in: Paper and printing/ reproduction industries Food-beverage-tobacco (cfr. cultural goods ) Wood industry Chemicals and in particular pharmaceuticals Cars Some metal products Some machinery Crisis did not fundamentally alter the EU s revealed comparative advantages only some minor changes in 2009 (up and down)! 36
37 EU Export Performance by Sector Clearly the EU has a comparative disadvantage in: Textiles Leather Petroleum products Basic metals Basic machinery These patterns are in line with the theoretical predictions: EU has a comparative advantage in capital- and knowledge-intensive sectors. It has a comparative disadvantage in labour-intensive sectors. However: a lot of intra-industry trade! Hides differences across EU member states! 37
38 Growth in intra-eu exports, (year 2001=100, source: Eurostat, 2014) Belgium Bulgaria Czech Republic Denmark Germany Estonia Ireland Greece Spain France Italy Cyprus Latvia Lithuania Luxembourg Hungary Malta Netherlands Austria Poland Portugal Romania Slovenia Slovakia Finland Sweden United Kingdom 38
 0 50 100 150 200 250 300 350 400 450")
39 Slovakia Lithuania Latvia Bulgaria Poland Romania Czech Republic Cyprus Estonia Slovenia Hungary Netherlands Germany Sweden Austria Spain Greece Portugal Belgium Denmark Italy Luxembourg Malta France Finland United Kingdom Ireland Level of intra-eu exports in 2012 relative to 2001 (=100)
40 Growth in intra-eu exports, (year 2001=100, source: Eurostat, 2014) Selection of Countries Germany Ireland Greece Spain France Italy Portugal Romania United Kingdom
41 Growth in extra-eu exports, (year 2001=100, source: Eurostat, 2014) Belgium Bulgaria Czech Republic Denmark Germany Estonia Ireland Greece Spain France Italy Cyprus Latvia Lithuania Luxembourg Hungary Malta Netherlands Austria Poland Portugal Romania Slovenia Slovakia Finland Sweden United Kingdom 41
 0 100 200 300 400 500 600 700 800 900")
42 Latvia Slovakia Lithuania Estonia Czech Republic Poland Romania Bulgaria Hungary Greece Portugal Slovenia Netherlands Spain Cyprus Luxembourg Belgium Malta Germany Austria Denmark Italy Sweden United Kingdom France Finland Ireland Level of extra-eu exports in 2012 relative to 2001 (=100)
43 Growth in extra-eu exports, (year 2001=100, source: Eurostat, 2014) Selection of Countries Germany Ireland Greece Spain France Italy Portugal Romania United Kingdom 43
44 Comparing EU member states Similar pattern in intra-eu and extra-eu trade performance, extra- EU trade has increased more. Similar crisis effect on all EU member states. Substantial variation in trade performance of EU member states Most striking: Strong export performance in new EU member states, both intra-eu and extra-eu, in new EU member states: 1) catching-up process cfr. integration in the EU economy 2) but also strong export performance in European as well as global markets = renewed competitiveness! 3) Focus on EU market remains strong. 44
45 Comparing EU member states Diversity among crisis countries (PIGS, PIIGS) Ireland (export platform economy) shows weak export growth performance. Greece and Portugal do remarkably well. Spain does better than Italy. Some large economies, in particular France, UK, Italy do not perform very well in terms of export growth. Role of deindustrialisation and lack of competitiveness. Also Finland does not perform well cfr. general problems in the Finnish economy. Export performance strongly related to economic growth performance. 45
46 Relationship between Economic Growth and Export Growth Performances in EU27 Export Performance (growth between 2001 and 2012, level 2001 = 100) (2012 vs. 2001) Change in Convergence to EU Average (% Change in GDP per capita (PPS) level compared to EU28 average, 2012 versus 2001) 46
47 EU External Trade Policy in Times of Regional Trade Agreements EU EXTERNAL TRADE POLICY AS MOTOR BEHIND GLOBALIZATION 47
48 EU External Trade Policy Important steps in EU external trade policy: 1968: establishment of the European Customs Union Free trade among European Economic Community member states: formal barriers to trade disappear Common external trade policy, i.e. policy towards non-ecc countries 1986: European Single Act Establishment European Single Market (gradual) removal of technical barriers to trade: major accomplishment, but still an ongoing job! Liberalisation of services provision (and trade) 48
49 EU External Trade Policy Institutional responsibilities: European Commission European Commissioner for external trade (currently: Cecilia Malmström ) Directorate-General for Trade (DG Trade) Strong interaction with the member states (cfr. national interests) Increased role for European Parliament since the Treaty of Lisbon EU External Trade Policy in practice: Decisions about use of trade policy instruments But more importantly: international negotiations on (multilateral and bilateral) trade agreements: aiming at better market access for EU firms in non-eu markets! 49
50 Main Principles of EU Trade Policy EU = member of the World Trade Organisation (WTO) Forum to discuss multilateral trade liberalisation Based on principles of Most Favourite Nation Equal (national) Treatment European Commission responsible for EU trade policy (EU customs union since 1968) However: more recently, clear shift to regionalism Due to slow progress/ failure of the WTO negotiations in the latest Doha Development Round Due to worldwide popularity of regional trade agreements 50
51 Main Principles of EU Trade Policy Reflection of preferences by EU member states Balanced trade policy, a compromise Regional trade agreements (including the EU!!!) allowed by the WTO under art. 24 of the GATT Why? Building blocks for multilateral trade (vs. stumbling blocks ) EU external trade policy more offensive than defensive : more oriented towards promoting exports than towards limiting imports. Picture of Fortress Europe only holds for agriculture, and even then Key objective: MARKET ACCESS FOR EU FIRMS 51
52 Main Principles of EU Trade Policy Hence EU external trade policy NOT about protecting the EU economy ( protectionism except for agriculture and a few exceptions) MAINLY about improving market access for EU firms and products on global markets Reducing formal barriers to trade Reducing informal barriers to trade too! 52
53 Main Principles of EU Trade Policy Active use of trade defence instruments Anti-dumping, anti-subsidies and safeguards Makes trade policy relatively sophisticated Especially directed towards Asia (and mainly China!) Asian countries are becoming users of these instruments too! Some recent cases: E.g. solar panels, agglomerated stone with China E.g. glass fibres with India and Indonesia E.g. steel fasteners with China and Malaysia -> Main affected sectors: chemicals, textiles, iron and steel 53
54 How important are Tariffs in actual Trade Policy? Tariffs decreased worldwide = result of WTO! But: Still the main trade policy instrument (cfr. tariffication policy of the WTO) Fundamental instrument in many other trade policies too (e.g., trade defence) Still very relevant in some sectors, in particular agriculture Example: EU external trade policy 54
55 Summary EU Tariffs (source: WTO, 2014) Summary Total Ag Non-Ag WTO member since 1995 Simple average final bound Binding coverage: Total 100 Simple average MFN applied Non-Ag Trade weighted average Ag: Tariff quotas (in %) 11.3 Imports in billion US$ , ,040.8 Ag: Special safeguards (in % )
, in % 30.0 20.0 10.0 0.")
56 EU Tariffs by Sector (source: WTO, 2014) 40.0 Average Applied MFN Tariff (2012), in %

57 EU Max. applied MFN Tariffs by Sector (%, source: WTO, 2014)

58 Summary Tariffs EU faces on Exports (2012, %, source: WTO, 2014) Agricultural products Simple Average MFN Tariff Weighted Average MFN Tariff 1. United States Russian Federation Japan Switzerland China Non-Agricultural products Simple Average MFN Tariff Weighted Average MFN Tariff 1. United States China Switzerland Russian Federation Turkey
59 Most Recent EU Trade Policy: Trade Defence Defending EU firms against unfair practises by foreign firms/governments Within the WTO framework EU = active player, especially against emerging countries In terms of trade and welfare effects: very similar to tariffs 59
) 40 35 30 25 20 15 New Investigations Reviews 10 5 0 2009 2010 2011")
60 Number of New Investigations and Reviews regarding Anti- Dumping and Anti-Subsidy by EU Commission (EC (2013)) New Investigations Reviews
61 Argentina Belarus Bosnia and Herzegovina Brazil China India Indonesia Iran Kazakhstan Korea FYROM Malaysia Oman Pakistan Russia Saudi Arabia Taiwan Thailand Turkey Ukraine U.A.E USA TOTAL New Anti-dumping and Anti-Subsidy Investigations initiated by the EU by Country of Export (EC (2013)) 61
62 Main Principles of EU Trade Policy Strong focus on regional trade agreements Lack of progress in multilateral negotiations Easier to control than multilateral trade talks More flexible in terms of topics More strategic in terms of gradual liberalisation, exceptions etc. Strong focus on large and emerging economies: US and large emerging countries: agreements with South Korea, Singapore, Canada (CETA), negotiations with USA (TTIP), Japan, India, Malaysia, Thailand, Vietnam etc. = reflects the fact that main partners and emerging countries are a top priority for the EU = creates new trade opportunities for the future Similar RTA-trend in many other countries! 62
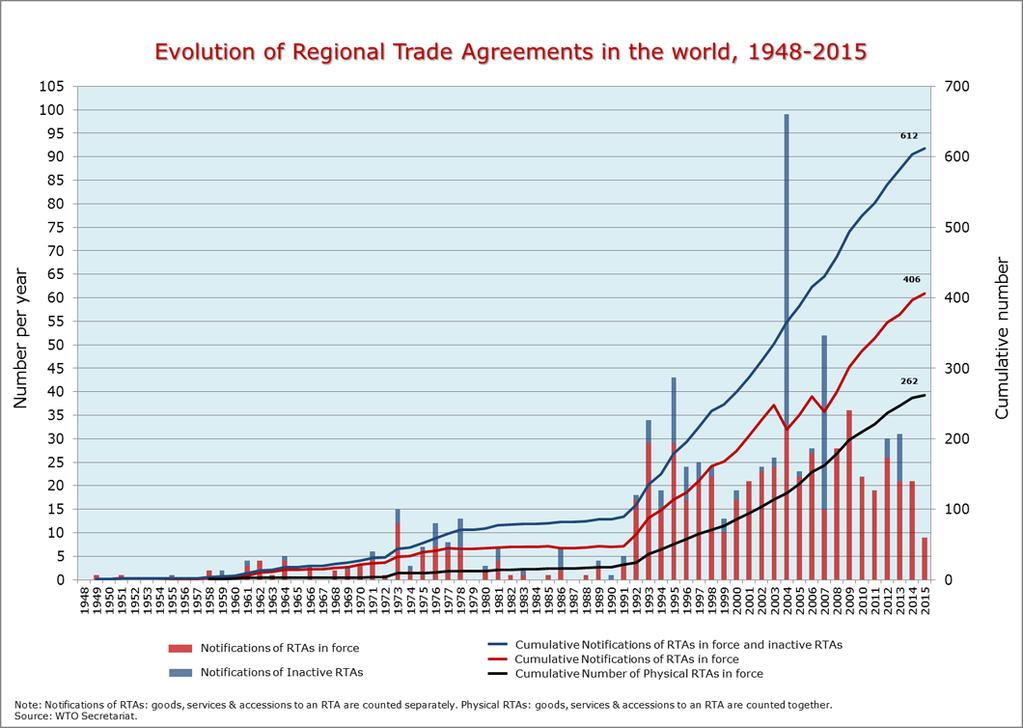
63 63
64 EU Regional Trade Agreements Strong trade creation effects are expected from Transatlantic Trade and Investment Partnership (TTIP) = a comprehensive agreement between the EU and the US on trade and investments More than just a trade agreement! Dealing with liberalisation of trade in services and, often related to that, regulatory barriers to trade will be challenging 64
65 EU Regional Trade Agreements Classical regional trade agreement (RTA) Focus on free trade, i.e. reducing formal barriers to trade, in particular tariffs Recent EU RTAs: increasingly focus on: Informal barriers to trade, e.g. Country of origin rules Fair competition for European business on foreign markets Trade-related issues, e.g. Intellectual property protection Environmental protection In two directions!!! -> so stimulates both exports and imports for the EU 65
66 Overview of EU RTAs (1) source: DG Trade (2016) Faroe Islands - 01 January 1997 Norway - 01 July 1973 Iceland - 01 April 1973 Switzerland - 01 January 1973 The former Yugoslav Republic of Macedonia - Stabilisation and Association Agreement, 01 May 2004 Croatia - Stabilisation and Association Agreement, 01 February 2005 Albania - Stabilisation and Association Agreement, 01 April 2009 Montenegro - Stabilisation and Association Agreement, 01 May 2010 Bosnia and Herzegovina - Interim Agreement on trade and trade related matters, 01 July 2008 Serbia - Interim Agreement on trade and trade related matters, 01 February 2010 Algeria - Association Agreement, 01 September 2005 Egypt - Association Agreement, 01 June 2004 Israel - Association Agreement, 01 June 2000 Jordan - Association Agreement, 01 May 2002 Lebanon - Interim Agreement, 01 March 2003 Morocco - Association Agreement, 01 March
67 Overview of EU RTAs (2) source: DG Trade (2016) Palestinian Authority - Association Agreement, 01 July 1997 Syria - Co-operation Agreement, 01 July 1977 Tunisia - Association Agreement, 01 March 1998 Chile - Association Agreement and Additional Protocol, 01 February 2003 (trade) / 01 March 2005 (full agreement) Mexico - Economic Partnership, Political Coordination and Cooperation Agreement, 01 July 2000 South Africa - Trade, Development and Co-operation Agreement, 01 January 2000 CARIFORUM States - Economic Partnership Agreement, Provisionally applied Ivory Coast - Interim Economic Partnership Agreement, Pending Cameroon - Interim Economic Partnership Agreement, Pending Korea - New Generation Free Trade Agreement, signed 06 October 2010 Papua New Guinea and Fiji Interim Partnership Agreement, May 2011 Iraq Partnership and Cooperation Agreement, signed on 11 May 2012 Central America - Association Agreement, signed 29 June 2012 Peru - Colombia - Free Trade Agreement, signed 26 July 2012 Canada- EU (2014) Customs Unions with Andorra (1991), Turkey (1995) and San Marino (1992) 67

")
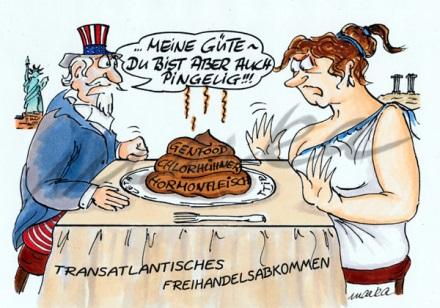
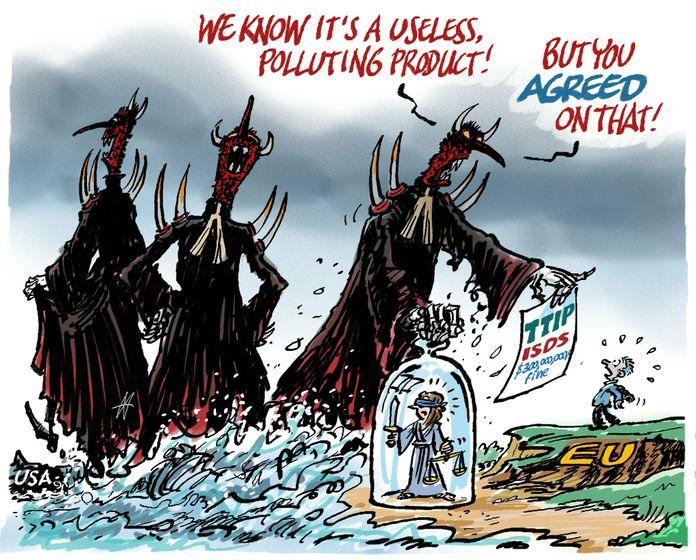
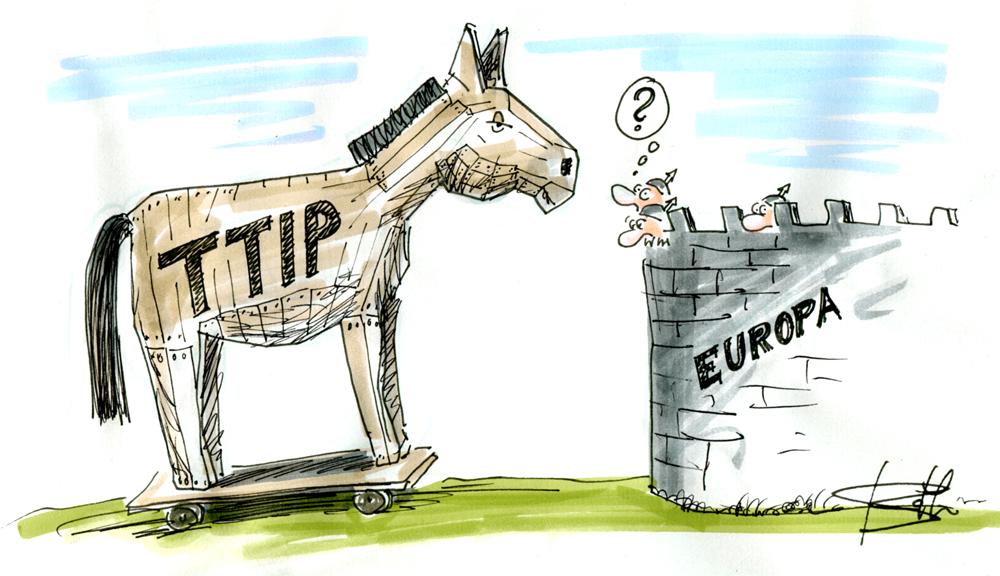
68 Debate on TTIP (and other Trade Agreements) 68

69 69

70 70
71 71

72 72

73 73
74 74
75 75
76 Bilateral Trade Agremeents: to be or not to be? ADVANTAGES Deep, fast and efficient way of trade liberalisation with a specific partner Potentially substantial trade creation effects Ad hoc approach and flexibility Dynamic effects (e.g., strong link with investments, innovation, ) DISADVANTAGES Strong trade diversion, hurting other trade partners (vs. multilateral trade liberalisation) -> discriminatory and inefficienty way of liberalisation Complex and non-transparent web of agreements -> longterm consequences? Potentially unequal effects on the import and export side -> ambiguous welfare effects 76
77 TTIP: why so sensitive? Familiarity with the partner New type of trade agreement -> future template in US-EU trade negotiations Touches upon long-standing issues (e.g., in food sector, different approaches in chemical and pharma sector) Strong competitors Both strong economies with global political power Some proposals are (too) far-reaching 77
78 TTIP: why yes? SOCIO-ECONOMIC ARGUMENTS Very important bilateral trade relation A relatively small liberalisation will have large absolute effects PLUS: liberalisation in other sectors, notably services = argument within the traditional approach of trade liberalisation Flexibility w.r.t. topics and timing Going beyond traditional trade liberalisation Gradual approah can soften consequences Positive welfare effects (?) 78
79 Impact Assessment of RTAs Many people interested in the impact of RTAs (policy makers, companies, trade unions, employees, customers, researchers, etc.) Hard to measure the impact of RTAs 2 Methodologies stand out: Ex ante analysis: based on simulation in a general equiilbrium model Ex post analysis: based on analysing differences in RTAtrade and non-rta-trade in a partial equilibrium model 79
80 TTIP: why yes? STRATEGIC ARGUMENTS Global context: Lack or progress in the World Trade Organisation Rise and performance of new players in the world economy Idea of global standards is attractive Global = US-EU standard in the TTIP thinking = argument within new trade liberalisation 80
81 Economics of Regulatory Differences Home Market Bias Regulatory Differences Adaptation Costs for Producers Higher Price, Less Choice or Late Availability for Consumers Unfair playing field for Companies Less Trade or Investment Price Differentiation Inefficiencies maintained 81
82 Evidence of Transatlantic Regulatory Differences Differences in regulations as well as in regulation philosophy EU regulatory hunger versus market-oriented approach in Anglo-Saxion countries Regulations as instrument of strategic trade policy Some regulatory differences are merely red tape! 82
83 Regulatory Cooperation Various kinds of regulatory cooperation possible NO cooperation, but ACCEPTANCE of differences = mutual recognition Full harmonization common regulations (new or existing ones) Partial harmonization: agreement to differ on some aspects Cfr. process of building the EU internal market 83
84 Regulatory Cooperation Economic Perspective: Adaptation Cost Perspective: full harmonization is the best option General Welfare Perspective: it depends Evaluation of trade-off between fundamental aims of regulation and its potentially devastating impact on trade = long and hard process at detailed levels! 84
85 Some Conclusions on the TTIP Debate Hard to predict the (exact) impact of TTIP Because ex-ante simulations are not always reliable (and very sensitive to the assumptions made) Because exact content of TTIP is unknown Regulatory liberalisation has clear advantages, but full liberalisation would violate different preferences and traditions in the EU and the US Regulatory liberalisation can take many forms, going from mutual recognition till full harmonization. 85
86 Some Conclusions on the TTIP Debate Objections against regulatory cooperation/liberalisation shouldn t determine the final judgement of TTIP. TTIP is about more than regulations. Tariff liberalisation and reducing red tape is still very useful! TTIP should be a framework agreement rather than a very precise agreement. Fast trade & investment deal = bad trade & investment deal! Reconciling trade facilitation and other welfare goals takes time! 86
87 EU External Trade Policy in Times of Regional Trade Agreements IMPLICATIONS FOR THE FUTURE 87
88 Some Conclusions and Discussion Europe s absolute trade performance is very strong, but Europe s relative position in the world is deteriorating. The crisis accelerated that trend. Emerging markets are becoming relatively more important. Global markets are increasingly important for EU companies. Cfr. top priority in EU trade policy: market access! -> extra-eu exports are increasing, absolutely as well as relatively. From European business to Global business: substantial part of emerging markets exports are driven by western multinationals. 88
89 Some Conclusions and Discussion Most EU countries recovered rather well from the crisis, even countries severely hit by the crisis. However: substantial differences in export growth performance Strong catching-up in Central and Eastern Europe, for exports as well as imports. Especially strong performance within the EU Will these countries be able to translate that success into more global business? Crisis did not fundamentally change Europe s comparative advantages and disadvantages. Hence the specialization pattern was not affected by the crisis. 89
90 Some Conclusions and Discussion The old Europe is searching for a new position in a changed global context. Defensive strategy: relying on its traditional competitive advantages Offensive strategy: preparing the EU economy for the future Recent evolutions in Europe s performance in a global business context point to substantial and many challenges. Coping with new players Defending existing products or developing new ones? (role of technology and innovation) More active policy stance required? 90
91 Some Conclusions and Discussion EU has a tradition of trade openness (active role in World Trade Organisation, active negotiators of bilateral trade and investment deals ) will trade openness save Europe s future? Fear for globalization At least, globalization will lead to structural shifts in the EU economy with consequences for jobs, welfare, company structures, production dynamics, location reallocations, dynamic specializations etc. 91
2014 BELGIAN FOREIGN TRADE
 2014 BELGIAN FOREIGN TRADE 2 3 01 \\ EXPORTS 6 1.1 Geographical developments 1.2 Sectoral developments 02 \\ IMPORTS 14 2.1 Geographical developments 2.2 Sectoral developments 03 \\ GEOGRAPHICAL TRADE
BULGARIAN TRADE WITH EU IN THE PERIOD JANUARY - JUNE 2014 (PRELIMINARY DATA)
") BULGARIAN TRADE WITH EU IN THE PERIOD JANUARY - JUNE 2014 (PRELIMINARY DATA) In the period January - June 2014 Bulgarian exports to the EU increased by 2.8% to the corresponding the year and amounted to
BULGARIAN TRADE WITH EU IN THE PERIOD JANUARY - JUNE 2014 (PRELIMINARY DATA) In the period January - June 2014 Bulgarian exports to the EU increased by 2.8% to the corresponding the year and amounted to
BULGARIAN TRADE WITH EU IN THE PERIOD JANUARY - FEBRUARY 2017 (PRELIMINARY DATA)
") BULGARIAN TRADE WITH EU IN THE PERIOD JANUARY - FEBRUARY 2017 (PRELIMINARY DATA) In the period January - February 2017 Bulgarian exports to the EU increased by 9.0% to the same 2016 and amounted to 4 957.2
BULGARIAN TRADE WITH EU IN THE PERIOD JANUARY - FEBRUARY 2017 (PRELIMINARY DATA) In the period January - February 2017 Bulgarian exports to the EU increased by 9.0% to the same 2016 and amounted to 4 957.2
BULGARIAN TRADE WITH EU IN JANUARY 2017 (PRELIMINARY DATA)
") BULGARIAN TRADE WITH EU IN JANUARY 2017 (PRELIMINARY DATA) In January 2017 Bulgarian exports to the EU increased by 7.2% month of 2016 and amounted to 2 426.0 Million BGN (Annex, Table 1 and 2). Main trade
BULGARIAN TRADE WITH EU IN JANUARY 2017 (PRELIMINARY DATA) In January 2017 Bulgarian exports to the EU increased by 7.2% month of 2016 and amounted to 2 426.0 Million BGN (Annex, Table 1 and 2). Main trade
BULGARIAN TRADE WITH EU IN THE PERIOD JANUARY - MARCH 2016 (PRELIMINARY DATA)
") BULGARIAN TRADE WITH EU IN THE PERIOD JANUARY - MARCH 2016 (PRELIMINARY DATA) In the period January - March 2016 Bulgarian exports to the EU grew by 2.6% in comparison with the same 2015 and amounted to
BULGARIAN TRADE WITH EU IN THE PERIOD JANUARY - MARCH 2016 (PRELIMINARY DATA) In the period January - March 2016 Bulgarian exports to the EU grew by 2.6% in comparison with the same 2015 and amounted to
Belgium s foreign trade
 Belgium s FIRST 9 months Belgium s BELGIAN FOREIGN TRADE AFTER THE FIRST 9 MONTHS OF Analysis of the figures for (first 9 months) (Source: eurostat - community concept*) After the first nine months of,
VISA POLICY OF THE REPUBLIC OF KAZAKHSTAN
 VISA POLICY OF THE REPUBLIC OF KAZAKHSTAN Country Diplomatic Service National Term of visafree stay CIS countries 1 Azerbaijan visa-free visa-free visa-free 30 days 2 Kyrgyzstan visa-free visa-free visa-free
Mapping physical therapy research
 Mapping physical therapy research Supplement Johan Larsson Skåne University Hospital, Revingevägen 2, 247 31 Södra Sandby, Sweden January 26, 2017 Contents 1 Additional maps of Europe, North and South
WORLDWIDE DISTRIBUTION OF PRIVATE FINANCIAL ASSETS
 WORLDWIDE DISTRIBUTION OF PRIVATE FINANCIAL ASSETS Munich, November 2018 Copyright Allianz 11/19/2018 1 MORE DYNAMIC POST FINANCIAL CRISIS Changes in the global wealth middle classes in millions 1,250
8193/11 GL/mkl 1 DG C I
 COUNCIL OF THE EUROPEAN UNION Brussels, 25 March 2011 8193/11 AVIATION 70 INFORMATION NOTE From: European Commission To: Council Subject: State of play of ratification by Member States of the aviation
Translation from Norwegian
 Statistics for May 2018 Forced returns from Norway The National Police Immigration Service (NPIS) forcibly returned 402 persons in May 2018, and 156 of these were convicted offenders. The NPIS is responsible
SKILLS, MOBILITY, AND GROWTH
 SKILLS, MOBILITY, AND GROWTH Eric Hanushek Ludger Woessmann Ninth Biennial Federal Reserve System Community Development Research Conference April 2-3, 2015 Washington, DC Commitment to Achievement Growth
Global Harmonisation of Automotive Lighting Regulations
 Transmitted by the expert from GTB Informal document GRE-68-10 (68th GRE, 16-18 October 2012) agenda item 19(a)) Global Harmonisation of Automotive Lighting Regulations This discussion document has been
Cambridge International Examinations Cambridge International Advanced Subsidiary and Advanced Level
 Cambridge International Examinations Cambridge International Advanced Subsidiary and Advanced Level *4898249870-I* GEOGRAPHY 9696/31 Paper 3 Advanced Human Options October/November 2015 INSERT 1 hour 30
Delays in the registration process may mean that the real figure is higher.
 Monthly statistics December 2013: Forced returns from Norway The National Police Immigration Service (NPIS) forcibly returned 483 persons in December 2013. 164 of those forcibly returned in December 2013
The NPIS is responsible for forcibly returning those who are not entitled to stay in Norway.
 Monthly statistics December 2014: Forced returns from Norway The National Police Immigration Service (NPIS) forcibly returned 532 persons in December 2014. 201 of these returnees had a criminal conviction
The EU on the move: A Japanese view
 The EU on the move: A Japanese view H.E. Mr. Kazuo KODAMA Ambassador of Japan to the EU Brussels, 06 February 2018 I. The Japan-EU EPA Table of Contents 1. World GDP by Country (2016) 2. Share of Japan
Commonwealth of Australia. Migration Regulations CLASSES OF PERSONS (Subparagraphs 1236(1)(a)(ii), 1236(1)(b)(ii) and 1236(1)(c)(ii))
(a)(ii), 1236(1)(b)(ii) and 1236(1)(c)(ii))") Commonwealth of Australia Migration Regulations 1994 CLASSES OF PERSONS (Subparagraphs 1236(1)(a)(ii), 1236(1)(b)(ii) and 1236(1)(c)(ii)) I, SOPHIE MONTGOMERY, Delegate of the Minister for Immigration,
Commonwealth of Australia Migration Regulations 1994 CLASSES OF PERSONS (Subparagraphs 1236(1)(a)(ii), 1236(1)(b)(ii) and 1236(1)(c)(ii)) I, SOPHIE MONTGOMERY, Delegate of the Minister for Immigration,
The National Police Immigration Service (NPIS) forcibly returned 412 persons in December 2017, and 166 of these were convicted offenders.
 forcibly returned 412 persons in December 2017, and 166 of these were convicted offenders.") Monthly statistics December 2017: Forced returns from Norway The National Police Immigration Service (NPIS) forcibly returned 412 persons in December 2017, and 166 of these were convicted offenders. The
Monthly statistics December 2017: Forced returns from Norway The National Police Immigration Service (NPIS) forcibly returned 412 persons in December 2017, and 166 of these were convicted offenders. The
Dashboard. Jun 1, May 30, 2011 Comparing to: Site. 79,209 Visits % Bounce Rate. 231,275 Pageviews. 00:03:20 Avg.
 www.beechworth.com Dashboard Jun 1, 21 - May 3, 211 Comparing to: Site Visits Jun 7 Jul 1 Aug 12 Sep 14 Oct 17 Nov 19 Dec 22 Jan 24 Feb 26 Mar 31 May 3 Site Usage 79,29 Visits 45.87% Bounce Rate 231,275
Global Variations in Growth Ambitions
 Global Variations in Growth Ambitions Donna Kelley, Babson College 7 th Annual GW October Entrepreneurship Conference World Bank, Washington DC October 13, 216 Wide variation in entrepreneurship rates
SEPTEMBER TRADE UPDATE ASIA TAKES THE LEAD
 Public Disclosure Authorized Public Disclosure Authorized Public Disclosure Authorized Public Disclosure Authorized SEPTEMBER TRADE WATCH SEPTEMBER TRADE UPDATE ASIA TAKES THE LEAD All regions show an
UNIDEM CAMPUS FOR THE SOUTHERN MEDITERRANEAN COUNTRIES
 UNIDEM CAMPUS FOR THE SOUTHERN MEDITERRANEAN COUNTRIES Venice Commission of Council of Europe STRENGTHENING THE LEGAL CAPACITIES OF THE CIVIL SERVICE IN THE SOUTHERN MEDITERRANEAN COUNTRIES Administrations
New York County Lawyers Association Continuing Legal Education Institute 14 Vesey Street, New York, N.Y (212)
") New York County Lawyers Association Continuing Legal Education Institute 14 Vesey Street, New York, N.Y. 10007 (212) 267-6646 Who is Who in the Global Economy And Why it Matters June 20, 2014; 6:00 PM-6:50
New York County Lawyers Association Continuing Legal Education Institute 14 Vesey Street, New York, N.Y. 10007 (212) 267-6646 Who is Who in the Global Economy And Why it Matters June 20, 2014; 6:00 PM-6:50
The National Police Immigration Service (NPIS) returned 444 persons in August 2018, and 154 of these were convicted offenders.
 returned 444 persons in August 2018, and 154 of these were convicted offenders.") Monthly statistics August 2018 Forced returns from Norway The National Police Immigration Service (NPIS) returned 444 persons in August 2018, and 154 of these were convicted offenders. The NPIS is responsible
Monthly statistics August 2018 Forced returns from Norway The National Police Immigration Service (NPIS) returned 444 persons in August 2018, and 154 of these were convicted offenders. The NPIS is responsible
GLOBAL RISKS OF CONCERN TO BUSINESS WEF EXECUTIVE OPINION SURVEY RESULTS SEPTEMBER 2017
 GLOBAL RISKS OF CONCERN TO BUSINESS WEF EXECUTIVE OPINION SURVEY RESULTS SEPTEMBER 2017 GLOBAL RISKS OF CONCERN TO BUSINESS Results from the World Economic Forum Executive Opinion Survey 2017 Survey and
Global Trends in Location Selection Final results for 2005
 Global Business Services Plant Location International Global Trends in Location Selection Final results for 2005 September, 2006 Global Business Services Plant Location International 1. Global Overview
The National Police Immigration Service (NPIS) forcibly returned 375 persons in March 2018, and 136 of these were convicted offenders.
 forcibly returned 375 persons in March 2018, and 136 of these were convicted offenders.") Statistics March 2018: Forced returns from Norway The National Police Immigration Service (NPIS) forcibly returned 375 persons in March 2018, and 136 of these were convicted offenders. The NPIS is responsible
Statistics March 2018: Forced returns from Norway The National Police Immigration Service (NPIS) forcibly returned 375 persons in March 2018, and 136 of these were convicted offenders. The NPIS is responsible
COST:PAST, PRESENT AND FUTURE
 COST:PAST, PRESENT AND FUTURE Francesco Fedi Past President COST Committee Senior Officials President COST Office Association COST COoperation in Science and Technology It was the first and it is one of
PISA 2015 in Hong Kong Result Release Figures and Appendices Accompanying Press Release
 PISA 2015 in Hong Kong Result Release Figures and Appendices Accompanying Press Release Figure 1-7 and Appendix 1,2 Figure 1: Comparison of Hong Kong Students Performance in Science, Reading and Mathematics
Return of convicted offenders
 Monthly statistics December : Forced returns from Norway The National Police Immigration Service (NPIS) forcibly returned 869 persons in December, and 173 of these were convicted offenders. The NPIS forcibly
The National Police Immigration Service (NPIS) forcibly returned 429 persons in January 2018, and 137 of these were convicted offenders.
 forcibly returned 429 persons in January 2018, and 137 of these were convicted offenders.") Monthly statistics January 2018: Forced returns from Norway The National Police Immigration Service (NPIS) forcibly returned 429 persons in January 2018, and 137 of these were convicted offenders. The
Monthly statistics January 2018: Forced returns from Norway The National Police Immigration Service (NPIS) forcibly returned 429 persons in January 2018, and 137 of these were convicted offenders. The
VOICE AND DATA INTERNATIONAL
 INTERNATIONAL VOICE AND DATA Find the EE international rates, as well as the new roaming bundles for and. INTERNATIONAL VOICE AND DATA p.28-32 International Voice p.29-30 International Data p.31-32 contents
Countries for which a visa is required to enter Colombia
 Albania EASTERN EUROPE Angola SOUTH AFRICA Argelia (***) Argentina SOUTH AMERICA Australia OCEANIA Austria Azerbaijan(**) EURASIA Bahrain MIDDLE EAST Bangladesh SOUTH ASIA Barbados CARIBBEAN AMERICA Belgium
Chapter 9. Regional Economic Integration
 Chapter 9 Regional Economic Integration Global Talent Crunch The Global Talent Crunch Over the next decade, it is estimated that the growth in demand for collegeeducated talent will exceed the growth in
The Conference Board Total Economy Database Summary Tables November 2016
 The Conference Board Total Economy Database Summary Tables November 2016 About This document contains a number of tables and charts outlining the most important trends from the latest update of the Total
Contributions to UNHCR For Budget Year 2014 As at 31 December 2014
 1 UNITED STATES OF AMERICA 1,280,827,870 2 EUROPEAN UNION 271,511,802 3 UNITED KINGDOM 4 JAPAN 5 GERMANY 6 SWEDEN 7 KUWAIT 8 SAUDI ARABIA *** 203,507,919 181,612,466 139,497,612 134,235,153 104,356,762
South Africa - A publisher s perspective. STM/PASA conference 11 June, 2012, Cape Town Mayur Amin, SVP Research & Academic Relations
 South Africa - A publisher s perspective STM/PASA conference 11 June, 2012, Cape Town Mayur Amin, SVP Research & Academic Relations 0 As a science information company, we have a unique vantage point on
Industrial Remote Communication Country Approvals for mobile network based Products
 SIMATIC NET Industrial Remote Communication Country Approvals for mobile network based Products 2018-01-12 www.siemens.com/simatic-net Industrial Routers / Modems CP 1200 LOGO! CMR Compact RTU MD741-1
Management Systems: Paulo Sampaio - University of Minho. Pedro Saraiva - University of Coimbra PORTUGAL
 Management Systems: A Path to Organizational Sustainability Paulo Sampaio - University of Minho paulosampaio@dps.uminho.ptuminho pt Pedro Saraiva - University of Coimbra pas@eq.uc.pt PORTUGAL Session learning
Education Quality and Economic Development
 Education Quality and Economic Development Eric A. Hanushek Stanford University Bank of Israel Jerusalem, June 2017 Sustainable Development Goals (SDGs) Development = Growth Growth = Skills Conclusions
REPORT OF THE FOURTH SPECIAL SESSION OF THE CONFERENCE OF THE STATES PARTIES
 OPCW Conference of the States Parties Fourth Special Session C-SS-4/3 26 and 27 June 2018 27 June 2018 Original: ENGLISH REPORT OF THE FOURTH SPECIAL SESSION OF THE CONFERENCE OF THE STATES PARTIES 1.
European patent filings
 Annual Report 07 - European patent filings European patent filings Total filings This graph shows the geographic origin of the European patent filings. This is determined by the country of residence of
EU exports to Indonesia, Malaysia and Thailand
 EU exports to Indonesia, Malaysia and Note prepared for the Malaysian Palm Oil Council May 2018 EU exports of goods to Indonesia, Malaysia and amounted to EUR 39.5 billion in 2017 and supported at least
Trends in international higher education
 Trends in international higher education 1 Schedule Student decision-making Drivers of international higher education mobility Demographics Economics Domestic tertiary enrolments International postgraduate
Migration and Integration
 Migration and Integration Integration in Education Education for Integration Istanbul - 13 October 2017 Francesca Borgonovi Senior Analyst - Migration and Gender Directorate for Education and Skills, OECD
2018 Social Progress Index
 2018 Social Progress Index The Social Progress Index Framework asks universally important questions 2 2018 Social Progress Index Framework 3 Our best index yet The Social Progress Index is an aggregate
SEVERANCE PAY POLICIES AROUND THE WORLD
 SEVERANCE PAY POLICIES AROUND THE WORLD SEVERANCE PAY POLICIES AROUND THE WORLD No one likes to dwell on lay-offs and terminations, but severance policies are a major component of every HR department s
MIGRATION IN SPAIN. "Facebook or face to face? A multicultural exploration of the positive and negative impacts of
 "Facebook or face to face? A multicultural exploration of the positive and negative impacts of Science and technology on 21st century society". MIGRATION IN SPAIN María Maldonado Ortega Yunkai Lin Gerardo
The Role of EU Trade Policy in Enhancing the Competitiveness of European Industry
 The Role of EU Trade Policy in Enhancing the Competitiveness of European Industry Industrial Policy Taskforce Mrs. Signe Ratso Director, DG Trade EPC Conference European Commission 10 December 2013 1 Contents
Monthly Inbound Update June th August 2017
 Monthly Inbound Update June 217 17 th August 217 1 Contents 1. About this data 2. Headlines 3. Journey Purpose: June, last 3 months, year to date and rolling twelve months by journey purpose 4. Global
ENC Academic Council, Partnerships and Organizational Guidelines
 ENC Academic Council, Partnerships and Organizational Guidelines The following document outlines the exact organisational structure and membership obligations, guidelines and decision-making rights of
"Science, Research and Innovation Performance of the EU 2018"
 "Science, Research and Innovation Performance of the EU 2018" Innovation, Productivity, Jobs and Inequality ERAC Workshop Brussels, 4 October 2017 DG RTD, Unit A4 Key messages More robust economic growth
The Anti-Counterfeiting Network. Ronald Brohm Managing Director
 The Anti-Counterfeiting Network Ronald Brohm Managing Director brief history More than 25 years experience in fighting counterfeiting Headquarters are based in Amsterdam, The Netherlands + 85 offices and
THE VENICE COMMISSION OF THE COUNCIL OF EUROPE
 THE VENICE COMMISSION OF THE COUNCIL OF EUROPE Promoting democracy through law The role of the Venice Commission whose full name is the European Commission for Democracy through Law is to provide legal
PROTOCOL RELATING TO AN AMENDMENT TO THE CONVENTION ON INTERNATIONAL CIVIL AVIATION ARTICLE 45, SIGNED AT MONTREAL ON 14 JUNE parties.
 PROTOCOL RELATING TO AN AMENDMENT TO THE CONVENTION ON INTERNATIONAL CIVIL AVIATION ARTICLE 45, SIGNED AT MONTREAL ON 14 JUNE 1954 State Entry into force: The Protocol entered into force on 16 May 1958.
Equity and Excellence in Education from International Perspectives
 Equity and Excellence in Education from International Perspectives HGSE Special Topic Seminar Pasi Sahlberg Spring 2015 @pasi_sahlberg Evolution of Equity in Education 1960s: The Coleman Report 1970s:
LIST OF CHINESE EMBASSIES OVERSEAS Extracted from Ministry of Foreign Affairs of the People s Republic of China *
 ANNEX 1 LIST OF CHINESE EMBASSIES OVERSEAS Extracted from Ministry of Foreign Affairs of the People s Republic of China * ASIA Chinese Embassy in Afghanistan Chinese Embassy in Bangladesh Chinese Embassy
2016 Europe Travel Trends Report
 2016 Europe Travel Trends Report One-third of worldwide travellers report1 they ll spend more on travel in 2016 than the year previous. Of those big spenders, Europeans dominate the list, with Switzerland,
1. Why do third-country audit entities have to register with authorities in Member States?
 Frequently Asked Questions (FAQ) Form A Annex to the Common Application Form for Registration of Third-Country Audit Entities under a European Commission Decision 2008/627/EC of 29 July 2008 on transitional
EUP2P. The Dual use Regulation: general frame, control regimes and weaknesses
 EUP2P The Dual use Regulation: general frame, control regimes and weaknesses Kiev, 14 March 2018 Angelo Minotti, Ph. D. CONTENTS - UN Resolution 1540 - Aims - Multilateral Export Control Regimes - EU Reg.
ASYLUM IN THE EU Source: Eurostat 4/6/2013, unless otherwise indicated ASYLUM APPLICATIONS IN THE EU27
 ASYLUM IN THE EU Source: Eurostat 4/6/2013, unless otherwise indicated ASYLUM APPLICATIONS IN THE EU27 Total number of asylum applications in 2012 335 365 450 000 400 000 350 000 300 000 250 000 200 000
The Future of Central Bank Cooperation
 The Future of Central Bank Cooperation (An Outsider s Perspective) Beth Simmons Government Department Harvard University What are the conditions under which cooperation is likely to take place? Economic
UNITED NATIONS FINANCIAL PRESENTATION. UN Cash Position. 18 May 2007 (brought forward) Alicia Barcena Under Secretary-General for Management
 Alicia Barcena Under Secretary-General for Management") UNITED NATIONS FINANCIAL PRESENTATION UN Cash Position 18 May 2007 (brought forward) Alicia Barcena Under Secretary-General for Management Key Components as at 31 December (Actual) (US$ millions) 2005
UNITED NATIONS FINANCIAL PRESENTATION UN Cash Position 18 May 2007 (brought forward) Alicia Barcena Under Secretary-General for Management Key Components as at 31 December (Actual) (US$ millions) 2005
Collective Intelligence Daudi Were, Project
 Collective Intelligence Daudi Were, Project Director, @mentalacrobatic Kenya GDP 2002-2007 Kenya General Election Day 2007 underreported unreported Elections UZABE - Nigerian General Election - 2015
PISA 2009 in Hong Kong Result Release Figures and tables accompanying press release article
 PISA 2009 in Hong Kong Result Release Figures and tables accompanying press release article Figure 1-8 and App 1-2 for Reporters Figure 1 Comparison of Hong Kong Students' Performance in Reading, Mathematics
APPENDIX 1: MEASURES OF CAPITALISM AND POLITICAL FREEDOM
 1 APPENDIX 1: MEASURES OF CAPITALISM AND POLITICAL FREEDOM All indicators shown below were transformed into series with a zero mean and a standard deviation of one before they were combined. The summary
Setting National Broadband Policies, Strategies & Plans
 Setting National Broadband Policies, Strategies & Plans Dr Bob Horton Senior Telecommunications Expert 11 th Global Symposium for Regulators Smart Regulation for a Broadband World Armenia, Colombia, 22
Beyond Kyoto Copenhagen Durban 2011
 Beyond Kyoto Copenhagen 2009 Mexico 2010 Durban 2011 References The United Nations Framework Convention on Climate Change: http://unfccc.int/2860.php The New York Times 20/12/2009 A Grudging Accord in
IMMIGRATION IN THE EU
 IMMIGRATION IN THE EU Source: Eurostat 10/6/2015, unless otherwise indicated Data refers to non-eu nationals who have established their usual residence in the territory of an EU State for a period of at
The Madrid System. Overview and Trends. Mexico March 23-24, David Muls Senior Director Madrid Registry
 The Madrid System Overview and Trends David Muls Senior Director Madrid Registry Mexico March 23-24, 2015 What is the Madrid System? A centralized filing and management procedure A one-stop shop for trademark
From Europe to the Euro
 From Europe to the Euro 2012 Euro Challenge Student Orientation Florida International University December 6 th, 2011 Kasper Zeuthen Delegation of the European Union Washington, DC www.euro-challenge.org
Contracting Parties to the Ramsar Convention
 Contracting Parties to the Ramsar Convention 14/12/2016 Number of Contracting Parties: 169 Country Entry into force Notes Albania 29.02.1996 Algeria 04.03.1984 Andorra 23.11.2012 Antigua and Barbuda 02.10.2005
The Economics of European Integration
 The Economics of European Integration Chapter 12 Trade Policy EU25 67% EFTA 4% CIS 2% EU25 exports, 2003 EFTA 4% EU25 67% CIS 3% Pattern of Trade: Facts Turkey 1% Other 24% Turkey 1% Other 25% Other Europe
GERMANY, JAPAN AND INTERNATIONAL PAYMENT IMBALANCES
 Articles Articles Articles Articles Articles CENTRAL EUROPEAN REVIEW OF ECONOMICS & FINANCE Vol. 2, No. 1 (2012) pp. 5-18 Slawomir I. Bukowski* GERMANY, JAPAN AND INTERNATIONAL PAYMENT IMBALANCES Abstract
Rankings: Universities vs. National Higher Education Systems. Benoit Millot
 Rankings: Universities vs. National Higher Education Systems Benoit Millot Outline 1. Background 2. Methodology 3. Results 4. Discussion 11/8/ 2 1. Background 11/8/ 3 Clear Shift Background: Leagues focus
International Goods Returns Service
 International Goods Returns Service Customer User Guide and Rate card v2.4 24 th August 2012 Service Overview An international reply-paid goods returns service available across 28 countries It offers end
Shaping the Future of Transport
 Shaping the Future of Transport Welcome to the International Transport Forum Over 50 Ministers Shaping the transport policy agenda The International Transport Forum is a strategic think tank for the transport
HUMAN RESOURCES IN R&D
 HUMAN RESOURCES IN R&D This fact sheet presents the latest UIS S&T data available as of July 2011. Regional density of researchers and their field of employment UIS Fact Sheet, August 2011, No. 13 In the
1.1. Trade in goods: main trends Rankings: imports, exports and overall trade volume Philippines trade with EU Member States
 Front Cover Contents Message from the EU Trade Commissioner 2 Overview 3 1. Trade Relations 1.1. Trade in goods: main trends 1.2. Trade in services 1.3. Rankings: imports, exports and overall trade volume
Consumer Barometer Study 2017
 Consumer Barometer Study 2017 The Year of the Mobile Majority As reported mobile internet usage crosses 50% 2 for the first time in all 63 countries covered by the Consumer Barometer Study 1, we look at
Migration Report Central conclusions
 Migration Report 2013 Central conclusions 2 Migration Report 2013 - Central conclusions Migration Report 2013 Central conclusions The Federal Government s Migration Report aims to provide a foundation
TRIPS OF BULGARIAN RESIDENTS ABROAD AND ARRIVALS OF VISITORS FROM ABROAD TO BULGARIA IN MARCH 2016
 TRIPS OF BULGARIAN RESIDENTS ABROAD AND ARRIVALS OF VISITORS FROM ABROAD TO BULGARIA IN MARCH 2016 In March 2016, the number of the trips of Bulgarian residents abroad was 354.7 thousand (Annex, Table
TRIPS OF BULGARIAN RESIDENTS ABROAD AND ARRIVALS OF VISITORS FROM ABROAD TO BULGARIA IN AUGUST 2016
 TRIPS OF BULGARIAN RESIDENTS ABROAD AND ARRIVALS OF VISITORS FROM ABROAD TO BULGARIA IN AUGUST 2016 In August 2016, the number of the trips of Bulgarian residents abroad was 590.6 thousand (Annex, Table
TRIPS OF BULGARIAN RESIDENTS ABROAD AND ARRIVALS OF VISITORS FROM ABROAD TO BULGARIA IN AUGUST 2015
 TRIPS OF BULGARIAN RESIDENTS ABROAD AND ARRIVALS OF VISITORS FROM ABROAD TO BULGARIA IN AUGUST 2015 In August 2015, the number of the trips of Bulgarian residents abroad was 512.0 thousand (Annex, Table
TRIPS OF BULGARIAN RESIDENTS ABROAD AND ARRIVALS OF VISITORS FROM ABROAD TO BULGARIA IN MAY 2017
 TRIPS OF BULGARIAN RESIDENTS ABROAD AND ARRIVALS OF VISITORS FROM ABROAD TO BULGARIA IN MAY 2017 In May 2017, the number of the trips of Bulgarian residents abroad was 653.3 thousand (Annex, Table 1) or
TRIPS OF BULGARIAN RESIDENTS ABROAD AND ARRIVALS OF VISITORS FROM ABROAD TO BULGARIA IN FEBRUARY 2017
 TRIPS OF BULGARIAN RESIDENTS ABROAD AND ARRIVALS OF VISITORS FROM ABROAD TO BULGARIA IN FEBRUARY 2017 In February 2017, the number of the trips of Bulgarian residents abroad was 366.8 thousand (Annex,
BRAND. Cross-national evidence on the relationship between education and attitudes towards immigrants: Past initiatives and.
 Cross-national evidence on the relationship between education and attitudes towards immigrants: Past initiatives and future OECD directions EMPLOYER BRAND Playbook Promoting Tolerance: Can education do
VACATION AND OTHER LEAVE POLICIES AROUND THE WORLD
 VACATION AND OTHER LEAVE POLICIES AROUND THE WORLD VACATION AND OTHER LEAVE POLICIES AROUND THE WORLD AT A GLANCE ORDER ONLINE GEOGRAPHY 47 COUNTRIES COVERED 5 REGIONS 48 MARKETS Americas Asia Pacific
Migration Report Central conclusions
 Migration Report 2012 Central conclusions 2 Migration Report 2012: Central conclusions Migration Report 2012 Central conclusions The Federal Government s Migration Report aims to provide a foundation for
Asylum Levels and Trends in Industrialized Countries. First Quarter, 2005
 Asylum Levels and Trends in Industrialized Countries First Quarter, 2005 Comparative Overview of Asylum Applications Lodged in 31 European and 5 Non-European Countries May 2005 Statistics PGDS/DOS UNHCR
TRIPS OF BULGARIAN RESIDENTS ABROAD AND ARRIVALS OF VISITORS FROM ABROAD TO BULGARIA IN DECEMBER 2016
 TRIPS OF BULGARIAN RESIDENTS ABROAD AND ARRIVALS OF VISITORS FROM ABROAD TO BULGARIA IN DECEMBER 2016 In December 2016, the number of the trips of Bulgarian residents abroad was 397.3 thousand (Annex,
Ignacio Molina and Iliana Olivié May 2011
 Ignacio Molina and Iliana Olivié May 2011 What is the IEPG? The Elcano Global Presence Index (IEPG after its initials in Spanish) is a synthetic index that orders, quantifies and aggregates the external
Asylum Trends. Appendix: Eurostat data
 Asylum Trends Appendix: Eurostat data Contents Colophon 2 First asylum applications in Europe (EU, Norway and Switzerland) Monthly asylum applications in the EU, Norway and Switzerland 3 First asylum applications
TRIPS OF BULGARIAN RESIDENTS ABROAD AND ARRIVALS OF VISITORS FROM ABROAD TO BULGARIA IN SEPTEMBER 2015
 TRIPS OF BULGARIAN RESIDENTS ABROAD AND ARRIVALS OF VISITORS FROM ABROAD TO BULGARIA IN SEPTEMBER 2015 In September 2015, the number of the trips of Bulgarian residents abroad was 450.9 thousand (Annex,
The Global Economic Crisis Sectoral coverage
 Working Paper No. 271 The Global Economic Crisis Sectoral coverage Trends in Employment and Working Conditions by Economic Activity Statistical Update Third quarter 2009 Sectoral Activities Department
Copyright Act - Subsidiary Legislation CHAPTER 311 COPYRIGHT ACT. SUBSIDIARY LEGlSLA non. List o/subsidiary Legislation
 Copyright Act - Subsidiary Legislation CAP. 311 CHAPTER 311 COPYRIGHT ACT SUBSIDIARY LEGlSLA non List o/subsidiary Legislation Page I. Copyright (Specified Countries) Order... 83 81 [Issue 1/2009] LAWS
9 th International Workshop Budapest
 9 th International Workshop Budapest 2-5 October 2017 15 years of LANDNET-working: an Overview Frank van Holst, LANDNET Board / RVO.nl 9th International LANDNET Workshop - Budapest, 2-5 October 2017 Structure
Gender pay gap in public services: an initial report
 Introduction This report 1 examines the gender pay gap, the difference between what men and women earn, in public services. Drawing on figures from both Eurostat, the statistical office of the European
Emerging Asian economies lead Global Pay Gap rankings
 For immediate release Emerging Asian economies lead Global Pay Gap rankings China, Thailand and Vietnam top global rankings for pay difference between managers and clerical staff Singapore, 7 May 2008