SHEEPSKIN EFFECT: A MEASURE OF CREDENTIAL DISCRIMINATION. by Jin Ding. Bachelor of Economics in the Department of Finance,
|
|
|
- Sheila James
- 5 years ago
- Views:
Transcription
1 SHEEPSKIN EFFECT: A MEASURE OF CREDENTIAL DISCRIMINATION by Jin Ding Bachelor of Economics in the Department of Finance, Nankai University, P.R.China, 21 PROJECT SUBMITTED IN PARTIAL FULFILLMENT OF THE REQUIREMENTS FOR THE DEGREE OF MASTER OF ARTS In the Department of Economics -Jin Ding 23 SIMON FRASER UNIVERSITY - December 23 All rights reserved. This work may not be reproduced in whole or in part, by photocopy or other means, without permission of the author.
2 APPROVAL Name: Degree: Title of Project : Jin Ding M. A. (Economics) Sheepskin Effect: A Measure Of Credential Discrimination Examining Committee: Chair: Gordon Myers d a n e Frieien Senior Supervisor Dr. Steeve Mongrain super;essr I Simon Woodcock Internal Examiner Date Approved: December 8,23
3 PARTIAL COPYRIGHT LICENSE I hereby grant to Simon Fraser University the right to lend my thesis, project or extended essay (the title of which is shown below) to users of the Simon Fraser University Library, and to make partial or single copies only for such users or in response to a request from the library of any other university, or other educational institution, on its own behalf or for one of its users. I further agree that permission for multiple copying of this work for scholarly purposes may be granted by me or the Dean of Graduate Studies. It is understood that copying or publication of this work for financial gain shall not be allowed without my written permission. Title of Project Sheepskin Effect: A Measure Of Credential Discrimination Author: Date : Jin DLG~ O8.23 Ding
4 Abstract This paper uses data on immigrants from China and native-born Canadian in the Canadian labour market to test the credential effect. We find that diplomas may serve as signals of productivity and that the signalling effects for Chinese lmmigrants are larger than native-born Canadian. Further, the labour market value of degrees appears to exceed the returns to years of education for Chinese Immigrants; in contrast, the returns to education for native-born Canadians due to returns to accumulated years of education and returns to credentials are of similar importance. No significant differences were found between genders within demographic groups. As a result of higher sheepskin effects, Chinese lmmigrants have to obtain higher credentials in order to signal their abilities to employers in the labour market. iii
5 Dedication To my Lord, who gives me the spirit and power to write this project. It is only through His Love and Mercies that my soul survives and enjoys.
6 Acknowledgements I want to express my grateful thanks to my Senior Supervisor, Professor Jane Friesen, for her valuable time, great support and guidance. I really cherish the time when we worked together. My special appreciation also goes to my Junior Supervisor, Professor Steeve Mongrain, who gives me encouragements and information. I am also grateful to my Committee Chair, Professor Gordon Myers, for his help in my defence. And I want to thank all my friends, who support me all the time, without you I cannot finish it successfully.
7 Table of Contents Approval... ii... Abstract.. Dedication Acknowledgements iii iv v Table of Contents... vi List of Tables... vii... List of Figures... VIII 1. Literature Review Data Source Descriptive Analysis Model Introduction and Estimation Results Regressions on the Years of Schooling Regressions on sheepskin effect Differences in Sheepskin Effects across Ethnic Groups Appendices REFERENCE 54
8 List of Tables Table 1. Descriptives of Chinese lmmigrants by Age at Immigration and FOLP group:. 25 Table 2. Credential Frequency of Chinese Immigrants: Table 3. Average Years of Education by Credentials Table 4. Descriptive of native-born Canadian:... 3 Table 5. Descriptive of Chinese Immigrants:... 3 Table 6. Cross-Tabulation of Highest Degree Received by Completed Years of... Education 31 Table 7. Cross-Tabulation of Highest Degree Received by Completed Years of... Education (Ontario) 32 Table 8. Cross-Tabulation of Highest Degree Received by Completed Years of Education (EFS Native-born Canadian) Table 9. Cross-Tabulation of Highest Degree Received by Completed Years of Education (EFS Chinese Immigrants Age Group 1) Table 1. Cross-Tabulation of Highest Degree Received by Completed Years of Education (EFS Chinese Immigrants Age Group 2) Table 11. Cross-Tabulation of Highest Degree Received by Completed Years of Education (EFS Chinese Immigrants Age Group 3) Table 12. Estimated Diploma Effects for Ethnic Groups (Both Sexes) Table 13. Hypothesis Test for Diploma Effects: Equality Across Groups Table 14. Hypothesis Test for Diploma Effects: Equality Across Groups... 4 Table 15. Regressions on Years of Schooling... 41
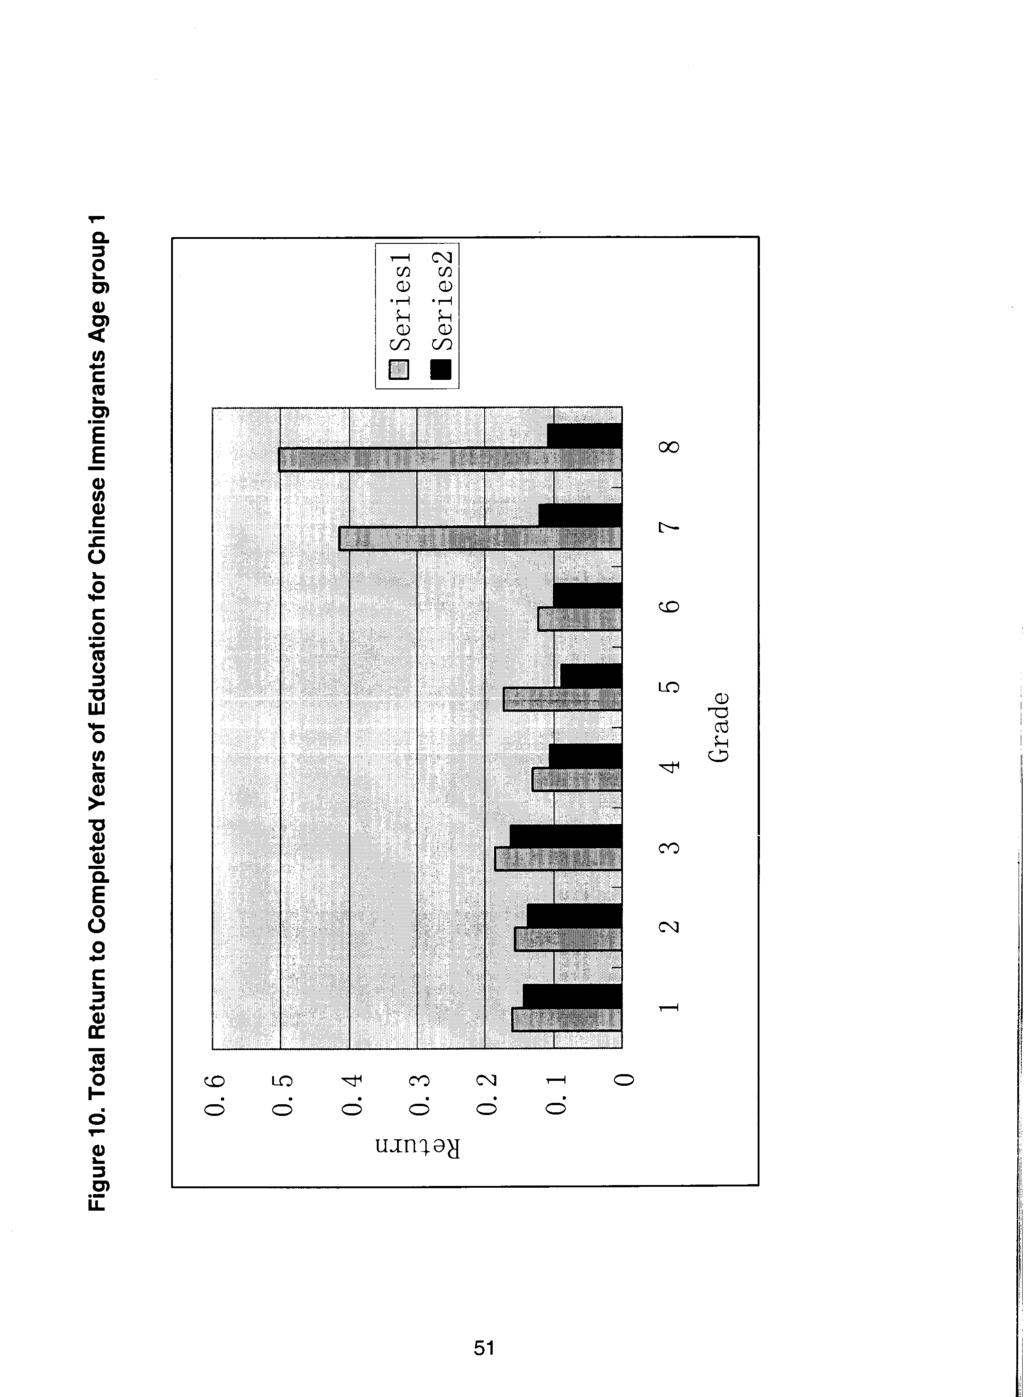
9 List of Figures Figure 1. Average weekly wage of Chinese Immigrants Figure 2. Average years of education of Chinese Immigrants Figure 3. Average working experience of Chinese Immigrants Figure 4. Chinese Immigrants Education Credentials of Both Sexes Figure 5. Chinese Immigrants Education Credentials of Males Figure 6. Chinese Immigrants Education Credentials of Females Figure 7. Average Years of Education by Credentials Figure 8. Average Education and Working Experience Comparison Between native-born Canadian and Chinese Immigrants Figure 9. Average Education and Working Experience Comparison Between native-born Canadian and Chinese Immigrants... 5 Figure 1. Total Return to Completed Years of Education for Chinese lmmigrants Age group Figure 11. Total Return to Completed Years of Education for Chinese lmmigrants Age group Figure 12. Total Return to Completed Years of Education for Chinese lmmigrants Age Group viii
10 1. Literature Review According to a wide range of empirical studies, more schooling will lead to more earnings for individuals. However, the reason why schooling enhances earnings has been debated for a long time. The screening hypothesis posits that more schooling not only increases productivity, but also credentiates workers as more productive. That is, schooling is also used as a screening device which helps employers to assess the productivity levels of individuals in the labour market; the skills learned in school may not be so important. This idea is crucial in the Canadian context with the arrival of thousands of highly qualified immigrants since 199. If it is the signalling effect that is rewarded in the labour market, we can predict that some individuals who receive diplomas will earn more than those with the same number of years of schooling but without diplomas. This "sheepskin effect" can be identified from the differences in wages between those who possess a diploma and those who do not, conditional on the same numbers of years of schooling. In the year 1973, Spence and Arrow each published research about the credential's signaling effect of greater innate productivity. In their formulation, the logarithm of the observed wage rate is an additive function of a linear term in years of completed schooling and a quadratic term in experience. If the coefficients on the years of completed schooling are referred to as the "rate of return" to education, the coefficients of particular years, in which individuals are
11 assumed to get their diplomas in standard education system, will partly represent any sheepskin effect. Using the sample of a prime aged white men from the United States, Hungerford and Solon (1987) identified significantly larger returns to diploma years than to other years of education using both spline and step functions, which confirmed the existence of this sheepskin effect. Belman and Heywood (1991) examined the patterns of sheepskin effect not only for the white male sample, but also for women and racial minorities. Their finding of a nearly identical 9-1% return for a college degree supports the Hungerford and Solon's estimates. Women and minorities receive larger sheepskin effects than white men for college and graduate school but smaller sheepskin effects for high school graduation in their studies. These roughly show the different roles credentials may play for women and minorities in the labour market, although the pattern of these differences in credentialing effects is ambiguous. Most tests of the credential effect are indirect, examining whether wages rise faster with extra years of education when the extra years correspond to the standard time needed for a credential, rather than looking directly at the value of credentials. Due to the lack of information on degree attainment, they impute the 'usual' number of years of education taken to complete a degree. This measurement error might lead to underestimation of the size of sheepskin effects resulted. Not all the individuals earn their degrees in the standard years; some even will not get it eventually. Furthermore, the standard number of years to finish a certain education level might differ by regions. For example, in Canada, Ontario requires students to finish their education to high school in 13 years,
12 while other provinces only require 12 years. If we only use the return to an assumed credentialing year for measuring sheepskin effect within a country, while actually individuals take different amounts of time to finish it, the underestimate of the sheepskin effect will result. Jaeger and Page (1996) found evidence of this downward bias when examining the differences of return to credentials between two specifications. One was non-linear wage returns only to the schooling years in which credentials might typically be granted; the other used not only the traditional measure of years of schooling but also data which identified the actual degree completed. The latter regression did produce larger estimated sheepskin effects. However, they failed to confirm a pattern of effects that differ by gender or race in the United States. Belman and Heywood's work, showed a differential signal quality of sheepskin effect across demographic groups. That is, for white females, minority males and minority females, high quality (college and grad school) sheepskin effects are larger than for white males, and lower quality (elementary and high school) sheepskin effects are smaller. In the circumstances where diploma years serve as a signal of potential productivity, the above evidence might suggest the possibility of statistical discrimination. To show why such an inference can be made, consider two workers of equally high productivity, one from a minority group whose average characteristics are less favourable than for the majority group. If a credential gives minority workers larger wage gains than the nonminorities in the absence of information on individuals, it means the average productivity of the minority group is less valued than majority in the labor market.
13 If this hold for the sheepskin effect, it would indicate that resources invested in education may have a high private rate of return for some groups in the society, but a low or even negative social return since the gains from credentials are not evenly distributed. A central objective ot this paper is to test and compare the credential effect for native-born and foreign born workers in Canada. 2. Data 2.1 Data Source This empirical work uses the 1996 Canadian Census Microdata. The sample is restricted to individuals between age 15 and 65 who are either nativeborn Canadians or Chinese lmmigrants and who reported wage and salary income as well as other useful variables. Individuals whose information is incomplete or having obvious discrepancies between variables are excluded. These exclusions reduce the total sample to individuals including 3516 native-born Canadians and 81 Chinese Immigrants. Each of these two groups is divided into 4 groups according to the first official language spoken: i) English First Spoken (EFS), ii) French First Spoken (FFS), iii) Both English and French Spoken (E&F), and iv) Neither English Nor French Spoken (NEF). Chinese lmmigrants are further divided into three groups based on the age upon immigration: i) Age Group 1 = -12, ii) Age Group 2 = 12-24, and iii) Age Group 3 = Due to insufficient sample size, only the EFS samples of native-born
14 Canadian and Chinese lmmigrants can be used properly for regression to examine the sheepskin effects. There are 21,892 EFS native-born Canadian, EFS Chinese lmmigrants in Age Group 1, 2688 EFS Chinese lmmigrants in Age Group 2, and 3889 EFS Chinese lmmigrants in Age Group 3 employed for regression. The Public Use Microdata File is used by this paper, which contains 2.8 percent of 1996 Canadian Census data. Because of the too large sample of native-born Canadian in the file we used, we selected 1 percent from them randomly. Therefore, the EFS native-born Canadian observations in this paper reflect approximately 7,818,571 EFS native-born Canadian individuals, and the total EFS Chinese lmmigrants observations reflect approximately 274,571 Chinese lmmigrants individuals. The total number 8,93,142 is about 24% of the total Canadian population in Descriptive Analysis Tables (please refer to the Appendix) are presented for the descriptive analysis, each of which is also supplemented by several charts for the convenience of comparison. Table 1 summarizes average years of education, average years of working experience, and mean weekly earnings for the sample of Chinese lmmigrants grouped by Age at Immigration. The Census does not measure working experience directly. Here in this paper (age-years of schooling-6) is used as a proxy for working experience for individuals younger than 22 years old. (Age - 22) is used for those older than 22 years, which may be more proper than (age - school years - 6) for them, since most Maters and Doctoral students work while 5
15 studying. According to the table, males earn substantially more than females on the whole, and tend to have slightly more labour market experience and education. This is more apparent for those who immigrated at the age after age 25. This difference may be due to discrimination. Another possibility is that our measure of work experience could seriously over-estimate the number of years of experience of women if women who are currently in the labour market have taken time out at an earlier point in their career to raise children. And women who immigrated at age greater than 25 are more likely to be in such kind of situation. Because they are more likely to have children during the first a few years after arriving Canada, when they are not adaptable enough to raise their children and work at the same time. However, for women in other age groups, they have more time to prepare for their lives in Canada before having a child, and might be able to raise children and work together later. This will result in generating more chances for an upward bias of working experience for women in age group 3. Thus their lower wage may to some extent be due to their having less work experience than men. Table 2 represents the distribution of degrees or diplomas for Chinese Immigrants, for both sexes as well as males and females separately. Table 3 shows their average years of education by credentials. Several points are noteworthy. The data varies widely by First Official Language Spoken group, especially for immigrants who immigrated before the age of 25. For Neither English Nor French speaker, the degree percentages are remarkably lower; language may be a major obstacle for them to get educated. A higher percentage
16 of both English and French speakers have High School and Bachelor degrees than other immigrant groups, while this advantageous position is replaced by English First Spoken immigrants for Master and Doctor degrees. Their bilingual even trilingual ability may equip them with some superiority in job search, but at the mean time, the more chances to get a good job may reduce their enthusiasm in deeper degree pursuit. For English First Spoken immigrants, their concentration on one language, which is the major educational language, could make it more probable for them to deeply pursue their study. Also, as individuals' ages at immigration increases, the percentage of immigrants who hold higher degrees such as Masters and Doctorates increases notably, which indicates the increasing importance of education in their life in Canada. Tables 4 and 5 show the average years of education, average years of working experience, and mean weekly earnings of native-born Canadian and Chinese lmmigrants separately. Except for the French First Spoken group, all the other Chinese immigrants have more years of education and more working experience than native-born Canadian. Nevertheless, only the Both English and French Speakers with outstandingly longer education and working experience compared to their native-born Canadian counterpart, have higher wages. It is also apparent from Tables 4 and 5 that Chinese Immigrants have higher percentages of degree certificates than native-born Canadian for each language group, despite their relatively lower wages. Table 6 presents a cross-tabulation of qualifications received by completed years of education based on our total sample. Since the education
17 system in Ontario requires students to finish their high school in the thirteenth year of schooling instead of the standard twelfth year as in other provinces, Table 7 presents a separate version for individuals from Ontario. For our total sample, while higher qualifications are associated with more years of schooling, many observations are not in the assumed standard years of degree completion. Among individuals whose highest reported degree was a high school diploma, only 43.2% received exactly 12 years of education, more than half of them took either more or fewer years. Only 54.2% of those individuals who reported having finished exactly 12 years of schooling received a high school diploma as the highest degree. In Census, the total years of schooling are divided into 9 groups which are 5-8 years of schooling, 9,1, 11,12,13 years of schooling respectively and years of schooling. Thus, we cannot get accurate information for 16 years of education, which is the assumed standard number of years for obtaining a Bachelor's degree in literature. But we can see only 65.1 % of those individuals using years to finish their Bachelor's degree. Similarly, 85.3% of individuals who received master's degrees have 18 or more years of education, compared to 9.6% of those receiving Doctorates who report less than 18 years of education. For individuals from Ontario, the numbers of years to obtain a certain degree are even more deviated. Especially for High school, those who finished it in 11 and 12 years are 37.7 percent and 29.7 percent of our sample respectively, even exceeds the number of those in the required 13 years. Deeper analysis will be done regarding these differences of data between Ontario and other provinces. The above results suggest that using only information about years of
18 education to infer the qualification received will result in largely biased estimates of the sheepskin effects. 3. Introduction and Methods of Estimation The positive correlation between education and wages is one of the most well established relationships in labour economics. Most empirical research on the return to schooling is based on the Mincer human capital wage equation. According to this model, the logarithm of individual earnings can be expressed as a linear function of years of completed schooling and a quadratic function of labour market experience. This specification has some obvious implications. First, in this return to education relationship, credential plays no role - only years of education matters, we cannot even tell the difference between the return in the last year of schooling and the others. Second, this specification assumes that controlling experience, the return to education is equally weighted across years. This will not hold if the mean rate of return to schooling is higher for some levels than others, university education compared to primary school, for example. Such differences could be driven by a multitude of factors, including differences in costs or quality across levels, different learning abilities of students in different ages, or changes in the supply of and demand for graduates which have an effect on the price of them in the labour market. Thus, many researchers have switched from this specification to the quadratic function form, which include both years of schooling and years of schooling square as independent variables. Although this specification is more flexible than the linear form, it still cannot 9
19 reflect the roles credentials may play in the returns to education. It also imposes additional constraints on the regression when the actual function is not the strict quadratic form of years of schooling. In investigating potential non- quadratic returns to schooling, the common approach is to estimate a wage equation that specifies the schooling variables as: In w, = a, + D, (schooling)+ AX + ei, where Di(schooling) denotes dummies for different levels of schooling and P is interpreted as the wage premium of that certain level or year of schooling. X is a vector including additional explanatory variables and h is a vector of parameters. In a number of studies the non- linearities at 12 and 16 years of schooling have been empirically confirmed and interpreted as sheepskin effects. To allow for the discontinuity in the increasing of returns to education in diploma years, the above specification is often generalized by treating the relationship between the log wage and D(schooling) as a discontinuous spline function with discontinuities at D=8, 12, and 16. Operationally, three dummy variables D28, D2 12, D2 16, and the interaction term of them with D-8, D-12, and D-16 correspondingly are added to capture the sheepskin effect. Nevertheless, as mentioned before in the literature review, this specification also has potential flaws. First, individuals may not take their exams in the standard number of years and spend different amounts of time to finish their degree; some even will not get their degrees at the end, which might lead to a bias in the estimation of sheepskin effects. In addition, the education effect of going from a lower grade to a higher one may also be captured as part of the sheepskin effect.
20 We employ a data set drawn from the Microdata File of the Canadian Census Analyzer, which has information on both years of education and qualifications received. The estimating equation takes the form: x x In w, = a, + D, (schooling) + P, ~(~ualification) + AX + el, where there are strings of dummy variables for both qualifications and schooling years. But, there is an additional assumption from this specification, that the sheepskin effects associated with each qualification are the same regardless of the number of years of education spent obtain it. A more general approach is to include separate dummies for the interaction terms for each year of education and each qualification as well: I J i=1 j=1 D, (qualification) x Dj (schooling). In this framework, the marginal values of degrees are allowed to vary conditional on different years of education used to complete them. In addition, our data allow us to address the question of comparing sheepskin effects across demographic groups. The tables presented earlier showed both higher levels of education and poorer labour market outcomes for Chinese Immigrants in Canada compared to native-born Canadian. Discrimination is sometimes listed as a possible cause. Signalling models give a possible framework for understanding why labour markets may provide especially large incentives for some members of minority groups to acquire highlevel credentials while giving poorer incentives for others. We estimate separate diploma effects for native-born Canadian and Chinese Immigrants, and also by
21 sexes, then test for the differences across groups to see if minorities enjoy larger sheepskin effects for signals of high productivity. 4. Regression analysis: 4.1 Model Introduction and Estimation Results The dependent variable in all specifications reported is the log of annual earnings. Weeks worked per year is included to control for heterogeneous labour supply. The following variables are also included in all specifications: Legal marital status, years of experience and its square and a sex dummy Regressions on the Years of Schooling The first model reported includes years of schooling and its square. The results of this baseline model are presented in Table 15. While other independent variables all have the expected signs, we mainly focus on the coefficients of Years of Schooling and Years of Schooling Square. As in the literature, education has positive return. O(YS) is not only positive, but increases dramatically, when our sample group changes from native-born Canadian to Chinese Immigrants. It also increases as the age at immigration of Chinese immigrants gets larger. O(YSsq) has the same sign and changing tendency as O(YOS), but the difference between native-born Canadian and Chinese lmmigrants is not so large. There are several possible explanations. First, the positive difference between Chinese Immigrants and native-born
22 Canadians may be partly due to the greater credential effects experienced by Chinese lmmigrants in the labour market. O(YSsq) is also positive, which means that the rate of return to years of education is increasing in years of schooling. This can also be due to an increasing sheepskin effect together with years of education. Second, the difference between the estimated rate of return for Chinese lmmigrants and native-born Canadian may reflect ability bias. Chinese lmmigrants who immigrated after age 15 finished their middle school in China, where the competition for education is much hotter than in Canada, because of the large population and rare opportunities to enter a limited number of schools. These lmmigrants therefore may have been more highly selected on the basis of ability. But such an effect should not exist for Chinese lmmigrants group 1, and the difference of O between group 1 and the other two Chinese lmmigrants groups may be a reflection of it. There are also immigrant selection effects. From the supply side, Chinese lmmigrants usually have higher levels of unobserved ability than the general population, which enables them to immigrate to another country and keep almost the same or better level of living standard as in their home country. From the demand side, the point system of the Canadian Immigration policy favours the most skilled immigrants. However, it is also argued that sometimes the immigrant nonassessed classes (family and refugee) will dominate the point system. Those people fare worse than independent immigrants, which makes the average level
23 of unobserved ability lower. Thus, it is undetermined whether the differences are due to the selection bias of lmmigrants from China or not. Fourth, the difference in education quality between China and Canada cannot be neglected. The huge population and limited resources in China have made the various school examinations very important, and students are forced to do a lot of work and absorb as much knowledge as they can from very young ages. The strenuous study also makes the whole middle-school education system a relatively higher quality one than the relaxed Canadian education system. Therefore, the rate of return to education will be different between the two countries. However, this reason should not exist for Chinese lmmigrants Age Group 1 and part of Age Group 2, who immigrated at a very young age. From the above analysis, the sheepskin effect is a strong candidate in explaining the difference between Chinese lmmigrants in group 1 and nativeborn Canadian. We therefore want to test if there is any statistical difference in the sheepskin effect between Chinese lmmigrants and native-born Canadian Regressions on sheepskin effect For each group, we specify the following log-earnings function: Lnwage=Po + PI wkswkp + P2 (Legal marital status)+ps WORKEXP + P4 WORKEXPSQ + P5 (Secondarylhigh school graduation certificate or equivalent) 18 + Ps Bachelor +, Master + PBDoctorate + zfln n=6.5 (n years of schooling).
24 The data on the highest qualifications enable four dummy variables to be defined, distinguishing between high school certificate, Bachelor degree, Master degree and Earned Doctorate. The P coefficients estimate the marginal effect of each level of education, as compared with the excluded group who has no school qualifications. We use each dummy variable for years of completed education, so that the assumption that education enters the wage equation linearly or piece - wise linearly is relaxed and the amount of wage variation that can be explained by years of schooling is maximized. Leaving these dummy variables to capture any returns to schooling years, the qualification variables will capture any sheepskin effects (Jaeger and Page, 1996). The direct estimates of sheepskin effects are presented in Table 12. Because of the insufficient sample, we can only test on the English First Spoken group of native-born Canadian and Chinese Immigrants. It is apparent from the results of F- test in Table 12 that both years of education and highest qualification gained are relevant in explaining earnings, with the null hypothesis excluding each set of variables easily rejected (Pc.1) for all sample groups. Model, present the coefficients in the model that has dummy variables for each completed year of school and qualification. All of these qualifications earn their holders a statistically significant earnings premium as sheepskin effects, except for the Doctorate degrees. This last result probably reflects the small numbers of this group in the sample. For example, native-born Canadians who have high school qualifications have annual earnings that are 11.45% higher than those with the same number of years of education but with no such
25 qualifications, while Chinese lmmigrants earn 29.56%, %, and 25.54% higher respectively by Age at Immigration groups. For Bachelor's and Master's degrees, the earnings differentials are even larger. Model2 are coefficient estimates from a specification that only includes dummy variables for the number of years of schooling. If we interpret the dummy variables in this column as the total returns to education, and the coefficients in columns of Model 1 as the total return to education net of sheepskin effects, the difference between the two columns can be interpreted as part of the total return to education that is due to sheepskin effects (Jaeger and Page, 1996). The figures 9 through 12 plot the percentage earnings (Lnwage) increase implied by coefficients Model 1 and Model 2. For different groups we have different results. But normally, the difference between these two coefficients increases together with the years of education, and in the assumed credentialing years 12, 16 (we use years instead, due to our data limitation) and 18, the difference is outstandingly high. For example, sheepskin effect explains approximately a quarter of the return to 12 years of study for native-born Canadian, half of the total return to completing 12 years of study for Chinese lmmigrants Age Group 1, and more than one-third of Age Group 2. For Chinese Immigrants, especially Age Group 2 and 3, there is another year of outstandingly higher difference between P1 and 2, which is year 9. The data in Tables 9 through 11, which is the crosstabulation of highest degree received by completed years of education, show that in the Chinese lmmigrants Age Group 2 and 3, the percentages of individuals who finished their high school in year 9 are much higher than in native-born
26 Canadian and Chinese lmmigrants Age Group 1. Therefore, after adding in the credentials, the high school certificate will extract more returns as sheepskin effect from the year 9 schooling in Chinese lmmigrants Group 2 and 3 than the other two groups, which result in the larger difference between 81 and 82. This might be a support of the ability selection bias we mentioned before. 4.2 Differences in Sheepskin Effects across Ethnic Groups The literature on statistical discrimination suggests that sheepskin effects may vary across demographic groups if diplomas provide a stronger productivity signal for some groups than for others. Belman and Heywood (1991) predict that the sheepskin effects for minorities and women should be larger than those for white men using US data, starting with a model in which employers base expectations of worker productivity on the average productivity of the worker's racelsex group. However, they did not statistically test it. The analyses on the method of indirectly estimating sheepskin effects in our second and third section indicate that bias may be presented in the model Belman and Heywood used before, especially for our data here, which contains high deviations in the schooling years spent to complete a credential (please refer to Table 6 and relevant analysis). We therefore wish to know whether the hypothesis that sheepskin effects differ across demographic groups holds when estimated with actual indicators of diploma receipt on our data set, and also test it statistically. I present estimated diploma effects for native-born Canadian and Chinese lmmigrants with different age at immigration in Table 12. Tables 13 and 14 shows the tests for the equality of diploma effects between native-born 17
27 Canadian and all Chinese lmmigrants groups, and between Males and Females within each group separately. The model estimates one equation for each comparison hypothesis in Tables 13 and 14, with the effects for both comparable groups in one regression by interacting group dummy variables with each of the years of education and diploma dummy variables. The diploma variables are Secondarylhigh school graduation certificate or equivalent, Bachelor degree, Master degree and Doctorate degree, so that we can estimate the marginal effects over them. As in the literature, the model includes potential working experience and potential working experience squared; and also other independent variables as defined in section 4.1. We estimate separate intercepts for the comparable groups, and separate female dummy variables when based on both sexes, while the coefficients on the experience and other variables are restricted to be the same within each pair of comparable groups. Ontario requires the high school to be finished in the thirteenth year of schooling, which is one year more than in other provinces in Canada. This longer education may equip students with more skills, and thus make their return to credentials higher than students in other places. To test the difference, we interact the province dummy for Ontario with each credential and schooling years, for both native-born Canadian and Chinese lmmigrants group 1, who finished their high school within Canada. The results show that none of the coefficients on these interaction dummies is significant at the 2 percent significance level. The P-value of F- tests are.3236 and.8713 for Chinese lmmigrants and native-born Canadian respectively, which also indicate their joint
28 insignificance. Therefore, we can safely test the sheepskin effect over the whole sample. To set up the testing framework, it first must be determined whether the search for ethnic differences should be carried out separately for males and females. I do not found enough support for the hypothesis that the sheepskin effects are different by genders for all the credentials, as Belman and Heywood claimed before in their 1991 paper, although the intercept difference between genders are statistically significant across all the ethnic groups (pe.1). Therefore, I estimate regressions based on both sexes for sheepskin effects, and present the results in Table 12. Due to the insufficient sample, we cannot estimate and test the gender difference in Chinese lmmigrants Age Group 1. Because the gender difference in sheepskin effects do not have statistically significant and consistent pattern, I test the difference of sheepskin effects between native-born Canadian and Chinese lmmigrants Age Groups based on both sexes. We found that most of the differences between native-born Canadian and Chinese lmmigrants for Secondary, Bachelor and Master degrees are statistically significant in 1 percent level; some of the P-values are even less than.1 percent. Also bear in mind that our failure to reject some of the hypotheses of equality across the groups for diploma, such as the difference in master degree between native-born Canadian and Chinese lmmigrants groupl, may have resulted from the relatively small numbers of Chinese lmmigrants in these regressions. For Doctorate degree, the insignificant results maybe due to the too small number of holders. The F- tests can also statistically reject the
29 hypothesis that there are no differences in all degrees between each two comparable groups in 1 percent level. Table 12 shows that the sheepskin effects of all credentials are larger for Chinese lmmigrants than they are for native-born Canadians except for the Doctorate degree, which supports the hypothesis of statistical discrimination. For the Age Group 2 and 3 of Chinese Immigrants, this may be due to relatively poor language abilities, but for Age Group 1, since they immigrated into Canada as children and at least finished their High School here, language problems are unexisted, and the only difference is their ethnicity. Controlling for years of completed education, a High School certificate raises the annual earnings of a native-born Canadian percent, compared with the base group of those with no qualifications, while for a Chinese Immigrant from Age Group 1 the predicted increase in earnings is 23.6 percent, and even higher at 33.6 percent and percent for lmmigrants from Group 2 and 3. Group 1 have a 4 percent higher return than native-born Canadians for Bachelor degree, while the increase in earnings for immigrants from Groups 2 and 3 are not so large. The native-born Canadian Master's graduates earn percent more than those who receive only a Bachelor's degree and the difference for the three Chinese lmmigrants groups are 27.96%, 37.57% and 3.7% respectively. The difference in sheepskin effects means that all else equal, Chinese lmmigrants have to obtain higher credentials in order to signal their abilities to employers in the labour market. The fact that there may be a low supply and high demand for educated minority workers should not affect the inference of statistical discrimination
30 because such a supply/demand balance should also show up in the return to years of education and hence not affect the sheepskin effect per se (Belman and Heywood, 1991). In our sample, it does not seem likely that the higher signalling value of a qualification for Chinese lmmigrants reflects a high demand for or low supply of highly educated minority workers or even bilinguals and trilinguals of Chinese, since there is no statistically difference in the returns to advanced years of education for Chinese lmmigrants and native-born Canadians. I also find that the hypothesis that Chinese Immigrant workers get no return to accumulated years of education cannot be rejected at the 5 percent significance level for the first two groups (PI =.18, P2=.635), while the same hypothesis for native-born Canadian workers is conclusively rejected (P=.) (please refer to the F- test in last two rows of Table 12). Hence, the returns to education for Chinese lmmigrants may be due more to credentials, which means credentials may be more important than years of education for group 1 and 2. In contrast, the returns to education for native-born Canadian are due to both returns to accumulated years of education and returns to credentials, with similar importance. In the presence of more signalling effects for Chinese Immigrants, there may be more external costs of education for them. The reason is that if each individual fails to take account of the effect of their investment decisions on the market equilibrium, additional education obtained by individuals of a given ability will raise the education needed by the more able if they are to signal their greater talents and all else are equal, so a case can be made for interventions to raise
31 the private cost of education (Riley, 1979). We have already seen the increasing number of Chinese students in the graduate school in Canada. For example, more than one third of the graduate class in Simon Fraser University are Chinese, and there are also a potentially large number of Chinese candidate each semester as well. Their pursuing higher education due to the large sheepskin effect will affect the cost of education especially for postgraduate education. 5. Conclusion This paper is the first to use the sheepskin effects to test the hypotheses of statistical discrimination against Chinese people in the Canadian labour market. In drawing conclusions, our evidence suggests that education does not contribute to earnings solely by enhancing skills. The findings do suggest, however, that diplomas may serve as signals of productivity. Further, we argue that the signalling effects for minority people, particularly for Chinese Immigrants, are even larger, and the labour market value of degrees appears to exceed the returns to years of education for them. However, within demographic groups, we did not find significant differences between genders, in contrast to the results from Belman and Heywood (1991), which uses an indirect method to estimating the sheepskin effects.
32 Our test, which is to compare the earnings of those who have the degree and those who do not, conditional on both groups having the same number of years of schooling (Park, 1999) is much stronger than the indirect test. I would like to end with several notes of caution. First, in our model, we constrain the sheepskin effect associated with one diploma to be the same for all years of educational attainment. That is, we assume that the difference between those have 16 years of education without a bachelor degree and those have 16 years of education with a bachelor degree is the same as the difference between those have 17 years of education but no bachelor degree and those who have 17 years of education with a bachelor degree. As argued by Park (1999), we should test the robustness of our results by estimating a fully interacted model, with the interaction between each year of education and degree as a separate dummy variable. But due to the limited sample size of our data, we cannot run that regression. The assumption of the additive separability of schooling and experience - an assumption which has been shown to be far from innocuous (Card and Lemieux 21 ; Hechman, Lochner and Todd 21), can also be relaxed by the fully interacting dummy variables of schooling years with working experience. An obvious limitation of this strategy is that it will produce very noisy estimates in our sample as well. Another drawback is that, we cannot control for the difference in the individual's born ability and difference in the grown background. Only if we have the data on their parental education or similar information, then can we use it as a proxy for that.
33 Another note of caution is that the signalling hypothesis is not the only possible explanation for the presence of sheepskin effects. Chiswick (1973) points out that graduates are, on average, more efficient learners and that as a result they enjoy proportionately larger increases in productivity than their years of education alone would indicate. Thus, the sheepskin effect could arise from education increasing productivity and a self-selection process rather than signalling. Therefore, we could probably say in the Chinese lmmigrants Age Group 2 and 3, due to the large population and relatively rare education opportunities in China, the competition for obtaining higher levels of study is very intense. Individuals in these groups may be more intensely selected on ability than their foreign counterparts, which may lead to higher estimated returns to their diplomas. But for the Chinese Immigrants in Age Group 1, there should be no such explanation, since they finished most of their studies in Canada. The next step in this research would be to investigate the time path of sheepskin effects. That is, as tenure increases, the employers can directly observe the individual's productivity, which allows them to correct the wage. This then raises other interesting questions. How soon will the employers learn about the employee's true level of productivity? Is there any difference among ethnic groups? Will the sheepskin effects be diminishing or just remain the same on average? Unfortunately, our data do not contain enough information to allow these additional questions to be investigated. Doing so would require data on the true working experience of individuals, and also a larger sample size in order to further divide them into sub age groups.
34 28.12 Appendices AGE GROUP = -1 2 years AGE GROUP = years AGE GROUP = 25-6 years FOLP = Neither English Nor French ( '
35 Total 538 Table 2. Credential Fre HIGH SCHOOL AGE GROUP = O- 12 years AGE GROUP = years uency of Chinese Immigrants: FOLP = English First Spoken FOLP = French First Spoken FOLP = Both English and French FOL P = Neither English Nor French FOL P = English First SDoken ~ FOLP = French First S~oken Both Sex Frequency Percent Total Male Female Frequency Percent Total Frequency ( Percent I Nor French AGE GROUP = 25-6 years BACHELOR AGE GROUP = O- 12 years FOL P = English First Spoken FOLP = French First Spoken FOLP = Both English and French FOL P = Neither English Nor French AGEGROUP = years FOL P = English First Spoken


36 MASTER AGE GROUP = 25-6 years AGE GROUP = O- 12 years AGE GROUP = years AGE GROUP = 25-6 years FOLP = French First Spoken FOLP = Both English and French FOLP = Neither English Nor French FOLP = English First Spoken FOLP = French First Spoken FOL P = Both English and French FOL P = Neither English Nor French FOLP = English First Spoken FOLP = French First Spoken FOLP = Both English and French FOLP = Neither English Nor French FOLP = English First Spoken FOLP = French First Spoken FOLP = Both English and French FOLP = Neither English Nor French FOLP = English First Spoken FOLP = French First Spoken FOL P = Both English and French FOLP = Neither English Nor French Both Sex I Male I Female Total I Frequency I Percent I Total 1 Frequency I Percent I Total I I I I I I
37 GROUP = O- DOCTORATE \
38 Less than Grade 5 or never; 2: 5 to 8 years of schooling; 3: 9 years of schooling; 4: 1 years of schooling 11 years of schooling; 6: 12 years of schooling; 7: 13 years of schooling; 8: 14 to 17 years of schooling Table 3. Average Years of Education by Credentials FOLP = English ;chooling HlG H SCHOOL BACHELOR MASTER DOCTORATE FOLP = Both English and French FOLP = Neither I English Nor French 18 or more years of schooling


39 Avg Working Experience s Table 4. Descriotive of Native-born Canadian: Both 1 Sexes I Male Female A vg. A vg. Avg. wage Yfif of Years of Wage Education Education FOL P = English First S oken FOLP = French First Spoken FOL P = Both English and French FOLP = Neither English Nor French Table 5. Descr g 7 FOLP = English First Spoken FOLP = French First Spoken FOLP = Both English and - French FOL P = Neither English Nor French 3tive of Chinese Immigrants: Both 1 Sexes Male 9g Female Avg. wage YfiZ of Working Years of Education Ex erience Education Ex erience
40 Table 6. Cross-Tabulation of Highest Degree Received by Completed Years of Education Years of I High - School Education Frequency Percentage Less Than Bachelor I Master I Doctorate Frequency Percentage Frequency Percentage Frequency Percentage l8 or more Degree 1229 Total 1.
41 Table 7. Cross-Tabulation of Highest Degree Received by Completed Years of Education (Ontario) Years of Education Less Than 5 or Never 5 through or more Degree Total High School Frequency Percentage Bachelor Frequency Percentage Master Frequency Percentage Doctorate Frequency Percentage
42 Table 8. Cross-Tabulation of Highest Degree Received by Completed Years of Education (EFS Native-born Canadi Doctor Percentage OO:O Years of High School Bachelor Master Education Less Than 5 or Never 5 through or more Degree Total Frequency Percentage Frequency Percentage Frequency Percentage Frequency
43 Table 9. Cross-Tabulation of Highest Degree Received by Completed Years of Education (EFS Chinese Immigrants Age Group 1) Doctor Percentage Years of High School Bachelor Master Education Less Than 5 or Never 5 through or more Degree Total Frequency Percentage Frequency Percentage Frequency Percentage Frequency 1 4 5
44 Table 1. Cross-Tabulation of Highest Degree Received by Completed Years of Education (EFS Chinese Immigrants Age Group 2) Percentage Years of High School Bachelor Master Education Frequency I Percentage Frequency I Percentage Frequency / Percentage Doctor Frequency I Less Than 5 or Never 5 through or more Degree Total
45 Table 11. Cross-Tabulation of Highest Degree Received by Completed Years of Education (EFS Chinese Immigrants Age Group 3) Doctor Percentage Years of High School Bachelor Master Education Less Than 5 or Never 5 through or more Degree Total Frequency Percentage Frequency Percentage O 1. Frequency Percentage Frequency
46 Table 12. Estimated Diploma Effects for Ethnic Groups (Both Sexes) WKSWKP native-born Canadian English First Spoken (Both Sexes) I Chinese Immigrants Chinese Immigrants Chinese Immigrants AGEGR.391 )UP = -12 years AGEGROUP =13-24 years AGEGROUP =25-6 years Model2 Difference Model1 Modeb Difference Model1 Modeb Difference.388 ***.372 **.382 ***.48 ***.47 *** status WORKEXP I I I I *** *** *** WORKEXSQ *** *** *** Secondarylhigh school certificate or equivalent Bachelor's degree(s) *** *** Master's Earned doctorate I I 6.5 years * ** -.22 schooling ** 9 years ** ** o,16 schooling 1 years o.246 schooling * t l1 years schooling ** 12 years
47 schooling 13 years schooling years schooling 18 or more years of schooling Female (Constant) F- Test English First Spoken (Both Sexes) I Chinese lmniigrants 1 Chinese Immigrants I Chinese Immigrants native-born Canadian I I I Model1 I Modeb * * *** *** ** ** *** *** *** *** AGEGROUP := -12 years AGEGROUP =13-24 years AGEGROUP =25-6( Difference Model1 I Modeb I Difference Model1 1 Model2 *** *** *** *** I I I I (ears Difference For vears of s~ chooling: For years of schooling: For years of For years of schooling: P=. P=O.OOOO P=.635 For credentials: P=. For credentials: P=. Note: *: Significant at 1% **: Significant at 5% ***: Significant at 1 %
48 Table 13. Hypothesis Test for Diploma Effects: Equality Across Groups Credential Chinese lmmigrants Male=Chinese lmmigrants Female (Age Group 2) Hypothesis Chinese Immigrants Male=Chinese I lmmiarants Female Native-born Canadian Male= native-born Canadian Female Secondaryhigh school graduation certificate or eauivalent Bachelor t-statistics (Probability) t-statistics (Probability) (.1713) (.8828) (.81 12) (.254) Master Doctorate All Degrees t-statistics (Probability) t-statistics (Probability) F- test F-statistics (Probability) (.7781).7 (.9442).4899 (.7432).9143 (.366).4565 (.648) (.1 3) (.364) (.742) (.859) (.876) (.442)
49 Table 14. Hypothesis Test for Diploma Effects: Equality Across Groups c Credential -- INative-born CanadianShinese Immigrants Age Group Secondarythigh school graduation certificate or equivalent. H othesis Native-born Native-born CanadianShinese CanadianShinese lmmigrants Age Group Immigrants Age Group Bachelor Master Doctorate All Degrees
50 I AGEGROUP = -12 I AGEGROUP =13-24 I AGEGROUP =25-6 t-probabilitv I I t -Probabilitv 1 I t-probabilitv 1 I t -Probabilitv Table 15. Regressions on Years of Schooling I English First Spoken (Both Sexes) native-born Chinese Immigrants Chinese Immigrants Chinese Immigrants Legal marital status WORKEXP.7949 WORKEXSQ Female Schooling I Years Of 1 Square I (Constant) (
51 Figure 1. Average Weekly Wage of Chinese lmmigrants Ave. Weekly Wage of Chinese lmmigrants Aq. Wage of Both Sexes A q. Wage of Male Aq. Wage of Female Age at Immigration and First Official Language Spoken
52 Figure 2. Average Years of Education of Chinese lmmigrants Ave. Years of Education of Chinese lmmigrants Age at Immigration and First Official Language Spoken A=. Years of Education of Both Sexes Am. Years of Education of Males Am. Years of Education of Females
53 Figure 3. Average Working Experience of Chinese lmmigrants ul Ave. Working Experience of Chinese lmmigrants PAW Working Experience of Both Sexes 1 A w Working Experience ofmales A= Working Experience Age at Immigration and First Official Language Spoken
54 Figure 4. Chinese Immigrants Education Credentials of Both Sexes Educational Credentials of Both Sexes SECSCHCF BACHELOR MASTER DOCTOR Age at Immigration and First Official Language Spoken
55 Figure 5. Chinese Immigrants Education Credentials of Males Educational Credentials of Males SECSCHCF BACHELOR MASTER DOCTOR Age at Immigration and First Official Language Spoken
56 Figure 6. Chinese Immigrants Education Credentials of Females Educational Credentials of Females fl SECSCHCF BACHELOR MASTER DOCTOR Age at Immigration and First Official Language Spoken
57 Figure 7. Average Years of Education by Credentials Avg. Years of Education by Credential No degree BACHELOR DOCTOR Credential FOLP = English First Spoken FOLP = French First Spoken FOLP = Both English and French FOLP = Neither English Nor French
58 Figure 8. Average Education and Working Experience Comparison Between Native-born Canadian and Chinese lmmigrants Ave. Education, Ave. Working Comparation between Native Ci Chinese lmmigrants by s Male Natie Canadian Aw. Years of Education rn Male Chinese lmmigrants Aw. Years of Education Female Natie Canadian Aw. Years of Education Female Chinese lmmigrants Aw. Years of Education rn Male Natie Canadian A- Working Experience Male Chinese lmmigrants Aw Working Experience rn Female Natie Canadian Aw Working Experience Catagory Female Chinese Immigrants A e Working Experience

59 Model 1 Figure 9. Total Return to Completed Years of Education for Native-born Canadian G6 G9 GI GI1 G12 GI3 G14 G18 Grade
60

61 Figure 11. Total Return to Completed Years of Education for Chinese Immigrants Age group 2. 1 Model 2 1 Model Grade
Explaining the Deteriorating Entry Earnings of Canada s Immigrant Cohorts:
 Explaining the Deteriorating Entry Earnings of Canada s Immigrant Cohorts: 1966-2000 Abdurrahman Aydemir Family and Labour Studies Division Statistics Canada aydeabd@statcan.ca 613-951-3821 and Mikal Skuterud
Education, Credentials and Immigrant Earnings*
 Education, Credentials and Immigrant Earnings* Ana Ferrer Department of Economics University of British Columbia and W. Craig Riddell Department of Economics University of British Columbia August 2004
A COMPARISON OF EARNINGS OF CHINESE AND INDIAN IMMIGRANTS IN CANADA: AN ANALYSIS OF THE EFFECT OF LANGUAGE ABILITY. Aaramya Nath
 A COMPARISON OF EARNINGS OF CHINESE AND INDIAN IMMIGRANTS IN CANADA: AN ANALYSIS OF THE EFFECT OF LANGUAGE ABILITY by Aaramya Nath Submitted in partial fulfilment of the requirements for the degree of
The wage gap between the public and the private sector among. Canadian-born and immigrant workers
 The wage gap between the public and the private sector among Canadian-born and immigrant workers By Kaiyu Zheng (Student No. 8169992) Major paper presented to the Department of Economics of the University
Languages of work and earnings of immigrants in Canada outside. Quebec. By Jin Wang ( )
") Languages of work and earnings of immigrants in Canada outside Quebec By Jin Wang (7356764) Major paper presented to the Department of Economics of the University of Ottawa in partial fulfillment of the
Languages of work and earnings of immigrants in Canada outside Quebec By Jin Wang (7356764) Major paper presented to the Department of Economics of the University of Ottawa in partial fulfillment of the
Language Proficiency and Earnings of Non-Official Language. Mother Tongue Immigrants: The Case of Toronto, Montreal and Quebec City
 Language Proficiency and Earnings of Non-Official Language Mother Tongue Immigrants: The Case of Toronto, Montreal and Quebec City By Yinghua Song Student No. 6285600 Major paper presented to the department
EFFECTS OF ONTARIO S IMMIGRATION POLICY ON YOUNG NON- PERMANENT RESIDENTS BETWEEN 2001 AND Lu Lin
 EFFECTS OF ONTARIO S IMMIGRATION POLICY ON YOUNG NON- PERMANENT RESIDENTS BETWEEN 2001 AND 2006 by Lu Lin Submitted in partial fulfillment of the requirements for the degree of Master of Arts at Dalhousie
Gender Gap of Immigrant Groups in the United States
 The Park Place Economist Volume 11 Issue 1 Article 14 2003 Gender Gap of Immigrant Groups in the United States Desislava Hristova '03 Illinois Wesleyan University Recommended Citation Hristova '03, Desislava
This analysis confirms other recent research showing a dramatic increase in the education level of newly
 CENTER FOR IMMIGRATION STUDIES April 2018 Better Educated, but Not Better Off A look at the education level and socioeconomic success of recent immigrants, to By Steven A. Camarota and Karen Zeigler This
Immigrant Legalization
 Technical Appendices Immigrant Legalization Assessing the Labor Market Effects Laura Hill Magnus Lofstrom Joseph Hayes Contents Appendix A. Data from the 2003 New Immigrant Survey Appendix B. Measuring
Non-Voted Ballots and Discrimination in Florida
 Non-Voted Ballots and Discrimination in Florida John R. Lott, Jr. School of Law Yale University 127 Wall Street New Haven, CT 06511 (203) 432-2366 john.lott@yale.edu revised July 15, 2001 * This paper
The Labour Market Performance of Immigrant and. Canadian-born Workers by Age Groups. By Yulong Hou ( )
") The Labour Market Performance of Immigrant and Canadian-born Workers by Age Groups By Yulong Hou (7874222) Major paper presented to the Department of Economics of the University of Ottawa in partial fulfillment
The Labour Market Performance of Immigrant and Canadian-born Workers by Age Groups By Yulong Hou (7874222) Major paper presented to the Department of Economics of the University of Ottawa in partial fulfillment
Do Highly Educated Immigrants Perform Differently in the Canadian and U.S. Labour Markets?
 Catalogue no. 11F0019M No. 329 ISSN 1205-9153 ISBN 978-1-100-17669-7 Research Paper Analytical Studies Branch Research Paper Series Do Highly Educated Immigrants Perform Differently in the Canadian and
Latin American Immigration in the United States: Is There Wage Assimilation Across the Wage Distribution?
 Latin American Immigration in the United States: Is There Wage Assimilation Across the Wage Distribution? Catalina Franco Abstract This paper estimates wage differentials between Latin American immigrant
Why are the Relative Wages of Immigrants Declining? A Distributional Approach* Brahim Boudarbat, Université de Montréal
 Preliminary and incomplete Comments welcome Why are the Relative Wages of Immigrants Declining? A Distributional Approach* Brahim Boudarbat, Université de Montréal Thomas Lemieux, University of British
A Study of the Earning Profiles of Young and Second Generation Immigrants in Canada by Tianhui Xu ( )
") A Study of the Earning Profiles of Young and Second Generation Immigrants in Canada by Tianhui Xu (6544402) Major paper presented to the Department of Economics of the University of Ottawa in partial fulfillment
A Study of the Earning Profiles of Young and Second Generation Immigrants in Canada by Tianhui Xu (6544402) Major paper presented to the Department of Economics of the University of Ottawa in partial fulfillment
Family Ties, Labor Mobility and Interregional Wage Differentials*
 Family Ties, Labor Mobility and Interregional Wage Differentials* TODD L. CHERRY, Ph.D.** Department of Economics and Finance University of Wyoming Laramie WY 82071-3985 PETE T. TSOURNOS, Ph.D. Pacific
Labor Market Dropouts and Trends in the Wages of Black and White Men
 Industrial & Labor Relations Review Volume 56 Number 4 Article 5 2003 Labor Market Dropouts and Trends in the Wages of Black and White Men Chinhui Juhn University of Houston Recommended Citation Juhn,
The effect of age at immigration on the earnings of immigrants: Estimates from a two-stage model
 The effect of age at immigration on the earnings of immigrants: Estimates from a two-stage model By Chang Dong Student No. 6586955 Major paper presented to the Department of Economics of the University
Native-Immigrant Differences in Inter-firm and Intra-firm Mobility Evidence from Canadian Linked Employer-Employee Data
 Native-Immigrant Differences in Inter-firm and Intra-firm Mobility Evidence from Canadian Linked Employer-Employee Data Mohsen Javdani a Department of Economics University of British Columbia Okanagan
Labour Market Institutions and Outcomes: A Cross-National Study
 Labour Market Institutions and Outcomes: A Cross-National Study CILN is a collaborative research venture between the Social Sciences and Humanities Research Council (SSHRC) and McMaster University. Additional
School Performance of the Children of Immigrants in Canada,
 School Performance of the Children of Immigrants in Canada, 1994-98 by Christopher Worswick * No. 178 11F0019MIE No. 178 ISSN: 1205-9153 ISBN: 0-662-31229-5 Department of Economics, Carleton University
Economic assimilation of Mexican and Chinese immigrants in the United States: is there wage convergence?
 Illinois Wesleyan University From the SelectedWorks of Michael Seeborg 2012 Economic assimilation of Mexican and Chinese immigrants in the United States: is there wage convergence? Michael C. Seeborg,
Residual Wage Inequality: A Re-examination* Thomas Lemieux University of British Columbia. June Abstract
 Residual Wage Inequality: A Re-examination* Thomas Lemieux University of British Columbia June 2003 Abstract The standard view in the literature on wage inequality is that within-group, or residual, wage
Minority Earnings Disparity. Krishna Pendakur and Ravi Pendakur Simon Fraser University and University of Ottawa
 Minority Earnings Disparity 1995-2005 Krishna Pendakur and Ravi Pendakur Simon Fraser University and University of Ottawa Introduction What happened to visible minority and Aboriginal earnings disparity
Refugee Versus Economic Immigrant Labor Market Assimilation in the United States: A Case Study of Vietnamese Refugees
 The Park Place Economist Volume 25 Issue 1 Article 19 2017 Refugee Versus Economic Immigrant Labor Market Assimilation in the United States: A Case Study of Vietnamese Refugees Lily Chang Illinois Wesleyan
Self-selection and return migration: Israeli-born Jews returning home from the United States during the 1980s
 Population Studies, 55 (2001), 79 91 Printed in Great Britain Self-selection and return migration: Israeli-born Jews returning home from the United States during the 1980s YINON COHEN AND YITCHAK HABERFELD
Gender wage gap among Canadian-born and immigrant workers. with respect to visible minority status
 Gender wage gap among Canadian-born and immigrant workers with respect to visible minority status By Manru Zhou (7758303) Major paper presented to the Department of Economics of the University of Ottawa
Wage Discrimination between White and Visible Minority Immigrants in the Canadian Manufacturing Sector
 Université de Montréal Rapport de Recherche Wage Discrimination between White and Visible Minority Immigrants in the Canadian Manufacturing Sector Rédigé par: Lands, Bena Dirigé par: Richelle, Yves Département
Chapter One: people & demographics
 Chapter One: people & demographics The composition of Alberta s population is the foundation for its post-secondary enrolment growth. The population s demographic profile determines the pressure points
THREE ESSAYS ON THE BLACK WHITE WAGE GAP
 University of Kentucky UKnowledge University of Kentucky Doctoral Dissertations Graduate School 2009 THREE ESSAYS ON THE BLACK WHITE WAGE GAP Nola Ogunro University of Kentucky, nogun2@uky.edu Click here
Benefit levels and US immigrants welfare receipts
 1 Benefit levels and US immigrants welfare receipts 1970 1990 by Joakim Ruist Department of Economics University of Gothenburg Box 640 40530 Gothenburg, Sweden joakim.ruist@economics.gu.se telephone: +46
Rethinking the Area Approach: Immigrants and the Labor Market in California,
 Rethinking the Area Approach: Immigrants and the Labor Market in California, 1960-2005. Giovanni Peri, (University of California Davis, CESifo and NBER) October, 2009 Abstract A recent series of influential
CROSS-COUNTRY VARIATION IN THE IMPACT OF INTERNATIONAL MIGRATION: CANADA, MEXICO, AND THE UNITED STATES
 CROSS-COUNTRY VARIATION IN THE IMPACT OF INTERNATIONAL MIGRATION: CANADA, MEXICO, AND THE UNITED STATES Abdurrahman Aydemir Statistics Canada George J. Borjas Harvard University Abstract Using data drawn
Returns to Education in the Albanian Labor Market
 Returns to Education in the Albanian Labor Market Dr. Juna Miluka Department of Economics and Finance, University of New York Tirana, Albania Abstract The issue of private returns to education has received
The Impact of Interprovincial Migration on Aggregate Output and Labour Productivity in Canada,
 The Impact of Interprovincial Migration on Aggregate Output and Labour Productivity in Canada, 1987-26 Andrew Sharpe, Jean-Francois Arsenault, and Daniel Ershov 1 Centre for the Study of Living Standards
English Deficiency and the Native-Immigrant Wage Gap
 DISCUSSION PAPER SERIES IZA DP No. 7019 English Deficiency and the Native-Immigrant Wage Gap Alfonso Miranda Yu Zhu November 2012 Forschungsinstitut zur Zukunft der Arbeit Institute for the Study of Labor
IS THE MEASURED BLACK-WHITE WAGE GAP AMONG WOMEN TOO SMALL? Derek Neal University of Wisconsin Presented Nov 6, 2000 PRELIMINARY
 IS THE MEASURED BLACK-WHITE WAGE GAP AMONG WOMEN TOO SMALL? Derek Neal University of Wisconsin Presented Nov 6, 2000 PRELIMINARY Over twenty years ago, Butler and Heckman (1977) raised the possibility
The Impact of Education on Economic and Social Outcomes: An Overview of Recent Advances in Economics*
 The Impact of Education on Economic and Social Outcomes: An Overview of Recent Advances in Economics* W. Craig Riddell Department of Economics University of British Columbia December, 2005 Revised February
The Transmission of Women s Fertility, Human Capital and Work Orientation across Immigrant Generations
 DISCUSSION PAPER SERIES IZA DP No. 3732 The Transmission of Women s Fertility, Human Capital and Work Orientation across Immigrant Generations Francine D. Blau Lawrence M. Kahn Albert Yung-Hsu Liu Kerry
Employment Rate Gaps between Immigrants and Non-immigrants in. Canada in the Last Three Decades
 Employment Rate Gaps between Immigrants and Non-immigrants in Canada in the Last Three Decades By Hao Lu Student No. 7606307 Major paper presented to the department of economics of the University of Ottawa
Employment outcomes of postsecondary educated immigrants, 2006 Census
 Employment outcomes of postsecondary educated immigrants, 2006 Census Li Xue and Li Xu September 2010 Research and Evaluation The views and opinions expressed in this document are those of the author(s)
Canadian Labour Market and Skills Researcher Network
 Canadian Labour Market and Skills Researcher Network Working Paper No. 29 The Effect of Immigrant Selection and the IT Bust on the Entry Earnings of Immigrants Garnett Picot Statistics Canada Feng Hou
Immigration and Internal Mobility in Canada Appendices A and B. Appendix A: Two-step Instrumentation strategy: Procedure and detailed results
 Immigration and Internal Mobility in Canada Appendices A and B by Michel Beine and Serge Coulombe This version: February 2016 Appendix A: Two-step Instrumentation strategy: Procedure and detailed results
Determinants of Return Migration to Mexico Among Mexicans in the United States
 Determinants of Return Migration to Mexico Among Mexicans in the United States J. Cristobal Ruiz-Tagle * Rebeca Wong 1.- Introduction The wellbeing of the U.S. population will increasingly reflect the
The Employment of Low-Skilled Immigrant Men in the United States
 American Economic Review: Papers & Proceedings 2012, 102(3): 549 554 http://dx.doi.org/10.1257/aer.102.3.549 The Employment of Low-Skilled Immigrant Men in the United States By Brian Duncan and Stephen
7 ETHNIC PARITY IN INCOME SUPPORT
 7 ETHNIC PARITY IN INCOME SUPPORT Summary of findings For customers who, in 2003, had a Work Focused Interview as part of an IS claim: There is evidence, for Ethnic Minorities overall, of a significant
DOES POST-MIGRATION EDUCATION IMPROVE LABOUR MARKET PERFORMANCE?: Finding from Four Cities in Indonesia i
 DOES POST-MIGRATION EDUCATION IMPROVE LABOUR MARKET PERFORMANCE?: Finding from Four Cities in Indonesia i Devanto S. Pratomo Faculty of Economics and Business Brawijaya University Introduction The labour
Canadian Labour Market and Skills Researcher Network
 Canadian Labour Market and Skills Researcher Network Working Paper No. 69 Immigrant Earnings Growth: Selection Bias or Real Progress? Garnett Picot Statistics Canada Patrizio Piraino Statistics Canada
Inequality in the Labor Market for Native American Women and the Great Recession
 Inequality in the Labor Market for Native American Women and the Great Recession Jeffrey D. Burnette Assistant Professor of Economics, Department of Sociology and Anthropology Co-Director, Native American
The Impact of Legal Status on Immigrants Earnings and Human. Capital: Evidence from the IRCA 1986
 The Impact of Legal Status on Immigrants Earnings and Human Capital: Evidence from the IRCA 1986 February 5, 2010 Abstract This paper analyzes the impact of IRCA 1986, a U.S. amnesty, on immigrants human
Volume 35, Issue 1. An examination of the effect of immigration on income inequality: A Gini index approach
 Volume 35, Issue 1 An examination of the effect of immigration on income inequality: A Gini index approach Brian Hibbs Indiana University South Bend Gihoon Hong Indiana University South Bend Abstract This
GEORG-AUGUST-UNIVERSITÄT GÖTTINGEN
 GEORG-AUGUST-UNIVERSITÄT GÖTTINGEN FACULTY OF ECONOMIC SCIENCES CHAIR OF MACROECONOMICS AND DEVELOPMENT Bachelor Seminar Economics of the very long run: Economics of Islam Summer semester 2017 Does Secular
Immigrant Employment and Earnings Growth in Canada and the U.S.: Evidence from Longitudinal data
 Immigrant Employment and Earnings Growth in Canada and the U.S.: Evidence from Longitudinal data Neeraj Kaushal, Columbia University Yao Lu, Columbia University Nicole Denier, McGill University Julia Wang,
IMMIGRANT UNEMPLOYMENT: THE AUSTRALIAN EXPERIENCE* Paul W. Miller and Leanne M. Neo. Department of Economics The University of Western Australia
 IMMIGRANT UNEMPLOYMENT: THE AUSTRALIAN EXPERIENCE* by Paul W. Miller and Leanne M. Neo Department of Economics The University of Western Australia * This research was supported by a grant from the Australian
Wage Structure and Gender Earnings Differentials in China and. India*
 Wage Structure and Gender Earnings Differentials in China and India* Jong-Wha Lee # Korea University Dainn Wie * National Graduate Institute for Policy Studies September 2015 * Lee: Economics Department,
Research Article Ethnic Disparities in the Graduate Labour Market
 Economics Research International Volume 2012, Article ID 836379, 17 pages doi:10.1155/2012/836379 Research Article Ethnic Disparities in the Graduate Labour Market Aslan Zorlu Department of Human Geography,
Population Aging, Immigration and Future Labor Shortage : Myths and Virtual Reality
 Population Aging, Immigration and Future Labor Shortage : Myths and Virtual Reality Alain Bélanger Speakers Series of the Social Statistics Program McGill University, Montreal, January 23, 2013 Montréal,
English Deficiency and the Native-Immigrant Wage Gap in the UK
 English Deficiency and the Native-Immigrant Wage Gap in the UK Alfonso Miranda a Yu Zhu b,* a Department of Quantitative Social Science, Institute of Education, University of London, UK. Email: A.Miranda@ioe.ac.uk.
NBER WORKING PAPER SERIES HOMEOWNERSHIP IN THE IMMIGRANT POPULATION. George J. Borjas. Working Paper
 NBER WORKING PAPER SERIES HOMEOWNERSHIP IN THE IMMIGRANT POPULATION George J. Borjas Working Paper 8945 http://www.nber.org/papers/w8945 NATIONAL BUREAU OF ECONOMIC RESEARCH 1050 Massachusetts Avenue Cambridge,
Canadian Labour Market and Skills Researcher Network
 Canadian Labour Market and Skills Researcher Network Working Paper No. 48 Seeking Success in Canada and the United States: the Determinants of Labour Market Outcomes Among the Children of Immigrants Garnett
The Impact of Unionization on the Wage of Hispanic Workers. Cinzia Rienzo and Carlos Vargas-Silva * This Version, May 2015.
 The Impact of Unionization on the Wage of Hispanic Workers Cinzia Rienzo and Carlos Vargas-Silva * This Version, May 2015 Abstract This paper explores the role of unionization on the wages of Hispanic
Immigrant Employment by Field of Study. In Waterloo Region
 Immigrant Employment by Field of Study In Waterloo Region Table of Contents Executive Summary..........................................................1 Waterloo Region - Part 1 Immigrant Educational Attainment
Roles of children and elderly in migration decision of adults: case from rural China
 Roles of children and elderly in migration decision of adults: case from rural China Extended abstract: Urbanization has been taking place in many of today s developing countries, with surging rural-urban
Determinants of Highly-Skilled Migration Taiwan s Experiences
 Working Paper Series No.2007-1 Determinants of Highly-Skilled Migration Taiwan s Experiences by Lee-in Chen Chiu and Jen-yi Hou July 2007 Chung-Hua Institution for Economic Research 75 Chang-Hsing Street,
Telephone Survey. Contents *
 Telephone Survey Contents * Tables... 2 Figures... 2 Introduction... 4 Survey Questionnaire... 4 Sampling Methods... 5 Study Population... 5 Sample Size... 6 Survey Procedures... 6 Data Analysis Method...
Gender Variations in the Socioeconomic Attainment of Immigrants in Canada
 Gender Variations in the Socioeconomic Attainment of Immigrants in Canada Md Kamrul Islam Doctoral Candidate in Sociology, University of Alberta, Canada E-mail: mdkamrul@ualberta.ca Accepted: August 17,
SPECIAL REPORT. TD Economics ABORIGINAL WOMEN OUTPERFORMING IN LABOUR MARKETS
 SPECIAL REPORT TD Economics ABORIGINAL WOMEN OUTPERFORMING IN LABOUR MARKETS Highlights Aboriginal women living off-reserve have bucked national trends, with employment rates rising since 2007 alongside
Permanent Disadvantage or Gradual Integration: Explaining the Immigrant-Native Earnings Gap in Sweden
 Permanent Disadvantage or Gradual Integration: Explaining the Immigrant-Native Earnings Gap in Sweden Carl le Grand and Ryszard Szulkin ABSTRACT Theoretical explanations suggest that wage differentials
Immigrant-native wage gaps in time series: Complementarities or composition effects?
 Immigrant-native wage gaps in time series: Complementarities or composition effects? Joakim Ruist Department of Economics University of Gothenburg Box 640 405 30 Gothenburg, Sweden joakim.ruist@economics.gu.se
DETERMINANTS OF IMMIGRANTS EARNINGS IN THE ITALIAN LABOUR MARKET: THE ROLE OF HUMAN CAPITAL AND COUNTRY OF ORIGIN
 DETERMINANTS OF IMMIGRANTS EARNINGS IN THE ITALIAN LABOUR MARKET: THE ROLE OF HUMAN CAPITAL AND COUNTRY OF ORIGIN Aim of the Paper The aim of the present work is to study the determinants of immigrants
The Determinants and the Selection. of Mexico-US Migrations
 The Determinants and the Selection of Mexico-US Migrations J. William Ambrosini (UC, Davis) Giovanni Peri, (UC, Davis and NBER) This draft March 2011 Abstract Using data from the Mexican Family Life Survey
THE IMMIGRANT WAGE DIFFERENTIAL WITHIN AND ACROSS ESTABLISHMENTS. ABDURRAHMAN AYDEMIR and MIKAL SKUTERUD* [FINAL DRAFT]
![THE IMMIGRANT WAGE DIFFERENTIAL WITHIN AND ACROSS ESTABLISHMENTS. ABDURRAHMAN AYDEMIR and MIKAL SKUTERUD* [FINAL DRAFT]](/thumbs/89/97777157.jpg "THE IMMIGRANT WAGE DIFFERENTIAL WITHIN AND ACROSS ESTABLISHMENTS. ABDURRAHMAN AYDEMIR and MIKAL SKUTERUD* [FINAL DRAFT]") THE IMMIGRANT WAGE DIFFERENTIAL WITHIN AND ACROSS ESTABLISHMENTS ABDURRAHMAN AYDEMIR and MIKAL SKUTERUD* [FINAL DRAFT] *Abdurrahman Aydemir is Assistant Professor, Faculty of Arts and Social Sciences,
THE IMMIGRANT WAGE DIFFERENTIAL WITHIN AND ACROSS ESTABLISHMENTS ABDURRAHMAN AYDEMIR and MIKAL SKUTERUD* [FINAL DRAFT] *Abdurrahman Aydemir is Assistant Professor, Faculty of Arts and Social Sciences,
Religious Diversity and Labour Market Attainment: Nova Scotia and New Brunswick, Jason Dean and Maryam Dilmaghani
 Religious Diversity and Labour Market Attainment: Nova Scotia and New Brunswick, 1911-2011 Jason Dean and Maryam Dilmaghani The examination of the earnings gap between genders and among racial and ethnic
Retrospective Voting
 Retrospective Voting Who Are Retrospective Voters and Does it Matter if the Incumbent President is Running Kaitlin Franks Senior Thesis In Economics Adviser: Richard Ball 4/30/2009 Abstract Prior literature
The Economic and Social Outcomes of Children of Migrants in New Zealand
 The Economic and Social Outcomes of Children of Migrants in New Zealand Julie Woolf Statistics New Zealand Julie.Woolf@stats.govt.nz, phone (04 931 4781) Abstract This paper uses General Social Survey
Immigrant Families in the Canadian Labour Market
 378 Christopher Worswick Immigrant Families in the Canadian Labour Market CHRISTOPHER WORSWICK Department of Economics University of Melbourne Melbourne, Australia Nous comparons les activités des couples
THE MUSLIM EFFECT: WAGE DIFFERENTIALS IN THE CANADIAN LABOUR MARKET
 THE MUSLIM EFFECT: WAGE DIFFERENTIALS IN THE CANADIAN LABOUR MARKET by Raged Anwar BS Business Administration, University of Texas at Dallas PROJECT SUBMITTED IN PARTIAL FULFILLMENT OF THE REQUIREMENTS
THREE ESSAYS IN EMPIRICAL LABOUR ECONOMICS. Miroslav Kučera. A Thesis. In the Department. Economics
 THREE ESSAYS IN EMPIRICAL LABOUR ECONOMICS Miroslav Kučera A Thesis In the Department of Economics Presented in Partial Fulfillment of the Requirements For the Degree of Doctor of Philosophy Concordia
Remittances and the Brain Drain: Evidence from Microdata for Sub-Saharan Africa
 Remittances and the Brain Drain: Evidence from Microdata for Sub-Saharan Africa Julia Bredtmann 1, Fernanda Martinez Flores 1,2, and Sebastian Otten 1,2,3 1 RWI, Rheinisch-Westfälisches Institut für Wirtschaftsforschung
Living in the Shadows or Government Dependents: Immigrants and Welfare in the United States
 Living in the Shadows or Government Dependents: Immigrants and Welfare in the United States Charles Weber Harvard University May 2015 Abstract Are immigrants in the United States more likely to be enrolled
The Impact of Unionization on the Wage of Hispanic Workers. Cinzia Rienzo and Carlos Vargas-Silva * This Version, December 2014.
 The Impact of Unionization on the Wage of Hispanic Workers Cinzia Rienzo and Carlos Vargas-Silva * This Version, December 2014 Abstract This paper explores the role of unionization on the wages of Hispanic
WAGE PREMIA FOR EDUCATION AND LOCATION, BY GENDER AND RACE IN SOUTH AFRICA * Germano Mwabu University of Nairobi. T. Paul Schultz Yale University
 WAGE PREMIA FOR EDUCATION AND LOCATION, BY GENDER AND RACE IN SOUTH AFRICA * Germano Mwabu University of Nairobi T. Paul Schultz Yale University February 6, 1998 We have benefited from the comments of
Family Ties, Labor Mobility and Interregional Wage Differentials*
 JRAP (2001)31:1 Family Ties, Labor Mobility and Interregional Wage Differentials* Todd L. Cherry, Ph.D. and Pete T. Tsournos, Ph.D.** Abstract. The applied research reported here examines the impact of
Transferability of Skills, Income Growth and Labor Market Outcomes of Recent Immigrants in the United States. Karla Diaz Hadzisadikovic*
 Transferability of Skills, Income Growth and Labor Market Outcomes of Recent Immigrants in the United States Karla Diaz Hadzisadikovic* * This paper is part of the author s Ph.D. Dissertation in the Program
The Causes of Wage Differentials between Immigrant and Native Physicians
 The Causes of Wage Differentials between Immigrant and Native Physicians I. Introduction Current projections, as indicated by the 2000 Census, suggest that racial and ethnic minorities will outnumber non-hispanic
Schooling and Cohort Size: Evidence from Vietnam, Thailand, Iran and Cambodia. Evangelos M. Falaris University of Delaware. and
 Schooling and Cohort Size: Evidence from Vietnam, Thailand, Iran and Cambodia by Evangelos M. Falaris University of Delaware and Thuan Q. Thai Max Planck Institute for Demographic Research March 2012 2
Labor Supply of Married Couples in the Formal and Informal Sectors in Thailand
 Labor Supply of Married Couples in the Formal and Informal Sectors in Thailand Chairat Aemkulwat * Abstract This paper estimates multi-sector labor supply and offered wage as well as participation choice
LABOUR-MARKET INTEGRATION OF IMMIGRANTS IN OECD-COUNTRIES: WHAT EXPLANATIONS FIT THE DATA?
 LABOUR-MARKET INTEGRATION OF IMMIGRANTS IN OECD-COUNTRIES: WHAT EXPLANATIONS FIT THE DATA? By Andreas Bergh (PhD) Associate Professor in Economics at Lund University and the Research Institute of Industrial
Transitions to Work for Racial, Ethnic, and Immigrant Groups
 Transitions to Work for Racial, Ethnic, and Immigrant Groups Deborah Reed Christopher Jepsen Laura E. Hill Public Policy Institute of California Preliminary draft, comments welcome Draft date: March 1,
Introduction. Ability, Effort, and Chance. Compensating Differentials. In this chapter, look for the answers to these questions:
 19 Earnings and Discrimination P R I N C I P L E S O F MICROECONOMICS FOURTH EDITION N. GREGORY MANKIW Premium PowerPoint Slides by Ron Cronovich 2007 update 2008 Thomson South-Western, all rights reserved
EMMA NEUMAN 2016:11. Performance and job creation among self-employed immigrants and natives in Sweden
 EMMA NEUMAN 2016:11 Performance and job creation among self-employed immigrants and natives in Sweden Performance and job creation among self-employed immigrants and natives in Sweden Emma Neuman a Abstract
Aboriginals as Unwilling Immigrants: Contact, Assimilation and Labour Market Outcomes *
 Aboriginals as Unwilling Immigrants: Contact, Assimilation and Labour Market Outcomes * Peter Kuhn, Department of Economics, University of California, Santa Barbara, CA 93106, USA. Fax. 805 893 8830; email:
Impacts of International Migration on the Labor Market in Japan
 Impacts of International Migration on the Labor Market in Japan Jiro Nakamura Nihon University This paper introduces an empirical analysis on three key points: (i) whether the introduction of foreign workers
The Effects of Housing Prices, Wages, and Commuting Time on Joint Residential and Job Location Choices
 The Effects of Housing Prices, Wages, and Commuting Time on Joint Residential and Job Location Choices Kim S. So, Peter F. Orazem, and Daniel M. Otto a May 1998 American Agricultural Economics Association
Immigrants earning in Canada: Age at immigration and acculturation
 UNIVERSITY OF OTTAWA Immigrants earning in Canada: Age at immigration and acculturation By: Ying Meng (6937176) Major Paper presented to the Department of Economics of the University of Ottawa in partial
I ll marry you if you get me a job Marital assimilation and immigrant employment rates
 The current issue and full text archive of this journal is available at www.emeraldinsight.com/0143-7720.htm IJM 116 PART 3: INTERETHNIC MARRIAGES AND ECONOMIC PERFORMANCE I ll marry you if you get me
Labor Market Performance of Immigrants in Early Twentieth-Century America
 Advances in Management & Applied Economics, vol. 4, no.2, 2014, 99-109 ISSN: 1792-7544 (print version), 1792-7552(online) Scienpress Ltd, 2014 Labor Market Performance of Immigrants in Early Twentieth-Century
Gender and Elections: An examination of the 2006 Canadian Federal Election
 Gender and Elections: An examination of the 2006 Canadian Federal Election Marie Rekkas Department of Economics Simon Fraser University 8888 University Drive Burnaby, BC V5A 1S6 mrekkas@sfu.ca 778-782-6793
I'll Marry You If You Get Me a Job: Marital Assimilation and Immigrant Employment Rates
 DISCUSSION PAPER SERIES IZA DP No. 3951 I'll Marry You If You Get Me a Job: Marital Assimilation and Immigrant Employment Rates Delia Furtado Nikolaos Theodoropoulos January 2009 Forschungsinstitut zur