Projecting transient populations. Richard Cooper, Nottinghamshire County Council. (Thanks also to Graham Gardner, Nottingham City Council) Background
|
|
|
- Miranda Powers
- 5 years ago
- Views:
Transcription
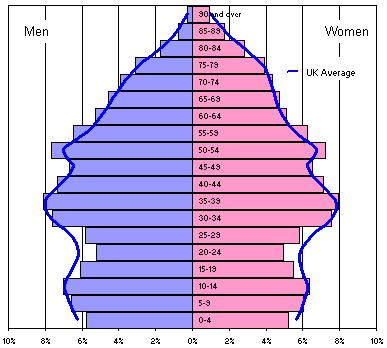
1 Projecting transient populations Richard Cooper, Nottinghamshire County Council (Thanks also to Graham Gardner, Nottingham City Council) Background The work of the County and City Councils in Nottinghamshire includes the preparation of a Joint Structure Plan covering the former County Council area of Nottinghamshire (or Plan Area). Preparation of housing figures for the Plan is undertaken jointly, although projection work is done by the County Council, working closely with the City. The Joint Structure Plan was published in Deposit Draft form in November 2003, and an Examination-in-Public commenced in June this year. The housing figures for the Plan Area had already been set in Regional Planning Guidance for the East Midlands (RPG8), approved by the Secretary of State in January Work for this level of planning was done by the County Council again in conjunction with the City and other authorities across the Region, for the Regional LGA. The Joint Structure Plan had two basic questions to answer Should the level of housing (for the Plan Area) be changed from the 49,000 set in RPG8 because of changes in circumstances since being set? What should be the distribution below Plan Area level. i.e to districts? In response to the first question the County & City Councils decided that there should be no change to the overall level of housing, principally because National Planning Policy Guidance indicates that housing figures should not be revisited unless there is strong justification. While circumstances had changed and moved on, there had been no new household projections produced by ODPM, and more up-to-date information gave ambiguous indications as to whether the figures should be higher or lower. In distributing the housing provision below Plan Area level, demographic trends, house construction and economic prospects indicated a distribution to the 3 Sub- Areas, while below that levels of supply also directed what district totals should be. In Nottingham City s case, being surrounded by suburban districts (or land-locked ) supply was the principal factor, especially bearing in mind the Government s (and RPG s) exhortation to concentrate development in major urban areas. Thus Nottingham had a housing provision of 18,500, of which part (11,000 dwellings), up to 2011, was already committed in terms of local plan provision. Preparing population projections for Nottingham The preparation of population projections for Nottingham (and other districts) was led, therefore, by a known level of housing. In this regard preliminary projections using the Chelmer model s dwelling-led option were helpful. However, these early projections were inadequate for more detailed population projections because, (a) a dwelling led projection (using 5-year periods) produces widely fluctuating migration \\SERVER2\F_USERS\SHEPHERA\Projecting_transient_Cooper.doc 1
2 levels and (b) more information on the constituents of the projection became available as time went on. More importantly a reliable population projection was needed which the City Council and it s partners could use for planning services in Social Services, education, etc.. This would represent the best forecast of how the population would change, especially in terms of age structure, over the middle and long-term. Certain things are difficult, or impossible to model. In this instance, while we knew how many houses were likely to be built, the types of people and households to occupy them would most likely change from the patterns seen in the data in the model. The age of people, especially migrants, their socio-economic characteristics, likelihood to create or fragment households, even capacity to obtain housing, might change from the situation that pertained for the data used in the model. In particular, assumptions are inherent in the modelling process that the likelihood of people to migrate, in terms of age and gender will not change, and similarly the likelihood of people to create households, given their age, gender and relationship. What is the Transient population? If we look at the age /sex profile of Nottingham compared to other districts and the Plan Area we can see a distinctly higher population in the year old population. Nottingham does have a younger population than the rest of the County, but the difference is much more than the attraction of young employed people into the City. In fact the large bulge seen in the Census data is principally students. In 2000, the two Nottingham universities had 29,500 full-time students. It is likely that approximately 24,000 of these had term-time addresses in the City, a net gain of about 21,000 university students. This population moves into and out of the City in a regular pattern, maintaining broadly the same age profile year-on-year (i.e. not ageing ) such as students. Such a population also tends to have different characteristics to the population as a whole, which may (or may not) be reflected in the data used in the model, for example, in fertility and mortality. This is the transient population. Fertility is affected significantly, as the transient population tends to be in the most fertile age groups. The introduction of a different transient population means that local fertility rates need changing to suit in order to generate realistic births. Correction factors are calculated automatically if birth data are put into the Chelmer model. For our purposes the transient population is principally students, but not entirely. It includes pupils, prisoners, and possibly the long-term ill, depending on whether they are in their district/area of residence. It does not include those in retirement homes; those people behave, as long-term residents of an area as large as Nottingham, even though their stay in a home may be short-term. The transient population is not simply institutional population, although ifor the 1991-based projections we identified those larger institutions, prisons, nurses/doctors and long-term residents in hospitals, where the population should be treated as transient. \\SERVER2\F_USERS\SHEPHERA\Projecting_transient_Cooper.doc 2
3 (Size of area and timescale has effect on what the transient population could be seen as. The smaller an area and the longer the timescale, the greater proportion of people are likely to be transient. A comparison of, say, Nottingham with England & Wales would illustrate this. There is a transient element in the England & Wales population, but my understanding is that (a) it s insignificant, (b) migration flows are assumed to deal with the short-term movements. Interestingly, Other potential transient populations are raising interest in regional housing policy, for example migrant workers, whether intra- or international, agricultural or international executives.) The impact of transient populations in the model If any sub-population that remains static because it is transient is not accounted for then it will be aged in the same way as the indigenous population. This is exacerbated in Nottingham s case (as with any area with a significant group) with the population peak showing up 20 years older in 20 years time (see chart) in the same way as the small peak seen below in year olds is older. Consequently the model needs to reflect the reality of that sub-population s behaviour. In real terms the population moves in and out on a regular basis, but historically (in 1981 & 1991 Census data) those movements have not been collected. Alternatively, the population can be removed from any ageing and migration, reflecting its constant status 1. This is possible in the Chelmer model by identifying a separate transient population Comparison of 2021 populations using/ not using a transient population: Nottingham City NCC transient pop Zero transient pop Population Using a zero transient population would give a resulting population for a set no of dwellings that is 8,000 (3%) fewer. In terms of population growth, that would be 30% 1 This issue was first raised by the County Council in the 1986-based Structure Plan, when the (County Council in-house) projections were first adjusted, in that case by amending the migration structure. \\SERVER2\F_USERS\SHEPHERA\Projecting_transient_Cooper.doc 3
4 lower. Conversely no transient population would produce 2,500 (in 18,000 about 13%) more dwellings for the same migration level (or population growth). More importantly the age structure of the population would be quite unrealistic. Why is this transient population a problem (to us?!) Up to now this is fairly conventional and well known to demographers who undertake projections. But why is this situation a problem, if we can obtain a working transient population, for the area? A decision was taken earlier in the planning for these projections that the Patient Register data available from ONS should be used to profile migration. Briefly this was done because it was more up-to-date, believed to be more complete than the Census (especially in terms of students), and we could obtain 3 years of data, rather than the single year (1990-1) of the Census. 2 The result gives a very different migration profile for Nottingham (see chart), with a much higher net in-migrant peak in the age group. (Gross flows chart at end of paper). Comparison of Patient Register and 1991 Census migration structure (M&F) ONS patient register (3 years) 1991 Census Total net migration: , , The problem related how the migration flows of the transient population are captured in migration flows. How does this relate to what can or cannot be measured in the transient population? The 1991 Census migration did not include students, therefore using a transient population was appropriate for the 1991-based projections, where a transient population was created using student totals. (NB A study by Ludi Simpson did identify more out-flows than in-flows of student populations in the 1991 Census, which it might have been possible to account for). 2 At the seminar it was mentioned that ONS had recently published some research work looking at potential undercount of young male migrants in their patient register estimates of internal migration; these are available on the ONS web site: \\SERVER2\F_USERS\SHEPHERA\Projecting_transient_Cooper.doc 4
5 The Chelmer model transient population takes account of all that population in a manner that can be applied to all districts consistently (see box). This gives a transient population of about 27,500, with a profile including older institutional age groups. This would be used in the no students Census migration. While the 1991 Census excluded (theoretically) all students, the ONS Patient Register data should include all but some students. The decision to use ONS PR had implications for the transient population; hence we needed to adjust the transient population to reflect what the ONS PR did in migration. Could this be done with the information available? Establishing what the transient population should be We compared the results of the Chelmer definition with what was known about students in Nottingham. Could it be improved? There were two possibilities - - by estimating students in another way; there is information available to us not available to Anglia. - by ignoring parts of the institutional population. How the CPHM definition is obtained: The calculation is : Standard institutional (non-domestic) (from S01 - includes staff & staff family) Plus - Students in student only and in other households, but not in parental home (S063) Minus - Students who are studying elsewhere, but whose parental home is in the study area (S012) Where are students measured? In the base population students are included in the estimates/2001 Census through term-time residence. Within this population students have different characteristics, which affect their transience and how they should be modelled. In particular, it is clear from 1991 and some 2001 results that not all students have been identified in the Census, especially in migration data. Study of the Census results (full-time students over 18) and information from the universities indicates the size of this population in the City. They are remarkably consistent 24,424 and 24,327 respectively. However, this is entirely coincidental, as the definitions are not comparable and university sources are only apportioned by known postcodes. Both totals include students living with parents. Other definitions can apply, for example, from the Census students over 18 not living with their parents amount to 23,099. The figure including those under 18, at boarding school, for example, is 25,967. On the other hand, economically inactive students, who are more likely to be full-time students in higher education, amount to 18,620 (Census). What transient population was actually used? \\SERVER2\F_USERS\SHEPHERA\Projecting_transient_Cooper.doc 5
6 Through discussions of the projections with Nottingham City we noted that the projections we now had were giving results that did not reflect the expected structure. In particular, if the student population was to be maintained (as was expected), then the remaining population once those students were removed in future years did not reflect the population ageing through from known younger age groups and births. (NB Was this higher or lower? figures in charts below indicate too high yrs fig. in 2021). Therefore we used an iterative estimation process to create a best fit scenario ; in other words trial & error. The purpose was to try to model what the population in the relevant age groups (19-29) should be if the transient element of it remained constant. For this we studied birth trends from 1981 to determine what the indigenous trend indicated. Of course, changes in migration at younger age groups would affect this, and once the age group was reached the movement of students themselves overwhelmed the information on resident population. We attempted to calculate what the likely student migration levels were. Using a population of 24,000 for non-home students, Annual in-out moves would be around 6-7,000 (assuming a 3/4 year course).??? more text How much better is the projection? Essentially we used a pragmatic approach, which attempted to adjust for known aspects of concern in the projection. It may have ignored others, for example, the effect upon older age groups. (Note: Anglia university indicate that this solution will not necessarily apply to other areas, and the default settings of the model are those that can be applied consistently for all areas. Considerable work has been done and is continuing into constructing a consistent transient population.) The ONS 1996-based population projection created standard migration profiles that relate to the whole population, however adjustments had to be introduced to compensate for student populations. In Nottingham City s case, while being a trendbased projection and derived from a pre-census mid-1996 base (and therefore inherently unrealistic), the age structure corresponds to what might have been expected (see chart). Was it worth updating the migration data if such an adjustment had to be made? What other options might there be? DO not ignore. Migrate all students in & then out this was done in mid 1980s for Notts structure plan. Could be done, but again there is a difficulty in assessing how many are involved and whether double counting is taking place. It will be possible to check figures we have from the 2001 Census to identify migrants will this be complete? Movements could be obtained from the universities to create a modelled migration profile then non-students could be added. It is likely that the Census includes some but not all student movements. \\SERVER2\F_USERS\SHEPHERA\Projecting_transient_Cooper.doc 6
7 Use a revised transient population to include students and revising migration to exclude students. Students may be removed from the 2001 Census migration flows and a transient population could be calculated which includes students and other categories of transient population, as we did in the 1991-based projections. \\SERVER2\F_USERS\SHEPHERA\Projecting_transient_Cooper.doc 7

8 Nottingham UA 2001 Census results Nottinghamshire rest of Plan Area 2001 Census results \\SERVER2\F_USERS\SHEPHERA\Projecting_transient_Cooper.doc 8
9 Comparison of Census,CPHM and University sources of student / transient figures Bassetlaw Nottingham Plan Area CPHM transient population: 2,922 27,552 41,986 CPHM Transient (15-29) ,553 25,401 CPHM adjustment from Census inst. Pop 20 18,565 22,622 Economically inactive Students (TT02) ,620 25,424 Students 18+ away from home (ST012) 910 1,220 7, Students at universities 63 24,237 29,726 Students over 18 not living with parents (TT02) ,099 30,632 Difference between incoming & outgoing students ,879 22,816 (University students out of County:) 2,300 (Bassetlaw has been used as an illustration of a Nottinghamshire district.) NB Transient population assumed for Nottingham in earlier NCC runs was 14,540 1 All students not living with parents. (TT02) 2 All Students 19 & over (inc those living with parents) (TT02) 3 All Students 19 & over economically inactive (TT02) 4 Students over 18 who would be at home, located by home address (i.e. absent) ST012) 5 students described as in (4) - all ages (i.e. inc pupils) (ST012) 6 Students registered at both universities, split into district by postcode (and apportioned where PC not present). For Nottingham The CPHM methodology gives a total of 27,552 transient population for Nottingham, and the adjustment accounts for 18,565. The age group gives 22,553 and 16,143 (adjustment) The group gives 24,372 and 17,476 (adjustment) The adjustment for 45+ is 272 The institutional population is 6,407 (15-29), 6,896 (15-44) It appears reasonable to assume that the total student population in Nottingham City is 25,000, and that 29 or 44 could be reasonable upper limits to any adjustment to transient or migration population. In other districts it will make little difference if the CPHM transient population is used. \\SERVER2\F_USERS\SHEPHERA\Projecting_transient_Cooper.doc 9
10 Comparison of gross migration: Patient Register & 1991 Census PR out Census out Census in PR in PR in PR out Census in Census out Gross each w ay flows: Census: 28-30,000 ONS PR: 17-19, ONS 96-based (trend) and JSP DD projections - Nottingham NCC DD proj NCC DD proj Actual \\SERVER2\F_USERS\SHEPHERA\Projecting_transient_Cooper.doc 10
11 ONS 96-based (trend) and JSP DD projections - Nottingham NCC DD proj \\SERVER2\F_USERS\SHEPHERA\Projecting_transient_Cooper.doc 11
8. United States of America
 (a) Past trends 8. United States of America The total fertility rate in the United States dropped from 3. births per woman in 19-19 to 2.2 in 197-197. Except for a temporary period during the late 197s
THE IMPACT OF IMMIGRATION ON ENGLAND S HOUSING
 Briefing Paper 7.2 www.migrationwatchuk.org THE IMPACT OF IMMIGRATION ON ENGLAND S HOUSING Summary 1. Every few years the Government produces projections of the number of households in England which help
The impact of immigration on population growth
 Briefing Paper 15.3 www.migrationwatchuk.com Summary 1. The impact of immigration on the size of the UK population is substantially greater than is generally realised. Between 2001 and 2012 inclusive,
People. Population size and growth
 The social report monitors outcomes for the New Zealand population. This section provides background information on who those people are, and provides a context for the indicators that follow. People Population
BRIEFING. The Impact of Migration on UK Population Growth.
 BRIEFING The Impact of Migration on UK Population Growth AUTHOR: DR ALESSIO CANGIANO PUBLISHED: 24/01/2018 NEXT UPDATE: 15/01/2020 4th Revision www.migrationobservatory.ox.ac.uk Based on official population
ASPECTS OF MIGRATION BETWEEN SCOTLAND AND THE REST OF GREAT BRITAIN
 42 ASPECTS OF MIGRATION BETWEEN SCOTLAND AND THE REST OF GREAT BRITAIN 1966-71 The 1971 Census revealed 166,590 people* resident in England and Wales who had been resident in Scotland five years previously,
Changing Times, Changing Enrollments: How Recent Demographic Trends are Affecting Enrollments in Portland Public Schools
 Portland State University PDXScholar School District Enrollment Forecast Reports Population Research Center 7-1-2000 Changing Times, Changing Enrollments: How Recent Demographic Trends are Affecting Enrollments
Using data provided by the U.S. Census Bureau, this study first recreates the Bureau s most recent population
 Backgrounder Center for Immigration Studies December 2012 Projecting Immigration s Impact on the Size and Age Structure of the 21st Century American Population By Steven A. Camarota Using data provided
People. Population size and growth. Components of population change
 The social report monitors outcomes for the New Zealand population. This section contains background information on the size and characteristics of the population to provide a context for the indicators
Sustainable Rural Communities: The case of two UK National Park areas
 Sustainable Rural Communities: The case of two UK National Park areas CCSR Working Paper 2008-13 Alan Marshall and Ludi Simpson alan.marshall@postgraduate.manchester.ac.uk This paper uses projections of
PROJECTING THE LABOUR SUPPLY TO 2024
 PROJECTING THE LABOUR SUPPLY TO 2024 Charles Simkins Helen Suzman Professor of Political Economy School of Economic and Business Sciences University of the Witwatersrand May 2008 centre for poverty employment
County Durham. Local Migration Profile. Quarter
 County Durham Local Migration Profile Quarter 3 2011-12 This document summarises the main migration trends and data that we can access for County Durham up to 31 st December 2011 Any reproduction of the
How do we get to 250,000 homes a year?
 How do we get to 250,000 homes a year? Neil McDonald Visiting Fellow at Cambridge Centre for Housing and Planning Research Author of What Homes Where? We need 250,000 homes a year We can deliver 250,000
The Impact of Immigration on Housing Demand in England
 The Impact of Immigration on Housing Demand in England Housing: MW 424 Summary 1. The DCLG claims in its projections of future household formation in England that just 37% of future household formation
Metro Vancouver Backgrounder Metro 2040 Residential Growth Projections
 Metro Vancouver 2040 - Backgrounder Metro 2040 Residential Growth Projections Purpose Metro Vancouver 2040 Shaping our Future, Metro s draft regional growth strategy, was released for public review in
BRIEFING. Long-Term International Migration Flows to and from Scotland. AUTHOR: WILLIAM ALLEN PUBLISHED: 18/09/2013
 BRIEFING Long-Term International Migration Flows to and from Scotland AUTHOR: WILLIAM ALLEN PUBLISHED: 18/09/2013 www.migrationobservatory.ox.ac.uk This briefing provides an overview of Long Term International
Migration Statistics and Service Planning in Luton and the Potential Implications of BREXIT
 Migration Statistics and Service Planning in Luton and the Potential Implications of BREXIT Eddie Holmes Senior Intelligence Analyst Luton Borough Council Overview Luton is a town with high levels of international
Evaluating the Role of Immigration in U.S. Population Projections
 Evaluating the Role of Immigration in U.S. Population Projections Stephen Tordella, Decision Demographics Steven Camarota, Center for Immigration Studies Tom Godfrey, Decision Demographics Nancy Wemmerus
Population Change and Public Health Exercise 8A
 Population Change and Public Health Exercise 8A 1. The denominator for calculation of net migration rate is A. Mid year population of the place of destination B. Mid year population of the place of departure
DRAFT V0.1 7/11/12. Sheffield 2012: JSNA Demographics Background Data Report. Data to support the refresh of JSNA 2012
 DRAFT V0.1 7/11/12 Sheffield 2012: JSNA Demographics Background Data Report Data to support the refresh of JSNA 2012 Ann Richardson Public Health Analysis Team NHS Sheffield 722 Prince of Wales Road Sheffield
Emigration Statistics in Georgia. Tengiz Tsekvava Deputy Executive Director National Statistics Office of Georgia
 Emigration Statistics in Georgia Tengiz Tsekvava Deputy Executive Director National Statistics Office of Georgia Main Sources for International Migration in Georgia Annual data of inflows and outflows
PI + v2.2. Demographic Component of the REMI Model Regional Economic Models, Inc.
 PI + v2.2 Demographic Component of the REMI Model 2018 Regional Economic Models, Inc. Table of Contents Overview... 1 Historical Data... 1 Population... 1 Components of Change... 1 Population Forecast...
Section IV. Technical Discussion of Methods and Assumptions
 Section IV. Technical Discussion of Methods and Assumptions excerpt from: Long-term Population Projections for Massachusetts Regions and Municipalities Prepared for the Office of the Secretary of the Commonwealth
Population Projection Alberta
 Population Projection Alberta 215 241 Solid long term growth expected Alberta s population is expected to expand by about 2.1 million people by the end of the projection period, reaching just over 6.2
ONS mid-2012 population estimates
 ONS mid-2012 population estimates October 2013 Introduction The Office for National Statistics (ONS) released their mid-2012 population estimates for England & Wales and respective authorities on 26 June
International migration data as input for population projections
 WP 20 24 June 2010 UNITED NATIONS STATISTICAL COMMISSION and ECONOMIC COMMISSION FOR EUROPE STATISTICAL OFFICE OF THE EUROPEAN UNION (EUROSTAT) CONFERENCE OF EUROPEAN STATISTICIANS Joint Eurostat/UNECE
REVISIONS IN POPULATION PROJECTIONS AND THEIR IMPLICATIONS FOR THE GROWTH OF THE MALTESE ECONOMY
 REVISIONS IN POPULATION PROJECTIONS AND THEIR IMPLICATIONS FOR THE GROWTH OF THE MALTESE ECONOMY Article published in the Annual Report 2017, pp. 46-51 BOX 2: REVISIONS IN POPULATION PROJECTIONS AND THEIR
Fiscal Impacts of Immigration in 2013
 www.berl.co.nz Authors: Dr Ganesh Nana and Hugh Dixon All work is done, and services rendered at the request of, and for the purposes of the client only. Neither BERL nor any of its employees accepts any
reformscotland.com Taking Scotland out of the immigration target
 reformscotland.com Taking Scotland out of the immigration target FAST FACTS Scotland s General Fertility Rate in 2016 was lower than every other country and region of the UK. Over the next 25 years the
Section 1: Demographic profile
 Section 1: Demographic profile Geography North East Lincolnshire is a small unitary authority covering an area of 192km 2. The majority of the resident population live in the towns of Grimsby and Cleethorpes
Alberta Population Projection
 Alberta Population Projection 213 241 August 16, 213 1. Highlights Population growth to continue, but at a moderating pace Alberta s population is expected to expand by 2 million people through 241, from
Women in Agriculture: Some Results of Household Surveys Data Analysis 1
 Women in Agriculture: Some Results of Household Surveys Data Analysis 1 Manuel Chiriboga 2, Romain Charnay and Carol Chehab November, 2006 1 This document is part of a series of contributions by Rimisp-Latin
Irish Emigration Patterns and Citizens Abroad
 Irish Emigration Patterns and Citizens Abroad A diaspora of 70 million 1. It is important to recall from the outset that the oft-quoted figure of 70 million does not purport to be the number of Irish emigrants,
Population Aging, Immigration and Future Labor Shortage : Myths and Virtual Reality
 Population Aging, Immigration and Future Labor Shortage : Myths and Virtual Reality Alain Bélanger Speakers Series of the Social Statistics Program McGill University, Montreal, January 23, 2013 Montréal,
Headship Rates and Housing Demand
 Headship Rates and Housing Demand Michael Carliner The strength of housing demand in recent years is related to an increase in the rate of net household formations. From March 1990 to March 1996, the average
Britain s Population Exceptionalism within the European Union
 Britain s Population Exceptionalism within the European Union Introduction The United Kingdom s rate of population growth far exceeds that of most other European countries. This is particularly problematic
Migrant population of the UK
 BRIEFING PAPER Number CBP8070, 3 August 2017 Migrant population of the UK By Vyara Apostolova & Oliver Hawkins Contents: 1. Who counts as a migrant? 2. Migrant population in the UK 3. Migrant population
1. A Regional Snapshot
 SMARTGROWTH WORKSHOP, 29 MAY 2002 Recent developments in population movement and growth in the Western Bay of Plenty Professor Richard Bedford Deputy Vice-Chancellor (Research) and Convenor, Migration
Alice According to You: A snapshot from the 2011 Census
 Research Brief 201301 Alice According to You: A snapshot from the 2011 Census Pawinee Yuhun, Dr Andrew Taylor & James Winter The Northern Institute Charles Darwin University (Image source: Alice Springs
Human Population Growth Through Time
 Human Population Growth Through Time Current world population: 7.35 Billion (Nov. 2016) http://www.worldometers.info/world-population/ 2012 7 billion 1999 13 years 12 years 1974 1927 1804 13 years 14 years
Population Projection Methodology and Assumptions
 Population Projection Methodology and Assumptions Introduction Population projections for Alberta and each of its 19 census divisions are available for the period 217 to 241 by sex and single year of age.
Impact of Migration and Development on Population Aging in Malaysia: Evidence. from South-East Asian Community Observatory (SEACO)
") Impact of Migration and Development on Population Aging in Malaysia: Evidence from South-East Asian Community Observatory (SEACO) Introduction: Population aging is an important public health issue related
Impact of Migration and Development on Population Aging in Malaysia: Evidence from South-East Asian Community Observatory (SEACO) Introduction: Population aging is an important public health issue related
Introduction CHRISTCHURCH CITY UPDATE 2000
 CHRISTCHURCH CITY UPDATE 2000 Introduction Christchurch City experienced significant population growth during the first half of the 1990s. This trend was fuelled by high levels of international migration,
POPULATION STUDIES RESEARCH BRIEF ISSUE Number
 POPULATION STUDIES RESEARCH BRIEF ISSUE Number 2008021 School for Social and Policy Research 2008 Population Studies Group School for Social and Policy Research Charles Darwin University Northern Territory
WHAT IS THE ROLE OF NET OVERSEAS MIGRATION IN POPULATION GROWTH AND INTERSTATE MIGRATION PATTERNS IN THE NORTHERN TERRITORY?
 WHAT IS THE ROLE OF NET OVERSEAS MIGRATION IN POPULATION GROWTH AND INTERSTATE MIGRATION PATTERNS IN THE NORTHERN TERRITORY? Kate Golebiowska and Dean Carson The key trend preventing the Northern Territory
The Impact of Interprovincial Migration on Aggregate Output and Labour Productivity in Canada,
 The Impact of Interprovincial Migration on Aggregate Output and Labour Productivity in Canada, 1987-26 Andrew Sharpe, Jean-Francois Arsenault, and Daniel Ershov 1 Centre for the Study of Living Standards
Middlesbrough. Local Migration Profile. Quarter
 Middlesbrough Local Migration Profile Quarter 1 2011-12 This document summarises the main migration trends and data that we can access for Middlesbrough up to 30 th June 2011 Any reproduction of the data
What Lies Ahead: Population, Household and Employment Forecasts to 2040 April Metropolitan Council Forecasts to 2040
 The Metropolitan Council forecasts population, households and employment for the sevencounty Minneapolis-St. Paul region with a 30-year time horizon. The Council will allocate this regional forecast to
The Implications of New Brunswick s Population Forecasts
 The Implications of New Brunswick s Post-Secondary Education, Training and Labour September 2017 In spring 2017, two papers (i) New Brunswick Population Snapshot and (ii) Small Area Population Forecasts
POPULATION STUDIES RESEARCH BRIEF ISSUE Number
 POPULATION STUDIES RESEARCH BRIEF ISSUE Number 2008023 School for Social and Policy Research 2008 Population Studies Group School for Social and Policy Research Charles Darwin University 0909 dean.carson@cdu.edu.au
The Demography of the Labor Force in Emerging Markets
 The Demography of the Labor Force in Emerging Markets David Lam I. Introduction This paper discusses how demographic changes are affecting the labor force in emerging markets. As will be shown below, the
THE IMPACT OF CHAIN MIGRATION ON ENGLISH CITIES
 Briefing Paper 9.13 www.migrationwatchuk.org THE IMPACT OF CHAIN MIGRATION ON ENGLISH CITIES Summary 1. Government proposals on chain migration have overlooked the most important factor - transcontinental
How did immigration get out of control?
 Briefing Paper 9.22 www.migrationwatchuk.org How did immigration get out of control? Summary 1 Government claims that the present very high levels of immigration to Britain are consistent with world trends
Migration and multicultural Britain British Society for Population Studies. 2 nd May 2006, Greater London Authority
 Migration and multicultural Britain British Society for Population Studies 2 nd May 2006, Greater London Authority Why migration and cultural origin? Public debate on population patterns Influence on small
Stockton upon Tees. Local Migration Profile. Quarter
 Stockton upon Tees Local Migration Profile Quarter 1 2011-12 This document summarises the main migration trends and data that we can access for Stockton-on-Tees up to 30 th June 2011 Any reproduction of
Employment outlook. Estonia: Forecast highlights up to Between now and 2025
 Estonia: Forecast highlights up to 2025 Between now and 2025 Employment is forecast to rise but remain below its 2008 pre-crisis level. Most employment growth will be in business and other services. Most
Standard Note: SN/SG/6077 Last updated: 25 April 2014 Author: Oliver Hawkins Section Social and General Statistics
 Migration Statistics Standard Note: SN/SG/6077 Last updated: 25 April 2014 Author: Oliver Hawkins Section Social and General Statistics The number of people migrating to the UK has been greater than the
Nottingham City Joint Strategic Needs Assessment May 2018
 Nottingham City Joint Strategic Needs Assessment May 2018 Demography and Social & Environmental Context - Introduction... 2 Part 1: DEMOGRAPHIC CONTEXT... 2 Summary... 2 Current Situation... 3 Total population...
Worcestershire Migration Report
 This report examines the patterns of migration into and out of Worcestershire and the districts. Internal, Inter-Regional, Intra-Regional and International migration flows are all considered. Worcestershire
No. 1. THE ROLE OF INTERNATIONAL MIGRATION IN MAINTAINING HUNGARY S POPULATION SIZE BETWEEN WORKING PAPERS ON POPULATION, FAMILY AND WELFARE
 NKI Central Statistical Office Demographic Research Institute H 1119 Budapest Andor utca 47 49. Telefon: (36 1) 229 8413 Fax: (36 1) 229 8552 www.demografia.hu WORKING PAPERS ON POPULATION, FAMILY AND
FUTURES NETWORK WEST MIDLANDS WORKING PAPER 1. Demographic Issues facing the West Midlands
 FUTURES NETWORK WEST MIDLANDS WORKING PAPER 1 Demographic Issues facing the West Midlands February, 2014 1 Preface This paper has been prepared by members of the Futures Network West Midlands a group comprising
Economic Activity in London
 CIS2013-10 Economic Activity in London September 2013 copyright Greater London Authority September 2013 Published by Greater London Authority City Hall The Queens Walk London SE1 2AA www.london.gov.uk
Determinants of Return Migration to Mexico Among Mexicans in the United States
 Determinants of Return Migration to Mexico Among Mexicans in the United States J. Cristobal Ruiz-Tagle * Rebeca Wong 1.- Introduction The wellbeing of the U.S. population will increasingly reflect the
MIGRATION TRENDS REPORT
 MIGRATION TRENDS REPORT Migration Flows and Population Trends in Wales AUTHOR: Dr Yvonni Markaki PUBLISHED: February 2017 revision http://www.wrc.wales/migration-information This report is the third of
Population Patterns in Lincolnshire
 Population Patterns in Lincolnshire Introduction http://shared.research-lincs.org.uk Improving access to quality information through partnership working Over recent years population change in Lincolnshire
Did you sleep here last night? The impact of the household definition in sample surveys: a Tanzanian case study.
 Did you sleep here last night? The impact of the household definition in sample surveys: a Tanzanian case study. Tiziana Leone, LSE Ernestina Coast, LSE Sara Randall, UCL Abstract Household sample surveys
CAMBRIDGESHIRE SUB-REGION GYPSY/TRAVELLER NEEDS ASSESSMENT 2005 SUMMARY
 APPENDIX CAMBRIDGESHIRE SUB-REGION GYPSY/TRAVELLER NEEDS ASSESSMENT 2005 SUMMARY 1 Introduction 1.1 This summary brings together some key points from the Cambridgeshire sub- Region Gypsy/Traveller Needs
Demographics. Chapter 2 - Table of contents. Environmental Scan 2008
 Environmental Scan 2008 2 Ontario s population, and consequently its labour force, is aging rapidly. The province faces many challenges related to a falling birth rate, an aging population and a large
DEMIFER Demographic and migratory flows affecting European regions and cities
 September 2010 The ESPON 2013 Programme DEMIFER Demographic and migratory flows affecting European regions and cities Applied Research Project 2013/1/3 Deliverable 12/11 Demifer Case Studies West Yorkshire
The likely scale of underemployment in the UK
 Employment and Welfare: MW 446 Summary 1. The present record rates of employment are misleading because they take no account of the underemployed those who wish to work more hours but cannot find suitable
ANALYSIS OF 2011 CENSUS DATA Irish Community Statistics, England and Selected Urban Areas
 ANALYSIS OF 2011 CENSUS DATA Irish Community Statistics, England and Selected Urban Areas REPORT FOR NORTH EAST Louise Ryan, Alessio D Angelo, Michael Puniskis, Neil Kaye July 2014 Supported and funded
WORKFORCE ATTRACTION AS A DIMENSION OF REGIONAL COMPETITIVENESS
 RUR AL DE VELOPMENT INSTITUTE WORKFORCE ATTRACTION AS A DIMENSION OF REGIONAL COMPETITIVENESS An Analysis of Migration Across Labour Market Areas June 2017 WORKFORCE ATTRACTION AS A DIMENSION OF REGIONAL
Chapter 11 - Population
 Chapter 11 - Population Social Studies 11 Mrs Mactavish Images and notes graciously borrowed and adapted from Thielmann s Web River (http://dpts.sd57.bc.ca/~gthielmann/ss11/index.html) Part A - Population
Investigating the dynamics of migration and health in Australia: A Longitudinal study
 Investigating the dynamics of migration and health in Australia: A Longitudinal study SANTOSH JATRANA Alfred Deakin Research Institute, Deakin University, Geelong Waterfront Campus 1 Gheringhap Street,
Attitudes towards Refugees and Asylum Seekers
 Attitudes towards Refugees and Asylum Seekers A Survey of Public Opinion Research Study conducted for Refugee Week May 2002 Contents Introduction 1 Summary of Findings 3 Reasons for Seeking Asylum 3 If
Time Series of Internal Migration in the United Kingdom by Age, Sex and Ethnic Group: Estimation and Analysis
 School of Geography FACULTY OF ENVIRONMENT Time Series of Internal Migration in the United Kingdom by Age, Sex and Ethnic Group: Estimation and Analysis Nik Lomax, Phil Rees and John Stillwell n.m.lomax@leeds.ac.uk
THE ROLE OF INTERNATIONAL MIGRATION IN MAINTAINING THE POPULATION SIZE OF HUNGARY BETWEEN LÁSZLÓ HABLICSEK and PÁL PÉTER TÓTH
 THE ROLE OF INTERNATIONAL MIGRATION IN MAINTAINING THE POPULATION SIZE OF HUNGARY BETWEEN 2000 2050 LÁSZLÓ HABLICSEK and PÁL PÉTER TÓTH INTRODUCTION 1 Fertility plays an outstanding role among the phenomena
NEW MEXICO DEMOGRAPHICS:
 NEW MEXICO DEMOGRAPHICS: PAST, PRESENT, AND FUTURE FOR-UNM February 7 th, 2014 Albuquerque, NM Jack Baker, PhD Senior Research Scientist Geospatial and Population Studies University of New Mexico PRESENTATION
Contents. Acknowledgements...xii Leading facts and indicators...xiv Acronyms and abbreviations...xvi Map: Pacific region, Marshall Islands...
 Contents Acknowledgements...xii Leading facts and indicators...xiv Acronyms and abbreviations...xvi Map: Pacific region, Marshall Islands... xii CHAPTER 1: CENSUS ORGANIZATION AND OPERATIONS...1 CHAPTER
The Long Term Economic Impacts of Reducing Migration in the UK
 Seminar in International Economics 16 July 2015 The Long Term Economic Impacts of Reducing Migration in the UK Katerina Lisenkova (with Marcel Merette and Miguel Sanchez-Martinez) NIESR, UK This seminar
A population with a rising average age, with a growing proportion of people aged over 65yrs. Ageing population
 Ageing population Age structure Agricultural change A population with a rising average age, with a growing proportion of people aged over 65yrs Percentage of the population (or number of people of each
Population and Migration Estimates
 An Phríomh-Oifig Staidrimh Central Statistics Office 21 September 2010 Components of population growth Population and Migration Estimates April 2010 Natural increase Net migration 80 60 40 20 0 Year ending
Standing for office in 2017
 Standing for office in 2017 Analysis of feedback from candidates standing for election to the Northern Ireland Assembly, Scottish council and UK Parliament November 2017 Other formats For information on
Demographic Parameters Assumption for the Population Projection (1)
") Demographic Parameters Assumption for the Population Projection (1) Population projection depends on 3 demographic parameters: Ferlility Mortality Migration For national level, there should be a figure
Demographic Parameters Assumption for the Population Projection (1) Population projection depends on 3 demographic parameters: Ferlility Mortality Migration For national level, there should be a figure
REGIONAL. San Joaquin County Population Projection
 Lodi 12 EBERHARDT SCHOOL OF BUSINESS Business Forecasting Center in partnership with San Joaquin Council of Governments 99 26 5 205 Tracy 4 Lathrop Stockton 120 Manteca Ripon Escalon REGIONAL analyst june
Estimating the foreign-born population on a current basis. Georges Lemaitre and Cécile Thoreau
 Estimating the foreign-born population on a current basis Georges Lemaitre and Cécile Thoreau Organisation for Economic Co-operation and Development December 26 1 Introduction For many OECD countries,
Sustainable cities, human mobility and international migration
 Sustainable cities, human mobility and international migration Report of the Secretary-General for the 51 st session of the Commission on Population and Development (E/CN.9/2018/2) Briefing for Member
Planning for the Silver Tsunami:
 Planning for the Silver Tsunami: The Shifting Age Profile of the Commonwealth and Its Implications for Workforce Development H e n r y Renski A NEW DEMOGRAPHIC MODEL PROJECTS A CONTINUING, LONG-TERM SLOWING
Schooling and Cohort Size: Evidence from Vietnam, Thailand, Iran and Cambodia. Evangelos M. Falaris University of Delaware. and
 Schooling and Cohort Size: Evidence from Vietnam, Thailand, Iran and Cambodia by Evangelos M. Falaris University of Delaware and Thuan Q. Thai Max Planck Institute for Demographic Research March 2012 2
Estimating the fertility of recent migrants to England and Wales ( ) is there an elevated level of fertility after migration?
 is there an elevated level of fertility after migration?") Estimating the fertility of recent migrants to England and Wales (1991-2001) is there an elevated level of fertility after migration? James Robards, Ann Berrington and Andrew Hinde University of Southampton
Estimating the fertility of recent migrants to England and Wales (1991-2001) is there an elevated level of fertility after migration? James Robards, Ann Berrington and Andrew Hinde University of Southampton
Voter ID Pilot 2018 Public Opinion Survey Research. Prepared on behalf of: Bridget Williams, Alexandra Bogdan GfK Social and Strategic Research
 Voter ID Pilot 2018 Public Opinion Survey Research Prepared on behalf of: Prepared by: Issue: Bridget Williams, Alexandra Bogdan GfK Social and Strategic Research Final Date: 08 August 2018 Contents 1
AHURI Research & Policy Bulletin
 AHURI Research & Policy Bulletin ISSUE 74 June 2006 ISSN 1445-3428 Are housing affordability problems creating labour shortages? Up until 2001 there was little direct evidence that housing affordability
Electorate Forecasts. A Guide for Practitioners. October 2011
 Electorate Forecasts A Guide for Practitioners 2001 2006 2011 2016 October 2011 What is the Local Government Boundary Commission for England? The Local Government Boundary Commission for England (LGBCE)
Assessment of Demographic & Community Data Updates & Revisions
 Assessment of Demographic & Community Data Updates & Revisions Scott Langen, Director of Operations McNair Business Development Inc. P: 306-790-1894 F: 306-789-7630 E: slangen@mcnair.ca October 30, 2013
A Snapshot of Current Population Issues in the Northern Territory
 Research Brief Issue RB06, 2016 A Snapshot of Current Population Issues in the Northern Territory Dr. Andrew Taylor Dr. Tom Wilson Demography and Growth Planning, Northern Institute andrew.taylor@cdu.edu.au
Projections of ageing migrant populations in France:
 WP 4.1 24 October 213 UNITED NATIONS STATISTICAL COMMISSION and ECONOMIC COMMISSION OR EUROPE STATISTICAL OICE O TE EUROPEAN UNION (EUROSTAT) Joint Eurostat/UNECE Work Session on Demographic Projections
(EPC 2016 Submission Extended Abstract) Projecting the regional explicit socioeconomic heterogeneity in India by residence
 Projecting the regional explicit socioeconomic heterogeneity in India by residence") (EPC 2016 Submission Extended Abstract) Projecting the regional explicit socioeconomic heterogeneity in India by residence by Samir K.C. & Markus Speringer Wittgenstein Centre (IIASA, VID/ÖAW, WU) (kc@iiasa.ac.at
(EPC 2016 Submission Extended Abstract) Projecting the regional explicit socioeconomic heterogeneity in India by residence by Samir K.C. & Markus Speringer Wittgenstein Centre (IIASA, VID/ÖAW, WU) (kc@iiasa.ac.at
PRESENT TRENDS IN POPULATION DISTRIBUTION
 PRESENT TRENDS IN POPULATION DISTRIBUTION Conrad Taeuber Associate Director, Bureau of the Census U.S. Department of Commerce Our population has recently crossed the 200 million mark, and we are currently
11. Demographic Transition in Rural China:
 11. Demographic Transition in Rural China: A field survey of five provinces Funing Zhong and Jing Xiang Introduction Rural urban migration and labour mobility are major drivers of China s recent economic
Embargoed until 00:01 Thursday 20 December. The cost of electoral administration in Great Britain. Financial information surveys and
 Embargoed until 00:01 Thursday 20 December The cost of electoral administration in Great Britain Financial information surveys 2009 10 and 2010 11 December 2012 Translations and other formats For information