Comparing Mobility Around the World: Results from the IMAGE Project
|
|
|
- Walter McDowell
- 5 years ago
- Views:
Transcription
1 Comparing Mobility Around the World: Results from the IMAGE Project Martin Bell The University of Queensland Mobility Symposium 2016 The Australian National University 21 March 2016 CRICOS Provider No 00025B
2 Preamble Focus is on internal migration the propensity to move that is to change place of residence - within countries Aim is to develop and apply measures to make comparisons between countries around the world Major interest is in promoting analytical rigour quantitative methods Outline problems and solutions, then examine extent of variation in mobility and some explanations Draws primarily on five year IMAGE Project (Internal Migration Around the Globe) international collaboration ARC core funding.

3 Background This work started from one simple observation: Compared with other demographic processes (eg fertility, mortality, international migration), there has been little attention to the way internal migration varies between countries around the world. Comparative indicators missing from international statistics.


4 The Significance of Internal Migration Migration within countries Scale ~ 860 million o/s region of birth Shapes the pattern of human settlement Integral to national development Linked to transitions in the life-course Growing recognition CRICOS Provider No 00025B
5 Towards Cross National Comparisons Why view migration in a comparative framework? Comparisons aids understanding Promotes analytical rigor Enhances migration theory Assists policy development Impediments to cross-national comparisons No single definition or standards for data collection Migration measured in different ways Differences in spatial and temporal frameworks No standard statistical indicators (eg like Life Expectancy) Limited data availability CRICOS Provider No 00025B
6 The IMAGE Project An international collaborative program comparing internal migration between countries 1. A league table comparing countries 2. Develop new comparative indicators 3. Investigate why migration varies 4. Determine trends over time 5. Recommendations for future practice International partners: University of Leeds IOM Polish Academy of Sciences Fujian Normal University Funded by ARC DP Plus collaborators from 40 countries IMAGE Inventory Who collects what? 193 UN member states IMAGE Repository Data sets for 135 nations IMAGE Studio Computes migration metrics Addresses methodological issues the MAUP IMAGE Outputs Thematic papers Methodological papers Regional papers CRICOS Provider No 00025B
. Internal Migration Data Around the World: Assessing Contemporary Practice.")
7 Instruments for Collecting Data Instrument Countries Traditional Census 156 Population Register 50 Regular National Survey 113 Total 179 Registers Surveys Source: Bell, M., Charles-Edwards, E., Kupiszewska, D., Kupiszewski, M., Stillwell, J., & Zhu, Y. (2014). Internal Migration Data Around the World: Assessing Contemporary Practice. Population, Space and Place, 21(1), 1-17
8 Making comparisons (1) Different data types are not equivalent Censuses and Registers differ in what they measure: Registers and administrative data sets measure moves (migration events); Censuses measure movers (migration transitions) Events and transitions comparable only over short intervals
9 Migration Intervals of Different Lengths Interval Fixed interval Lifetime Last move Duration Compare current place of residence with. place of residence at a defined date 1 or 5 years earlier, or other fixed interval place of birth (within the country).place of previous residence (irrespective of timing)...length of current residence Types of data collected by 142 countries at 2000 round Census Source: Bell, M., Charles-Edwards, E., Kupiszewska, D., Kupiszewski, M., Stillwell, J., & Zhu, Y. (2014). Internal Migration Data Around the World: Assessing Contemporary Practice. Population, Space and Place, 21(1), 1-17
10 Making comparisons (2) Migration measured over different intervals Lifetime migration data Measured since birth - most commonly collected but: Cumulative measure of net redistribution; poor indicator of current migration; affected by age structure; coarse spatial scale Last move data Place of previous res, irrespective of timing - widely collected but: Composite measure very difficult to analyse very little used Fixed interval data Place of residence 1/5 years ago best measure of current migration One year interval best for trends and characteristics Five year interval best for spatial patterns One and five year transition data not readily comparable
11 Who collects what? Source: IMAGE Inventory (includes information collected at censuses and surveys)

) Germany 412 Lander Iran 31 Provinces; 367 Shahrestans CRICOS Provider No")
12 Making comparisons (3) Different Spatial Frameworks Migration: change of residence across an internal boundary Countries vary in the geographies used for data collection Migration indicators are shaped by spatial scale and pattern (The Modifiable Areal Unit Problem (MAUP)) Germany 412 Lander Iran 31 Provinces; 367 Shahrestans CRICOS Provider No 00025B
13 Making comparisons Different data types are not equivalent Censuses and Registers differ in what they measure: registers measure moves (migration events); Censuses measure movers (migration transitions) Events and transitions comparable only over short intervals Migration measured over different intervals One and five year transition data not comparable No analytic solution to achieve temporal harmonisation Countries use different spatial frameworks Migration is a product of spatial scale and pattern The Modifiable Areal Unit Problem - novel techniques to overcome
14 What do we want to measure? Perspectives on Migration Migration intensity level of migration - propensity to move Migration impact how migration shapes settlement pattern Migration selection composition of migration Migration distance how far people move Migration connectivity how it links cities and regions Migration causes reasons for migration Who? Where? Why? How much? So what? Bell, M., Blake, M., Boyle, P., Duke-Williams, O., Rees, P. & Stillwell, J. & Hugo, G., [2002]: 'Cross-national comparison of internal migration: issues and measures', Journal of the Royal Statistical Society A, 165(3):
15 Comparing migration intensities Migration Intensity covers both rates and probabilities CMI Crude migration intensity: CMI = M/P where M represents number of migrants or migrations in an interval P represents population at risk (start of interval for transitions) Can calculate for any spatial scale eg Moves between 31 Provinces or 412 Lander But result depends on spatial scale Only internationally comparable figure is an estimate of ALL changes of residence ACMI (Aggregate CMI) Few countries collect this directly so we use method devised by Courgeau et al. (1973/2012) links observations of CMI at various spatial scales for which data are available CRICOS Provider No 00025B
 then ln(h/j) = 0 y intercept gives ACMI Estimated ACMI 11.3% 63079 cities/villages 7.41% 326 Shahrestans 4.16% 31 Ostans 2.66% 5 Regions 1.63% Courgeau, D.")
16 Estimating the ACMI for Iran As the spatial grid gets finer, a larger n of moves are captured Plots CMI against log of average households (H) per zone (j) CMI j = w + k ln(h/j) When H/j = 1 (i.e. average of 1 household per zone) then ln(h/j) = 0 y intercept gives ACMI Estimated ACMI 11.3% cities/villages 7.41% 326 Shahrestans 4.16% 31 Ostans 2.66% 5 Regions 1.63% Courgeau, D., Muhidin, S. and Bell, M. [2012]: Estimating changes of residence for cross-national comparison, Population-E, 67(4): , DOI /pope CRICOS Provider No 00025B
17 Assessing the ACMI Estimates Intercept on y axis gives estimate of the ACMI Have observed ACMI for 17 countries (28 time periods) Correlation between estimated ACMI and observed ACMI r=0.92 Migration data generally available only for a small number of geographies. We create additional randomised geographies using aggregation routines in the IMAGE Studio - increases precision Stillwell, J., Daras, K., Bell, M & Lomax, N. [2014]: The IMAGE studio: A tool for internal migration analysis and modelling, Applied Spatial Analysis and Policy, 7(1): DOI /s CRICOS Provider No 00025B
18 Estimated ACMI; Selected countries using results from the IMAGE Studio year event Estimated overall mobility (a) Crude Migration Intensity (%) Sweden_E Germany_E Belgium_E Finland_E Ln (No of Households / No of ASRs)

![[2015]: Internal migration and development: comparing migration intensities around the world, Population and](/docs-images/84/89115726/images/19-2.jpg "Development Review, 41(1): 33-58 Bell, M, Charles-Edwards, E, Bernard, A. & Ueffing, P.")
![[forthcoming]: Global Trends in CRICOS Provider No 00025B Internal Migration, in Champion, A, Cooke, T.](/docs-images/84/89115726/images/19-3.jpg "and Shuttleworth, I. (eds.) Are We Becoming Less Mobile?")
19 A League Table of Internal Migration One year intensities 47 countries Fiver year intensities Bell, M, Charles-Edwards, E, Ueffing, P., Stillwell, J., Kupiszewski, M. and Kupiszewska, D. [2015]: Internal migration and development: comparing migration intensities around the world, Population and Development Review, 41(1): Bell, M, Charles-Edwards, E, Bernard, A. & Ueffing, P. [forthcoming]: Global Trends in CRICOS Provider No 00025B Internal Migration, in Champion, A, Cooke, T. and Shuttleworth, I. (eds.) Are We Becoming Less Mobile? Transnational Perspectives through Time on Internal Migration in Advanced Countries, Ashgate 64 countries
: 33-58")
20 Standardised Migration Intensities Bell, M, Charles-Edwards, E, Ueffing, P., Stillwell, J., Kupiszewski, M. and Kupiszewska, D. [2015]: Internal migration and development: comparing migration intensities around the world, Population and Development Review, 41(1): CRICOS Provider No 00025B
21 Correlation with Development (1) Development Indicator One-year ACMI Five-year ACMI n r p n r p Geographic Geographic area (Square root) ** Population density Urbanisation ** ** Economic Gross Domestic Product (GDP) per capita ( 2005 PPP$) ** ** Gini coefficient (Income inequality 2000, 2005) Foreign direct investment /GDP (2000) Female labour force participation (2000) ** Labour force participation (2000) * Bell, M, Charles-Edwards, E, Ueffing, P., Stillwell, J., Kupiszewski, M. and Kupiszewska, D. [2015]: Internal migration and development: comparing migration intensities around the world, Population and Development Review, 41(1): CRICOS Provider No 00025B
22 Correlation with Development (2) Development Indicator One-year ACMI Five-year ACMI n r p n r p Social Human development index (2000) ** ** Mobile phone subscribers (2000) ** ** Literacy (2000) ** Per cent males living at home ** * Demographic Growth rate ( ) ** E0 ( ) Total Fertility Rate (TFR) ( ) ** Median age ** Net international migration rate ( ) * ** Remittances as % of GDP (2000) * *p<0.05; **p<0.01 Bell, M, Charles-Edwards, E, Ueffing, P., Stillwell, J., Kupiszewski, M. and Kupiszewska, D. [2015]: Internal migration and development: comparing migration intensities around the world, Population and Development Review, 41(1): CRICOS Provider No 00025B
23 Migration Intensity and Net International Migration Aggregate Migration Intensity (%) r = 0.58 New Zealand South Korea United States Australia Chile Canada Switzerland Bolivia Costa Rica France Senegal Paraguay Israel Peru Japan Portugal Nepal Morocco GreeceSouth Africa Dominican Ecuador Brazil Malta Republic ArgentinaGhana China Malaysia Nicaragua Viet NamHonduras Mexico Indonesia Mauritius Philippines International Net Migration Rate
24 CRICOS Provider No 00025B Is Migration Rising or Falling?
25 Trends in Migration Intensity, Indicator Trend in migration intensity Total countries Fall Stable Rise Continent Oceania North America Latin America Europe Asia Africa Total Human Development Index Low Medium High Very high Total CRICOS Provider No 00025B Bell, M, Charles-Edwards, E, Bernard, A. & Ueffing, P. [forthcoming]: Global Trends in Internal Migration, in Champion, A, Cooke, T. and Shuttleworth, I. (eds.) Are We Becoming Less Mobile? Transnational Perspectives through Time on Internal Migration in Advanced Countries, Ashgate

![[2013]: Cross-national comparisons of internal](/docs-images/84/89115726/images/26-2.jpg "migration: an update of global patterns and")

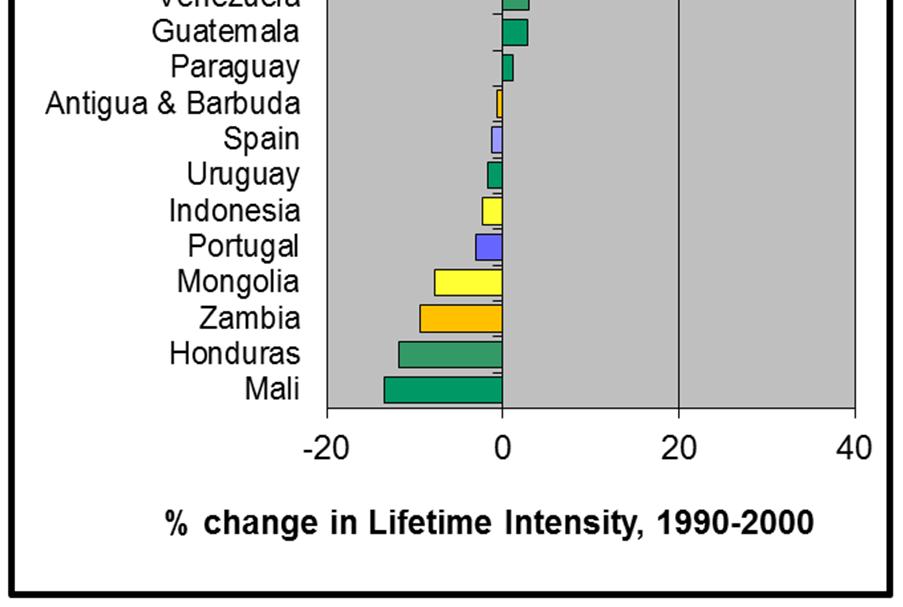
26 Migration Trends: Comparing Fixed Interval and Lifetime Measures Bell, M, and Charles-Edwards, E. [2013]: Cross-national comparisons of internal migration: an update of global patterns and trends, Technical paper 2013/1, Population Division, United Nations Department of Economic and Social Affairs, New York.
27 Migration in the Life Course We know that migration is selective some people move more than others.. A key variable is age. How does the age profile of migration vary between countries? CRICOS Provider No 00025B
28 Migration in the Life Course Transitions Migration Intensity Entry in the labour force Entry and exit from higher education Marriage and partnership formation Childbirth A demographically dense period in the life course: Rindfuss Children departure Retirement Moves to institutions Age
29 Evidence of variation Over time: Greece Across countries China Brazil Portugal Five-year interval migration data by single year age groups. Migration data was normalised to sum to unity and smoothed using kernel regression.

30 Migration Profiles Selected Countries Five year intensities between regions (Census-based) Bell, M. & Muhidin, S. [2009]: Cross-National Comparisons of Internal Migration, Human Development Research Paper 2009/30, United Nations, New York.
31 Comparative age profile metrics Existing approach Parameters of model schedules (Rogers and Castro, 1981) Issues related to their estimation (variability, sensitivity and instability) and interpretation (comparability and interpretability) Alternative indicators Intensity at peak Age at peak + Overall migration intensity 2/3 of inter-country variance Bernard, A., Bell, M., & Charles-Edwards, E. (2014). Improved measures for the cross-national comparison of age profiles of internal migration. Population Studies.
32 Comparing Age Profiles late and dispersed early and dispersed Bernard, A., Bell, M., & Charles-Edwards, E. (2014). Improved measures for the cross-national comparison of age profiles of internal migration. Population Studies. early and concentrated
33 Migration and the Life Course Linked to Four Life Course Transitions Completion of Education, Entry to Labour Force Formation of marital union Family formation China Brazil France Metrics Prevalence (Modell et al. 1976) Timing (Hajnal 1953) Spread (Carter and Glick 1970) Marital status by age Bernard, A., Bell, M., & Charles-Edwards, E. (2014) Life-Course Transitions and the Age Profile of Internal Migration. Population and Development Review, 40(2),
34 Age Profile of Migration, Australia 45 Migration intensity (per cent) Age at end of interval CRICOS Provider No 00025B
35 Conclusions Internal migration much larger but neglected Comparisons plagued by data and technical issues Wide geographic variation in intensities Highest in Northern Europe and new world ; Lowest in Eastern Europe and South-east Asia Positive links to development & international migration Wide variation in the age profile of migration Explained by differences in timing of life course transitions Intensity combined with effectiveness shapes redistribution Need for harmonisation on data collection practice CRICOS Provider No 00025B
36 Key References Bell, M., Blake, M., Boyle, P., Duke-Williams, O., Rees, P. & Stillwell, J. & Hugo, G., [2002]: 'Cross-national comparison of internal migration: issues and measures', Journal of the Royal Statistical Society A, 165(3): Bell, M, Charles-Edwards, E, Kupiszewska, D., Kupiszewski, M., Stillwell, J. and Zhu, Y. [2014]: Internal migration around the world: assessing contemporary practice, Population, Space and Place, Wiley Online Library DOI /psp1848 Bell, M, Charles-Edwards, E, Ueffing, P., Stillwell, J., Kupiszewski, M. and Kupiszewska, D. [2015]: Internal migration and development: comparing migration intensities around the world, Population and Development Review, 41(1): Bell, M, and Charles-Edwards, E. [2013]: Cross-national comparisons of internal migration: an update of global patterns and trends, Technical paper 2013/1, Population Division, United Nations Department of Economic and Social Affairs, New York. Bernard, Bell and Charles-Edwards (2014): Improved measures for the cross-national comparison of age profiles of internal migration, Population Studies Bernard, A., Bell, M. and Charles-Edwards, E. [2014]: Explaining cross-national differences in the age profile of internal migration: the role of life-course transitions, Population and Development Review, 40(2): Courgeau, D, Muhidin, S & Bell, M. [2012]: 'Estimating changes of residence for cross-national comparison', Population (English edition), 67(4):
37 Key References Rees, P., Bell, M, Kupiszewski, M. and Kupiszewska, D. Ueffing, P., Bernard, A., Charles- Edwards, E, and Stillwell, J., [forthcoming]: The impact of internal migration on population redistribution: an international comparison, Population, Space and Place, Stillwell, J., Daras, K., Bell, M & Lomax, N. [2014]: The IMAGE studio: A tool for internal migration analysis and modelling, Applied Spatial Analysis and Policy, 7(1): DOI /s Stillwell, J., Bell, M., Ueffing, P., Daras, K., Charles-Edwards, E., Kupiszewski, M. and Kupiszewska, D. [forthcoming]: Internal migration around the world: comparing distance travelled and its frictional effect, Environment and Planning, A.
The IMAGE Project - Comparing Internal Migration Around the GlobE: Data, Methods, Variations and Explanations
 The IMAGE Project - Comparing Internal Migration Around the GlobE: Data, Methods, Variations and Explanations Martin Bell and Elin Charles-Edwards Presentation to Vienna Institute of Demography September
Internal Migration and Development in Latin America
 Internal Migration and Development in Latin America Francisco Rowe Philipp Ueffing Martin Bell Elin Charles-Edwards 8th International Conference on Population Geographies, 30 th June- 3 rd July, 2015,
Internal Migration and Education. Toward Consistent Data Collection Practices for Comparative Research
 Internal Migration and Education Toward Consistent Data Collection Practices for Comparative Research AUDE BERNARD & MARTIN BELL QUEENSLAND CENTRE FOR POPULATION RESEARCH UNIVERSITY OF QUEENSLAND, AUSTRALIA
Comparing Internal Migration Intensities around the Globe
 Comparing Internal Migration Intensities around the Globe Paper prepared for the IUSSP to be held in Busan Korea, 26-31 August 2013 Martin Bell, University of Queensland, martin.bell@uq.edu.au; Elin Charles-Edwards,
Eighth International Conference on Population Geographies Brisbane, 30 June to 3 July 2015
 Marek Kupiszewski 1, Dorota Kupiszewska 2 Martin Bell 3, Elin Charles Edwards 3, Aude Benard 3, Philipp Ueffing 3 Philip Rees 4, John Stillwell 4, Konstantinos Daras 5 Eighth International Conference on
Human Development Research Paper 2009/30 Cross-National Comparisons of Internal Migration. Martin Bell and Salut Muhidin
 Human Development Research Paper 2009/30 Cross-National Comparisons of Internal Migration Martin Bell and Salut Muhidin United Nations Development Programme Human Development Reports Research Paper July
Measuring Internal Migration around the Globe: A Comparative Analysis
 KNOMAD WORKING PAPER 3 Measuring Internal Migration around the Globe: A Comparative Analysis Martin Bell Elin Charles-Edwards November 2014 The KNOMAD Working Paper Series disseminates work in progress
The Development of Australian Internal Migration Database
 The Development of Australian Internal Migration Database Salut Muhidin, Dominic Brown & Martin Bell (University of Queensland, Australia) s.muhidin@uq.edu.au Abstract. This study attempts to discuss the
Cross National Comparisons of Internal Migration in Asia-Pacific Region 1
 Cross National Comparisons of Internal Migration in Asia-Pacific Region 1 Salut Muhidin (s.muhidin@uq.edu.au) Martin Bell (martin.bell@uq.edu.au) Queensland Centre for Population Research School of Geography,
Subsequent Migration of Immigrants Within Australia,
 Population Research and Policy Review (2018) 37:1053 1077 https://doi.org/10.1007/s11113-018-9482-4 ORIGINAL RESEARCH Subsequent Migration of Immigrants Within Australia, 1981 2016 James Raymer 1 Bernard
Estimates of International Migration for United States Natives
 Estimates of International Migration for United States Natives Christopher Dick, Eric B. Jensen, and David M. Armstrong United States Census Bureau christopher.dick@census.gov, eric.b.jensen@census.gov,
This paper reports results from the Internal
 POPULATION, SPACE AND PLACE Popul. Space Place 21, 1 17 (2015) Published online 12 March 2014 in Wiley Online Library (wileyonlinelibrary.com).1848 Internal Migration Data Around the World: Assessing Contemporary
Data access for development: The IPUMS perspective
 Data access for development: The IPUMS perspective United Nations Commission on Population and Development Strengthening the demographic evidence base for the post-2015 development agenda New York 11 April
The globalization of inequality
 The globalization of inequality François Bourguignon Paris School of Economics Public lecture, Canberra, May 2013 1 "In a human society in the process of unification inequality between nations acquires
POPULATION AND MIGRATION
 POPULATION AND MIGRATION POPULATION TOTAL POPULATION FERTILITY DEPENDENT POPULATION POPULATION BY REGION ELDERLY POPULATION BY REGION INTERNATIONAL MIGRATION IMMIGRANT AND FOREIGN POPULATION TRENDS IN
The urban transition and beyond: Facing new challenges of the mobility and settlement transitions in Asia
 The urban transition and beyond: Facing new challenges of the mobility and settlement transitions in Asia Professor Yu Zhu Center for Population and Development Research Fujian Normal University/ Asian
Part 1: The Global Gender Gap and its Implications
 the region s top performers on Estimated earned income, and has also closed the gender gap on Professional and technical workers. Botswana is among the best climbers Health and Survival subindex compared
QGIS.org - Donations and Sponsorship Analysis 2016
 QGIS.org - Donations and Sponsorship Analysis 2016 QGIS.ORG received 1128 donations and 47 sponsorships. This equals to >3 donations every day and almost one new or renewed sponsorship every week. The
Income and Population Growth
 Supplementary Appendix to the paper Income and by Markus Brueckner and Hannes Schwandt November 2013 downloadable from: https://sites.google.com/site/markusbrucknerresearch/research-papers Table of Contents
SCALE OF ASSESSMENT OF MEMBERS' CONTRIBUTIONS FOR 1994
 International Atomic Energy Agency GENERAL CONFERENCE Thirtyseventh regular session Item 13 of the provisional agenda [GC(XXXVII)/1052] GC(XXXVII)/1070 13 August 1993 GENERAL Distr. Original: ENGLISH SCALE
WORLDWIDE DISTRIBUTION OF PRIVATE FINANCIAL ASSETS
 WORLDWIDE DISTRIBUTION OF PRIVATE FINANCIAL ASSETS Munich, November 2018 Copyright Allianz 11/19/2018 1 MORE DYNAMIC POST FINANCIAL CRISIS Changes in the global wealth middle classes in millions 1,250
Earnings Inequality, Educational Attainment and Rates of Returns to Education after Mexico`s Economic Reforms
 Latin America and the Caribbean Region The World Bank Poverty Reduction and Economic Management Division The World Bank Earnings Inequality, Educational Attainment and Rates of Returns to Education after
The demographic diversity of immigrant populations in Australia
 The demographic diversity of immigrant populations in Australia Professor James Raymer School of Demography Research School of Social Sciences Mobility Symposium, Department of Immigration and Border Protection
How Distance Matters: Comparing the Causes and Consequence of Emigration from Mexico and Peru
 How Distance Matters: Comparing the Causes and Consequence of Emigration from Mexico and Peru Ayumi Takenaka & Karen A. Pren May 2008 Latino migrants are heterogeneous Latino migrants are heterogeneous
World Jewish Population
 World Population T JLHE FIGURES presented here were derived from local censuses, communal registrations, estimates by informed persons, and data provided by organizations in response to a special inquiry
APPENDIX 1: MEASURES OF CAPITALISM AND POLITICAL FREEDOM
 1 APPENDIX 1: MEASURES OF CAPITALISM AND POLITICAL FREEDOM All indicators shown below were transformed into series with a zero mean and a standard deviation of one before they were combined. The summary
Poverty Reduction and Economic Growth: The Asian Experience Peter Warr
 Poverty Reduction and Economic Growth: The Asian Experience Peter Warr Abstract. The Asian experience of poverty reduction has varied widely. Over recent decades the economies of East and Southeast Asia
Inclusion and Gender Equality in China
 Inclusion and Gender Equality in China 12 June 2017 Disclaimer: The views expressed in this publication are those of the authors and do not necessarily reflect the views and policies of the Asian Development
United Nations. Department of Economic and Social Affairs Population Division Migration Section June 2012
 United Nations Department of Economic and Social Affairs Division Migration Section www.unmigration.org June 2012 Developed under the Development Account Project on Strengthening national capacities to
Summary of the Results
 Summary of the Results CHAPTER I: SIZE AND GEOGRAPHICAL DISTRIBUTION OF THE POPULATION 1. Trends in the Population of Japan The population of Japan is 127.77 million. It increased by 0.7% over the five-year
92 El Salvador El Salvador El Salvador El Salvador El Salvador Nicaragua Nicaragua Nicaragua 1
 Appendix A: CCODE Country Year 20 Canada 1958 20 Canada 1964 20 Canada 1970 20 Canada 1982 20 Canada 1991 20 Canada 1998 31 Bahamas 1958 31 Bahamas 1964 31 Bahamas 1970 31 Bahamas 1982 31 Bahamas 1991
BUILDING RESILIENT REGIONS FOR STRONGER ECONOMIES OECD
 o: o BUILDING RESILIENT REGIONS FOR STRONGER ECONOMIES OECD Table of Contents Acronyms and Abbreviations 11 List of TL2 Regions 13 Preface 16 Executive Summary 17 Parti Key Regional Trends and Policies
A GLOBAL PERSPECTIVE ON RESEARCH AND DEVELOPMENT
 UNESCO Institute for Statistics A GLOBAL PERSPECTIVE ON RESEARCH AND DEVELOPMENT The UNESCO Institute for Statistics (UIS) works with governments and diverse organizations to provide global statistics
Migration and Integration
 Migration and Integration Integration in Education Education for Integration Istanbul - 13 October 2017 Francesca Borgonovi Senior Analyst - Migration and Gender Directorate for Education and Skills, OECD
Unit 3 - Geography of Population: Demography, Migration
 Unit 3 - Geography of Population: Demography, Migration 38:180 Human Geography 2.1 Demography Demography is the study of the size and composition of population, including the dynamics of population change,
The Spanish population resident abroad increased 2.5% in 2018
 20 March 2019 Statistics of Spaniards Resident Abroad 01 January 2019 The Spanish population resident abroad increased 2.5% in 2018 United Kingdom, the United States of America, and France are the countries
CHAPTER I: SIZE AND GEOGRAPHICAL DISTRIBUTION OF THE POPULATION
 CHAPTER I: SIZE AND GEOGRAPHICAL DISTRIBUTION OF THE POPULATION 1. Trends in the Population of Japan The population of Japan is 127.77 million. It increased by 0.7% over the five-year period, the lowest
Trends in international higher education
 Trends in international higher education 1 Schedule Student decision-making Drivers of international higher education mobility Demographics Economics Domestic tertiary enrolments International postgraduate
People. Population size and growth. Components of population change
 The social report monitors outcomes for the New Zealand population. This section contains background information on the size and characteristics of the population to provide a context for the indicators
Trademarks FIGURE 8 FIGURE 9. Highlights. Figure 8 Trademark applications worldwide. Figure 9 Trademark application class counts worldwide
 Trademarks Highlights Applications grew by 16.4% in 2016 An estimated 7 million trademark applications were filed worldwide in 2016, 16.4% more than in 2015 (figure 8). This marks the seventh consecutive
Women in Agriculture: Some Results of Household Surveys Data Analysis 1
 Women in Agriculture: Some Results of Household Surveys Data Analysis 1 Manuel Chiriboga 2, Romain Charnay and Carol Chehab November, 2006 1 This document is part of a series of contributions by Rimisp-Latin
HUMAN RESOURCES IN R&D
 HUMAN RESOURCES IN R&D This fact sheet presents the latest UIS S&T data available as of July 2011. Regional density of researchers and their field of employment UIS Fact Sheet, August 2011, No. 13 In the
8. REGIONAL DISPARITIES IN GDP PER CAPITA
 8. REGIONAL DISPARITIES IN GDP PER CAPITA GDP per capita varies significantly among OECD countries (Figure 8.1). In 2003, GDP per capita in Luxembourg (USD 53 390) was more than double the OECD average
World Jewish Population*
 World Population* _LHE FIGURES presented below are based on local censuses, communal registrations, the estimates of informed observers, and data obtained from a special inquiry conducted by the YEAR BOOK
Internal Migration Around the World: Towards a Global Inventory
 Internal Migration Around the World: Towards a Global Inventory Martin Bell 1, Elin Charles-Edwards 1, Marek Kupiszewski 2, Dorota Kupiszewska 2, John Stillwell 3, Yu Zhu 4 1. Queensland Centre for Population
The Multidimensional Financial Inclusion MIFI 1
 2016 Report Tracking Financial Inclusion The Multidimensional Financial Inclusion MIFI 1 Financial Inclusion Financial inclusion is an essential ingredient of economic development and poverty reduction
Networks and Innovation: Accounting for Structural and Institutional Sources of Recombination in Brokerage Triads
 1 Online Appendix for Networks and Innovation: Accounting for Structural and Institutional Sources of Recombination in Brokerage Triads Sarath Balachandran Exequiel Hernandez This appendix presents a descriptive
GLOBAL RISKS OF CONCERN TO BUSINESS WEF EXECUTIVE OPINION SURVEY RESULTS SEPTEMBER 2017
 GLOBAL RISKS OF CONCERN TO BUSINESS WEF EXECUTIVE OPINION SURVEY RESULTS SEPTEMBER 2017 GLOBAL RISKS OF CONCERN TO BUSINESS Results from the World Economic Forum Executive Opinion Survey 2017 Survey and
World population. World population. World population. World population. World population. World population billion by 2100
 http://www.theworldpopulation.com/ 5-11 billion by 2100 97% of growth is in developing countries living in acute poverty Projections vary based on assumptions regarding: demographic transition in developing
SEVERANCE PAY POLICIES AROUND THE WORLD
 SEVERANCE PAY POLICIES AROUND THE WORLD SEVERANCE PAY POLICIES AROUND THE WORLD No one likes to dwell on lay-offs and terminations, but severance policies are a major component of every HR department s
Pakistan 2.5 Europe 11.5 Bangladesh 2.0 Japan 1.8 Philippines 1.3 Viet Nam 1.2 Thailand 1.0
 173 People Snapshots Asia and the Pacific accounts for nearly 55% of global population and 6 of the world s 10 most populous economies. The region s population is forecast to grow by almost 1 billion by
A Global View of Entrepreneurship Global Entrepreneurship Monitor 2012
 A Global View of Entrepreneurship Global Entrepreneurship Monitor 2012 Donna Kelley, Babson College REITI Workshop Tokyo Japan January 21, 2001 In 2012, its 14 th year, GEM surveyed 198,000 adults in 69
Ignacio Molina and Iliana Olivié May 2011
 Ignacio Molina and Iliana Olivié May 2011 What is the IEPG? The Elcano Global Presence Index (IEPG after its initials in Spanish) is a synthetic index that orders, quantifies and aggregates the external
KPMG: 2013 Change Readiness Index Assessing countries' ability to manage change and cultivate opportunity
 KPMG: 2013 Change Readiness Index Assessing countries' ability to manage change and cultivate opportunity Graeme Harrison, Jacqueline Irving and Daniel Miles Oxford Economics The International Consortium
SYMPOSIUM ON MIGRATION AND THE FUTURE OF EMERGING MARKETS
 SYMPOSIUM ON MIGRATION AND THE FUTURE OF EMERGING MARKETS EGROVE PARK, OXFORD, 12-14 JANUARY 218 ANALYTICAL FRAMEWORK Cover photo credit: A Katz / Shutterstock.com 217 Migration and Emerging Markets: an
Growth and Migration to a Third Country: The Case of Korean Migrants in Latin America
 JOURNAL OF INTERNATIONAL AND AREA STUDIES Volume 23, Number 2, 2016, pp.77-87 77 Growth and Migration to a Third Country: The Case of Korean Migrants in Latin America Chong-Sup Kim and Eunsuk Lee* This
INTERNATIONAL MIGRATION IN THE AMERICAS
 INTERNATIONAL MIGRATION IN THE AMERICAS SICREMI 2012 EXECUTIVE SUMMARY Organization of American States Organization of American States INTERNATIONAL MIGRATION IN THE AMERICAS Second Report of the Continuous
REMITTANCE PRICES W O R L D W I D E
 Public Disclosure Authorized Public Disclosure Authorized Public Disclosure Authorized Public Disclosure Authorized REMITTANCE PRICES W O R L D W I D E PAYMENT SYSTEMS DEVELOPMENT GROUP FINANCIAL AND PRIVATE
BIRTHPLACE ORIGINS OF AUSTRALIA S IMMIGRANTS
 BIRTHPLACE ORIGINS OF AUSTRALIA S IMMIGRANTS Katharine Betts The birthplace origins of Australia s migrants have changed; in the 1960s most came from Britain and Europe. In the late 1970s this pattern
Levels and trends in international migration
 Levels and trends in international migration The number of international migrants worldwide has continued to grow rapidly over the past fifteen years reaching million in 1, up from million in 1, 191 million
Global Social Progress Index
 Global Social Progress Index How do we advance society? Economic Development Social Progress www.socialprogressindex.com The Social Progress Imperative defines social progress as: the capacity of a society
The Democracy Ranking 2008 of the Quality of Democracy: Method and Ranking Outcome
 The Democracy Ranking 2008 of the Quality of Democracy: Method and Ranking Outcome David F. J. Campbell Georg Pölzlbauer April 11, 2008 David F. J. Campbell Research Fellow University of Klagenfurt Faculty
Population Growth and California s Future. Hans Johnson
 Population Growth and California s Future Hans Johnson Outline California s rapid growth Population diversity Implications for policy 2 California Has a Large and Growing Population 40,000 Population (in
The Political Economy of Public Policy
 The Political Economy of Public Policy Valentino Larcinese Electoral Rules & Policy Outcomes Electoral Rules Matter! Imagine a situation with two parties A & B and 99 voters. A has 55 supporters and B
WORLD DECEMBER 10, 2018 Newest Potential Net Migration Index Shows Gains and Losses BY NELI ESIPOVA, JULIE RAY AND ANITA PUGLIESE
 GALLUP WORLD DECEMBER 10, 2018 Newest Potential Net Migration Index Shows Gains and Losses BY NELI ESIPOVA, JULIE RAY AND ANITA PUGLIESE STORY HIGHLIGHTS Most countries refusing to sign the migration pact
The Conference Board Total Economy Database Summary Tables November 2016
 The Conference Board Total Economy Database Summary Tables November 2016 About This document contains a number of tables and charts outlining the most important trends from the latest update of the Total
MIGRATION TRENDS IN SOUTH AMERICA
 South American Migration Report No. 1-217 MIGRATION TRENDS IN SOUTH AMERICA South America is a region of origin, destination and transit of international migrants. Since the beginning of the twenty-first
The Democracy Ranking 2009 of the Quality of Democracy: Method and Ranking Outcome. Comprehensive Scores and Scores for the Dimensions.
 The Democracy Ranking 2009 of the Quality of Democracy: Method and Ranking Outcome. Comprehensive Scores and Scores for the Dimensions. David F. J. Campbell Georg Pölzlbauer April 9, 2010 David F. J. Campbell
Briefing on the Work Programme of the Population Division: International Migration and Development
 Briefing on the Work Programme of the Population Division: International Migration and Development Bela Hovy, Chief Migration Section, Population Division Department of Economic and Social Affairs (DESA),
How does development vary amongst regions? How can countries promote development? What are future challenges for development?
 Chapter 9- Development How does development vary amongst regions? How can countries promote development? What are future challenges for development? Human Development Index (HDI) Development process of
Widening of Inequality in Japan: Its Implications
 Widening of Inequality in Japan: Its Implications Jun Saito, Senior Research Fellow Japan Center for Economic Research December 11, 2017 Is inequality widening in Japan? Since the publication of Thomas
Latin America in the New Global Order. Vittorio Corbo Governor Central Bank of Chile
 Latin America in the New Global Order Vittorio Corbo Governor Central Bank of Chile Outline 1. Economic and social performance of Latin American economies. 2. The causes of Latin America poor performance:
Russian Federation. OECD average. Portugal. United States. Estonia. New Zealand. Slovak Republic. Latvia. Poland
 INDICATOR TRANSITION FROM EDUCATION TO WORK: WHERE ARE TODAY S YOUTH? On average across OECD countries, 6 of -19 year-olds are neither employed nor in education or training (NEET), and this percentage
IMMIGRATION. Gallup International Association opinion poll in 69 countries across the globe. November-December 2015
 IMMIGRATION Gallup International Association opinion poll in 69 countries across the globe November-December 2015 Disclaimer: Gallup International Association or its members are not related to Gallup Inc.,
HAPPINESS, HOPE, ECONOMIC OPTIMISM
 HAPPINESS, HOPE, ECONOMIC OPTIMISM Gallup International Association opinion poll in 66 countries across the globe December, 2016 Disclaimer: Gallup International Association or its members are not related
World Jewish Population, 1982
 World, 1982 A HE 1984 AMERICAN JEWISH YEAR BOOK (AJYB) contained new estimates of the population in the various countries of the world at the end of 1982, as well as background information and analysis.
Promoting women s participation in economic activity: A global picture
 Promoting women s participation in economic activity: A global picture Ana Revenga Senior Director Poverty and Equity Global Practice, The World Bank Lima, June 27, 2016 Presentation Outline 1. Why should
The Democracy Ranking 2008/2009 of the Quality of Democracy: Method
 The Democracy Ranking 2008/2009 of the Quality of Democracy: Method and Ranking Outcome David F. J. Campbell Georg Pölzlbauer February 23, 2009 David F. J. Campbell Research Fellow University of Klagenfurt
A Cross-National Comparison of the Spatial Structure of Internal Migration by Level of Educational Attainment
 A Cross-National Comparison of the Spatial Structure of Internal Migration by Level of Educational Attainment Nikola Sander & Jana Vobecká April 30, 2012 Wittgenstein Centre (IIASA, VID/ÖAW, WU), Vienna
The International Investment Index Report IIRC, Wuhan University
 The International Investment Index Report -14, Wuhan University The International Investment Index Report for to 14 Make international investment simple Introduction International investment continuously
VACATION AND OTHER LEAVE POLICIES AROUND THE WORLD
 VACATION AND OTHER LEAVE POLICIES AROUND THE WORLD VACATION AND OTHER LEAVE POLICIES AROUND THE WORLD AT A GLANCE ORDER ONLINE GEOGRAPHY 47 COUNTRIES COVERED 5 REGIONS 48 MARKETS Americas Asia Pacific
THE FIGURES on world Jewish population presented below are based on
 World THE FIGURES on world population presented below are based on current information available from local sources. In the course of 1955 and 1956, the AMERICAN JEWISH YEAR BOOK conducted a survey among
World Map Title Name. Russia. United States. Japan. Mexico. Philippines Nigeria. Brazil. Indonesia. Germany United Kingdom. Canada
 214 P Gersmehl Teachers may copy for use in their classrooms. Contact pgersmehl@gmail.com regarding permission for any other use. World Map Title Name Canada United States Mexico Colombia Ecuador Haiti
Global Prevalence of Adult Overweight & Obesity by Region
 Country Year of Data Collection Global Prevalence of Adult Overweight & Obesity by Region National /Regional Survey Size Age Category % BMI 25-29.9 %BMI 30+ % BMI 25- %BMI 30+ 29.9 European Region Albania
Bilateral Migration Model and Data Base. Terrie L. Walmsley
 Bilateral Migration Model and Data Base Terrie L. Walmsley Aims of Research Numerous problems with current data on numbers of migrants: Opaque data collection, Regional focus, Non-separation of alternative
VISA POLICY OF THE REPUBLIC OF KAZAKHSTAN
 VISA POLICY OF THE REPUBLIC OF KAZAKHSTAN Country Diplomatic Service National Term of visafree stay CIS countries 1 Azerbaijan visa-free visa-free visa-free 30 days 2 Kyrgyzstan visa-free visa-free visa-free
2018 Social Progress Index
 2018 Social Progress Index The Social Progress Index Framework asks universally important questions 2 2018 Social Progress Index Framework 3 Our best index yet The Social Progress Index is an aggregate
Capital Profitability and Economic Growth
 Journal of Economics and Development Studies December 2018, Vol. 6, o. 4, pp. 12-18 ISS: 2334-2382 (Print), 2334-2390 (Online) Copyright The Author(s). All Rights Reserved. Published by American Research
Sex ratio at birth (converted to female-over-male ratio) Ratio: female healthy life expectancy over male value
 Ratio: female healthy life expectancy over male value") Table 2: Calculation of weights within each subindex Economic Participation and Opportunity Subindex per 1% point change Ratio: female labour force participation over male value 0.160 0.063 0.199 Wage
Table 2: Calculation of weights within each subindex Economic Participation and Opportunity Subindex per 1% point change Ratio: female labour force participation over male value 0.160 0.063 0.199 Wage
Trends in inequality worldwide (Gini coefficients)
") Section 2 Impact of trade on income inequality As described above, it has been theoretically and empirically proved that the progress of globalization as represented by trade brings benefits in the form
Section 2 Impact of trade on income inequality As described above, it has been theoretically and empirically proved that the progress of globalization as represented by trade brings benefits in the form
IMAGE OF POPE FRANCIS
 IMAGE OF POPE FRANCIS Gallup International Association opinion poll in 64 countries across the globe September-December 2015 Disclaimer: Gallup International Association or its members are not related
A Global Perspective on Socioeconomic Differences in Learning Outcomes
 2009/ED/EFA/MRT/PI/19 Background paper prepared for the Education for All Global Monitoring Report 2009 Overcoming Inequality: why governance matters A Global Perspective on Socioeconomic Differences in
INTERNATIONAL COMPARISON
 Chapter 7 INTERNATIONAL COMPARISON OF GENDER INDICATORS Women & Men in India -2017 125 126 International Comparison of Gender Indicators International Comparison of Gender Indicators India is part of many
INTERNATIONAL GENDER PERSPECTIVE
 Chapter 7 INTERNATIONAL GENDER PERSPECTIVE OF DEVELOPMENT INDICATORS Women & Men In India 2016 115 116 International Gender Perspective International Gender Perspective of Development Indicators India
AMID Working Paper Series 45/2005
 AMID Working Paper Series 45/2005 The Demography of the Middle East and North Africa in a Global Context Poul Chr. Matthiessen Collstrops Fond Introduction The present paper aims to provide a description
THERE WAS NO WAY o ascertaining with any degree of accuracy the number
 World THERE WAS NO WAY o ascertaining with any degree of accuracy the number of Jews residing in various countries during 1953-54. This was true not only with respect to communities behind the Iron Curtain
Incarceration Data: Selected Comparisons
 Incarceration Data: Selected Comparisons Charles Patton III Race/Ethnicity: Multidisciplinary Global Contexts, Volume 2, Number 1, Autumn 2008, pp. 151-156 (Article) Published by Indiana University Press
Refugee migration 2: Data analysis
 Core units: Exemplar Year 10 Illustration 3: Refugee migration Refugee migration 2: Data analysis The global picture At the end of 2010, there were 43.7 million people forcibly displaced by persecution
irat Unit 1 News? Missed questions? Does any team want to appeal? Population Pattern, Data World Population Growth Through History
 Unit 1 News? Population Pattern, Data 1 2 irat This is a closed-book, no notes test! You have 10 minutes to complete the test. Circle the correct answers to each question on the answer sheet provided.
A/AC.289/2. General Assembly. United Nations
 United Nations General Assembly Distr.: General 22 October 2018 Original: English Ad hoc open-ended working group established pursuant to General Assembly resolution 72/277 Organizational session New York,