Visit Finland Visitor Survey 2016
|
|
|
- Moris Cooper
- 5 years ago
- Views:
Transcription

1
2 Visit Finland Visitor Survey 2016 Visit Finland Studies 9 Finpro, Visit Finland Helsinki 2017
3 Non-resident visitors in Finland in 2016
4 Contents Abstract 5 Introduction 7 Trips to Finland 10 Day and overnight trips 13 Finland as the main destination 15 Purpose of the trip 17 Organising the trip 19 Duration of trip 21 Number of overnight stays 23 Overnight accommodation 26 Expenditures in Finland 28 Shopping basket 31 Expenditure per trip 32 Travel destination in Finland 34 Travel destination the Helsinki Metropolitan Area 36 Destination archipelago / coast 37 Destination Finnish Lakeland 38 Travel destination Lapland 39 What is interesting about Finland 41 Finnish cultural sites 43 Finnish Archipelago 44 The Finnish cuisine 45 Finnish sauna 46 Wellness services and treatments 47 Summer activities on land 48 Summer activities on the water 49 Winter sports 50 Other winter activities and experiences 51 Finland's popularity 52 How often in Finland 53 First time in Finland 54 Would you recommend Finland 56 Other travel destinations 57 Visited elsewhere during the trip 58 The next travel destination (top 10) 60 Background information 61 The family's combined gross annual income62 The age and gender distribution 63 Occupational distribution 64 Travel companions 65 Area of residence in home country 66
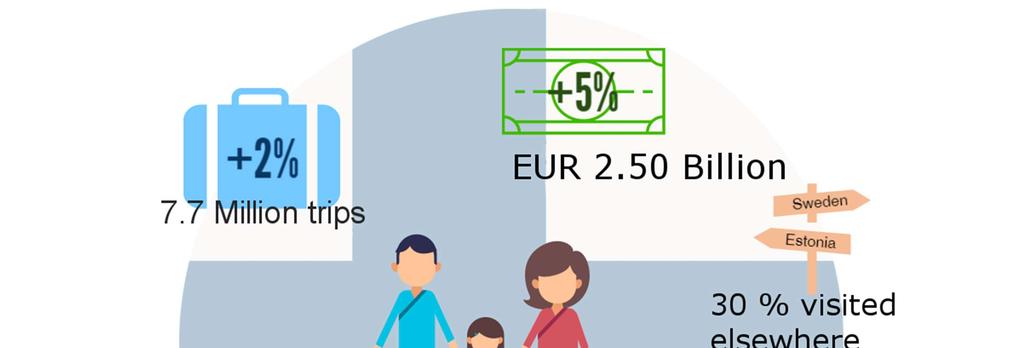
5 5 Abstract TWO PERCENT GROWTH IN TOURISM In 2016 non-resident visitors made 7.7 million trips to Finland, which is two percent more than the previous year. A good third of the trips were made by people living in Russia. A fifth of the total trips were from Sweden and Estonia and every eighth visitor to Finland came from Asia. The largest relative increase was in trips from India, but in absolute terms the greatest increase came from China, with over 90,000 trips. Around 50,000 more trips than the year before were made from Germany, Sweden and South Korea. Travel to Finland from the EU countries also increased. The largest number of trips decreased from Russia ( trips) and the highest proportion from Norway, Switzerland and Canada. The Swiss and Canadian decline in travel in 2016 was affected by the Gymnaestrada event in gymnastics, as well as the World Junior Ice Hockey Championships organized in Finland, which increased the number of Swiss and Canadian visitors in DAY TRIPS INCREASED AND OVERNIGHT TRIPS DECREASED Two out of five trips made to Finland in 2016 were day trips. More than 60 percent of day trips were made by Russians, and 20 percent made by Estonians or Swedes. The Russians also made the most overnight trips (760,000 trips), or one in every six overnight trips. Visitors arriving from Sweden made almost the same number of overnight trips (640,000 trips). A total of 3.1 million day trips and 4.6 million overnight trips were made. Overnight trips increased the most from China and Japan (about 50,000 trips more) and decreased the most from Russia and Estonia. However, more day trips were made from these countries. The same trend was also seen in Swedish travel. Russian trips have been decreasing from 2014 until now, but now day trips seem to have begun to increase again. BUSINESS TRIPS AND TRANSIT TRIPS INCREASED Three hundred thousand more business trips were made to Finland than in Transit trips (a trip in which Finland was not the main destination) increased by 220,000 trips. However, there were 320,000 fewer visits to friends than before. Business trips increased, particularly from Sweden and Estonia, while visits to friends from these countries and Russia decreased. Shopping trips from Russia also increased. Transit trips from Estonia and China increased, as did holiday trips from Sweden and China.
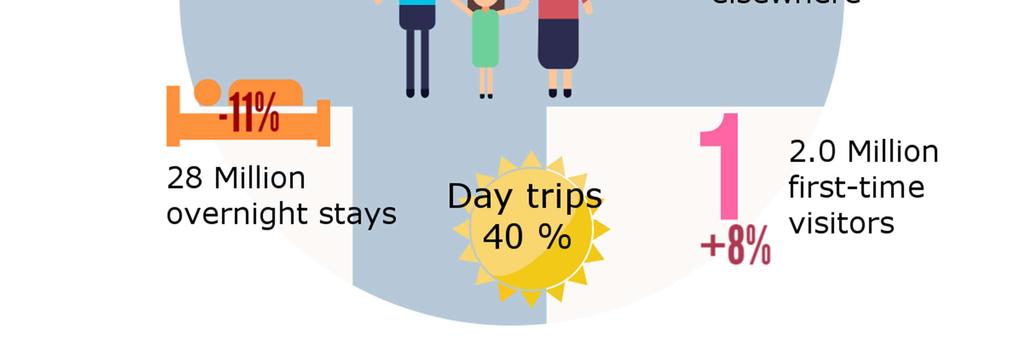
6 6 OVERNIGHT STAYS DECREASED Visitors living abroad spent 28.3 million nights in Finland last year, which is 11 percent less than in Overnight stays from Russia alone decreased by 1.1 million nights. The number of overnight stays greatly affects the relative development of day and overnight trips Compared to 2015, the number of day trips increased and the number of overnight trips decreased from several countries. Most of the nights spent in Finland are generated by long-term visitors: about one-fifth of the visitors spent at least 6 days in Finland, but their overnight stays were three-fourths of total overnight stays for the year. The long-staying visitors in Finland often stay in their own or in rented dwellings, as well as with relatives, in which case they are excluded from the official accommodation statistics. More travelers stayed in hotels and motels as well as rental housing (including Airbnb) than before. Overnight stays in hotels and motels increased by 7 percent. According to Statistics Finland foreign arrivals in hotels increased by 8%. However, there were over 400,000 fewer overnight stays with friends and relatives than a year earlier. Eighty percent of these visitors were from Russia, Sweden or Estonia. SPENDING INCREASED FIVE PERCENT Visitors arriving from abroad spent EUR 2.50 billion in Finland in 2016, or 130 million more than the year before. Expenditures of visitors from Russia accounted for almost one fifth, when their share of trips made to Finland was one third. Also visitors from China and Japan spent altogether just over one fifth of the money spent by foreign visitors in Finland over the course of the year. Visitors from Germany, Sweden and Estonia were the next largest groups in terms of expenditures. A total expenditure of about one-fifth (530 million ) was paid in advance for accommodation, car rental, entrance fees, etc. The sum of EUR 2.5 billion does not include border checkpoints not included in the study or tickets to Finland, which makes up approximately EUR 1.4 billion in tourism income in Finland. When these are taken into account, it can be estimated that Finland received tourism income comparable to export income of approximately EUR 3.9 billion. The largest amount (+77 million ) was from increased spending by visitors from China. Expenditure of travelers arriving from Russia decreased by only four percent (-21 million. ). Visitors from abroad spent about EUR 70 million more on accommodation, as well as about EUR 40 million more in restaurants and cafes than earlier. Spending on shopping and food decreased by approximately EUR 50 million, despite the fact that one hundred thousand more shopping trips than the previous year were made from Russia. The amount of money spent on purchases was less due to reduced spending by the Estonians as well as smaller average purchases made by the Chinese visitors last year. The Chinese still spent on average more than others on shopping during their trip (230 ). For example, the Russians spend an average of 130 euros. Advance expenses also increased by about EUR 60 million from last year. Visitors spent on average about EUR 320 per trip in Finland, when the advance expenses are included. The Chinese used the most money per visitor (940 ).
7 7 Introduction THE PURPOSE OF THE SURVEY The TAK Border Survey, of which the Visit Finland Visitor Survey is part, is an on-going research project which began in The purpose is to provide data on non-resident visitors to Finland. The survey helps to identify, among other things, the annual number of visitors to Finland and the amount of money they spend in Finland. In addition, the study provides information on the profiles of incoming visitors from different countries: how long people stay in Finland, where they stay, why they come to Finland, how often they come to Finland, what they do during the trip, where they go during the journey and what they do in Finland. EXECUTION OF THE SURVEY The survey is carried out year-round on different days and at different times by interviewing tourists aged over 14, residing abroad and exiting Finland at the border stations. The interviewees are chosen using equally spaced sampling, e.g., by selecting every fifth traveler. Interview dates are selected at random for the entire year, except in Lapland, where the interviews are carried out during the winter season. Interviews are carried out at the Helsinki and Turku ports, at the Helsinki, Turku, Tampere, Rovaniemi and Kittilä airports as well as on the eastern border in Vaalimaa, Nuijamaa, Vainikkala, Imatra and Niirala. At the eastern border the heavy goods traffic is not taken into account, and in the ports of Helsinki, international cruise ships are discounted. The survey covers 94% of the eastern border traffic through the five border stations included in the survey. The number of trips in the report corresponds to the number of visitors living abroad leaving Finland through the border stations included in the study in In 2016 a total of 53,172 travelers leaving Finland were approached. Of these travelers 48% lived in Finland. The percentage of foreign visitors under 15 years of age was 2.2%, and 28.0% refused to answer, did not have time to answer or were not interviewed due to some other reason. A total of 19,051 interviews were completed during the year Tutkimus- ja Analysointikeskus TAK Oy is responsible for the practical implementation of the survey.
8 8 RELIABILITY OF THE RESULTS The results are weighted to match the actual number of travelers at airports, ports and the eastern border which are included in the survey. As regards the Helsinki airport and ports, the passenger volume is weighted according to the travel destination (country). In addition, in the ports, the material is weighted to match the distribution of countries of residence from the shipping companies statistics. Transit passengers at the Helsinki-Vantaa airport, people who have a job in Finland and visitors whose trip lasted a year or longer are not included in the report. The error margin resulting from the random sample of the survey results for the percentages of the entire material is at most ± 0.7 percentage points when including all travelers. In country-specific results the sample sizes vary between 101 and 9,046, resulting in countryspecific margins of error ranging between ± percentage points. COMPARABILITY OF RESULTS For the year 2016 much more accurate statistics on ships' traffic were achieved: distribution of the country of residence of passengers (Estonia, Sweden, Russia, China, Japan, other). In addition, visitor configuration was changed from 2015 so that it includes the so-called regulars, i.e. people who visit Finland at least once a week, but does not include transit passengers. The 2015 figures have been calculated in this report again, using the number of travelers in 2016, as well as the corresponding country of residence distribution with regard to ports in For this reason, the figures which appear in the 2015 figures differ from the old (year 2015) report. In respect to the 2015 material, information on whether day passengers are in fact transit passengers at the Helsinki-Vantaa airport will be received beginning from July. For this reason, comparisons to the year 2015 are based on data for July-December.
9 9 TERMS TRIP The number of trips in this report refers to the number of persons residing abroad who have left Finland. Figures do not include those working in Finland, or those staying in Finland at least one year or transit passenger trips. TRANSIT PASSENGER Transit passengers are travelers leaving Finland who only changed planes at the Helsinki-Vantaa airport and did not leave the airport during their trip. TRANSIT VISITOR Transit visitors are visitors for whom Finland is not the main destination. Their main destination is thus elsewhere but they travel there through Finland. Transit visitors may, however, spend time in and stay overnight in Finland before continuing their trips.
10 10 Trips to Finland
11 11 Trips to Finland A total of 7.7 million trips were made to Finland Graph 1. Trips to Finland (the trips of people working in Finland, or trips lasting a year or longer or transit passengers are not included) In 2016 non-resident visitors made 7.70 million trips to Finland, which is two percent more than the previous year. A good third of the trips were made by people living in Russia. A fifth of the total trips were from Sweden and Estonia and every eighth visitor to Finland came from Asia.
12 12 Change in trips Trips increased, especially from Asian countries 97% 59% 2% 6% 17% 1% 13% 15% 19% 8% 26% 0% 3% 4% 3% 18% 35% 7% 44% -1% -7% -17% -8% -4% -36% -38% -31% -11% -5% -19% Graph 2. The change in trips from 2015 (the trips of people working in Finland, or trips lasting a year or longer or transit passengers are not included) Trips to Finland increased by two per cent from The largest relative increase were trips from India, but in absolute terms the greatest increase came from China, with over 90,000 trips. Around 50,000 more trips than the year before were made from Germany, Sweden and South Korea. Travel to Finland also increased from the EU countries, although fewer trips were made from Poland, Belgium and Latvia. The largest number of trips decreased from Russia ( trips) and the highest proportion from Norway, Switzerland and Canada. Swiss and Canadian decline in tourism in 2016 was affected by the Gymnaestrada event in gymnastics, as well as the World Junior Ice Hockey Championships organized in Finland. Road border stations between Finland and Norway are not included in the study.
13 13 Day and overnight trips A total of 3.1 million day trips and 4.6 million overnight trips were made Day Overnight Graph 3. Day and overnight trips to Finland (the trips of people working in Finland, or trips lasting a year or longer or transit passengers are not included) Two out of five trips made to Finland in 2016 were day trips. More than 60 percent of day trips were made by Russians, and 20 percent made by Estonians or Swedes. The Russians also made the most overnight trips (760,000 trips), or one in every six overnight trips. Visitors arriving from Sweden made almost the same number of overnight trips (640,000 trips). Over 40 percent of overnight trips were from Russia, Sweden and Estonia.
14 14 The change in day trips and overnight trips Overnight trips increased the most from China and Japan Day trips Overnight trips Estonia Sweden Germany United Kingdom France Denmark Italy Netherlands Spain Poland Belgium Lithuania Latvia Other EU countries Russia Norway Switzerland Rest of Europe United States Canada Latin America Japan China South Korea India Rest of Asia Africa Australia Rest of Oceania Graph 4. The change in day and overnight trips since 2015 (the trips of people working in Finland, or trips lasting a year or longer or transit passengers are not included) Overnight trips increased the most from China and Japan (about 50,000 trips more) and decreased most from Russia and Estonia. However, more day trips were made from these countries. The same trend was also seen in Swedish tourism. Russian trips have been decreasing from 2014 until now, but now day trips seem to have begun to increase again. Germany increased both day tips and overnight trips.
15 15 Finland as the main destination In nine out of ten trips made to Finland from Europe, Finland was the main destination. 100% 50% 0% Graph 5. Finland as the main destination (the trips of people working in Finland, or trips lasting a year or longer or transit passengers are not included) Finland was the main destination in over four-fifths (83%) of all trips made to Finland. Such trips during the year amounted to 6.4 million (EUR compared to 2015). About two-fifths were made by visitors living in Russia. Most frequently Finland is the main destination of trips made from Europe (90% of trips), when trips made to Finland as the main destination from outside Europe is 60 percent.
16 16 Trips to Finland Day trip, Finland not the main destination Day trip, Finland the main destination Overnight, Finland not the main destination Overnight, Finland the main destination Estonia 151 (49) 265 (229) 46 (29) 460 (625) 921 (932) Sweden 22 (20) 197 (119) 18 (21) 624 (653) 861 (812) Germany 39 (13) 18 (21) 34 (21) 314 (291) 404 (345) Great Britain 9 (6) 20 (16) 14 (39) 210 (191) 253 (251) France 8 (4) 6 (8) 8 (11) 153 (133) 176 (156) Denmark 2 (2) 6 (9) 3 (5) 69 (53) 80 (70) Italy 3 (4) 7 (5) 18 (18) 87 (72) 118 (99) The Netherlands 11 (2) 2 (3) 6 (6) 67 (67) 86 (80) Spain 6 (2) 3 (7) 12 (16) 122 (89) 144 (114) Poland 2 (3) 3 (3) 3 (5) 63 (65) 71 (76) Belgium 1 (5) 1 (3) 5 (3) 37 (42) 44 (53) Lithuania 9 (8) 5 (5) 15 (7) 13 (22) 42 (42) Latvia 11 (4) 8 (6) 5 (1) 36 (54) 59 (64) Other EU countries 5 (14) 3 (7) 52 (34) 155 (154) 216 (210) Russia 153 (143) 1773 (1628) 38 (58) 723 (965) 2686 (2794) Norway 2 (26) 6 (5) 5 (7) 52 (64) 65 (101) Switzerland 0 (7) 2 (3) 9 (5) 49 (82) 60 (97) Rest of Europe 10 (22) 9 (25) 14 (6) 67 (43) 100 (96) The United States 19 (18) 3 (5) 37 (43) 86 (75) 145 (140) Canada 4 (2) 2 (5) 8 (12) 16 (25) 31 (44) Latin America 10 (3) 7 (1) 17 (26) 29 (42) 64 (71) Japan 58 (59) 7 (16) 47 (34) 119 (88) 231 (196) China 67 (15) 24 (40) 89 (82) 176 (126) 356 (264) South Korea 27 (10) 39 (20) 37 (34) 31 (20) 134 (85) India 3 (1) 13 (3) 23 (11) 31 (21) 71 (36) Rest of Asia 18 (17) 7 (14) 45 (57) 137 (129) 208 (218) Africa 5 (0) 4 (0) 4 (5) 13 (20) 26 (24) Australia 5 (4) 2 (3) 19 (23) 16 (23) 42 (53) Rest of Oceania 1 (0) 0 (0) 4 (7) 3 (3) 7 (5) Total 661 (460) 2445 (2210) 638 (620) 3961 (4238) 7705 (7529) Table 1. Trips to Finland, thousand trips (the year 2015 in brackets) Total
17 17 Purpose of the trip Business trips and transit trips increased from last year Business trip Visit to friend Shopping trip Holiday trip Transit Other reason Graph 6. Purpose of the trip, 1000 trips (Transit = Finland is not the main destination) Three hundred thousand more business trips were made to Finland than in Transit trips (a trip in which Finland was not the main destination) increased by 220,000 trips. However, there were 320,000 fewer visits to friends than before. Business trips increased, particularly from Sweden and Estonia, while visits to friends from these countries and Russia decreased. Also, shopping trips from Russia increased. This may explain in part the increase in day trips and the decrease in overnight trips from these countries. Transit trips from Estonia and China increased, as did holiday trips from Sweden and China.
18 18 Purpose of the trip Business trip Visit to friends or relatives Shopping trip Holiday trip Transit Other reason Estonia 280 (171) 223 (287) 46 (110) 126 (213) 197 (77) 49 (73) Sweden 177 (111) 316 (425) 27 (17) 229 (119) 40 (41) 71 (101) Germany 97 (81) 109 (93) 4 (1) 86 (105) 72 (34) 36 (32) Great Britain 77 (39) 67 (59) 1 (0) 77 (101) 23 (44) 9 (9) France 33 (27) 48 (33) 0 (1) 55 (42) 16 (15) 23 (38) Denmark 44 (32) 14 (17) 2 (1) 12 (8) 5 (8) 4 (4) Italy 25 (18) 17 (21) 5 (0) 31 (32) 21 (22) 19 (7) The Netherlands 25 (29) 25 (25) 0 (2) 15 (9) 17 (9) 3 (6) Spain 23 (20) 50 (24) 0 (0) 41 (40) 18 (18) 11 (12) Poland 26 (17) 13 (24) 2 (0) 20 (13) 5 (8) 5 (14) Belgium 16 (11) 13 (19) 0 (0) 5 (12) 7 (9) 4 (3) Lithuania 8 (10) 4 (7) 0 (0) 4 (5) 24 (15) 1 (6) Latvia 22 (15) 12 (9) 0 (2) 8 (22) 16 (5) 2 (11) Other EU countries 48 (47) 43 (50) 1 (1) 44 (33) 57 (49) 22 (29) Russia 166 (164) 210 (371) 1578 (1475) 473 (496) 191 (201) 67 (88) Norway 25 (29) 22 (22) 2 (0) 7 (11) 7 (33) 3 (7) Switzerland 10 (12) 13 (26) 1 (1) 22 (34) 9 (12) 5 (12) Rest of Europe 21 (13) 19 (20) 1 (12) 14 (19) 24 (28) 20 (3) The United States 28 (23) 26 (26) 1 (1) 22 (25) 56 (60) 12 (6) Canada 5 (7) 6 (13) 0 (0) 7 (5) 12 (14) 1 (4) Latin America 9 (6) 10 (16) 0 (1) 10 (17) 27 (29) 7 (4) Japan 22 (4) 8 (11) 18 (22) 69 (53) 105 (93) 9 (14) China 19 (32) 13 (12) 11 (3) 126 (76) 156 (97) 31 (43) South Korea 9 (10) 3 (0) 17 (0) 29 (17) 64 (44) 12 (13) India 17 (12) 10 (7) 2 (0) 14 (3) 26 (12) 2 (3) Rest of Asia 31 (24) 26 (28) 3 (11) 64 (42) 64 (74) 20 (38) Africa 4 (8) 6 (5) 4 (0) 1 (2) 9 (5) 2 (4) Australia 4 (3) 6 (9) 0 (0) 8 (14) 24 (26) 1 (1) Rest of Oceania 1 (0) 2 (1) 0 (0) 0 (2) 5 (2) 0 (0) Total 1271 (973) 1334 (1657) 1727 (1662) 1621 (1571) 1299 (1081) 452 (585) Table 2. Trips to Finland, thousand trips (the year 2015 in brackets)
19 19 Organising the trip Asians and Australians use travel agents the most 50% Used a travel agency to help in organizing the trip 25% 0% Graph 7. Used a travel agency to help in organizing the trip, % of trips A travel agency was most frequently used to help in arranging trips from Asia and Australia. A travel agency at least helped with trip planning or booking for almost every other trip from Japan and 44% of trips from China. Russians used travel agencies the least when planning and booking trips to Finland.
20 20 Organizing the trip I planned and made reservations myself The travel agency organized a customized travel package according to my wishes I booked a package tour with a fixed itinerary from the travel agency. I planned and booked part of the trip myself and I used a travel agency for part of the trip. My employer organised the trip Estonia Sweden Germany Great Britain France Denmark Italy The Netherlands Spain Poland Belgium Lithuania Latvia Other EU countries Russia Norway Switzerland Rest of Europe The United States Canada Latin America Japan China South Korea India Rest of Asia Africa Australia Rest of Oceania Total Table 3. Organising the trip, thousand trips Other
21 21 Duration of trip
22 22 Duration of trip DAY TRIPS INCREASED AND OVERNIGHT TRIPS DECREASED one day trip 2 days 3 days 4 to 5 days longer than 5 days Graph 8. Duration of trip, 1000 trips 450,000 more day trips were made to Finland than previously. The increase came in practice from the Russians, Estonians and Swedes, but also from the Chinese and the South Koreans. By contrast, the number of overnight trips decreased. Two to three-day trips decreased by 230,000 and trips of 5 days or longer decreased by 110,000 from According to Statistics Finland the length of trips with overnight stays in registered accommodation establishments shortened by two percent.
23 23 Number of overnight stays Visitors living abroad spent 28 million nights in Finland Graph 9. Number of overnight stays (nights) Visitors living abroad spent 28.3 million nights in Finland last year, which is 11 percent less than in Overnight stays from Russia alone decreased by 1.1 million nights. The number of nights spent greatly affects the relative development of day and overnight trips Compared to 2015, the number of day trips increased and the number of overnight trips decreased from several countries. Most of the nights spent in Finland are generated by long-term visitors: about one-fifth of the visitors spent at least 6 days in Finland, but their overnight stays were three-fourths of total overnight stays for the year. The long-staying visitors in Finland often stay in their own or in rented dwellings, as well as with relatives, in which case they are excluded from the official accommodation statistics.
24 24 The change in number of overnight stays There were 11% fewer overnight stays than last year 178% 23% 35% 19% 6% 37% 21% -11% -3% -4% -19% -1% -16% -9% -45% -4% -55% -40% -30% -24% -57% -1% -31% -69% -7% -25% -24% -23% -28% -41% Graph 10. Change in overnight stays compared to 2015 There were over 3.5 million fewer overnight stays in Finland than in The drop in numbers was mostly due to the drop in visits to family and friends. For example, overnight stays in registered accommodation establishments increased by 5 percent. Overnight stays increased most for visitors from Italy, France, China and Japan. The number of trips also increased from these countries. By contrast, fewer German visitors stayed overnight even though the number of trips increased. In other words, German visitors stayed a shorter time than earlier. Trips of a year or longer are not included. However, the long, several months, work / study trips and friends and relatives visits have a large impact on the total number of and changes in the number of overnight stays.
25 25 Duration of the trips and number of overnight stays Day trip 2 days 3 days 4-5 days 6 days or more Average duration, nights Total number of nights Estonia 413 (278) 119 (164) 102 (171) 102 (147) 185 (172) 3,4 (3,4) 3089 (3192) Sweden 220 (139) 117 (167) 159 (175) 208 (163) 156 (169) 3,6 (3,9) 3064 (3192) Germany 56 (34) 48 (48) 67 (55) 92 (72) 142 (136) 5,9 (8,5) 2367 (2932) Great Britain 29 (22) 32 (32) 30 (36) 82 (67) 79 (94) 4,8 (4,9) 1228 (1237) France 15 (12) 18 (12) 22 (24) 43 (35) 78 (73) 10,2 (9,3) 1792 (1456) Denmark 8 (11) 15 (14) 18 (13) 19 (19) 20 (13) 4,5 (3,8) 363 (268) Italy 13 (8) 13 (13) 8 (13) 31 (29) 53 (35) 13,8 (5,9) 1627 (585) The Netherlands 13 (6) 6 (11) 14 (16) 29 (22) 24 (25) 4,3 (5,6) 374 (446) Spain 9 (9) 23 (11) 15 (15) 33 (29) 63 (49) 7,8 (10,8) 1122 (1227) Poland 5 (7) 6 (7) 13 (8) 26 (26) 21 (28) 6,4 (10,8) 454 (821) Belgium 13 (8) 7 (6) 8 (8) 11 (12) 17 (19) 6,6 (5,7) 292 (302) Lithuania 13 (13) 15 (9) 6 (3) 3 (7) 4 (10) 3,1 (6,8) 130 (287) Latvia 18 (9) 9 (6) 8 (18) 11 (19) 13 (12) 5,5 (4,3) 326 (274) Other EU countries 10 (21) 55 (19) 24 (28) 63 (48) 65 (93) 5,4 (9,2) 1162 (1931) Russia 1937 (1771) 242 (332) 195 (260) 184 (221) 128 (209) 0,9 (1,2) 2416 (3469) Norway 8 (18) 7 (13) 19 (16) 17 (18) 14 (23) 4,3 (3,6) 277 (363) Switzerland 2 (9) 8 (7) 6 (11) 20 (26) 24 (44) 5,4 (7,9) 323 (761) Rest of Europe 25 (47) 13 (4) 10 (9) 23 (15) 29 (21) 7,1 (7) 710 (669) The United States 21 (22) 24 (19) 16 (26) 33 (31) 51 (43) 5,9 (6,1) 856 (863) Canada 6 (7) 3 (8) 5 (5) 5 (10) 11 (15) 6,5 (6,5) 199 (289) Latin America 17 (4) 8 (14) 5 (11) 12 (11) 22 (31) 4,8 (13,9) 307 (993) Japan 65 (75) 44 (33) 30 (18) 47 (32) 46 (39) 3,4 (2,9) 781 (572) China 90 (56) 65 (66) 55 (24) 59 (56) 87 (63) 5,2 (5,8) 1849 (1532) South Korea 67 (30) 29 (21) 14 (12) 8 (13) 16 (8) 2,7 (5,8) 369 (490) India 17 (4) 21 (7) 5 (2) 14 (7) 14 (15) 4,4 (11,4) 311 (408) Rest of Asia 27 (31) 29 (28) 24 (34) 54 (28) 74 (96) 8,7 (10,8) 1816 (2353) Africa 9 (0) 1 (1) 0 (1) 4 (5) 12 (17) 13,2 (23,7) 343 (577) Australia 7 (6) 4 (5) 1 (6) 11 (17) 15 (19) 6,1 (6,8) 258 (358) Rest of Oceania 1 (0) 1 (0) 1 (0) 3 (1) 2 (3) 6,6 (10,2) 49 (53) Total 3124 (2670) 989 (1079) 881 (1018) 1248 (1185) 1463 (1577) 3,7 (4,2) (31904) Table 4. The duration of the trip and the number of overnight stays, thousand trips / nights (in brackets the year 2015)
26 26 Overnight accommodation There were over 400,000 fewer overnight stays with friends and relatives than a year earlier Hotel or motel Camping, hostel or rental cottage Rental flat Friends or family Other (other e.g. own home or cottage) Graph 11. Overnight accommodation, 1000 arrivals to accommodation More travelers stayed in hotels and motels as well as rental housing (including Airbnb) than before. Overnight stays in the hotels and motels showed an increase of 7 percent. According to Statistics Finland foreign arrivals in hotels increased by 8%. However, there were over 400,000 fewer overnight stays with friends and relatives than a year earlier. Eighty percent of these visitors were from Russia, Sweden or Estonia.
27 27 Overnight accommodation Hotel or motel Camping, hostel or rental cottage Rental flat Friends or relatives Other (e.g. own home or cottage) Estonia 141 (144) 33 (59) 25 (40) 236 (346) 85 (82) Sweden 266 (195) 41 (23) 7 (14) 246 (350) 129 (94) Germany 167 (149) 40 (51) 31 (19) 114 (87) 28 (31) Great Britain 132 (120) 23 (23) 10 (8) 64 (82) 18 (13) France 82 (67) 20 (37) 30 (19) 44 (51) 7 (21) Denmark 44 (37) 6 (1) 5 (4) 15 (17) 6 (3) Italy 58 (52) 13 (14) 18 (7) 22 (21) 3 (4) The Netherlands 39 (41) 5 (4) 7 (2) 23 (22) 3 (6) Spain 63 (53) 16 (14) 9 (16) 46 (27) 18 (7) Poland 39 (32) 10 (6) 4 (4) 16 (21) 4 (12) Belgium 21 (24) 7 (7) 6 (2) 12 (15) 2 (6) Lithuania 21 (15) 1 (4) 2 (1) 5 (6) 1 (4) Latvia 17 (21) 7 (8) 5 (4) 10 (17) 5 (6) Other EU countries 92 (84) 52 (28) 18 (16) 40 (61) 21 (19) Russia 273 (368) 135 (170) 37 (29) 212 (347) 109 (101) Norway 26 (38) 3 (3) 4 (1) 21 (20) 9 (11) Switzerland 35 (42) 8 (9) 2 (4) 14 (26) 7 (15) Rest of Europe 43 (26) 6 (5) 5 (3) 17 (16) 9 (3) The United States 71 (79) 14 (11) 9 (6) 31 (29) 10 (7) Canada 13 (19) 4 (5) 1 (2) 8 (12) 1 (3) Latin America 23 (30) 6 (25) 3 (4) 13 (14) 6 (3) Japan 138 (102) 8 (10) 8 (6) 8 (10) 7 (6) China 200 (159) 23 (18) 39 (13) 10 (10) 14 (13) South Korea 38 (40) 9 (6) 8 (3) 1 (3) 7 (3) India 37 (18) 1 (4) 5 (2) 6 (5) 4 (5) Rest of Asia 105 (82) 17 (13) 26 (7) 27 (82) 23 (20) Africa 7 (10) 2 (3) 1 (2) 9 (11) 1 (1) Australia 18 (24) 4 (7) 7 (5) 7 (11) 3 (3) Rest of Oceania 0 (3) 0 (0) 1 (1) 4 (7) 1 (1) Total 2212 (2073) 519 (549) 334 (262) 1282 (1719) 538 (504) Table 5. Overnight accommodation, thousand arrivals to accommodation (in brackets the year 2015)
28 28 Expenditures in Finland
29 29 Expenditures in Finland EUR 2.50 billion was spent in Finland 400 Millions Graph 12. Expenditures in Finland Visitors arriving from abroad spent EUR 2.50 billion in Finland in 2016, or 130 million more than the year before. Expenditures by people arriving from Russia made up some one fifth while their share of trips made to Finland was one third. Also visitors from China and Japan spent altogether just over one fifth of the money spent by foreign visitors in Finland over the course of the year. Visitors from Germany, Sweden and Estonia were the next largest groups in terms of expenditures. Of the total amount, about one-fifth (EUR 530 million ) was paid in advance for accommodation, car rental, entrance fees, etc. The sum of EUR 2.5 billion does not include border checkpoints not included in the study or tickets to Finland, which make up approximately EUR 1.4 billion in tourism income in Finland. When these are taken into account, it can be estimated that Finland received tourism income comparable to export income of approximately EUR 3.9 billion.
30 30 Change in expenditures Expenditures by visitors in Finland increased by five percent 101% 75% 47% 55% 26% 36% 30% 5% 10% 2% 11% 8% 4% 10% 13% 4% -15% -7% -19% -23% -4% -4% -20% -4% -9% -32% -37% -41% -38% -38% Graph 13. Change in expenditures compared to 2015 Expenditures by non-resident visitors in Finland increased by five percent compared to the previous year. The largest amount (+77 million ) was from increased spending by visitors from China. Expenditure of visitors arriving from Russia decreased by only four percent (-21 million. ).
31 31 Shopping basket Expenditure on accommodation and restaurants increased Advance expenses Accommodation Restaurants and cafes Shopping and food Transport Cultural services Entertainment Other Graph 14. Itemized expenditures in Finland, EUR million Visitors from abroad spent about EUR 70 million more on accommodation, as well as about EUR 40 million more in restaurants and cafes than earlier. Spending on shopping and food decreased by approximately EUR 50 million, despite the fact that one hundred thousand more shopping trips than the previous year were made from Russia. The amount of money spent on purchases was less due to reduced spending by the Estonians as well as lower average purchases made by the Chinese visitors last year. The Chinese still spent on average more than others on shopping during their trip (230 ). For example, the Russians spend an average of 130 euros. Advance expenses also increased by about EUR 60 million from last year.
32 32 Expenditure per trip Visitors to Finland used an average of EUR 320 per trip Graph 15. Expenditures in Finland per trip The tourists spent on average about EUR 320 per journey in Finland, when the advance expenses (prepaid accommodations, car rentals, admission fees etc.) are included. The Chinese used the most money per visitor (940 ). Visitors arriving from outside Europe spent more than the others, while visitors from neighboring countries spent the least amount of money in Finland per trip.
33 33 Expenditures in Finland Advance expenses / trip Product purchases / matka Services / trip Total / trip Total / per day Total (million ) Estonia 17 (12) 48 (70) 71 (77) 136 (159) 31 (36) 125 (148) Sweden 25 (39) 52 (59) 123 (94) 200 (192) 44 (39) 172 (156) Germany 80 (80) 70 (90) 223 (256) 373 (426) 54 (45) 151 (147) Great Britain 135 (95) 72 (49) 249 (220) 457 (364) 78 (62) 116 (92) France 97 (140) 120 (99) 344 (331) 560 (571) 50 (55) 99 (89) Denmark 94 (45) 57 (30) 263 (196) 414 (271) 75 (56) 33 (19) Italy 122 (86) 77 (45) 338 (304) 537 (435) 36 (63) 63 (43) The Netherlands 94 (109) 42 (78) 242 (250) 378 (437) 71 (66) 32 (35) Spain 115 (117) 96 (81) 371 (343) 582 (541) 66 (46) 84 (62) Poland 68 (83) 63 (116) 269 (350) 399 (549) 54 (46) 28 (42) Belgium 81 (87) 91 (66) 237 (265) 410 (418) 54 (63) 18 (22) Lithuania 23 (14) 47 (66) 101 (143) 171 (222) 42 (28) 7 (9) Latvia 29 (56) 36 (49) 101 (138) 166 (243) 26 (46) 10 (16) Other EU countries 93 (54) 90 (105) 242 (295) 426 (455) 67 (45) 92 (95) Russia 17 (18) 126 (122) 31 (35) 175 (175) 92 (78) 469 (490) Norway 67 (37) 70 (97) 252 (181) 389 (315) 74 (69) 25 (32) Switzerland 185 (216) 122 (133) 316 (314) 623 (663) 98 (75) 38 (64) Rest of Europe 48 (33) 65 (170) 224 (162) 337 (365) 41 (46) 34 (35) The United States 133 (121) 82 (73) 339 (337) 554 (531) 80 (74) 80 (75) Canada 172 (82) 89 (112) 335 (260) 596 (454) 80 (60) 18 (20) Latin America 129 (242) 80 (112) 293 (375) 503 (728) 86 (49) 32 (52) Japan 135 (241) 116 (140) 256 (191) 507 (572) 116 (146) 117 (112) China 304 (229) 226 (353) 411 (394) 941 (976) 152 (143) 335 (257) South Korea 133 (140) 138 (114) 188 (215) 459 (469) 122 (69) 62 (40) India 121 (87) 128 (105) 302 (348) 551 (540) 102 (44) 39 (19) Rest of Asia 219 (162) 159 (193) 392 (311) 770 (666) 79 (56) 160 (145) Africa 119 (131) 339 (249) 342 (377) 799 (756) 56 (31) 21 (18) Australia 342 (248) 97 (71) 369 (308) 807 (627) 114 (80) 34 (33) Rest of Oceania 13 (214) 67 (106) 175 (275) 255 (595) 34 (53) 2 (3) Total 68 (62) 101 (110) 155 (143) 324 (315) 69 (60) 2497 (2370) Table 6. Expenditure in Finland, EUR (in brackets the year 2015)
34 34 Travel destination in Finland

35 35 Travel destination in Finland Picture 1. Travel destination in Finland
36 36 Travel destination the Helsinki Metropolitan Area Trips to the Helsinki Metropolitan Area totalled 3.9 million Graph 16. Travel destination the Helsinki Metropolitan Area Most trips to the Helsinki Metropolitan Area were made from Estonia, Russia, Sweden, China and Germany. The Helsinki Metropolitan Area was the main destination for one out of two trips to Finland. For Russian visitors, the Helsinki Metropolitan Area was the main destination for only one in four trips while 2/3 of trips made by other foreigners had the capital area as their main destination.
37 37 Destination archipelago / coast The number of trips to the archipelago and coastal regions was 1.2 million Graph 17. Destination archipelago / coast (Kotka-Hamina area, Finland Proper, Åland, Western Finland) The number of trips to the archipelago and coastal regions was 1.2 million. Two-thirds of the trips were made by the Russians and Swedes. Trips to the archipelago / coast from Estonia were 85,000, from Germany 42,000 and from China 35,000.
38 38 Destination Finnish Lakeland A total of 2.7 million trips were made to Finnish Lakeland Graph 18. Finnish Lakeland (Pirkanmaa, Päijät-Häme, Etelä-Karjala, Keski-Suomi, Etelä-Savo, Pohjois-Savo, Pohjois-Karjala, Kainuu) Finnish Lakeland was the main destination for every third trip. The Russians made two-thirds of these trips. Most of their trips were made to Lappeenranta and Imatra. Visitors arriving from Estonia and Sweden made a little less than 200,000 trips to Finnish Lakeland. Close to a hundred thousand trips from Germany, 45,000 trips from the UK and 35,000 trips from France and China were made to Finnish Lakeland.
39 39 Travel destination Lapland A total of 0.5 million trips were made to Lapland Graph 19. Travel destination Lapland About a half a million trips were made to Lapland last year. The number is the same as the number visitors arriving at registered accommodation establishments reported by Statistics Finland. The northern road border stations, through which mainly Norwegian and Russian visitors enter, are not included in the study. People travelling most to Lapland were Chinese, British, Japanese, German, Estonian and French.
40 40 Travel destination in Finland The Helsinki Metropolitan Area Archipelago / coast Finnish Lakeland Lapland Estonia Sweden Germany Great Britain France Denmark Italy The Netherlands Spain Poland Belgium Lithuania Latvia Other EU countries Russia Norway Switzerland Rest of Europe The United States Canada Latin America Japan China South Korea India Rest of Asia Africa Australia Rest of Oceania Total Table 7. Travel destination in Finland, thousand trips
41 41 What is interesting about Finland
42 42 What is interesting about Finland Cultural sites is perceived as most interesting 100% Europe North America Latin America Asia Africa (indicative) Australia & Oceania 0% Finnish cultural attractions Finnish archipelago Finnish culinary experiences Finnish sauna Wellness services and treatments Summer activities on land Summer activities on the water Winter sports Other winter activities and experiences Graph 20. What is interesting in Finland, % trips Visitors were asked which of the above Finnish recreational activities interested them. Finnish cultural sites most frequently reported to be of interest. Visitors from Europe are less interested in them than others. By contrast, they were more interested in wellness services and treatments. In general, the wellness services do not, however, attract very many visitors. Winter experiences interested travelers from Australia, Asia and North America most and summer activities interested those arriving from North America, Europe and Australia. Australians were on average more interested in all of the abovementioned activities.
43 43 Finnish cultural sites The visitors arriving from outside Europe were more interested in Finnish cultural sites. 100% Interested in Experienced during trip 17% 18% 24% 17% 22% 21% 55% 46% 39% 30% 22% 27% 27% 25% 12% 64% 12% 34% 15% 67% 14% 21% 17% 52% 47% 53% 25% 30% 16% 43% 14% 13% 35% 15% 15% 11% 60% 47% 41% 19% 48% 16% 74% 17% 28% 14% 66% 21% 55% 16% 10% 26% 43% 48% 34% 18% 55% 19% 25% 0% 10% Graph 21. Experienced / interested in Finnish cultural sites, % trips The visitors arriving from outside Europe were more interested in Finnish cultural sites. They have also visited these sites more often during their trips. Visitors from Japan are not as interested in Finnish culture as those arriving from other Asian countries. Likewise, Russians have very little interest in Finnish culture.
44 44 Finnish Archipelago Over half of those interested in experiencing the Finnish archipelago did not do so during their trip. 100% Interested in Experienced during trip 0% 29% 19% 24% 29% 17% 7% 5% 9% 13% 9% 31% 31% 14% 17% 21% 12% 16% 9% 28% 35% 30% 44% 37% 26% 19% 13% 16% 6% 7% 11% 4% 1% 37% 24% 24% 20% 17% 24% 14% 17% 16% 16% 10% 7% 22% 14% 10% 5% 4% 11% 18% 13% 19% 15% 17% 13% 11% 4% 34% 3% Graph 22. Experienced / interested in the Finnish archipelago, % trips Over half of those interested in experiencing the Finnish archipelago did not do so during their trip. This also includes travelers who visited Finland during the summer. The reason may be that there wasn't enough time for a visit to the archipelago during the trip, or, for example, because the visitor does not know how to get to the archipelago, or getting there is too difficult. This also indicates that the archipelago is a potential tourist destination for visitors arriving from abroad.
45 45 The Finnish cuisine Asians and Russians are the least interested in the Finnish cuisine 100% Interested in Experienced during trip 9% 0% 10% 14% 19% 13% 12% 22% 14% 17% 10% 16% 14% 14% 14% 11% 33% 38% 35% 36% 32% 33% 34% 39% 43% 40% 56% 17% 12% 24% 30% 3% 4% 14% 24% 16% 42% 11% 23% 16% 19% 10% 41% 36% 41% 8% 8% 14% 6% 8% 20% 18% 9% 10% 5% 27% 24% 9% 8% 50% 45% Graph 23. Experienced / interested in Finnish cuisine, % trips Asians and Russians are clearly less interested in the Finnish cuisine than other visitors. On average, one in five visitors said they had experienced the Finnish cuisine during the trip, and about one third of are interested in it.
46 46 Finnish sauna There was a visit to a Finnish sauna on every fifth trip. 100% Interested in Experienced during trip 0% 21% 21% 16% 18% 20% 30% 30% 28% 20% 16% 19% 44% 20% 21% 20% 31% 20% 19% 16% 36% 25% 23% 33% 34% 52% 23% 17% 17% 22% 27% 13% 9% 30% 22% 18% 10% 21% 27% 37% 34% 27% 24% 22% 15% 27% 14% 13% 20% 16% 23% 17% 13% 14% 31% 7% 22% 18% 11% 42% 47% Graph 24. Experienced / interested in the Finnish sauna, % trips Russians were also the least interested in the sauna, even though the sauna visits by Russians was the second highest after Sweden. This is due to the large number of trips made by Russians. On average there was a visit to a Finnish sauna on every fifth trip. In addition, another fifth is interested in going to sauna, but did not have the opportunity to do so during their trip. During the year 260,000 visitors from Sweden, 240,000 visitors from Russia, 145,000 visitors from Estonia and 120,000 visitors from Germany went to the sauna during their trip.
47 47 Wellness services and treatments Wellness services are mainly used by visitors from Russia. 100% Interested in Experienced during trip 0% 28% 12% 15% 14% 25% 10% 10% 8% 7% 9% 4% 3% 3% 2% 3% 9% 7% 9% 4% 5% 1% 1% 4% 3% 8% 13% 9% 9% 9% 8% 7% 2% 3% 4% 0% 2% 4% 6% 3% 6% 7% 5% 6% 2% 3% 4% 6% 9% 0% 1% 1% 2% 1% 0% 4% 8% 5% 0% 1% 0% Graph 25. Experienced / interested in wellness services and treatments, % trips Visitors used the wellness services and treatments in Finland on less than one in twenty trips. More than half of those using wellness treatments were Russian. Over ten thousand trips using these services were made from Estonia, Sweden, and France. Those arriving from other countries used these services significantly less frequently. Little interest in and use of these services perhaps indicates that visitors want to experience something else or they do not consider Finland a particularly wellness services-oriented country. A total of 310,000 trips used wellness services during the year.
48 48 Summer activities on land Asians were the least interested in summer activities on land. 100% Interested in Experienced during trip 0% 27% 32% 26% 31% 33% 29% 31% 9% 6% 10% 11% 12% 18% 8% 25% 38% 25% 15% 11% 18% 20% 11% 39% 18% 37% 33% 27% 31% 14% 9% 13% 11% 9% 9% 34% 16% 38% 34% 39% 33% 26% 29% 22% 16% 19% 23% 17% 10% 6% 11% 13% 9% 2% 5% 4% 10% 9% 7% 4% 6% Graph 26. Experienced / interested in summer activities in the countryside (e.g. cycling, hiking, watching animals), % trips Summer activities on land are e.g. cycling, hiking and wildlife watching. Visitors arriving from Europe, North America, and Australia are more interested in these types of activities than visitors from Asia, Latin America and Africa. Visitors arriving from Europe most frequently participated in these activities during their trip.
49 49 Summer activities on the water Asians were the least interested in summer activities on the water. 100% Interested in Experienced during trip 0% 35% 24% 28% 25% 34% 33% 29% 33% 25% 28% 26% 27% 24% 25% 21% 21% 23% 29% 28% 11% 31% 17% 6% 6% 6% 9% 13% 7% 7% 5% 7% 9% 10% 5% 6% 6% 8% 9% 5% 5% 8% 4% 2% 10% 37% 45% 20% 22% 20% 23% 14% 15% 1% 4% 0% 2% 5% 7% 9% 4% Graph 27. Experienced / interested in summer activities on the water (e.g. swimming, canoeing (kayaking), sailing, cruises, fishing), % trips As with summer activities on land, also summer activities on the water least interest visitors arriving from Asia. Aquatic summer activities are e.g. swimming, canoeing (kayaking), sailing, cruises and fishing.
50 50 Winter sports The Chinese are interested in winter sports 100% Interested in Experienced during trip 0% 34% 37% 27% 27% 35% 27% 23% 28% 29% 19% 23% 23% 5% 7% 13% 15% 10% 11% 11% 7% 7% 3% 4% 3% 34% 35% 31% 26% 16% 3% 5% 6% 2% 5% 25% 16% 35% 31% 26% 22% 26% 16% 4% 7% 5% 3% 3% 9% 11% 17% 3% 1% 30% 13% 26% 6% 24% 14% 56% 1% Graph 28. Experienced / interested in winter sports (e.g. cross-country skiing, alpine skiing, snow boarding, snowshoeing, % trips The Chinese differ from other Asians in terms of winter sports (e.g. cross-country skiing, alpine skiing, snowboarding, snowshoeing) because they are twice as interested in in them, and are also trying winter sports on their trips more often than the Japanese and the South Koreans. However, visitors arriving from Europe are the most active in winter sports in Finland.
51 51 Other winter activities and experiences Winter sensations were especially experienced by visitors from Australia and Asia as well as from Great Britain, France and Switzerland. 100% Interested in 26% 32% 32% 37% 37% 27% 30% 34% 31% 36% 49% 0% 33% 19% 20% 16% 19% 6% 3% 2% 7% 22% 23% 5% 15% 28% 7% 15% 37% 30% 30% 23% 18% 6% 12% 19% 0% 3% 6% 6% 1% 4% 33% 35% 41% 26% 4% 5% 4% 4% 41% 15% 16% 22% 23% 8% 4% 11% 1% 23% 20% Graph 29. Experienced / interested in other winter experiences and sensations (e.g. the Northern Lights, husky and reindeer safaris, snowmobiling, snow castles, ice hotels, ice breaker), % trips Visitors, especially from Australia, China and Japan, as well as from France, Great Britain, Switzerland, Italy and Spain have experienced the Northern Lights, reindeer safaris, snow castles and other winter activities. On average, every fourth visitor was interested in these types of activities.
52 52 Finland's popularity
53 53 How often in Finland A quarter of the trips were made by first-time visitors First-time visitor Once a year or less 2-4 times a year More than 4 times a year Graph 30. How often in Finland, thousand trips A quarter of the trips made to Finland in 2016 were made by first-time visitors. First-time trips to Finland increased by around 150,000. Also, trips made by visitors who visit more than four times a year have increased, while the number of trips made by travelers visiting 1-4 times a year decreased.
54 54 First time in Finland The majority of first-time visitors in Finland came from China and Japan 100% 50% 0% Graph 31. First time in Finland, % of trips The majority of first-time visitors in Finland came from China and Japan. The number of first time visitors was the highest among visitors from these countries. Many first-time visitors also arrived from Germany, Great Britain and France. On average one in four trips was made by a first-time visitor. The fewest number of first-time visitors arrived from Finland's neighbouring countries.
55 55 How often in Finland The share of first-time visitors First-time visitor Once a year or less 2-4 times a year Over 4 times a year Estonia 2% (2%) 21 (18) 153 (253) 379 (364) 369 (297) Sweden 11% (7%) 96 (58) 248 (132) 284 (355) 233 (267) Germany 42% (44%) 170 (152) 75 (83) 110 (85) 50 (25) Great Britain 45% (54%) 113 (135) 54 (48) 63 (52) 24 (17) France 61% (63%) 107 (98) 24 (26) 36 (26) 7 (5) Denmark 25% (29%) 20 (20) 11 (10) 30 (25) 19 (15) Italy 62% (59%) 73 (58) 20 (15) 21 (21) 4 (5) The Netherlands 35% (40%) 30 (32) 14 (14) 30 (26) 13 (20) Spain 63% (58%) 91 (66) 15 (17) 29 (25) 4 (5) Poland 45% (52%) 32 (39) 15 (12) 17 (19) 7 (6) Belgium 55% (29%) 24 (15) 3 (13) 11 (17) 5 (7) Lithuania 58% (23%) 24 (9) 4 (5) 7 (19) 7 (8) Latvia 32% (17%) 19 (11) 14 (17) 14 (30) 13 (6) Other EU countries 43% (56%) 92 (118) 74 (25) 38 (50) 12 (16) Russia 2% (4%) 66 (123) 162 (167) 645 (569) 1813 (1934) Norway 28% (25%) 18 (25) 10 (32) 28 (31) 10 (14) Switzerland 44% (42%) 27 (40) 14 (21) 13 (23) 7 (12) Rest of Europe 58% (70%) 58 (67) 26 (10) 13 (16) 3 (3) The United States 59% (57%) 86 (80) 28 (30) 28 (29) 3 (1) Canada 72% (49%) 22 (22) 2 (14) 6 (8) 1 (0) Latin America 67% (81%) 43 (58) 13 (4) 7 (9) 1 (0) Japan 76% (79%) 176 (155) 39 (15) 15 (24) 2 (2) China 82% (81%) 292 (214) 28 (16) 31 (30) 5 (4) South Korea 66% (90%) 88 (76) 19 (5) 3 (3) 23 (0) India 68% (62%) 48 (22) 6 (3) 15 (10) 1 (1) Rest of Asia 71% (61%) 148 (134) 27 (50) 30 (22) 2 (13) Africa 57% (62%) 15 (15) 2 (2) 4 (7) 5 (0) Australia 71% (61%) 30 (39) 7 (6) 4 (7) 1 (0) Rest of Oceania 65% (62%) 5 (3) 2 (1) 1 (1) 0 (0) Total 26% (25%) 2035 (1890) 1109 (1202) 1912 (2032) 2650 (2404) Table 8. How often in Finland, thousand trips (in brackets year 2015)
56 56 Would you recommend Finland Visitors from Japan, Korea, Africa and Russia are not as willing to recommend Finland as others 100 % I would not recommend I might recommend 66% 78% 76% 77% 80% 81% 66% 77% 62% 90% 82% 71% 85% 70% 70% 51% 72% 86% 73% 85% 77% 68% 41% 68% 45% 69% 80% 50% 71% 82% I would definitely recommend 0 % Graph32. Would you recommend Finland to your friends or family, % trips Travelers arriving from Spain are most frequently definitely willing to recommend Finland. As many as nine out of ten would do so, while the average number to definitely recommend Finland is two trips out of three. Visitors from Japan, Korea, Africa and Russia are not as willing to recommend Finland as others. The largest number of trips, during which it was said that Finland would not be recommended were from Russia (21,000) and Sweden (13,000). Relatively speaking, however, most of these kind of trips were made by visitors from India. A total of 70,000 trips were made in which visitors would not recommend Finland.
57 57 Other travel destinations
58 58 Visited elsewhere during the trip On approximately every third trip some other country in addition to Finland is visited. 100% 50% 0% Graph 33. Visited elsewhere during the trip, % trips Visitors also went to some other country on thirty percent of the trips made to Finland last year. Those travelers most frequently visiting elsewhere arrived from outside Europe and most seldom travelers from neighboring countries. Lithuanians differ significantly from the other visitors from Europe, as they did not go anywhere else on only a quarter of their trips. A total of 2.3 million trips made to Finland were also made to some other country.
59 59 Visited elsewhere during the trip Finland was the main destination for half of the Chinese visitors who visited elsewhere during their trip Transit passengers at the Helsinki-Vantaa airport Finland was not the main destination Finland was the main destination Graph 34. Visited elsewhere during the trip, 1000 trips Of the Chinese travelers who visited some other country during their trip, about half said that Finland was the main destination. A total of 150,000 of these kinds of trips were made from China to Finland. Finland was often the main destination of visitors arriving from Central Europe. On the other hand Finland was rarely the main destination for those travelers arriving from Russia and Estonia if they visited elsewhere during their trip. The graph also shows the number of transit passengers at the Helsinki-Vantaa airport (the passenger did not leave the airport during their journey), which were mostly Chinese, Japanese, Swedish and South Koreans.
 On approximately every third trip to Finland some other")
60 60 The next travel destination (top 10) In two fifths of the trips where the traveler visited elsewhere, Sweden or Estonia was the next travel destination Picture 2. The next travel destination after Finland, thousand trips (return trips to home country and transit trips are not included in the figures) On approximately every third trip to Finland some other country was also visited. Sweden and Estonia are the most popular destinations to continue the trip from Finland. Over 100,000 trips were also continued from Finland to Russia, Germany, Denmark or the Netherlands. Return trips to home countries, and transit trips at the Helsinki-Vantaa Airport (the passenger has not exited the airport), are not included in the figures.
Leisure trips to the Canary Islands and cruises to Sweden increased in September to December 2016
 Transport and Tourism 01 Finnish Travel 01, Autumn (1 Sep to 1 Dec 01) Leisure trips to the Canary Islands and cruises to Sweden increased in September to December 01 According to Statistics Finland s
Monthly Inbound Update June th August 2017
 Monthly Inbound Update June 217 17 th August 217 1 Contents 1. About this data 2. Headlines 3. Journey Purpose: June, last 3 months, year to date and rolling twelve months by journey purpose 4. Global
Departing tourists: March 2009
 29 April 2009 1100 hrs 074/2009 Tourstat survey data indicate that inbound tourists in were estimated at 71,153, a decrease of 21.4 per cent when compared to the corresponding month last year, and practically
Improving the accuracy of outbound tourism statistics with mobile positioning data
 1 (11) Improving the accuracy of outbound tourism statistics with mobile positioning data Survey response rates are declining at an alarming rate globally. Statisticians have traditionally used imputing
TOURISM IN ESTONIA IN 2013 (as of 17 March 2014) 1
 1") INBOUND TOURISM IN ESTONIA IN 213 TOURISM IN ESTONIA IN 213 (as of 17 March 214) 1 In 213, 1.94 million foreign tourists stayed overnight in the accommodation establishments of Estonia. Compared with 212,
INBOUND TOURISM IN ESTONIA IN 213 TOURISM IN ESTONIA IN 213 (as of 17 March 214) 1 In 213, 1.94 million foreign tourists stayed overnight in the accommodation establishments of Estonia. Compared with 212,
Introduction. International Traveler Trips. Significance of International Travel. Figure 1: International Traveler Trips by years
 Introduction This report presents basic characteristics of international travel to Georgia for the period of year 2016. The data is provided by National Statistics Office of Georgia. The sphere of the
TRIPS OF BULGARIAN RESIDENTS ABROAD AND ARRIVALS OF VISITORS FROM ABROAD TO BULGARIA IN SEPTEMBER 2015
 TRIPS OF BULGARIAN RESIDENTS ABROAD AND ARRIVALS OF VISITORS FROM ABROAD TO BULGARIA IN SEPTEMBER 2015 In September 2015, the number of the trips of Bulgarian residents abroad was 450.9 thousand (Annex,
TRIPS OF BULGARIAN RESIDENTS ABROAD AND ARRIVALS OF VISITORS FROM ABROAD TO BULGARIA IN AUGUST 2015
 TRIPS OF BULGARIAN RESIDENTS ABROAD AND ARRIVALS OF VISITORS FROM ABROAD TO BULGARIA IN AUGUST 2015 In August 2015, the number of the trips of Bulgarian residents abroad was 512.0 thousand (Annex, Table
TRIPS OF BULGARIAN RESIDENTS ABROAD AND ARRIVALS OF VISITORS FROM ABROAD TO BULGARIA IN AUGUST 2016
 TRIPS OF BULGARIAN RESIDENTS ABROAD AND ARRIVALS OF VISITORS FROM ABROAD TO BULGARIA IN AUGUST 2016 In August 2016, the number of the trips of Bulgarian residents abroad was 590.6 thousand (Annex, Table
TRIPS OF BULGARIAN RESIDENTS ABROAD AND ARRIVALS OF VISITORS FROM ABROAD TO BULGARIA IN MAY 2017
 TRIPS OF BULGARIAN RESIDENTS ABROAD AND ARRIVALS OF VISITORS FROM ABROAD TO BULGARIA IN MAY 2017 In May 2017, the number of the trips of Bulgarian residents abroad was 653.3 thousand (Annex, Table 1) or
TRIPS OF BULGARIAN RESIDENTS ABROAD AND ARRIVALS OF VISITORS FROM ABROAD TO BULGARIA IN MARCH 2016
 TRIPS OF BULGARIAN RESIDENTS ABROAD AND ARRIVALS OF VISITORS FROM ABROAD TO BULGARIA IN MARCH 2016 In March 2016, the number of the trips of Bulgarian residents abroad was 354.7 thousand (Annex, Table
TRIPS OF BULGARIAN RESIDENTS ABROAD AND ARRIVALS OF VISITORS FROM ABROAD TO BULGARIA IN FEBRUARY 2017
 TRIPS OF BULGARIAN RESIDENTS ABROAD AND ARRIVALS OF VISITORS FROM ABROAD TO BULGARIA IN FEBRUARY 2017 In February 2017, the number of the trips of Bulgarian residents abroad was 366.8 thousand (Annex,
TRIPS OF BULGARIAN RESIDENTS ABROAD AND ARRIVALS OF VISITORS FROM ABROAD TO BULGARIA IN DECEMBER 2016
 TRIPS OF BULGARIAN RESIDENTS ABROAD AND ARRIVALS OF VISITORS FROM ABROAD TO BULGARIA IN DECEMBER 2016 In December 2016, the number of the trips of Bulgarian residents abroad was 397.3 thousand (Annex,
ISSUE BRIEF: U.S. Immigration Priorities in a Global Context
 Immigration Task Force ISSUE BRIEF: U.S. Immigration Priorities in a Global Context JUNE 2013 As a share of total immigrants in 2011, the United States led a 24-nation sample in familybased immigration
WORLDWIDE DISTRIBUTION OF PRIVATE FINANCIAL ASSETS
 WORLDWIDE DISTRIBUTION OF PRIVATE FINANCIAL ASSETS Munich, November 2018 Copyright Allianz 11/19/2018 1 MORE DYNAMIC POST FINANCIAL CRISIS Changes in the global wealth middle classes in millions 1,250
Marketing of Destination Estonia. Target markets and co-operation opportunities
 Marketing of Destination Estonia. Target markets and co-operation opportunities 2008-2010 Estonian Tourist Board (ETB) Enterprise Estonia June.2008 1.9 million foreign tourists stayed overnight in Estonia
Britain, the EU & Tourism
 Written evidence submitted by VisitBritain (IOB0027) Britain, the EU & Tourism About VisitBritain and VisitEngland Tourism is currently worth 126.9 billion to Britain s economy. It is Britain s third largest
Statistics on offences and coercive methods
 Justice 2016 Statistics on and coercive methods Offences known to the authorities 2015 Drunken driving caused by narcotic substances increased by 19.7 per cent According to Statistics Finland's data, a
Understanding Welcome
 Understanding Welcome Foresight issue 159 VisitBritain Research February 2018 1 Contents Introduction Welcome summary Market summary UK NBI welcome Elements of welcome UK results Market summary heat map
Europe in Figures - Eurostat Yearbook 2008 The diversity of the EU through statistics
 STAT/08/75 2 June 2008 Europe in Figures - Eurostat Yearbook 2008 The diversity of the EU through statistics What was the population growth in the EU27 over the last 10 years? In which Member State is
COMMISSION IMPLEMENTING DECISION. of
 EUROPEAN COMMISSION Brussels, 11.7.2012 C(2012) 4726 final COMMISSION IMPLEMENTING DECISION of 11.7.2012 establishing the list of supporting documents to be presented by visa applicants in the United Kingdom
SCHENGEN VISA (Category A and Category C)
") This document is free of charge November 2017 SCHENGEN VISA (Category A and Category C) Short-term Visa (for a maximum stay of 90 days) i nationals, living in the jurisdiction of the Embassy of the Federal
This document is free of charge November 2017 SCHENGEN VISA (Category A and Category C) Short-term Visa (for a maximum stay of 90 days) i nationals, living in the jurisdiction of the Embassy of the Federal
UK Data Archive Study Number International Passenger Survey, 2016
 UK Data Archive Study Number 8016 - International Passenger Survey, 2016 Article Travel trends: 2016 Travel trends is an annual report that provides estimates and profiles of travel and tourism visits
European Tourism Trends & Prospects Executive Summary
 1 European Tourism Trends & Prospects Executive Summary Turkey Iceland Montenegro Serbia Slovenia Malta Cyprus Finland Croatia Latvia Netherlands Belgium Portugal Poland Romania Czech Rep Bulgaria Spain
Belgium s foreign trade
 Belgium s FIRST 9 months Belgium s BELGIAN FOREIGN TRADE AFTER THE FIRST 9 MONTHS OF Analysis of the figures for (first 9 months) (Source: eurostat - community concept*) After the first nine months of,
Perceptions and knowledge of Britain and its competitors in Foresight issue 156 VisitBritain Research
 Perceptions and knowledge of Britain and its competitors in 2016 Foresight issue 156 VisitBritain Research 1 Contents 1. Introduction and study details 2. Headline findings 3. Perceptions of Britain and
PRESS RELEASE. NON-RESIDENTS ARRRIVALS FROM ABROAD: January - December 2014
 HELLENIC REPUBLIC HELLENIC STATISTICAL AUTHORITY PRESS RELEASE Piraeus, 7 April 2015 NON-RESIDENTS ARRRIVALS FROM ABROAD: January - December 2014 According to the Frontier Statistical Survey conducted
International Education in the Comox Valley: Current and Potential Economic Impacts
 International Education in the Comox Valley: Current and Potential Economic Impacts FINAL REPORT March 2012 Prepared by: Vann Struth Consulting Group Inc. Vancouver, BC www.vannstruth.com Prepared for:
In the 3 months to August 2011, seasonally adjusted estimates of international visits fell versus the previous 3 months
 Statistical Bulletin Monthly Overseas Travel and Tourism - August 2011 Coverage: UK Date: 13 October 2011 Geographical Area: Region Theme: People and Places Overseas Travel and Tourism - August 2011: Key
Researching and Planning
 Researching and Planning Foresight issue 150 VisitBritain Research 1 Contents 1. Introduction 2. Summary 3. Roles within the planning process 4. Length of the planning process 5. Key influences for choosing
Annex 1. Questionnaire proposed by UNWTO to measure flows and expenditure associated to inbound tourism
 Annex. Questionnaire proposed by UNWTO to measure flows and expenditure associated to inbound tourism MODEL BORDER SURVEY / PROPOSED QUESTIONNAIRE UNWTO proposed questionnaire has 5 parts A.- Travellers
Did you know? The European Union in 2013
 The European Union in 2013 On 1 st July 2013, the number of countries in the European Union increased by one Croatia has joined the EU and there are now 28 members. Are you old enough to remember queues
Tourism Performance and Trends. Sharon Orrell March 2018
 Tourism Performance and Trends Sharon Orrell March 2018 1 A quick update on tourism performance 2 Domestic overnight tourism in 2017 England Domestic Overnight Tourism January November 2017 Trips +1 %
How many students study abroad and where do they go?
 1. EDUCATION LEVELS AND STUDENT NUMBERS How many students study abroad and where do they go? More than 4.1 million tertiary-level students were enrolled outside their country of citizenship in 2010. Australia,
Facts and Figures on THE EUROPEANS ON HOLIDAYS
 Facts and Figures on THE EUROPEANS ON HOLIDAYS 1997-1998 Executive Summary A Eurobarometer survey carried out on behalf of the European Commission Directorate General XXIII Enterprise policy. Distributive
Ajankohtaista markkinoilta. Markkinointiedustaja Beijing ja Chongqing
 Ajankohtaista markkinoilta Markkinointiedustaja Beijing ja Chongqing Danye Liu Joulukuu 2014 7.1.2015 Semiannual Report CONTENTS What factors have affected the results of the season, especially with regard
National Travel and Tourism Office
 U.S. Department of Commerce International Trade Administration National Travel and Tourism Office International Visitation to the United States: A Statistical Summary of U.S. Visitation (2015 P ) International
COMMISSION IMPLEMENTING DECISION. of
 EUROPEAN COMMISSION Brussels, 22.10.2014 C(2014) 7594 final COMMISSION IMPLEMENTING DECISION of 22.10.2014 amending Implementing Decision C(2011)5500 final, as regards the title and the list of supporting
Letter prices in Europe. Up-to-date international letter price survey. March th edition
 Letter prices in Europe Up-to-date international letter price survey. March 2014 13th edition 1 Summary This is the thirteenth time Deutsche Post has carried out a study, drawing a comparison between letter
SURVEY TO CONGRESS PARTICIPANTS
 SURVEY TO CONGRESS PARTICIPANTS 2018 SURVEY TO CONGRESS PARTICIPANTS INTRODUCTION Bearing in mind the relevancy of the Meetings Industry segment in the positioning of Lisbon as a tourism destination, and
Global Tourism Watch Japan Summary Report
 Global Tourism Watch 2016 Japan Summary Report Table of Contents 1. Introduction... 2 Methodology... 2 Background... 3 2. Market Potential... 4 3. Competitive Environment Key Performance Indicators Summary...
Workshop for STS (System of Tourism Statistics) & TSA (Tourism Satellite Account) in IRAN
 & TSA (Tourism Satellite Account) in IRAN") Workshop for STS (System of Tourism Statistics) & TSA (Tourism Satellite Account) in IRAN Dr. Dock Key Kim (dkkim@kcti.re.kr) Korea Culture &Tourism Institute(KCTI) October 2015 Session 3: Introduction
Workshop for STS (System of Tourism Statistics) & TSA (Tourism Satellite Account) in IRAN Dr. Dock Key Kim (dkkim@kcti.re.kr) Korea Culture &Tourism Institute(KCTI) October 2015 Session 3: Introduction
INSG Insight. An Overview of World Stainless Steel Scrap Trade in 2016
 INSG Insight INSG SECRETARIAT BRIEFING PAPER September 2017 No.29 An Overview of World Stainless Steel Scrap Trade in 2016 Ricardo Ferreira, Director of Market Research and Statistics Francisco Pinto,
KINGDOM OF CAMBODIA NATION RELIGION KING 3 TOURISM STATISTICS REPORT. September 2010
 KINGDOM OF CAMBODIA NATION RELIGION KING 3 TOURISM STATISTICS REPORT September 2010 MINISTRY OF TOURISM Statistics and Tourism Information Department No. A3, Street 169, Sangkat Veal Vong, Khan 7 Makara,
Microsoft Dynamics AX. Microsoft Dynamics AX. Product availability, localization, and translation guide. Microsoft. 1 Microsoft
 Product availability, localization, and translation guide 1 Product availability, localization, and translation guide Table of contents 03 Availability 04 Languages 06 Country localizations 08 Overview
Visa issues. On abolition of the visa regime
 Visa issues On abolition of the visa regime In accordance with the Decree of the Government of the Republic of Kazakhstan 838 dated 23 December 2016 About the introduction of amendments and additions to
UNDER EMBARGO UNTIL 9 APRIL 2018, 15:00 HOURS PARIS TIME
 TABLE 1: NET OFFICIAL DEVELOPMENT ASSISTANCE FROM DAC AND OTHER COUNTRIES IN 2017 DAC countries: 2017 2016 2017 ODA ODA/GNI ODA ODA/GNI ODA Percent change USD million % USD million % USD million (1) 2016
Microsoft Dynamics AX. Microsoft Dynamics AX Preview. Product availability, localization, and translation guide. Microsoft.
 Preview Product availability, localization, and translation guide 1 Product availability, localization, and translation guide Table of contents 03 Availability 04 Languages 06 Country localizations 08
STATISTICS BRIEF URBAN PUBLIC TRANSPORT IN THE 21 ST CENTURY
 STATISTICS BRIEF URBAN PUBLIC TRANSPORT IN THE 21 ST CENTURY This Statistics Brief is an abridged version of the extensive report, Urban Public Transport in the 21 st Century, available on the UITP MyLibrary
Settling In 2018 Main Indicators of Immigrant Integration
 Settling In 2018 Main Indicators of Immigrant Integration Settling In 2018 Main Indicators of Immigrant Integration Notes on Cyprus 1. Note by Turkey: The information in this document with reference to
HIGHLIGHTS. There is a clear trend in the OECD area towards. which is reflected in the economic and innovative performance of certain OECD countries.
 HIGHLIGHTS The ability to create, distribute and exploit knowledge is increasingly central to competitive advantage, wealth creation and better standards of living. The STI Scoreboard 2001 presents the
IMMIGRANTS AND IMMIGRATION POLICY IN AGEING FINLAND
 BULLETIN OF GEOGRAPHY Socio economic Series No. 15/2011 ANNA ŁOBODZIŃSKA Jagiellonian University, Poland IMMIGRANTS AND IMMIGRATION POLICY IN AGEING FINLAND DOI: http://dx.doi.org/10.2478/v10089-011-0003-z
China s Aid Approaches in the Changing International Aid Architecture
 China s Aid Approaches in the Changing International Aid Architecture Mao Xiaojing Deputy Director, Associate Research Fellow Chinese Academy of International Trade and Economic Cooperation (CAITEC) MOFCOM,
International investment resumes retreat
 FDI IN FIGURES October 213 International investment resumes retreat 213 FDI flows fall back to crisis levels Preliminary data for 213 show that global FDI activity declined by 28% (to USD 256 billion)
Myanmar Visa on Arrival
 Myanmar Visa on Arrival Types of Visa, Fees and Duration Types of Visa Fees Duration BUSINESS VISA US$ 50 70 days ENTRY VISA (Meetings / Workshops / Events) US$ 40 28 days TRANSIT VISA US$ 20 24 hours
10 answers you need to know about Schengen Tourist Visa (in 2018) Part 1
 Part 1") 10 answers you need to know about Schengen Tourist Visa (in 2018) Part 1 Everyday, I see thousands of queries on Schengen Travel visas from various countries, especially countries that don t have access
10 answers you need to know about Schengen Tourist Visa (in 2018) Part 1 Everyday, I see thousands of queries on Schengen Travel visas from various countries, especially countries that don t have access
Population Structure 2010
 Population 2011 Population Structure 2010 Over quarter of a million aged 80 and over in Finland According to Statistics Finland's statistics on the population structure, there were 255,912 persons aged
KINGDOM OF CAMBODIA NATION RELIGION KING 3 TOURISM STATISTICS REPORT. March 2010
 KINGDOM OF CAMBODIA NATION RELIGION KING 3 TOURISM STATISTICS REPORT March 2010 MINISTRY OF TOURISM Statistics and Tourism Information Department No. A3, Street 169, Sangkat Veal Vong, Khan 7 Makara, Phnom
Visitor Satisfaction & Activity Report
 2013 Visitor Satisfaction & Activity Report Hawai i Convention Center 1801 Kālakaua Avenue Honolulu, Hawai i 96815 (808) 973-2255 www.hawaiitourismauthority.org CONTENTS 1. ABOUT THIS REPORT... 1 COMPARING
PUBLIC CONSULTATION. Improving procedures for obtaining short-stay Schengen visas
 PUBLIC CONSULTATION Improving procedures for obtaining short-stay Schengen visas Summary of responses C2 (31.7.2013) Page 1 Contents Introduction... 3 Presentation of results of the questionnaire for individual
Travel to the EU from New Zealand
 Thursday, 12 May, 2016-15:21 Travel to the EU from New Zealand Useful information on travelling from New Zeland to the EU, such as visas, travel restrictions and consulates, and for studying there. Visa
UNDER EMBARGO UNTIL 10 APRIL 2019, 15:00 HOURS PARIS TIME. Development aid drops in 2018, especially to neediest countries
 Development aid drops in 2018, especially to neediest countries OECD Paris, 10 April 2019 OECD adopts new methodology for counting loans in official aid data In 2014, members of the OECD s Development
1 SCHENGEN VISA INTERVIEW QUESTIONS
 1 SCHENGEN VISA INTERVIEW QUESTIONS 4 THE SCHENGEN REGION 1.1 THE SCHENGEN AREA Europe is a beautiful place, and you may want to travel there on leisure, work or study. To do so, you ll need a visa. You
24 Negocios infographics oldemar. Mexico Means
 2 Negocios infographics oldemar Mexico Means Mexico s Means Partner opportunity enersave OPPORTUNITY 2 Negocios INFOGRAPHICS OLDEMAR MEET MEXICO MEXICO IS A big country Mexico is part of North America,
2014 BELGIAN FOREIGN TRADE
 2014 BELGIAN FOREIGN TRADE 2 3 01 \\ EXPORTS 6 1.1 Geographical developments 1.2 Sectoral developments 02 \\ IMPORTS 14 2.1 Geographical developments 2.2 Sectoral developments 03 \\ GEOGRAPHICAL TRADE
INTERNATIONALISATION OF HIGHER EDUCATION: A CLOSER LOOK. Jon Deer and Gabi Lombardo GJForesight
 INTERNATIONALISATION OF HIGHER EDUCATION: A CLOSER LOOK Jon Deer and Gabi Lombardo GJForesight INTERNATIONAL STUDENT TRENDS BACKGROUND CLOSER LOOK AT STUDENTS INTERNATIONALISATION PUSH AND PULL BACKGROUND
Official Journal of the European Union L 192/17
 22.7.2011 Official Journal of the European Union L 192/17 REGULATION (EU) No 692/2011 OF THE EUROPEAN PARLIAMENT AND OF THE COUNCIL of 6 July 2011 concerning European statistics on tourism and repealing
COMMISSION IMPLEMENTING DECISION. of
 EUROPEAN COMMISSION Brussels, 30.8.2017 C(2017) 5853 final COMMISSION IMPLEMENTING DECISION of 30.8.2017 establishing the list of supporting documents to be submitted by applicants for short stay visas
TOURIST TRIPS AND TOURISM-RELATED EXPENDITURE OF THE POPULATION IN SECOND QUARTER OF 2015 (PRELIMINARY DATA)
") TOURIST TRIPS AND TOURISM-RELATED EXPENDITURE OF THE POPULATION IN SECOND QUARTER OF 215 (PRELIMINARY DATA) In the second quarter of 215, 81.1 thousand Bulgarian residents 1 made tourist trips 2. The majority
TOURIST TRIPS AND TOURISM-RELATED EXPENDITURE OF THE POPULATION IN SECOND QUARTER OF 215 (PRELIMINARY DATA) In the second quarter of 215, 81.1 thousand Bulgarian residents 1 made tourist trips 2. The majority
INTERNATIONAL MIGRATION FLOWS TO AND FROM SELECTED COUNTRIES: THE 2008 REVISION
 E c o n o m i c & S o c i a l A f f a i r s INTERNATIONAL MIGRATION FLOWS TO AND FROM SELECTED COUNTRIES: THE 2008 REVISION CD-ROM DOCUMENTATION United Nations POP/DB/MIG/Flow/Rev.2008 Department of Economic
Short-term International Migration Trends in England and Wales from 2004 to 2009
 Short-term International Migration Trends in England and Wales from 2004 to 2009 Simon Whitworth, Konstantinos Loukas and Ian McGregor Office for National Statistics Abstract Short-term migration estimates
CO3.6: Percentage of immigrant children and their educational outcomes
 CO3.6: Percentage of immigrant children and their educational outcomes Definitions and methodology This indicator presents estimates of the proportion of children with immigrant background as well as their
Preliminary population statistics
 Population 2018 Preliminary population statistics 2018, June Finland s preliminary population figure 5,516,343 at the end of June According to Statistics Finland's preliminary data, Finland's population
IDENTIFICATION OF MARKET POTENTIAL
 IDENTIFICATION OF MARKET POTENTIAL Report on the survey about travel habits, Slovenia s position and segmentation of tourists AUSTRIA December 2017 Contracting Authority Contractor Name: Slovenian Tourist
COMMISSION IMPLEMENTING DECISION. of
 EUROPEAN COMMISSION Brussels, 26.3.2013 C(2013) 1725 final COMMISSION IMPLEMENTING DECISION of 26.3.2013 establishing the lists of supporting documents to be presented by visa applicants in Jordan, Kosovo
VISA SERVICES CANADA
 VISA SERVICES CANADA WWW.VISASERVICESCANADA.CA VISA-ON-ARRIVAL The government of the Federal Republic of Ethiopia now gives VISA-ON-ARRIVAL to tourists and to those in transit for less than 12 hours. Tourist
COMMISSION IMPLEMENTING DECISION. of
 EUROPEAN COMMISSION Brussels, 4.9.2014 C(2014) 6141 final COMMISSION IMPLEMENTING DECISION of 4.9.2014 establishing the list of supporting documents to be presented by visa applicants in Algeria, Costa
The Extraordinary Extent of Cultural Consumption in Iceland
 1 Culture and Business Conference in Iceland February 18 2011 Prof. Dr. Ágúst Einarsson Bifröst University PP 1 The Extraordinary Extent of Cultural Consumption in Iceland Prof. Dr. Ágúst Einarsson, Bifröst
Preliminary population statistics
 Population 201 Preliminary population statistics 201, March Finland s preliminary population figure,04,913 at the end of March New releases will not be produced on preliminary population statistics any
COMMISSION IMPLEMENTING DECISION. of establishing the list of supporting documents to be presented by visa applicants in Ireland
 EUROPEAN COMMISSION Brussels, 31.7.2014 C(2014) 5338 final COMMISSION IMPLEMENTING DECISION of 31.7.2014 establishing the list of supporting documents to be presented by visa applicants in Ireland (Only
CONSUMER PROTECTION IN THE EU
 Special Eurobarometer European Commission CONSUMER PROTECTION IN THE EU Special Eurobarometer / Wave 59.2-193 - European Opinion Research Group EEIG Fieldwork: May-June 2003 Publication: November 2003
UNIFORM SCHENGEN VISA
 UNIFORM SCHENGEN VISA General Information on a UNIFORM Visa Spain is a Member State of the Schengen Agreement which came into effect on March 26, 1995. The current members of the agreement ("Schengen States")
International Visitation to the United States: A Statistical Summary of U.S. Visitation (2011)
") U. S. Depar tment of Commerce International Trade Administration Manufac turing and Ser vices Ser vices Office of Travel and Tourism Industries International Visitation to the United States: A Statistical
U. S. Depar tment of Commerce International Trade Administration Manufac turing and Ser vices Ser vices Office of Travel and Tourism Industries International Visitation to the United States: A Statistical
INDIA-EU DIALOGUE ON MIGRATION AND MOBILITY
 INDIA-EU DIALOGUE ON MIGRATION AND MOBILITY Indian Council for Research on International Economic Relations (ICRIER) Rajat Kathuria, Director and CE rkathuria@icrier.res.in 26 September 2017 OVERVIEW oexploring
Standard Note: SN/SG/6077 Last updated: 25 April 2014 Author: Oliver Hawkins Section Social and General Statistics
 Migration Statistics Standard Note: SN/SG/6077 Last updated: 25 April 2014 Author: Oliver Hawkins Section Social and General Statistics The number of people migrating to the UK has been greater than the
Project Star. Joel Zernask KPMG Baltics OÜ Maksu- ja õigusteenuste valdkonna juht 21 mai 2013
 Project Star Joel Zernask KPMG Baltics OÜ Maksu- ja õigusteenuste valdkonna juht 21 mai 2013 EU 27 - Illegal Cigarettes Reached Record Levels in 2012 11.1% of cigarette consumption 65.5 billion illegal
Finnish consumer behaviour in Estonia
 Finnish consumer behaviour in Estonia Finnish consumer behaviour in Estonia Consumer surveys The report is based on statistical information provided by Eurostat and Statistics Estonia as well as three
Preliminary population statistics
 Population 2014 Preliminary population statistics 2013, December Number of births has fallen in three successive years According to Statistics Finland's preliminary data, 58,120 children were born in Finland
Government Online. an international perspective ANNUAL GLOBAL REPORT. Global Report
 Government Online an international perspective ANNUAL GLOBAL REPORT 2002 Australia, Canada, Czech Republic, Denmark, Estonia, Faroe Islands, Finland, France, Germany, Great Britain, Hong Kong, Hungary,
CHINA MARKET PROFILE. The Demographics
 CHINA MARKET PROFILE The Demographics In 2004, China, the most populous country in the world, had a total population of 1,298,847,624 (July 2004) one-fifth of the world s total. The population density
COMMISSION IMPLEMENTING DECISION. of
 EUROPEAN COMMISSION Brussels, 4.8.2011 C(2011) 5500 final COMMISSION IMPLEMENTING DECISION of 4.8.2011 establishing the list of supporting documents to be presented by visa applicants in China (in Beijing,
Austria Visa Information
 Austria Visa Information Website: www.austria-ny.org (download the forms from their webpage) ALL visa applicants must appear in person at the Austrian Consulate General. If you come to Austria as a tourist,
AirPlus International Travel Management Study 2015 Part 1 A comparison of global trends and costs in business travel management.
 AirPlus International Travel Management Study 2015 Part 1 A comparison of global trends and costs in business travel management. SWITZERLAND Introduction Welcome to the tenth annual AirPlus International
ANNEXES. to the. COMMISSION Implementing Decision
 EUROPEAN COMMISSION Brussels, 3.9.2014 C(2014) 6146 final ANNEXES 1 to 3 ANNEXES to the COMMISSION Implementing Decision establishing the lists of supporting documents to be presented by visa applicants
American International Journal of Contemporary Research Vol. 4 No. 1; January 2014
 Labour Productivity of Transportation Enterprises by Turnover per Person Employed Before and After the Economic Crisis: Economic Crisis Lessons from Europe Dr. Lembo Tanning TTK University of Applied Sciences
QGIS.org - Donations and Sponsorship Analysis 2016
 QGIS.org - Donations and Sponsorship Analysis 2016 QGIS.ORG received 1128 donations and 47 sponsorships. This equals to >3 donations every day and almost one new or renewed sponsorship every week. The
Slovakia. Inbound tourism. Schengen type" border Border statistics: Administrative control till (Schengen)
") Slovakia Inbound tourism Inbound tourism Schengen type" border Border statistics: Administrative control till 21.12.2007 (Schengen) Opening frontiers with Magyar, Czech republic, Poland, Austria) Monitoring
Slovakia Inbound tourism Inbound tourism Schengen type" border Border statistics: Administrative control till 21.12.2007 (Schengen) Opening frontiers with Magyar, Czech republic, Poland, Austria) Monitoring
English Australia. Survey of major ELICOS regional markets in 2014
 English Australia Survey of major ELICOS regional markets in 2014 May 2015 Executive Summary of a report prepared for English Australia by Environmetrics May 2015 English Australia contact: Sue Blundell
Work and residence permits and business entry visas
 Work and residence permits and business entry visas OPERATING GUIDE Business Sweden, January 2018 WORK AND RESIDENCE PERMITS AND BUSINESS ENTRY VISAS OPERATING GUIDE International companies in Sweden may
3Z 3 STATISTICS IN FOCUS eurostat Population and social conditions 1995 D 3
 3Z 3 STATISTICS IN FOCUS Population and social conditions 1995 D 3 INTERNATIONAL MIGRATION IN THE EU MEMBER STATES - 1992 It would seem almost to go without saying that international migration concerns