THE IMPACT OF IMMIGRATION ON THE LABOUR MARKET OUTCOMES OF NEW ZEALANDERS
|
|
|
- Frank Ball
- 5 years ago
- Views:
Transcription


1 2009 THE IMPACT OF IMMIGRATION ON THE LABOUR MARKET OUTCOMES OF NEW ZEALANDERS ECONOMIC IMPACTS OF IMMIGRATION WORKING PAPER SERIES DOL11053 JUN 09
2 ACKNOWLEDGEMENT David C Maré Motu Economic and Public Policy Research dave.mare@motu.org.nz Steven Stillman Motu Economic and Public Policy Research stillman@motu.org.nz We thank Melanie Morten and Yun Liang for exceptional research assistance and Jacques Poot, Deborah Cobb-Clark, George Borjas, Rob Hodgson, participants at the An International Perspective on Immigration and Immigration Policy Conference and a seminar audience at University of Auckland for comments on the paper. We also thank James Newell for providing us with data and assistance in creating local labour market boundaries. Disclaimer: Access to the data used in this study was provided by Statistics New Zealand under conditions designed to give effect to the security and confidentiality provisions of the Statistics Act All non-regression results using Census data are subject to base three rounding in accordance with Statistics New Zealand s release policy for census data. Funding for this project was primarily provided by the Royal Society of New Zealand Marsden Fund grant 05-MEP-002. Additional funding has been provided by the Department of Labour Immigration Service to whom we are grateful. Any views expressed are the sole responsibility of the authors and do not purport to represent those of the Department of Labour, Motu or Statistics New Zealand. ISBN: April Motu Economic and Public Policy Research Trust. All rights reserved. No portion of this paper may be reproduced without permission of the authors. Motu Working Papers are research materials circulated by their authors for purposes of information and discussion. They have not necessarily undergone formal peer review or editorial treatment. Motu Economic and Public Policy Research PO Box Wellington New Zealand info@motu.org.nz Telephone: Website: 2 The Impact of Immigration on the Labour Market Outcomes of New Zealanders
3 ABSTRACT This paper uses data from the 1996, 2001 and 2006 New Zealand Census to examine how the supply of immigrants in particular skill-groups affects the employment and wages of the New Zealand-born and of earlier migrants. We first estimate simple Constant Elasticity of Substitution (CES) production functions that allow for substitutability between workers from different skill-groups, but assume that, within skillgroups, migrants are perfect substitutes for non-migrants. We next estimate hierarchical CES production functions that allow for substitutability between immigrant and nonimmigrant workers within skill-groups, but constrain the patterns of wage impacts on different factors in response to changing factor shares, and that natives and migrants are not substitutable across skill-groups. Then, we extend the previous literature by estimating a Generalised Leontief production function that allows for a less restrictive relationship between changes in factors shares and changes in wages within a particular level of the production function and for substitution and complementarity between immigrant and non-immigrant workers both between and across skill-groups. Regardless of the model being estimated, we find little evidence that immigrants negatively affect either the wages or employment opportunities of the average New Zealand-born worker. However, we find some evidence that increases in the number of high-skilled recent migrants have small negative impacts on the wages of high-skilled New Zealand-born workers, which are offset by small positive impacts on the wages of medium-skilled New Zealanders. JEL classifications: J61, R23 Keywords: Immigration, Wage Impacts, New Zealand, Labour Market Areas The Impact of Immigration on the Labour Market Outcomes of New Zealanders 3
4 CONTENTS LIST OF FIGURES... 5 LIST OF TABLES INTRODUCTION DATA AND SAMPLE CHARACTERISTICS Data sources and variable definitions Sample characteristics Defining skill-groups Labour market outcomes DESCRIPTIVE EVIDENCE PRODUCTION FUNCTION ESTIMATES Nativity-groups are perfect substitutes within skill-groups CES estimates Nativity-groups are imperfect substitutes within skill-groups CES estimates Nativity-groups are imperfect substitutes within skill-groups - generalised Leontief estimates Nativity-groups are imperfect substitutes between and within skill-groups GL estimates Simulated impacts of alternative immigration flows CONCLUSIONS REFERENCES The Impact of Immigration on the Labour Market Outcomes of New Zealanders
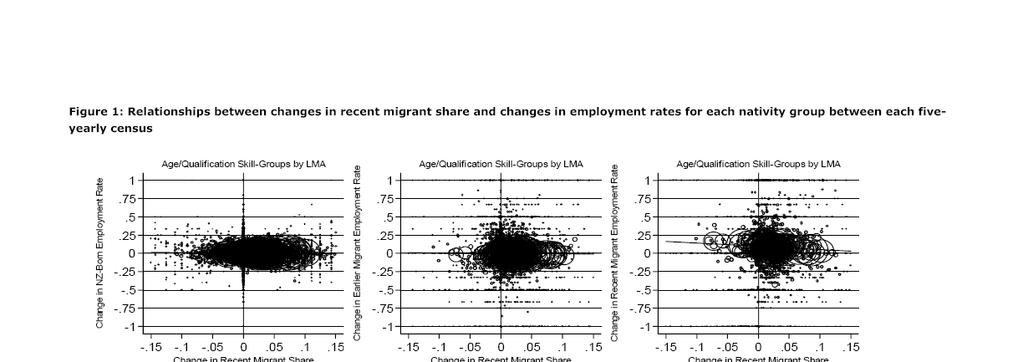
5 LIST OF FIGURES Figure 1: Relationships between changes in recent migrant share and changes in employment rates for each nativity group between each five-yearly census...21 Figure 2: Relationship between changes in recent migrant share and changes in log wages for each nativity group between each five-yearly census...23 LIST OF TABLES Table 1: Demographic characteristics of migrants and the New Zealand born in 1996, 2001 and Table 2: Qualifications for recent migrants by region of birth in 1996, 2001 and Table 3: Employment characteristics of migrants and the New Zealand born in 1996, 2001 and Table 4: Wages for migrants and the New Zealand born in different skill-groups in 1996, 2001 and Table 5: Reduced-form regression of impact of recent migrant share on employment and wage in local LMAs...25 Table 6: CES employment and wage elasticities for skill-groups...29 Table 7: CES employment and wage elasticities for nativity groups...33 Table 8: CES cross wage elasticities between nativity groups in 140 LMAs (IV)...35 Table 9: GL cross wage elasticities between nativity groups in 140 LMAs...37 Table 10: GL wage elasticities between nativity-skill-groups across 140 LMAs (IV- 3SLS)...39 Table 11: Simulated impacts of different immigration scenarios (CES estimates)...41 Table 12: Simulated wage impacts of different immigration scenarios (GL estimates)...43 The Impact of Immigration on the Labour Market Outcomes of New Zealanders 5
6 1. INTRODUCTION Twenty-three percent of New Zealand s population is foreign-born and forty percent of migrants have arrived in the past ten years. Despite the magnitude of these immigrant flows, the impact of immigration on the labour market opportunities of New Zealanders has yet to be investigated using microeconometric techniques. Longhi et al. (2005; 2008) identify a number of published studies that examine the impact of immigration on the labour market outcomes of non-immigrants in a number of countries and perform metaanalysis to summarise the results found in these studies. They concluded that an increase in the supply of immigrants has a significantly negative, but very small, impact on the employment and wages of non-immigrants. This is consistent with the findings in earlier literature reviews undertaken in Borjas (1994) and Friedberg and Hunt (1995). However, a few papers, in particular Borjas (2003), have argued that methodological weaknesses in the majority of these studies have resulted in a general understatement of the impact of immigration on non-migrant wages. 1 In this paper, we use data from the 1996, 2001 and 2006 New Zealand Census to examine how the supply of immigrants in particular skill-groups affects employment and wages for the New Zealand-born and earlier migrants. We begin by estimating a simple Constant Elasticity of Substitution (CES) production function, as in Card (2001) and Borjas (2003). This approach allows for substitutability between workers from different skill-groups, but implicitly assumes that, within skill-groups, migrants are perfect substitutes for non-migrants. 2 However, as argued in recent papers by Ottaviano and Peri (2006), Manacorda et al. (2006) and Peri (2007), there are a number of reasons why migrants might actually be imperfect substitutes for non-migrants with the same skills. For example, if migrant networks are important for finding employment or if recent migrants do not have the language skills to be employed in the general labour market, migrants will likely work in different jobs than similarly skilled non-migrants. Thus, as is done in these papers, we next extend our empirical model to allow for substitutability between immigrant and non-immigrant workers within skill-groups in a hierarchical CES production function. While this modelling approach is more flexible than the simple CES approach, it still has two key restrictions. First, the CES model assumes that a single parameter can summarise the substitutability between factors at any particular level of the production function (eg. between different skill-groups or between migrants and non-migrants), an assumption that constrains the pattern of wage impacts in response to a change in factor shares. For example, if an increase in low-skilled workers is estimated to reduce the wages paid to low-skilled workers (as theory suggests it should) then, mechanically, this change will be estimated to increase the wages paid to medium- and high-skilled workers. 3 Second, the structure imposed by the CES 1 It is worth noting that other papers, such as Ottaviano and Peri (2006) and Raphael and Ronconi (2008), argue conversely that methodological weaknesses in Borjas (2003) result in this paper overstating the impact of immigration. 2 Borjas (2003) allows for substitutability between workers with different amounts of education and work experience, while Card (2001) allows for substitutability between workers with different predicted occupations. We do both. Papers using this methodological approach estimate the impact of immigration on the labour market outcomes of non-migrants by using the estimated labour supply elasticity and elasticity of substitution between workers from different skill-groups to calculate how the addition of migrants, by changing the skill composition of the workforce, changes employment and wages for non-immigrants. 3 Similarly, if an increase in share of immigrants is estimated to reduce the wages paid to immigrants, then, mechanically, this change will be estimated to increase the wages paid to non-immigrants. 6 The Impact of Immigration on the Labour Market Outcomes of New Zealanders
7 production function does not allow for the substitutability of migrants and non-migrants across skill-groups, even though this may be important in reality. Then, in our main contribution, we extend the previous literature by estimating a Generalised Leontief production function that allows: i) for a less restrictive relationship between changes in factors shares and changes in wages within a particular level of the production function; and ii) for substitution and complementarity between immigrant and non-immigrant workers both between and across skill-groups. This model combines the approach of Borjas (1987), which estimates within-area labour market competition among immigrants, minorities and the native population, with the approach taken in more recent papers, where individuals are assumed to compete within particular skillgroups. 4 We identify the impact of immigration on labour market outcomes using the areaanalysis approach, which exploits the fact that immigration is spatially concentrated, and thus a change in the local supply of migrants should have an impact on the labour market outcomes of workers in that area. A number of papers have argued that this spatial approach may not properly identify the economic impact of immigration, because immigration may affect all areas of the country, not just the ones that actually receive migrants (Borjas et al. 1996, 1997; Borjas 2003). This will occur if, over time, the supply of new migrants to local labour markets encourages outward migration of previously settled individuals, or causes a reallocation of resources across sectors and an associated adjustment of interregional trade (ie. a Heckscher-Ohlin effect). We address this concern both by examining, in a companion paper, Stillman and Maré (2007), the impact of immigration on the geographic mobility of the New Zealand-born and earlier migrants and by estimating labour market impacts at different levels of geographic aggregation. As discussed in Borjas (2003), if these endogenous processes are important for adjustment following an immigration shock, the impact of this shock will be larger in more closed labour markets (ie. larger geographical areas). Besides the methodological contribution that this paper makes, it also extends the previous literature by examining the impact of immigration on labour market outcomes in a country that has a small open-economy, a large-scale and highly structured immigration system that focuses mainly on higher-skilled migrants, little low-skilled illegal immigration, and a highly mobile population both internally and internationally (Poot and Cochrane 2004; Maré and Choy 2001). Most international research focuses on countries, predominantly the United States, that have large domestic economies and high levels of low-skilled and illegal immigration, and these institutional differences may be particularly important in determining the impact that immigration has on host country labour markets (Angrist and Kugler 2003; Borjas 1999). A number of European countries (such as the United Kingdom) are considering switching or have begun to switch to highly structured skill-based immigration systems, as is used in New Zealand, making our findings particularly relevant for policymakers in these countries, as well as for those in Canada, which is institutionally quite similar to New Zealand. 4 A recent paper by Islam (2009) also estimates a Generalised Leontief production function to examine national level competition between immigrants and the Canadian-born, but does not stratify the labour market by skill. The Impact of Immigration on the Labour Market Outcomes of New Zealanders 7
8 2. DATA AND SAMPLE CHARACTERISTICS 2.1 Data sources and variable definitions This paper uses unit record data for the entire usually resident New Zealand population from the 1996, 2001 and 2006 Census. 5 The Census collects information on each individual s country of birth and their year of first arrival in New Zealand. We restrict our analysis throughout to individuals aged with non-missing year of first arrival, if foreign-born. We focus on this age group to exclude students and individuals nearing retirement. We classify individuals as being either New Zealand-born, a recent migrant or an earlier migrant, where recent migrants are all individuals who first arrived less than five years ago and earlier migrants are all other individuals born in a foreign country. Information is also collected about the current usual residential location of each individual. This location information is coded to the census meshblock, allowing us to identify local labour market areas (LMAs), as well as other aggregated geographic areas. Our main estimates examine competition within 140 LMAs defined in Papps and Newell (2002) using an algorithm that ensures that most people who live in a LMA work in it, and most people who work in a LMA live in it. 6 Focusing on functional local labour market areas has major advantages over using administratively defined geographic areas, as migration between LMAs is typically related to employment mobility, whereas migration within a LMA more strongly reflects residential factors. We also estimate our regression models at more aggregated geographic levels, including 75 territorial authorities (TAs), 58 LMAs, and 16 regional councils (RCs) to test the robustness of our results to the critique of the area-analysis approach discussed above Sample characteristics Table 1 presents the demographic characteristics of the three nativity groups (recent migrants, earlier migrants, New Zealand-born) in the 1996, 2001 and 2006 Census. Our analysis population is 1.45 million individuals in the 1996 Census of which 80% are New 5 We also have access to the 1986 and 1991 Census data, but we do not use this data for three reasons: first, New Zealand underwent a period of comprehensive market-oriented economic reform from which complicates interpretation of any results from the early time-period (Evans et al. 1996); second, the occupational classification system was changed between the 1991 and 1996 Census in a way that makes it impossible to create a consistent series over time even at an aggregated level; and third, the 1991 Census did not ask foreign-born individuals their year of first arrival in New Zealand making it impossible to separate recent from earlier migrants in this Census. 6 Labour market areas (LMAs) are created using travel-to-work data at area unit level drawn from the 1991 census. Two sets of labour market areas are defined one with 140 areas and one with 58. The main differences are that the 140-area set provides greater disaggregation of some relatively small areas. The 140 LMAs are defined by enforcing a minimum employed population of 2,000 and 75% self-containment of workers (allowing for some trade-off between the two). These LMAs have an average size of approximately 1900 square kilometres. In main urban areas, LMAs generally encompass the urban area and an extensive catchment area. In rural areas, LMAs tend to consist of numerous small areas, each centred on a minor service centre. We drop a small number of individuals (less than 1%) from all analyses for whom the address recorded on the census form is not sufficient for assigning an LMA to the current residence. 7 New Zealand geographically consists of two main islands separated by a three hour ferry ride or a plane flight, plus a third island that has a very minimal population (Stewart Island). Seventy-five percent of the working-age population lives on the North Island. Territorial authorities and regional councils are purely administrative areas. 8 The Impact of Immigration on the Labour Market Outcomes of New Zealanders
9 Zealand-born, 5% are recent migrants and 15% are earlier migrants. For the 2001 Census, our analysis population is 1.51 million of which 79% are New Zealand-born, 6% are recent migrants and 16% are earlier migrants and, for the 2006 Census, it is 1.59 million of which 74% are New Zealand-born, 9% are recent migrants and 17% are earlier migrants. As in most countries, recent migrants are younger than the non-immigrant population (for example, 45% are less than 35 years of age versus 31% of the New Zealand-born in 2006). But, unlike the United States where most immigrants are lowskilled, in New Zealand, recent migrants are much more qualified than the New Zealandborn, with 38% of recent migrants in 2006 (34% in 1996; 32% in 2001) having university degrees versus 17% of the New Zealand-born (9% in 1996; 12% in 2001). This is reflected throughout the qualification distribution, with few migrants having no qualifications compared to the New Zealand-born. 8 This occurs because New Zealand operates a structured immigration system that focuses mainly on higher-skilled migrants. 8 A large number of migrants have missing qualifications in 1996 because of the way that foreign qualifications were coded in this census. We generally drop these individuals from our econometric analyses, although we have also tested the robustness of our findings to treated them as a separate qualification group. The Impact of Immigration on the Labour Market Outcomes of New Zealanders 9
10 Table 1: Demographic characteristics of migrants and the New Zealand born in 1996, 2001 and 2006 Age NZ Born Earlier Migrants Recent Migrants NZ Born Earlier Migrants Recent Migrants NZ Born Earlier Migrants % 12% 22% 16% 9% 21% 14% 10% 22% % 16% 26% 18% 14% 24% 17% 13% 23% % 17% 20% 18% 19% 22% 18% 18% 20% % 18% 16% 18% 19% 16% 18% 21% 17% % 20% 11% 16% 19% 10% 18% 20% 11% % 17% 5% 14% 20% 6% 15% 18% 6% Qualifications Missing Qualifications 9% 15% 21% 7% 7% 8% 4% 5% 4% No Qualifications 31% 25% 12% 23% 15% 6% 20% 13% 5% School Qualifications 27% 23% 17% 34% 39% 37% 31% 32% 30% Post-school Qualifications 23% 22% 16% 24% 20% 17% 28% 23% 23% Degree Qualifications 9% 15% 34% 12% 20% 32% 17% 28% 38% Region of Birth Australia 7% 7% 7% 5% 6% 4% Pacific Islands 22% 6% 22% 12% 21% 9% British Isles 41% 18% 34% 17% 27% 21% Western and Northern Europe 6% 5% 6% 4% 5% 4% Southern and Eastern Europe 1% 5% 2% 4% 2% 3% North Africa and the Middle East 1% 3% 1% 3% 2% 2% South-East Asia 6% 7% 7% 9% 8% 7% North-East Asia 4% 28% 9% 21% 13% 20% South and Central Asia 3% 7% 4% 9% 5% 13% North America 3% 5% 3% 4% 3% 4% Central and South America 1% 1% 1% 1% 1% 2% Sub-Saharan Africa (inc South Africa) 2% 6% 3% 12% 6% 10% Percent of Population 80% 15% 5% 78% 16% 6% 74% 17% 9% Recent Migrants Individuals 1,161, ,835 67,002 1,189, ,341 87,780 1,173, , ,465 Note: Recent migrants first arrived in New Zealand in the five years prior to the census. All other migrants are classified as earlier migrants. See the text for more information on how the regions of birth are defined. 10 The Impact of Immigration on the Labour Market Outcomes of New Zealanders
11 The source country distribution of recent immigrants is fairly stable over the fifteen-year period examined here, but there is evidence that immigrants from the British Isles, South and Central Asia, and Sub-Saharan Africa (mainly South Africa) are becoming more common and those from North-East Asia are becoming less common. 9 Comparing recent migrants to earlier migrants, we can see that this reflects an ongoing evolution of migrant source countries. The relative strength of Asian immigration in the 1990s is reflected in a rising Asian share of earlier migrants, with less pronounced growth in the Asian share of recent migrants. Table 2 presents the distribution of qualifications for recent migrants from different regions of birth in each year (as well as, the distribution for the New Zealand-born). The regions are ordered from the most to least common source areas of recent migrants. There is a large variation in the qualification distribution for recent migrants from different sources regions. For example, in 2006, 61% of recent migrants from the Pacific Islands have at most school qualifications and only 12% have university degrees, while only 22% of recent migrants from South and Central Asia have at most school qualifications and 63% have university degrees. These differences are largely related to the different immigration categories under which individuals from different countries enter New Zealand (mainly family versus skilled migration). Immigrants from different countries also are more or less likely to settle in different places in New Zealand. As will be discussed in more detail below, this variation allows us to create supply-pull instruments for where immigrants with different skills are most likely to settle. 9 The Pacific Islands include Melanesia, Micronesia, and Polynesia (excluding Hawaii); the British Isles include the United Kingdom and Ireland; Western Europe and North America includes all European countries not assigned to the British Isles or Eastern Europe, the United States, Canada and Bermuda; the Former Soviet Union and Eastern Europe includes Greece, Cyprus, the countries of the former Yugoslavia, all former Eastern Bloc countries and all former republics of the Soviet Union (including those in the Baltics, Caucasus, and Central Asia); the Americas, Africa and Middle East includes all countries in Central and South America, the Caribbean, North Africa, Sub-Saharan Africa, and the Middle East (including Turkey); South-East Asia includes Myanmar, Cambodia, Laos, Thailand, Viet Nam, Brunei, Indonesia, Malaysia, Philippines, Singapore, and East Timor; North-East Asia includes China, Hong Kong, Macau, Mongolia, Taiwan, Japan and the Koreas; and South Asia includes Bangladesh, Bhutan, India, Maldives, Nepal, Pakistan and Sri Lanka. The Impact of Immigration on the Labour Market Outcomes of New Zealanders 11
12 Table 2: Qualifications for recent migrants by region of birth in 1996, 2001 and 2006 None School Post-School Degree % of RMs 1996 (# Recent Migrants = 67,002, # NZ Born = 1,161,048) North-East Asia 18% 26% 13% 43% 28% British Isles 8% 22% 34% 36% 18% South-East Asia 29% 19% 14% 38% 7% Australia 14% 26% 28% 31% 7% South and Central Asia 7% 13% 9% 70% 7% Sub-Saharan Africa (incl South Africa) 7% 15% 28% 50% 6% Pacific Islands 44% 31% 16% 9% 6% Southern and Eastern Europe 4% 20% 19% 57% 5% Western and Northern Europe 6% 20% 36% 37% 5% North America 5% 18% 10% 66% 5% North Africa and the Middle East 17% 15% 10% 58% 3% Central and South America 8% 22% 23% 47% 1% New Zealand-born 34% 30% 26% 10% 2001 (# Recent Migrants = 87,780, # NZ Born = 1,189,629) North-East Asia 5% 52% 11% 31% 21% British Isles 3% 32% 27% 39% 17% Sub-Saharan Africa (incl South Africa) 3% 33% 33% 31% 12% Pacific Islands 21% 51% 20% 8% 12% South and Central Asia 5% 27% 12% 57% 9% South-East Asia 14% 38% 10% 38% 9% Australia 4% 42% 21% 33% 5% Western and Northern Europe 1% 44% 21% 34% 4% Southern and Eastern Europe 2% 45% 16% 37% 4% North America 1% 32% 9% 58% 4% North Africa and the Middle East 9% 39% 10% 41% 3% Central and South America 4% 42% 13% 41% 1% New Zealand-born 25% 37% 25% 13% 2006 (# Recent Migrants = 138,465, # NZ Born = 1,173,768) British Isles 2% 25% 31% 42% 21% North-East Asia 7% 43% 16% 34% 20% South and Central Asia 4% 18% 15% 63% 13% Sub-Saharan Africa (incl South Africa) 2% 32% 40% 26% 10% Pacific Islands 16% 45% 27% 12% 9% South-East Asia 9% 26% 17% 47% 7% Australia 3% 32% 26% 39% 4% Western and Northern Europe 1% 25% 31% 43% 4% North America 1% 25% 12% 61% 4% Southern and Eastern Europe 1% 30% 27% 42% 3% North Africa and the Middle East 16% 32% 16% 36% 2% Central and South America 3% 32% 24% 40% 2% New Zealand-born 21% 33% 29% 18% Note: See the note to Table 1 for more information. These figures are the shares out of the total of nonmissing qualifications. 2.3 Defining skill-groups Throughout this paper, we classify individuals into particular skill-groups and allow for substitutability both across and within these groups by nativity. One important question that we need to address is then how to define skill-groups. As in Cohen-Goldner and 12 The Impact of Immigration on the Labour Market Outcomes of New Zealanders
13 Paserman (2006), we consider multiple definitions. Our first definition follows the human capital approach taken in Borjas (2003) and creates 24 age/qualification skill-groups, using the six age categories shown in Table 1, and the four non-missing qualification groups. 10 This approach is appropriate if the productivity of different individuals is determined solely by their measured human capital. One potential problem with using age and qualifications to create skill-groups is that human capital acquired in foreign countries may not translate to similar skill levels in New Zealand. Thus, our second definition follows the methodology first used in Card (2001) and creates five predicted occupation skill-groups defined as each individual s predicted probability of working in each of the following aggregated occupation groups: 1) Legislators, Administrators, and Managers; 2) Professionals; 3) Technicians, Associate Professionals; 4) Clerks, Agriculture, Fishery and Forestry Workers, Trades Workers, and Plant and Machine Operators; and 5) Service and Sales Workers and Elementary Occupations. 11 These predicted probabilities are calculated from a multinomial logit occupational choice model estimated at the national level for each census year separately by gender for the New Zealand-born and immigrants as a function of observed characteristics, such as education, age, ethnicity, years in New Zealand and region of birth. 12 Predicted occupations are used to group individuals rather than actual occupations for two reasons. First, an individual s actual occupation is partially determined by the demand for different occupations in particular locations and the goal is to produce skillgroups that are exogenous to local demand patterns. Second, it would not be possible to assign a skill-group to individuals who are not currently employed without strong assumptions, such as that the unemployed complete directly with other unemployed regardless to other measures of their skill. The main downside in using predicted occupations is that they add noise to our estimates in the sense that some individuals are assigned to the wrong skill-group. The distribution of nativity groups across these five predicted occupational groups is summarised in the following section, together with the actual occupational distribution. 2.4 Labour market outcomes Table 3 presents employment rates, and the industry and occupation mix for the three nativity groups in the 1996, 2001 and 2006 Census. Employment rates are much lower 10 Borjas (2003) uses education and potential experience to define human capital groups. Because our data only identifies qualifications and not years of education, our groups will be the same whether we use age or potential experience to classify individuals. 11 This particular aggregation was chosen by using cluster analysis to group occupations according to the similarity of the individuals employed in them across a wide variety of characteristics. 12 Specifically, separate models are estimated for the New Zealand-born and migrants by gender for all individuals employed and reporting a non-missing occupation in each census year. The following covariates are included for the New Zealand-born models: qualifications, a quadratic in age, ethnicity, qualifications interacted with a quadratic in age, marital status, and household type (couple with or without children, single parent, or non-couple). For immigrants, the following additional covariates are included: a quadratic for years in New Zealand, indicators for whether the individuals moved to NZ earlier than at age 18 or at age 25, indicators for their region of birth and a quadratic for years in New Zealand interacted with qualifications and with region of birth. Predicted probabilities of working in each of the five occupations are then generated using the relevant model and each individual s characteristics. These predicted probabilities are then totalled over each LMA and year to generate counts of the number of individuals predicted to be in occupation skill-group i in LMA j in year t. The Impact of Immigration on the Labour Market Outcomes of New Zealanders 13
14 among recent migrants compared to both earlier migrants and the New Zealand-born, confirming earlier findings by Winkelmann and Winkelmann (1998) and Boyd (2006). Only 55% of recent migrants were employed in 1996 compared with 76% of earlier migrants and 78% of the New Zealand-born. This gap narrowed by 2006, with 73% of recent migrants employed versus 79% of earlier migrants and 82% of the New Zealandborn. Employed migrants and non-migrants work in similar occupations and industries (at a highly aggregated level). The only meaningful differences are that migrants are more likely to be in the Professional occupation and the Business and Property Services and the Accommodation, Cafes and Restaurants industries and are less likely to be in Agriculture, Fishery, or Forestry (occupation or industry) and other blue-collar professions (eg. Trades and Plant and Machine Operators) and industries (eg. Construction). 14 The Impact of Immigration on the Labour Market Outcomes of New Zealanders
15 Table 3: Employment characteristics of migrants and the New Zealand born in 1996, 2001 and NZ EM RM NZ EM RM NZ EM RM Percent Employed 78% 76% 55% 80% 77% 62% 82% 79% 73% Industry Distribution Agriculture, Fishery and Forestry 10% 4% 4% 9% 4% 3% 8% 3% 3% Manufacturing, Mining, and Utilities 15% 19% 15% 14% 16% 13% 13% 14% 12% Construction 7% 5% 4% 7% 5% 4% 8% 5% 6% Wholesale Trade 6% 6% 7% 6% 6% 6% 6% 6% 5% Retail Trade 10% 10% 10% 10% 10% 10% 10% 11% 12% Accommodation, Cafes and Restaurants 3% 4% 6% 3% 4% 6% 3% 5% 7% Transport, Storage, and Communication 6% 5% 4% 6% 5% 4% 5% 5% 5% Finance and Insurance 4% 3% 3% 3% 4% 4% 4% 4% 4% Property and Business Services 10% 11% 14% 12% 13% 14% 13% 15% 16% Government Administration and Defense 5% 5% 3% 4% 4% 3% 4% 3% 3% Education 7% 8% 8% 8% 9% 10% 8% 8% 7% Health and Community Services 7% 8% 9% 9% 10% 11% 8% 10% 10% Cultural and Recreational Services 2% 2% 2% 2% 2% 2% 3% 2% 2% Personal and Other Services 4% 4% 3% 4% 4% 3% 4% 4% 3% Missing Industry 4% 5% 8% 3% 4% 7% 4% 5% 5% Occupation Distribution Legislators, Administrators and Managers 14% 15% 14% 14% 15% 12% 17% 17% 14% Professionals 13% 16% 21% 15% 19% 24% 16% 21% 21% Technicians and Associate Professionals 12% 13% 15% 12% 12% 12% 13% 13% 14% Clerks 13% 13% 10% 13% 12% 10% 11% 10% 11% Service and Sales Workers 11% 11% 12% 12% 12% 12% 11% 11% 13% Agriculture, Fishery and Forestry Workers 10% 4% 4% 8% 4% 3% 7% 3% 3% Trades Workers 9% 9% 7% 9% 8% 7% 9% 7% 8% Plant and Machine Operators 9% 9% 5% 9% 8% 6% 8% 7% 5% Elementary Occupations 6% 6% 5% 5% 5% 5% 5% 5% 5% Missing Occupation 3% 4% 7% 4% 5% 8% 4% 5% 6% Predicted Occupation Distribution (All individuals) Legislators, Administrators, and Managers 13% 13% 13% 14% 15% 12% 16% 17% 14% Professionals 12% 16% 19% 14% 18% 22% 16% 20% 20% Technicians and Associate Professionals 12% 12% 15% 12% 12% 11% 13% 13% 14% Clerks, Agriculture, Trades, and Operators 43% 39% 30% 40% 35% 30% 37% 30% 30% Service and Sales, and Elementary 20% 20% 23% 19% 20% 24% 19% 20% 22% Percent of Employed Individuals 82% 15% 3% 80% 15% 5% 75% 17% 8% Employed Individuals 906, ,221 36, , ,613 54, , , ,464 Individuals 1,161, ,835 67,002 1,189, ,341 87,780 1,173, , ,465 Note: See the note to Table 1 for more information and the text for a description of how predicted occupations are created. NZ = New Zealand-born, EM = earlier migrants and RM = recent migrants. The Impact of Immigration on the Labour Market Outcomes of New Zealanders 15
16 Table 3 also summarises the distribution of predicted occupations for each of the nativity groups, as defined in the previous section. These occupation-related skill groups are defined for all individuals, not only those who are employed at the time of the census. As expected from the different age, qualification, and other characteristics of the groups, the nativity groups have differing predicted occupation profiles. Recent and earlier migrants are much more likely to be in the Professional and Technicians/Associated Professional predicted occupational groups and less likely to be in the Clerks/Agricultural/Trades/Operator predicted occupational groups than the New Zealand-born. This is true in all three census years even though relatively more New Zealand-born individuals are in the Professional predicted occupational group in 2001 and Little differences in found in the proportion of each nativity group predicted to be employed in the three other occupational groupings. Unfortunately, the Census does not directly collect wage data. However, it does collect (bracketed) total annual income on an individual basis. Since one of the goals of this paper is to estimate the impact of immigration on wages for different nativity-groups, we use a secondary dataset to impute wages for all employed individuals in the Census. The Income Survey (IS) has been run annually since 1997 as a supplemental questionnaire to the Household Labour Force Survey (HLFS) and directly collects wage data, as well as comprehensive demographic characteristics and total annual income using a question identical to the one in the Census (including having the exact same brackets). We run separate regressions stratified by gender and country of birth (New Zealand-born versus immigrant) using the 1997, 2001 and 2006 Income Surveys, where the dependent variable is each employed individual s log real hourly wage and the independent variables include indicator variables for each individual s total annual income bracket, their age, age-squared, ethnicity, marital status, qualifications, hours worked in the past week, occupation and geographic location (one of 12 local government regions), and, in addition, for migrants, a quadratic in years in New Zealand and indicator variables for whether they were born in Australia, the United Kingdom, Asia, the Pacific Islands or elsewhere (this is the finest coding available in the IS). 13 We then use the resulting coefficients from these regressions to predict the log real hourly wage for all employed individuals in each Census. This imputed wage rate is then used in the analyses throughout the remainder of this paper. 14 Information on the average wages of individuals in each nativity-group and skill-group are summarised in Table Average real hourly wages are remarkably similar across the three nativity groups, varying by no more than 5% in any year. This lack of an overall difference in wage rates reflects the fact that immigrants are more likely to be in highly paid qualification groups but are paid somewhat less within qualification groups, possibly reflecting their younger age structure, lower New Zealand-specific human capital, or lower transferability of international qualifications. For example, recent 13 The IS sample is fairly large with 800-1,100 immigrants of each gender and 3,400-4,000 NZ-born of each gender in the sample in each year. The R-squared for the imputation regressions range from 0.47 for NZ-born women in 1997 to 0.79 for male immigrants in Besides annual income (strongly positively related to wage rates) and hours worked (strongly negatively related to wage rates controlling for annual income), few of the other control variables are significant or have large impacts on the predicted wage rates. 14 We also estimate the regression models in the paper using average incomes for full-time wage and salary workers to instead proxy for the wages of particular migrant/skill-groups and get qualitatively similar results. 15 For each predicted occupation skill-group, this is calculated by taking a weighted average of each employed individual s wage where the weight is the predicted probability of a particular individual being assigned to a particular predicted occupation. 16 The Impact of Immigration on the Labour Market Outcomes of New Zealanders
17 migrants with either no qualifications or only school qualifications have wage rates that are about 90% of comparable non-migrant in 1996 and only 80% of comparable nonmigrant in While the average wage rate for migrants with post-school qualified migrants is quite similar to that for similarly qualified non-migrants in 1996, it is only 86% of the comparable non-migrant rate in Wage rates for degree qualified recent migrants are 87% of that for comparable non-migrants rate in 1996 and 95% in The Impact of Immigration on the Labour Market Outcomes of New Zealanders 17
18 Table 4: Wages for migrants and the New Zealand born in different skill-groups in 1996, 2001 and NZ Born Earlier Migrants Recent Migrants NZ Born Earlier Migrants Recent Migrants NZ Born Earlier Migrants Recent Migrants Avg. Real Hourly Wage for All Employed $17.37 $18.23 $17.73 $18.88 $18.69 $19.76 $21.00 $19.88 $20.90 Avg. Real Hourly Wage by Qualifications Missing Qualifications $15.11 $15.80 $16.13 $16.69 $15.89 $15.60 $18.35 $16.23 $16.53 No Qualifications $14.57 $14.01 $13.02 $15.33 $15.00 $12.65 $16.41 $15.12 $13.16 School Qualifications $17.40 $17.07 $16.66 $18.32 $17.98 $16.21 $20.23 $18.42 $16.67 Post-school Qualifications $18.72 $19.62 $18.59 $19.87 $20.78 $18.77 $22.09 $22.67 $21.02 Degree Qualifications $25.18 $24.47 $21.91 $26.71 $27.13 $23.36 $26.66 $25.65 $22.93 Avg. Real Hourly Wage by Predicted Occupation Service and Sales, and Elementary $15.96 $15.54 $15.57 $17.09 $16.28 $17.09 $19.08 $17.00 $17.89 Clerks, Agriculture, Trades, and Operators $16.81 $17.10 $16.78 $18.23 $17.56 $18.43 $20.51 $19.30 $19.91 Technicians and Associate Professionals $18.34 $19.67 $19.44 $19.49 $20.21 $21.00 $21.46 $21.14 $22.16 Legislators, Administrators, and Managers $19.05 $19.41 $19.39 $20.63 $20.25 $21.42 $22.27 $21.41 $22.37 Professionals $20.92 $21.40 $21.63 $22.53 $22.11 $24.24 $24.09 $23.03 $24.49 Percent of Employed Individuals 82% 15% 3% 80% 15% 5% 75% 17% 8% Employed Individuals 906, ,221 36, , ,613 54, , , ,464 Individuals 1,161, ,835 67,002 1,189, ,341 87,780 1,173, , ,465 Note: Wages are in June 2006 dollars. See the note to Table 1 for more information and the text for a description of how predicted occupations are created. 18 The Impact of Immigration on the Labour Market Outcomes of New Zealanders
19 In contrast to the wage differences by qualification group, migrants and non-migrants in the same predicted occupation group have quite similar wage rates, with wages for recent migrants % of the comparable non-migrant rate. This is true even though there is a large variation in the average wages for workers across the predicted occupation groups. For example, the average wage for New Zealand-born in the Professional predicted occupation is 26-32% more than the average wage for New Zealand-born in the Service and Sales/Elementary predicted occupation. This wage gradient across predicted occupation groups is even greater for migrants, with the highest paid predicted occupation group receiving, on average, 36-42% more than those in the lowest paid group. This compares to the wage gradient between individuals with no qualifications and those with university qualifications of 38-46%, which generally is the similar across nativity groups Average wage rates for the missing qualifications group suggest that this group is mainly composed of low skilled workers. As noted previously, we exclude these individuals from our main estimates for human capital skill-groups, but also test whether our results are robust to including them as their own skill-group. The Impact of Immigration on the Labour Market Outcomes of New Zealanders 19
20 3. DESCRIPTIVE EVIDENCE We now turn to analysing the impact of immigration on labour market outcomes. We begin by examining the relationship between inflows of recent migrants to different geographic areas and labour market outcomes for different nativity groups in those areas. Before turning to regression analysis, we first examine whether there is a descriptive relationship between the concentrations of recent immigrants in different skill-groups in particular LMAs and the employment rates and average wages for each nativity group in these same skill-groups and LMAs. Economic theory suggests that the entry of immigrants should lower the wages of competing workers and increase the wages of workers whose skills become more valuable because of immigration (Borjas 1999). This increased supply of workers will also lead to reduced employment opportunities for competing workers if wages adjust slowly or institutions, such as minimum wages, make wage adjustment impossible. Figure 1 graphs the five-yearly change in the employment rate for the New Zealand-born (left), earlier migrants (middle) and recent migrants (right) in each skill-group in each of 140 LMAs between each census versus the five-yearly change in the proportion of recent migrants in the overall population in the same skill-group and LMA between each census, with the two sets of comparisons superimposed in the same figure. The top row presents the results for age/qualification skill-groups and the bottom row presents the results for predicted occupation skill-groups. By examining changes between each census, we control for fixed differences across local skill-groups that are related to both the share of recent migrants in a particular skill-group/lma and the employment rate for individuals in that local skill-group. The size of the plot circles are proportional to the average population of each local nativity/skill-group across the two census periods being compared and the solid line in each graph is the best linear fit of the data, with each point weighted by the average population of each local nativity/skill-group All summary statistics and regressions are variance weighted because the number of individuals in each LMA ranges from less than 500 in eight LMAs to over 100,000 in four LMAs and there is a large variation in the relative size of different nativity/skill-groups within LMA/years. If the variances of the estimated employment and wage rates are inversely proportional to the sample sizes for each nativity/skill-group/lma group cell, then weighted estimates are more efficient. 20 The Impact of Immigration on the Labour Market Outcomes of New Zealanders
21
22 Changes in employment rates for the New Zealand-born are weakly related to changes in the recent migrant share of the population in a particular local age/qualification group or in a particular local predicted occupation-group; a 10% increase in the recent migrant share (from the mean recent migrant share of 7% to 7.7%) in a particular local age/qualification group is associated with a 0.04 percentage point decline in the employment rate for the New Zealand-born in that local skill-group while the same change in a particular local predicted occupation-group is associated with a 0.05 percentage point increase in the employment rate for the New Zealand-born in that local skill-group. Similar to the results for the New Zealand-born, a 10% increase in the recent migrant share in a particular local age/qualification group is associated with a 0.05 percentage point decline in the employment rate for earlier migrants and a 0.32 percentage point decline for recent migrants. On the other hand, a 10% increase in the recent migrant share in a particular local predicted occupation group is associated with a 0.35 percentage point increase in the employment rate for earlier migrants and a 0.64 percentage point increase for recent migrants. Overall, a weak correlation is found between changes in the share of recent migrants in particular local skill-groups and changes in employment rates for each nativity group using both skill-group definitions. Figure 2 graphs the five-yearly change in the mean log wage for the New Zealand-born, earlier migrants and recent migrants in each skill-group in each LMA between each census against the five-yearly change in the proportion of recent migrants in the overall population in the same skill-group and LMA between each census and presents the results in the same format as Figure 1. In local skill groups where the recent migrant share grew most, New Zealand-born workers had larger wage increases. For example, a 10% increase in the recent migrant share was associated with 0.21% higher New Zealand-born wages in the same local age/qualification groups, and 0.03% higher New Zealand-born wages in the same local predicted occupation groups. In contrast, wage growth for earlier migrants was lower in local skill-groups with greater increases in recent migrants by 0.11% in local age/qualification groups and by 0.71% in local predicted occupation groups. 22 The Impact of Immigration on the Labour Market Outcomes of New Zealanders
23
24 The results differ by skill-group when we examine the relationship between recent migrant inflows and wage changes for recent migrants themselves. Within local age/qualification groups, a 10% higher recent migrant inflow rate is associated with recent migrant wages that are 0.30% lower, whereas within local predicted occupation groups, they are 0.21% higher. As with employment rates, a weak overall correlation is found between changes in the share of recent migrants in particular local skill-groups and changes in wage rates for each nativity group using both skill-group definitions. The associations displayed in Figure 1 and 2 will only indicate the causal relationship between inflows of recent migrants and labour market outcomes if different LMAs are equal attractive to different skill-groups, to different nativity-groups with the same skills, and their relative attractiveness does not change over time. Thus, we next extend on this graphical evidence by controlling for a range of other possible changes that may be correlated with local labour market outcomes and recent migrant inflows. In particular, we estimate reduced-form regressions models of the following form: Y = γ R + α + α + α + e (1) jkt jkt jk jt kt jkt where j indexes age/qualification or predicted occupation skill-groups, k indexes the 140 LMAs, and t indexes time, Y jkt is the employment rate or mean log wage for the New Zealand-born, earlier migrants or recent migrants in a particular local skill-group in a particular census year, R jkt is the proportion of recent migrants in the overall population in a particular local skill-group, and α jk, α jt and α kt are two-way interactions between skillgroup fixed effects (α j ), LMA fixed effects (α k ) and time fixed effects (α t ). The coefficient of interest in this model is γ, which measures the average impact of a change in the share of recent migrants on employment rates and wages of the New Zealand-born, earlier migrants and recent migrants, controlling for unobservable fixed differences in local labour markets, skill-groups and time-periods, unobservable time-varying differences in local labour markets and skill-groups, and unobservable spatially varying differences in skill-groups. 18 Table 5 presents the results from estimating this regression model for employment rates (left panel) and log real wages (right panel) using both age/qualification (top panel) and predicted occupation (bottom panel) skill-groups. Each regression is variance-weighted by the population of each nativity/skill-group/lma in a particular year and standard errors are clustered by local skill-group to adjust for possible serial correlation or error components within cells. The number of potential observations here is the number of skill groups (5 predicted occupations or 24 age/qualification skill-groups) multiplied by the number of LMAs (140) for each census; ie. 12,600 for age/qualification skill-groups and 2,100 for predicted occupations skill-groups. However, a number of skill-group/lma/year observations are dropped because there are no individuals (for employment rates) or workers (for wages) in a particular nativity in that cell. 18 LMA fixed effects control for differences in local labour market opportunities and are allowed to vary over time and skill-groups, but not both dimensions simultaneously. Skill-group fixed effects control for different returns to human capital in the labour market and are allowed to vary over time and across LMAs, but not both dimensions simultaneously, and year fixed effects control for aggregate changes in employment and wages and are allowed to vary across skill groups and LMAs, but not both dimensions simultaneously. 24 The Impact of Immigration on the Labour Market Outcomes of New Zealanders
Settlement Patterns and the Geographic Mobility of Recent Migrants to New Zealand
 Settlement Patterns and the Geographic Mobility of Recent Migrants to New Zealand David C. Maré, Steven Stillman, Melanie Morten Motu Working Paper 07-11 Motu Economic and Public Policy Research September
The Impact of Immigration on the Geographic Mobility of New Zealanders
 The Impact of Immigration on the Geographic Mobility of New Zealanders Steven Stillman and David C. Maré Motu Working Paper 07-05 Motu Economic and Public Policy Research April 2007 Author contact details
The Impact of Immigration on the Labour Market Outcomes of New Zealanders
 Incomplete, Please Do Not Circulate Last Printed 3/04/2007 10:34 PM The Impact of Immigration on the Labour Market Outcomes of New Zealanders David C. Maré, Steven Stillman Motu Working Paper [Enter Number
The Labour Market Adjustment of Immigrants in New Zealand
 The Labour Market Adjustment of Immigrants in New Zealand Steven Stillman and David C. Maré Motu Working Paper [Enter Number (Office Use)] Motu Economic and Public Policy Research March 2009 Author contact
Gender preference and age at arrival among Asian immigrant women to the US
 Gender preference and age at arrival among Asian immigrant women to the US Ben Ost a and Eva Dziadula b a Department of Economics, University of Illinois at Chicago, 601 South Morgan UH718 M/C144 Chicago,
Housing Markets and Migration: Evidence from New Zealand
 Housing Markets and Migration: Evidence from New Zealand Steven Stillman and David C. Maré Motu Working Paper 08-06 Motu Economic and Public Policy Research April 2008 Author contact details Steven Stillman
Female Labor Force Participation: Contributing Factors
 REGIONAL SEMINAR WOMEN S EMPLOYMENT, ENTREPRENEURSHIP & EMPOWERMENT: MOVING FORWARD ON IMPERFECT PATHWAYS Female Labor Force Participation: Contributing Factors Valerie Mercer-Blackman Senior Economist
Concept note. The workshop will take place at United Nations Conference Centre in Bangkok, Thailand, from 31 January to 3 February 2017.
 Regional workshop on strengthening the collection and use of international migration data in the context of the 2030 Agenda for Sustainable Development Introduction Concept note The United Nations Department
Pakistan 2.5 Europe 11.5 Bangladesh 2.0 Japan 1.8 Philippines 1.3 Viet Nam 1.2 Thailand 1.0
 173 People Snapshots Asia and the Pacific accounts for nearly 55% of global population and 6 of the world s 10 most populous economies. The region s population is forecast to grow by almost 1 billion by
Migrant Youth: A statistical profile of recently arrived young migrants. immigration.govt.nz
 Migrant Youth: A statistical profile of recently arrived young migrants. immigration.govt.nz ABOUT THIS REPORT Published September 2017 By Ministry of Business, Innovation and Employment 15 Stout Street
Exploring relations between Governance, Trust and Well-being
 Exploring relations between Governance, Trust and Well-being Using recent Gallup WorldPoll data Robert Manchin Gallup Europe Asia-Pacific Conference on Measuring Well-Being and Fostering the Progress of
Asian Pacific Islander Catholics in the United States: A Preliminary Report 1
 Asian Pacific Islander Catholics in the United States: A Preliminary Report 1 January 14, 2015 Prepared by Jerry Z. Park W. Matthew Henderson Kenneth Vaughan Baylor University 2 Tricia Bruce Maryville
Asian Pacific Islander Catholics in the United States: A Preliminary Report 1
 Asian Pacific Islander in the United States: A Preliminary Report 1 January 2015 Prepared by Jerry Z. Park W. Matthew Henderson Kenneth Vaughan Baylor University 2 Tricia Bruce Maryville College 3 Stephen
Trade, Employment and Inclusive Growth in Asia. Douglas H. Brooks Jakarta, Indonesia 10 December 2012
 Trade, Employment and Inclusive Growth in Asia Douglas H. Brooks Jakarta, Indonesia 10 December 2012 Relationship between trade and growth is wellestablished 6 Openness and Growth - Asia annual growth
Complementarities between native and immigrant workers in Italy by sector.
 Complementarities between native and immigrant workers in Italy by sector. Ivan Etzo*; Carla Massidda*; Romano Piras** (Draft version: June 2018) Abstract This paper investigates the existence of complementarities
Statistical Yearbook. for Asia and the Pacific
 Statistical Yearbook for Asia and the Pacific 2015 Statistical Yearbook for Asia and the Pacific 2015 Sustainable Development Goal 1 End poverty in all its forms everywhere 1.1 Poverty trends...1 1.2 Data
Population. C.4. Research and development. In the Asian and Pacific region, China and Japan have the largest expenditures on R&D.
 Statistical Yearbook for Asia and the Pacific 2013 C. Education and knowledge C.4. (R&D) is a critical element in the transition towards a knowledgebased economy. It also contributes to increased productivity,
Online Appendices for Moving to Opportunity
 Online Appendices for Moving to Opportunity Chapter 2 A. Labor mobility costs Table 1: Domestic labor mobility costs with standard errors: 10 sectors Lao PDR Indonesia Vietnam Philippines Agriculture,
MEETING THE NEED FOR PERSONAL MOBILITY. A. World and regional population growth and distribution
 30 II. MEETING THE NEED FOR PERSONAL MOBILITY A. World and regional population growth and distribution The world population grew at an annual rate of 1.4 per cent between 1990 and 2000. This is slightly
Inequality of opportunity in Asia and the Pacific
 Inequality of opportunity in Asia and the Pacific Expert Group meeting on Addressing inequalities and challenges to social inclusion through fiscal, wage and social protection policies Thérèse Björk Social
The Economic and Social Review, Vol. 42, No. 1, Spring, 2011, pp. 1 26
 The Economic and Social Review, Vol. 42, No. 1, Spring, 2011, pp. 1 26 Estimating the Impact of Immigration on Wages in Ireland ALAN BARRETT* ADELE BERGIN ELISH KELLY Economic and Social Research Institute,
Outline of Presentation
 DEMOGRAPHIC CHANGE AND ITS IMPLICTIONS FOR LABOUR MOBILITY IN ASIA AND THE PACIFIC by Graeme Hugo University Professorial Research Fellow Professor of Geography and Director of the National Centre for
The Impact of Foreign Workers on the Labour Market of Cyprus
 Cyprus Economic Policy Review, Vol. 1, No. 2, pp. 37-49 (2007) 1450-4561 The Impact of Foreign Workers on the Labour Market of Cyprus Louis N. Christofides, Sofronis Clerides, Costas Hadjiyiannis and Michel
Chapter 5: Internationalization & Industrialization
 Chapter 5: Internationalization & Industrialization Chapter 5: Internationalization & Industrialization... 1 5.1 THEORY OF INVESTMENT... 4 5.2 AN OPEN ECONOMY: IMPORT-EXPORT-LED GROWTH MODEL... 6 5.3 FOREIGN
APPENDIXES. 1: Regional Integration Tables. Table Descriptions. Regional Groupings. Table A1: Trade Share Asia (% of total trade)
") 1: Regional Integration Tables The statistical appendix is comprised of 10 tables that present selected indicators on economic integration covering the 48 regional members of the n Development Bank (ADB).
1: Regional Integration Tables The statistical appendix is comprised of 10 tables that present selected indicators on economic integration covering the 48 regional members of the n Development Bank (ADB).
Goal 1: Eradicate Extreme Poverty and Hunger
 59 In 15 economies of the Asia and Pacific region, including some of the most populous, more than 10% of the population live on less than $1 a day. In 20 economies, again including some of the most populous,
People. Population size and growth. Components of population change
 The social report monitors outcomes for the New Zealand population. This section contains background information on the size and characteristics of the population to provide a context for the indicators
Inequality of Outcomes
 USD Inequality of Outcomes 1. Introduction Economic inequality generally refers to the disproportionate distribution of income, assets or wealth among households in a society. However, the overall welfare
POLICY OPTIONS AND CHALLENGES FOR DEVELOPING ASIA PERSPECTIVES FROM THE IMF AND ASIA APRIL 19-20, 2007 TOKYO
 POLICY OPTIONS AND CHALLENGES FOR DEVELOPING ASIA PERSPECTIVES FROM THE IMF AND ASIA APRIL 19-20, 2007 TOKYO RISING INEQUALITY AND POLARIZATION IN ASIA ERIK LUETH INTERNATIONAL MONETARY FUND Paper presented
Quarterly Labour Market Report. February 2017
 Quarterly Labour Market Report February 2017 MB14052 Feb 2017 Ministry of Business, Innovation and Employment (MBIE) Hikina Whakatutuki - Lifting to make successful MBIE develops and delivers policy, services,
Immigrant-native wage gaps in time series: Complementarities or composition effects?
 Immigrant-native wage gaps in time series: Complementarities or composition effects? Joakim Ruist Department of Economics University of Gothenburg Box 640 405 30 Gothenburg, Sweden joakim.ruist@economics.gu.se
Globalization GLOBALIZATION REGIONAL TABLES. Introduction. Key Trends. Key Indicators for Asia and the Pacific 2009
 GLOBALIZATION 217 Globalization The People s Republic of China (PRC) has by far the biggest share of merchandise exports in the region and has replaced Japan as the top exporter. The largest part of Asia
Volume 35, Issue 1. An examination of the effect of immigration on income inequality: A Gini index approach
 Volume 35, Issue 1 An examination of the effect of immigration on income inequality: A Gini index approach Brian Hibbs Indiana University South Bend Gihoon Hong Indiana University South Bend Abstract This
Summary of the Results
 Summary of the Results CHAPTER I: SIZE AND GEOGRAPHICAL DISTRIBUTION OF THE POPULATION 1. Trends in the Population of Japan The population of Japan is 127.77 million. It increased by 0.7% over the five-year
Do (naturalized) immigrants affect employment and wages of natives? Evidence from Germany
 immigrants affect employment and wages of natives? Evidence from Germany") Do (naturalized) immigrants affect employment and wages of natives? Evidence from Germany Carsten Pohl 1 15 September, 2008 Extended Abstract Since the beginning of the 1990s Germany has experienced a
Do (naturalized) immigrants affect employment and wages of natives? Evidence from Germany Carsten Pohl 1 15 September, 2008 Extended Abstract Since the beginning of the 1990s Germany has experienced a
people/hectare Ward Toronto
 Bar Chart showing the rate of population growth between the years 2006 and 2016 for the Ward compared to the City of based on the 2006 and data. For more information, please contact Michael Wright at 416-392-7558
Charting Singapore s Economy, 1H 2017
 Charting Singapore s Economy, 1H 2017 Designed to help executives interpret economic numbers and incorporate them into company s planning. Publication Date: January 3 rd, 2017 Next Issue: To be published
Poverty Reduction and Economic Growth: The Asian Experience Peter Warr
 Poverty Reduction and Economic Growth: The Asian Experience Peter Warr Abstract. The Asian experience of poverty reduction has varied widely. Over recent decades the economies of East and Southeast Asia
Ward 14 Parkdale-High Park City of Toronto Ward Profiles 2016 Census
 Bar Chart showing the rate of population growth between the years 2006 and 2016 for the Ward compared to the City of based on the 2006 and data. For more information, please contact Michael Wright at 416-392-7558
External migration. Executive summary
 21/4 7 March 21 External migration Executive summary New Zealand s permanent and long-term migrant flows have oscillated between positive and negative net figures over the last 4 years, with a net gain
Immigration and the Labour Market Outcomes of Natives in Developing Countries: A Case Study of South Africa
 Immigration and the Labour Market Outcomes of Natives in Developing Countries: A Case Study of South Africa Nzinga H. Broussard Preliminary Please do not cite. Revised July 2012 Abstract According to the
Ward 17 Davenport City of Toronto Ward Profiles 2016 Census
 Bar Chart showing the rate of population growth between the years 2006 and 2016 for the Ward compared to the City of based on the 2006 and data. For more information, please contact Michael Wright at 416-392-7558
The Labour Market Performance of Immigrant and. Canadian-born Workers by Age Groups. By Yulong Hou ( )
") The Labour Market Performance of Immigrant and Canadian-born Workers by Age Groups By Yulong Hou (7874222) Major paper presented to the Department of Economics of the University of Ottawa in partial fulfillment
The Labour Market Performance of Immigrant and Canadian-born Workers by Age Groups By Yulong Hou (7874222) Major paper presented to the Department of Economics of the University of Ottawa in partial fulfillment
Charting Indonesia s Economy, 1H 2017
 Charting Indonesia s Economy, 1H 2017 Designed to help executives interpret economic numbers and incorporate them into company s planning. Publication Date: January 3 rd, 2017 Next Issue: To be published
Levels and trends in international migration
 Levels and trends in international migration The number of international migrants worldwide has continued to grow rapidly over the past fifteen years reaching million in 1, up from million in 1, 191 million
Inequality in Asia and the Pacific
 Inequality in Asia and the Pacific Inter-regional Expert Group Mee3ng Placing Equality at the Centre of Agenda 2030 Patrik Andersson Chief, Sustainable Socioeconomic Transforma9on Sec9on Social Development
English Deficiency and the Native-Immigrant Wage Gap
 DISCUSSION PAPER SERIES IZA DP No. 7019 English Deficiency and the Native-Immigrant Wage Gap Alfonso Miranda Yu Zhu November 2012 Forschungsinstitut zur Zukunft der Arbeit Institute for the Study of Labor
NBER WORKING PAPER SERIES IMMIGRANTS' COMPLEMENTARITIES AND NATIVE WAGES: EVIDENCE FROM CALIFORNIA. Giovanni Peri
 NBER WORKING PAPER SERIES IMMIGRANTS' COMPLEMENTARITIES AND NATIVE WAGES: EVIDENCE FROM CALIFORNIA Giovanni Peri Working Paper 12956 http://www.nber.org/papers/w12956 NATIONAL BUREAU OF ECONOMIC RESEARCH
North York City of Toronto Community Council Area Profiles 2016 Census
 Bar Chart showing the rate of population growth between the years 2006 and 2016 for the Ward compared to the City of based on the 2006 and data. For more information, please contact Michael Wright at 416-392-7558
Leaving no one behind in Asia and the Pacific
 Leaving no one behind in Asia and the Pacific Addis Ababa, April 18 20, 2018 Predrag Savic, ESCAP POVERTY AND INEQUALITY IN ASIA AND THE PACIFIC 1 Outline 1. Outline 2. Context 3. Poverty in Asia and the
Benefit levels and US immigrants welfare receipts
 1 Benefit levels and US immigrants welfare receipts 1970 1990 by Joakim Ruist Department of Economics University of Gothenburg Box 640 40530 Gothenburg, Sweden joakim.ruist@economics.gu.se telephone: +46
Immigration and property prices: Evidence from England and Wales
 MPRA Munich Personal RePEc Archive Immigration and property prices: Evidence from England and Wales Nils Braakmann Newcastle University 29. August 2013 Online at http://mpra.ub.uni-muenchen.de/49423/ MPRA
Quantitative Analysis of Migration and Development in South Asia
 87 Quantitative Analysis of Migration and Development in South Asia Teppei NAGAI and Sho SAKUMA Tokyo University of Foreign Studies 1. Introduction Asia is a region of high emigrant. In 2010, 5 of the
Gender Issues and Employment in Asia
 J ERE R. BEHRMAN AND ZHENG ZHANG Abstract A major means of engaging women more in development processes is increasingly productive employment. This paper adds perspective on gender issues and employment
Population. D.4. Crime. Homicide rates in Asia and the Pacific are among the lowest in the world.
 Statistical Yearbook for Asia and the Pacific 2013 D. Poverty and insecurity D.4., the application of the rule of law and the strength of the criminal justice system have a profound impact not only on
Trade led Growth in Times of Crisis Asia Pacific Trade Economists Conference 2 3 November 2009, Bangkok
 Trade led Growth in Times of Crisis Asia Pacific Trade Economists Conference 2 3 November 2009, Bangkok Session No: 6 Does Governance Matter for Enhancing Trade? Empirical Evidence from Asia Prabir De
Fiscal Impacts of Immigration in 2013
 www.berl.co.nz Authors: Dr Ganesh Nana and Hugh Dixon All work is done, and services rendered at the request of, and for the purposes of the client only. Neither BERL nor any of its employees accepts any
ENDOGENOUS EMPLOYMENT GROWTH AND DECLINE IN SOUTH EAST QUEENSLAND
 Australasian Journal of Regional Studies, Vol. 14, No. 1, 2008 95 ENDOGENOUS EMPLOYMENT GROWTH AND DECLINE IN SOUTH EAST QUEENSLAND Alistair Robson UQ Social Research Centre, Institute of Social Science,
Mixed Migration Flows in the Asia-Pacific Region
 Mixed Migration Flows in the Asia-Pacific Region Presentation by Raymond Hall, UNHCR Regional Representative in Thailand and Regional Coordinator for South East Asia Bali Process on People Smuggling, Trafficking
Ward 4 Etobicoke Centre City of Toronto Ward Profiles 2016 Census
 Bar Chart showing the rate of population growth between the years 2006 and 2016 for the Ward compared to the City of based on the 2006 and data. For more information, please contact Michael Wright at 416-392-7558
The widening income dispersion in Hong Kong :
 Lingnan University Digital Commons @ Lingnan University Staff Publications Lingnan Staff Publication 3-14-2008 The widening income dispersion in Hong Kong : 1986-2006 Hon Kwong LUI Lingnan University,
Charting South Korea s Economy, 1H 2017
 Charting South Korea s Economy, 1H 2017 Designed to help executives interpret economic numbers and incorporate them into company s planning. Publication Date: January 3 rd, 2017 Next Issue: To be published
The Impact of Immigration on Wages of Unskilled Workers
 The Impact of Immigration on Wages of Unskilled Workers Giovanni Peri Immigrants did not contribute to the national decline in wages at the national level for native-born workers without a college education.
How Do Countries Adapt to Immigration? *
 How Do Countries Adapt to Immigration? * Simonetta Longhi (slonghi@essex.ac.uk) Yvonni Markaki (ymarka@essex.ac.uk) Institute for Social and Economic Research, University of Essex JEL Classification: F22;
LA METRO 2017 DISPARITY STUDY
 LA METRO 2017 DISPARITY STUDY www.bbcresearch.com bbc@bbcresearch.com 303-321-2547 DISPARITY STUDY OBJECTIVES Assess whether minority-/women-owned businesses (M/Ws) face discrimination 1. Assess any underutilization
V. Transport and Communications
 215 V. Transport and Communications Snapshot In 2013, occupants of four-wheeled vehicles comprised a plurality of traffic-related deaths in 15 of 35 regional economies for which data are available. Air
Figure 2.1.1: Percentage Distribution of Population by Global Region, and by Economy in Asia and the Pacific, 2017
 71 I. People Snapshot The combined population of Asia and the Pacific reached 4,141 million in 2017, or 54.8% of the world s total population, down from 56.0% in 2000. In 2017, 5 of the 10 most populous
Endogenous Employment growth and decline in South East Queensland
 Endogenous Employment growth and decline in South East By Alistair Robson 1 UQ Social Research Centre, Institute of Social Science, University of Abstract: The South East region has been recording strong
Do immigrants take or create residents jobs? Quasi-experimental evidence from Switzerland
 Do immigrants take or create residents jobs? Quasi-experimental evidence from Switzerland Michael Siegenthaler and Christoph Basten KOF, ETH Zurich January 2014 January 2014 1 Introduction Introduction:
THE NORTHERN TERRITORY S RY S OVERSEAS BORN POPULATION
 STUDIES RESEARCH BRIEF ISSUE Number 2008010 School for Social and Policy Research 2008 Population Studies Group School for Social and Policy Research Charles Darwin University Northern Territory 0909 dean.carson@cdu.edu.au
Discussion Paper Series
 Discussion Paper Series CDP No 26/10 Immigration and Occupations in Europe Francesco D Amuri and Giovanni Peri Centre for Research and Analysis of Migration Department of Economics, University College
The Labour Market Effect of Immigration: Accounting for Effective Immigrant Work Experience in New Zealand
 Discussion Paper Series IZA DP No. 10422 The Labour Market Effect of Immigration: Accounting for Effective Immigrant Work Experience in New Zealand Michael M.H. Tse Sholeh A. Maani december 2016 Discussion
MOVING TO JOBS? Dave Maré and Jason Timmins Motu Economic and Public Policy Research Trust Motu Working Paper 1 #
 MOVING TO JOBS? Dave Maré and Jason Timmins Motu Economic and Public Policy Research Trust Motu Working Paper 1 # 2003-07 2 June 2003 Dave Maré (dave.mare@motu.org.nz) is Motu s Senior Research Fellow;
1. A Regional Snapshot
 SMARTGROWTH WORKSHOP, 29 MAY 2002 Recent developments in population movement and growth in the Western Bay of Plenty Professor Richard Bedford Deputy Vice-Chancellor (Research) and Convenor, Migration
Goal 7. Ensure access to affordable, reliable, sustainable and modern energy for all
 Goal 7. Ensure access to affordable, reliable, sustainable and modern energy for all Table 4.1: Selected Indicators for SDG 7 - Energy Efficiency and Access to Modern and Renewable Energy Sources By 2030,
A Global Perspective on Socioeconomic Differences in Learning Outcomes
 2009/ED/EFA/MRT/PI/19 Background paper prepared for the Education for All Global Monitoring Report 2009 Overcoming Inequality: why governance matters A Global Perspective on Socioeconomic Differences in
Asia s Economic Transformation Where to, How, and How Fast?
 Asia s Economic Transformation Where to, How, and How Fast? Key Indicators for Asia and the Pacific 13 Special Chapter Jesus Felipe Advisor to the Chief Economist Economics and Research Department Asian
Inclusive Green Growth Index (IGGI): A New Benchmark for Well-being in Asia and the Pacific
: A New Benchmark for Well-being in Asia and the Pacific") Inclusive Green Growth Index (IGGI): A New Benchmark for Well-being in Asia and the Pacific Presented by Radtasiri Wachirapunyanont Intern Governance Thematic Group VPKM and ERCD Outline Stock-taking Introduction
Inclusive Green Growth Index (IGGI): A New Benchmark for Well-being in Asia and the Pacific Presented by Radtasiri Wachirapunyanont Intern Governance Thematic Group VPKM and ERCD Outline Stock-taking Introduction
Gains from "Diversity": Theory and Evidence from Immigration in U.S. Cities
 Gains from "Diversity": Theory and Evidence from Immigration in U.S. Cities GianmarcoI.P.Ottaviano,(Universita dibolognaandcepr) Giovanni Peri, (UC Davis, UCLA and NBER) March, 2005 Preliminary Abstract
Trade Mark Snapshot. Filing, Non-Use & Opposition ASIA PACIFIC 2016
 Trade Mark Snapshot Filing, Non-Use & Opposition ASIA PACIFIC 2016 TRADE MARK FILING SNAPSHOT FIRST TO FILE POWER OF ATTORNEY NICE CLASSIFICATION CERTIFIED COPY OF PRIORITY DOCUMENT MULTI-CLASS IS USE
Information Meeting of States Parties to the World Heritage Convention. Friday 22 January 2003 Paris UNESCO Room IV
 Information Meeting of States Parties to the World Heritage Convention Friday 22 January 2003 Paris UNESCO Room IV Periodic Reporting on the Implementation of the World Heritage Convention in the Asia
Le Sueur County Demographic & Economic Profile Prepared on 7/12/2018
 Le Sueur County Demographic & Economic Profile Prepared on 7/12/2018 Prepared by: Mark Schultz Regional Labor Market Analyst Southeast and South Central Minnesota Minnesota Department of Employment and
Econ 196 Lecture. The Economics of Immigration. David Card
 Econ 196 Lecture The Economics of Immigration David Card Main Questions 1. What are the characteristics of immigrants (and second generation immigrants)? 2. Why do people immigrate? Does that help explain
Social Outlook for Asia and the Pacific: Poorly Protected. Predrag Savic, Social Development Division, ESCAP. Bangkok, November 13, 2018
 Social Outlook for Asia and the Pacific: Poorly Protected Predrag Savic, Social Development Division, ESCAP Bangkok, November 13, 2018 Outline 1. Poverty as a challenge in Asia and the Pacific 2. Lack
Scarborough City of Toronto Community Council Area Profiles 2016 Census
 Bar Chart showing the rate of population growth between the years 2006 and 2016 for the Ward compared to the City of based on the 2006 and data. For more information, please contact Michael Wright at 416-392-7558
VIII. Government and Governance
 247 VIII. Government and Governance Snapshot Based on latest data, three-quarters of the economies in Asia and the Pacific incurred fiscal deficits. Fiscal deficits also exceeded 2% of gross domestic product
Moving Up the Ladder? The Impact of Migration Experience on Occupational Mobility in Albania
 Moving Up the Ladder? The Impact of Migration Experience on Occupational Mobility in Albania Calogero Carletto and Talip Kilic Development Research Group, The World Bank Prepared for the Fourth IZA/World
WORKING PAPERS IN ECONOMICS & ECONOMETRICS. A Capital Mistake? The Neglected Effect of Immigration on Average Wages
 WORKING PAPERS IN ECONOMICS & ECONOMETRICS A Capital Mistake? The Neglected Effect of Immigration on Average Wages Declan Trott Research School of Economics College of Business and Economics Australian
TITLE: AUTHORS: MARTIN GUZI (SUBMITTER), ZHONG ZHAO, KLAUS F. ZIMMERMANN KEYWORDS: SOCIAL NETWORKS, WAGE, MIGRANTS, CHINA
, ZHONG ZHAO, KLAUS F. ZIMMERMANN KEYWORDS: SOCIAL NETWORKS, WAGE, MIGRANTS, CHINA") TITLE: SOCIAL NETWORKS AND THE LABOUR MARKET OUTCOMES OF RURAL TO URBAN MIGRANTS IN CHINA AUTHORS: CORRADO GIULIETTI, MARTIN GUZI (SUBMITTER), ZHONG ZHAO, KLAUS F. ZIMMERMANN KEYWORDS: SOCIAL NETWORKS,
TITLE: SOCIAL NETWORKS AND THE LABOUR MARKET OUTCOMES OF RURAL TO URBAN MIGRANTS IN CHINA AUTHORS: CORRADO GIULIETTI, MARTIN GUZI (SUBMITTER), ZHONG ZHAO, KLAUS F. ZIMMERMANN KEYWORDS: SOCIAL NETWORKS,
Abstract/Policy Abstract
 Gary Burtless* Gary Burtless is a senior fellow at the Brookings Institution. The research reported herein was performed under a grant from the U.S. Social Security Administration (SSA) funded as part
Internal Migration and Education. Toward Consistent Data Collection Practices for Comparative Research
 Internal Migration and Education Toward Consistent Data Collection Practices for Comparative Research AUDE BERNARD & MARTIN BELL QUEENSLAND CENTRE FOR POPULATION RESEARCH UNIVERSITY OF QUEENSLAND, AUSTRALIA
Immigrant Legalization
 Technical Appendices Immigrant Legalization Assessing the Labor Market Effects Laura Hill Magnus Lofstrom Joseph Hayes Contents Appendix A. Data from the 2003 New Immigrant Survey Appendix B. Measuring
Trade led Growth in Times of Crisis Asia Pacific Trade Economists Conference 2 3 November 2009, Bangkok. Session 10
 Trade led Growth in Times of Crisis Asia Pacific Trade Economists Conference 2 3 November 2009, Bangkok Session 10 Trade and Social Development: The Case of Asia Nilanjan Banik Asia Pacific Research and
Asia-Pacific to comprise two-thirds of global middle class by 2030, Report says
 Strictly embargoed until 14 March 2013, 12:00 PM EDT (New York), 4:00 PM GMT (London) Asia-Pacific to comprise two-thirds of global middle class by 2030, Report says 2013 Human Development Report says
Figure 1.1: Percentage Distribution of Population by Global Region, and by Economy in Asia and the Pacific, 2014
 195 People Snapshots Asia and the Pacific accounts for nearly 55% of the global population and six of the world s 10 most populous economies. The region s population is forecast to grow to 5.3 billion
Charting Philippines Economy, 1H 2017
 Charting Philippines Economy, 1H 2017 Designed to help executives interpret economic numbers and incorporate them into company s planning. Publication Date: January 3 rd, 2017 Next Issue: To be published
Immigrant Employment and Earnings Growth in Canada and the U.S.: Evidence from Longitudinal data
 Immigrant Employment and Earnings Growth in Canada and the U.S.: Evidence from Longitudinal data Neeraj Kaushal, Columbia University Yao Lu, Columbia University Nicole Denier, McGill University Julia Wang,
Family Ties, Labor Mobility and Interregional Wage Differentials*
 Family Ties, Labor Mobility and Interregional Wage Differentials* TODD L. CHERRY, Ph.D.** Department of Economics and Finance University of Wyoming Laramie WY 82071-3985 PETE T. TSOURNOS, Ph.D. Pacific
DRIVERS OF DEMOGRAPHIC CHANGE AND HOW THEY AFFECT THE PROVISION OF EDUCATION
 DRIVERS OF DEMOGRAPHIC CHANGE AND HOW THEY AFFECT THE PROVISION OF EDUCATION This paper provides an overview of the different demographic drivers that determine population trends. It explains how the demographic
Language Proficiency and Earnings of Non-Official Language. Mother Tongue Immigrants: The Case of Toronto, Montreal and Quebec City
 Language Proficiency and Earnings of Non-Official Language Mother Tongue Immigrants: The Case of Toronto, Montreal and Quebec City By Yinghua Song Student No. 6285600 Major paper presented to the department