The IMAGE Project - Comparing Internal Migration Around the GlobE: Data, Methods, Variations and Explanations
|
|
|
- Harriet Ross
- 5 years ago
- Views:
Transcription
1 The IMAGE Project - Comparing Internal Migration Around the GlobE: Data, Methods, Variations and Explanations Martin Bell and Elin Charles-Edwards Presentation to Vienna Institute of Demography September 2015

2 Context Compared with other demographic processes, such as fertility and mortality, little attention has been given to the way in which internal migration varies between countries around the world. Comparative indicators conspicuous by their absence from international statistical tables.
3 Significance of Internal Migration Estimated 865 million people outside region of birth Aggregate Level: Major force shaping patterns of human settlement Underpins functioning of the economy Integral to human development Individual Level Essential link to life course transitions Mechanism to meet individual aspirations Means of escape from risk & danger


4 Why Make Comparisons? Aids understanding Promotes analytical rigor Enhances migration theory Assists policy development Rising recognition of significance
5 Impediments Multifaceted nature of migration Lack of ready access to data Disparities in the way internal migration is captured Differences in spatial and temporal frameworks The absence of commonly agreed statistical indicators
6 The IMAGE Project An international collaborative research program which aims to provide a robust basis for comparing internal migration between countries around the world Focus on 193 UN Member States Funded by Australian Research Council Discovery Project The IMAGE Inventory of Migration data The IMAGE Repository of Migration data The IMAGE Studio: computes metrics Focus: Migration intensity Migration distance Migration impacts Migration connectivity Outputs: Thematic Methodological Regional
7 Outline 1. Summarise the global inventory and data repository 2. Describe league table of migration intensities 3. Introduce the IMAGE Studio 4. Summarise the extent of global variation 5. Explore why mobility varies between countries

8 Who collects what?
9 Towards harmonisation Censuses, Registers, and Surveys collect different types of data (e.g. moves/movers, duration of residence) Migration is measured over different intervals No analytic solution for temporal harmonisation Spatial frameworks differ widely from one country to another No simple method of spatial harmonisation
10 Comparing migration intensities Strict comparability requires: Estimates of all changes of address (combining residential mobility and migration) Crude Migration Intensity ACMI = (100*M) / P All moves (M) only available for 30 countries Our solution: Estimate overall intensities based on Courgeau et al (2012) Make separate comparisons for one and five year intervals
11 Courgeau s k (1973) Defines an index, k, to standardise for the number of zones in a country: if the propensity to move is a function of distance, then the crude migration intensity (CMI) must be related to the number of zones into which a territory is divided. The finer the spatial mesh, the larger the number of migrations that will be captured and hence the greater the recorded intensity k represents the slope of a line derived by plotting the CMI from two or more sets of geographies against the log of the number of zones in each geography Algebraically, CMI=k log (n)
12 Crude Migration Intensity (%) Courgeau et al. (2012) Plots CMI against average households (H) per zone (j) CMI j = w + k ln (H/j) When H/j = 1 (i.e. average of 1 household per zone) then ACMI = w (representing aggregate mobility) Implementation constrained by available geographies (e.g. states, provinces, counties) Create additional geographies using the IMAGE Studio Germany Administrative levels ln (number of households/number of spatial units)
13 The IMAGE Studio Data Preparation (Flow matrix, PARs, Shapefiles of Basic Spatial Units (BSUs)) Spatial Aggregation (Randomly aggregates BSUs into Aggregate Spatial Regions (ASRs)) Computation of Indicators (Intensity, Impact, Connectivity) Spatial Interaction Model


14 IMAGE Studio Subsystem Interfaces Data Preparation Spatial Aggregation Internal Migration Indicators Spatial Interaction Modelling
15 How and why of spatial aggregation? Creates a range of additional geographies by random aggregation of Basic Spatial Units (BSUs) into progressively larger regions Multiple configurations at each spatial scale Generates additional geographies for estimation of ACMI using Courgeau Enables us to explore the impact of the MAUP on migration indices Scale component: How does the indicator vary according to the number of Aggregated Spatial Regions (ASRs)? Pattern component: How does the indicator vary according to the configuration of ASRs at any spatial scale?

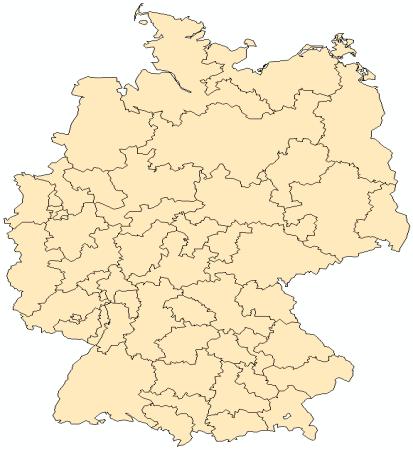

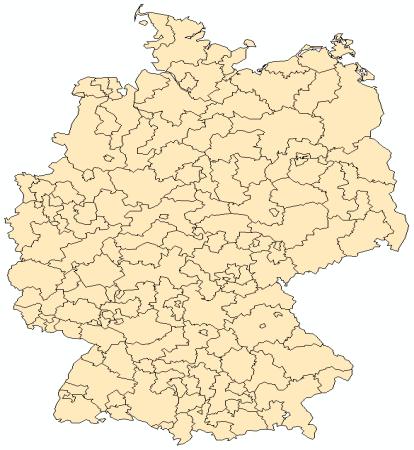
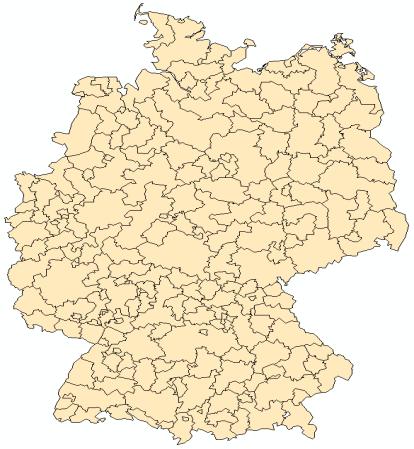
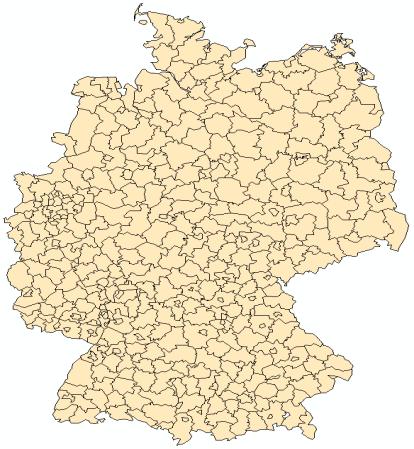
16 Example of aggregation: Germany 412 BSUs 200 ASRs 150 ASRs 100 ASRs 50 ASRs 10 ASRs
17 Crude Migration Intensity (%) Using the Courgeau et al. (2012) method year event Estimated overall mobility (a) Sweden_E Germany_E Belgium_E Finland_E Ln (No of Households / No of ASRs)

18 IMAGE Repository Region Total countries Countries for which data are held Data on all changes of address Origindestination matrix Africa Asia Europe Latin America North America Oceania Total
19 League Table Coverage Region Number of countries Percentage of population Total countries in region Africa Asia Europe Latin America North America Oceania Total % of global population 35/98 countries missing have pop n<1 million 3/98 have pop n >100 million (Pakistan, Nigeria & Bangladesh)
20 One year intensities Fiver year intensities Migration intensities Iceland Australia Finland Zambia Kenya Canada Norway Sweden USA Denmark Tanzania UK Switzerland Belgium Netherlands Germany Sudan Colombia Greece Austria Japan Hungary Turkey Israel Ireland Belarus Lithuania Latvia Italy Portugal Estonia Malta Bulgaria Czech Republic Burkina Faso Romania Cyprus Spain Slovakia Croatia Ukraine Slovenia Russian Federation Poland Macedonia 19,1 17,6 17,0 13,3 15,4 16,0 12,8 12,7 12,5 12,2 12,0 10,9 10,7 9,0 10,1 10,3 8,8 8,6 8,1 8,1 7,9 7,4 7,1 7,0 6,6 5,7 5,5 5,1 5,1 5,1 4,8 4,7 4,5 4,2 4,0 4,0 3,8 3,1 2,7 2,7 2,7 2,5 2,0 1,3 1,0 0,0 5,0 10,0 15,0 20,0 ACMI (%) New Zealand 54,7 South Korea 52,8 USA 44,3 Australia 42,4 Fiji 41,3 Canada 38,5 Panama 37,1 Chile 36,2 Switzerland 36,1 Senegal 34,7 France 34,0 Cameroon 32,9 Paraguay 31,0 Japan 28,9 Israel 28,2 Mongolia 27,4 Barbados 26,5 Bolivia 22,9 Kyrgyzstan 22,4 Peru 21,8 Uruguay 21,5 Guinea 21,3 South Africa 21,2 Morocco 20,8 Malta 19,8 Uganda 19,1 Cambodia 18,4 Rwanda 18,1 Greece 18,1 Brazil 17,5 Argentina 17,5 Malaysia 17,1 Costa Rica 16,7 Tunisia 15,9 Ghana 15,0 Guatemala 14,4 Dominican Republic 13,9 Portugal 13,5 China 12,8 Vietnam 12,6 Indonesia 12,4 El Salvador 12,3 Mauritius 12,0 Cuba 11,9 Honduras 11,9 Thailand 11,2 St Lucia 10,9 Nicaragua 10,1 Ecuador 9,6 Haiti 9,5 Philippines 9,3 Spain 8,6 Iraq 8,5 Nepal 8,3 Venezuela 7,8 Mali 7,4 North Korea 6,3 Mexico 6,1 Egypt 5,4 India 5,2 0,0 20,0 40,0 60,0 ACMI (%)

21 Standardised Migration Intensities
22 Modes of explanation Culture of mobility (e.g. Long 1991) High mobility in new world countries reflects the peripatetic tradition of immigrant forbears A mobility transition (e.g. Zelinsky 1971, Skeldon 1997) definite patterned regularities in the growth of personal mobility through space-time associated with modernisation Life course transitions (e.g. Rogers and Castro 1981, Bernard et al 2014b) focus on the role of life course transitions and housing adjustment in triggering migration Measures of development: Geographic, Social, Economic, Demographic Variables Undertaken separately for 1 and 5 year data
23 Explaining cross-national differentials Explanatory Variables Geographic One-year ACMI Five-year ACMI n r p n r p Geographic area (Square root) ** Population density Urbanisation ** ** Economic GDP per capita ** ** Gini coefficient (Income inequality 2000) Foreign direct investment /GDP (2000) Female labour force participation (2000) ** Labour force participation (2000) *
24 Explaining cross-national differentials Explanatory Variables Social One-year ACMI Five-year ACMI n r p n r p Human development index (2000) ** ** Mobile phone subscribers (2000) ** ** Literacy (2000) ** Per cent males living at home ** * Demographic Growth rate ( ) ** E 0 ( ) Total Fertility Rate (TFR) ( ) ** Median age ** Net international migration rate ( ) * ** Remittances as % of GDP (2000) *
25 1 year migration intensity 5 year migration intensity Level of Urbanisation Ireland Turkey Switzerland Greece Portugal Belarus Cyprus Romania Poland Croatia Slovakia Slovenia Macedonia Sweden Austria Hungary Lithuania Latvia Estonia Bulgaria Italy USA Germany Colombia UK Netherlands Spain Canada Japan Czech Republic Finland Australia Norway Denmark Belgium Iceland Israel Malta Urban Population (%) Senegal Switzerland Cameroon Paraguay Barbados Fiji Mongolia Panama New Zealand South Korea Canada Chile France Japan Israel Uganda Guinea Kyrgyz Republic Bolivia Morocco South Africa Peru Uruguay Tunisia Malta Cambodia Brazil Ghana Costa Rica Greece Malaysia Argentina Vietnam Guatemala Rwanda China Indonesia Portugal Dominican Republic Mauritius St Lucia Ecuador El Salvador Thailand Haiti Philippines Nicaragua Nepal Iraq Spain Mali Venezuela Honduras India Egypt Mexico USA Australia Urban Population (%) r=0.65, n=40 r=0.39, n=60
26 1 year migration intensity 5 year migration intensity Human development index Finland Iceland Australia New Zealand South Korea Turkey Colombia Greece Hungary Austria Japan Norway Sweden Canada Denmark UK Switzerland Belgium Germany Lithuania Israel Belarus Portugal Ireland Latvia Malta Estonia Bulgaria Cyprus Romania Poland Czech Republic Spain Croatia Slovakia Italy Slovenia Macedonia USA Netherlands 0 0,6 0,65 0,7 0,75 0,8 0,85 0,9 0,95 HDI Senegal Cameroon Paraguay Japan Mongolia Barbados Israel Kyrgyz Republic Bolivia Guinea Peru Uruguay Morocco Malta South Africa Rwanda Tunisia Greece Cambodia Uganda Malaysia Brazil Costa Rica Guatemala Dominican Republic Argentina Ghana Indonesia Portugal Vietnam Mauritius Haiti Nicaragua China Thailand Honduras Ecuador Mali Philippines Spain Venezuela Iraq Nepal India Mexico Egypt Fiji Panama Chile USA Australia Canada Switzerland France 0 0,2 0,4 0,6 0,8 1 HDI r=0.57, n=38 r=0.48, n=58
27 Typical age Profile of Migration Bernard, A., Bell, M., & Charles-Edwards, E. (2014). Life-Course Transitions and the Age Profile of Internal Migration. Population and Development Review, 40(2),
28 Country Variations in the Age Profile Bernard, A., Bell, M., & Charles-Edwards, E. (2014). Life-Course Transitions and the Age Profile of Internal Migration. Population and Development Review, 40(2),
29 Comparative age profile metrics Existing approach Parameters of model schedules (Rogers and Castro, 1981) Issues related to their estimation (variability, sensitivity and instability) and interpretation (comparability and interpretability) Alternative indicators Normalised intensity at peak Age at peak + Overall migration intensity 2/3 of inter-country variance Bernard, A., Bell, M., & Charles-Edwards, E. (2014). Improved measures for the cross-national comparison of age profiles of internal migration. Population Studies, 68(2)
30 Regional migration profile clusters late and dispersed early and dispersed Three solution k-means clusters based on variables normalised to unit variance early and concentrated
31 Life-Course Transition Metrics Transitions measured from status by age Completion of higher education Entry into labour force Union formation Family formation 1,0 0,8 0,6 0,4 China Brazil France Metrics Prevalence (Modell et al. 1976) Proposition of a population that has experienced a transition at age 35 Timing (Hajnal 1953) Singulate mean age computed between ages 15 and 35 Spread (Carter and Glick 1970) Interquartile range 0,2 0, Marital status by age Bernard, A., Bell, M., & Charles-Edwards, E. (2014) Life-Course Transitions and the Age Profile of Internal Migration. Population and Development Review, 40(2),
32 Spread Timing Prevalence Summary Indices of the Life-Course Factor analysis, females Factor 1 Timing Index Factor 2 Spread Index Higher education Union formation Education completion Union formation Parenthood Education completion Union formation Share of total variance Bernard, A., Bell, M., & Charles-Edwards, E. (2014) Life-Course Transitions and the Age Profile of Internal Migration. Population and Development Review, 40(2),
33 Migration and life course transitions timing
34 Migration and life course transitions spread Brief transition
35 Conceptual Framework The Proximate Determinants of Internal Migration Age Patterns Underlying determinants Proximate determinants Migration outcome Context Social Economic Cultural Religious Demographic Life-course transitions Completion of education Entry into labour force Union formation Chilbearing Migration age patterns
36 Conclusions First global dataset on internal migration Wide diversity in data collection practice Problems of harmonisation statistical solutions Wide variation in migration intensities Positive association with development indicators Differences in age profile as well as intensity Links to life course transitions Other dimensions spatial impact; connectivity; distance decay Implications for data collection Implications for policy
Comparing Mobility Around the World: Results from the IMAGE Project
 Comparing Mobility Around the World: Results from the IMAGE Project Martin Bell The University of Queensland Mobility Symposium 2016 The Australian National University 21 March 2016 CRICOS Provider No
Eighth International Conference on Population Geographies Brisbane, 30 June to 3 July 2015
 Marek Kupiszewski 1, Dorota Kupiszewska 2 Martin Bell 3, Elin Charles Edwards 3, Aude Benard 3, Philipp Ueffing 3 Philip Rees 4, John Stillwell 4, Konstantinos Daras 5 Eighth International Conference on
HUMAN RESOURCES IN R&D
 HUMAN RESOURCES IN R&D This fact sheet presents the latest UIS S&T data available as of July 2011. Regional density of researchers and their field of employment UIS Fact Sheet, August 2011, No. 13 In the
Data access for development: The IPUMS perspective
 Data access for development: The IPUMS perspective United Nations Commission on Population and Development Strengthening the demographic evidence base for the post-2015 development agenda New York 11 April
Internal Migration and Development in Latin America
 Internal Migration and Development in Latin America Francisco Rowe Philipp Ueffing Martin Bell Elin Charles-Edwards 8th International Conference on Population Geographies, 30 th June- 3 rd July, 2015,
Income and Population Growth
 Supplementary Appendix to the paper Income and by Markus Brueckner and Hannes Schwandt November 2013 downloadable from: https://sites.google.com/site/markusbrucknerresearch/research-papers Table of Contents
Contracting Parties to the Ramsar Convention
 Contracting Parties to the Ramsar Convention 14/12/2016 Number of Contracting Parties: 169 Country Entry into force Notes Albania 29.02.1996 Algeria 04.03.1984 Andorra 23.11.2012 Antigua and Barbuda 02.10.2005
The Multidimensional Financial Inclusion MIFI 1
 2016 Report Tracking Financial Inclusion The Multidimensional Financial Inclusion MIFI 1 Financial Inclusion Financial inclusion is an essential ingredient of economic development and poverty reduction
The National Police Immigration Service (NPIS) forcibly returned 412 persons in December 2017, and 166 of these were convicted offenders.
 forcibly returned 412 persons in December 2017, and 166 of these were convicted offenders.") Monthly statistics December 2017: Forced returns from Norway The National Police Immigration Service (NPIS) forcibly returned 412 persons in December 2017, and 166 of these were convicted offenders. The
Monthly statistics December 2017: Forced returns from Norway The National Police Immigration Service (NPIS) forcibly returned 412 persons in December 2017, and 166 of these were convicted offenders. The
GLOBAL RISKS OF CONCERN TO BUSINESS WEF EXECUTIVE OPINION SURVEY RESULTS SEPTEMBER 2017
 GLOBAL RISKS OF CONCERN TO BUSINESS WEF EXECUTIVE OPINION SURVEY RESULTS SEPTEMBER 2017 GLOBAL RISKS OF CONCERN TO BUSINESS Results from the World Economic Forum Executive Opinion Survey 2017 Survey and
Internal Migration and Education. Toward Consistent Data Collection Practices for Comparative Research
 Internal Migration and Education Toward Consistent Data Collection Practices for Comparative Research AUDE BERNARD & MARTIN BELL QUEENSLAND CENTRE FOR POPULATION RESEARCH UNIVERSITY OF QUEENSLAND, AUSTRALIA
2018 Social Progress Index
 2018 Social Progress Index The Social Progress Index Framework asks universally important questions 2 2018 Social Progress Index Framework 3 Our best index yet The Social Progress Index is an aggregate
Delays in the registration process may mean that the real figure is higher.
 Monthly statistics December 2013: Forced returns from Norway The National Police Immigration Service (NPIS) forcibly returned 483 persons in December 2013. 164 of those forcibly returned in December 2013
Human Resources in R&D
 NORTH AMERICA AND WESTERN EUROPE EAST ASIA AND THE PACIFIC CENTRAL AND EASTERN EUROPE SOUTH AND WEST ASIA LATIN AMERICA AND THE CARIBBEAN ARAB STATES SUB-SAHARAN AFRICA CENTRAL ASIA 1.8% 1.9% 1. 1. 0.6%
A Partial Solution. To the Fundamental Problem of Causal Inference
 A Partial Solution To the Fundamental Problem of Causal Inference Some of our most important questions are causal questions. 1,000 5,000 10,000 50,000 100,000 10 5 0 5 10 Level of Democracy ( 10 = Least
Country pairings for the second cycle of the Mechanism for the Review of Implementation of the United Nations Convention against Corruption
 Country pairings for the second cycle of the Mechanism for the Review of Implementation of the United Nations Convention against Corruption In year 1, a total of 29 reviews will be conducted: Regional
Regional Scores. African countries Press Freedom Ratings 2001
 Regional Scores African countries Press Freedom 2001 Algeria Angola Benin Botswana Burkina Faso Burundi Cape Verde Cameroon Central African Republic Chad Comoros Congo (Brazzaville) Congo (Kinshasa) Cote
World Refugee Survey, 2001
 World Refugee Survey, 2001 Refugees in Africa: 3,346,000 "Host" Country Home Country of Refugees Number ALGERIA Western Sahara, Palestinians 85,000 ANGOLA Congo-Kinshasa 12,000 BENIN Togo, Other 4,000
Copyright Act - Subsidiary Legislation CHAPTER 311 COPYRIGHT ACT. SUBSIDIARY LEGlSLA non. List o/subsidiary Legislation
 Copyright Act - Subsidiary Legislation CAP. 311 CHAPTER 311 COPYRIGHT ACT SUBSIDIARY LEGlSLA non List o/subsidiary Legislation Page I. Copyright (Specified Countries) Order... 83 81 [Issue 1/2009] LAWS
Figure 2: Range of scores, Global Gender Gap Index and subindexes, 2016
 Figure 2: Range of s, Global Gender Gap Index and es, 2016 Global Gender Gap Index Yemen Pakistan India United States Rwanda Iceland Economic Opportunity and Participation Saudi Arabia India Mexico United
Global Prevalence of Adult Overweight & Obesity by Region
 Country Year of Data Collection Global Prevalence of Adult Overweight & Obesity by Region National /Regional Survey Size Age Category % BMI 25-29.9 %BMI 30+ % BMI 25- %BMI 30+ 29.9 European Region Albania
SCALE OF ASSESSMENT OF MEMBERS' CONTRIBUTIONS FOR 1994
 International Atomic Energy Agency GENERAL CONFERENCE Thirtyseventh regular session Item 13 of the provisional agenda [GC(XXXVII)/1052] GC(XXXVII)/1070 13 August 1993 GENERAL Distr. Original: ENGLISH SCALE
Collective Intelligence Daudi Were, Project
 Collective Intelligence Daudi Were, Project Director, @mentalacrobatic Kenya GDP 2002-2007 Kenya General Election Day 2007 underreported unreported Elections UZABE - Nigerian General Election - 2015
Mechanism for the Review of Implementation of the United Nations Convention against Corruption: country pairings for the second review cycle
 Mechanism for the Review of Implementation of the United Nations Convention against Corruption: country pairings for the second review cycle In the first year, a total of 29 reviews will be conducted.
MIGRATION IN SPAIN. "Facebook or face to face? A multicultural exploration of the positive and negative impacts of
 "Facebook or face to face? A multicultural exploration of the positive and negative impacts of Science and technology on 21st century society". MIGRATION IN SPAIN María Maldonado Ortega Yunkai Lin Gerardo
2017 Social Progress Index
 2017 Social Progress Index Central Europe Scorecard 2017. For information, contact Deloitte Touche Tohmatsu Limited In this pack: 2017 Social Progress Index rankings Country scorecard(s) Spotlight on indicator
LIST OF CHINESE EMBASSIES OVERSEAS Extracted from Ministry of Foreign Affairs of the People s Republic of China *
 ANNEX 1 LIST OF CHINESE EMBASSIES OVERSEAS Extracted from Ministry of Foreign Affairs of the People s Republic of China * ASIA Chinese Embassy in Afghanistan Chinese Embassy in Bangladesh Chinese Embassy
LIST OF CONTRACTING STATES AND OTHER SIGNATORIES OF THE CONVENTION (as of January 11, 2018)
") ICSID/3 LIST OF CONTRACTING STATES AND OTHER SIGNATORIES OF THE CONVENTION (as of January 11, 2018) The 162 States listed below have signed the Convention on the Settlement of Investment Disputes between
ICSID/3 LIST OF CONTRACTING STATES AND OTHER SIGNATORIES OF THE CONVENTION (as of January 11, 2018) The 162 States listed below have signed the Convention on the Settlement of Investment Disputes between
Mechanism for the Review of Implementation of the United Nations Convention against Corruption: country pairings for the second review cycle
 Mechanism for the Review of Implementation of the United Nations Convention against Corruption: country pairings for the second review cycle In the first year, a total of 29 reviews will be conducted.
The NPIS is responsible for forcibly returning those who are not entitled to stay in Norway.
 Monthly statistics December 2014: Forced returns from Norway The National Police Immigration Service (NPIS) forcibly returned 532 persons in December 2014. 201 of these returnees had a criminal conviction
SEVERANCE PAY POLICIES AROUND THE WORLD
 SEVERANCE PAY POLICIES AROUND THE WORLD SEVERANCE PAY POLICIES AROUND THE WORLD No one likes to dwell on lay-offs and terminations, but severance policies are a major component of every HR department s
Return of convicted offenders
 Monthly statistics December : Forced returns from Norway The National Police Immigration Service (NPIS) forcibly returned 869 persons in December, and 173 of these were convicted offenders. The NPIS forcibly
Proposed Indicative Scale of Contributions for 2016 and 2017
 October 2015 E Item 16 of the Provisional Agenda SIXTH SESSION OF THE GOVERNING BODY Rome, Italy, 5 9 October 2015 Proposed Indicative Scale of Contributions for 2016 and 2017 Note by the Secretary 1.
Sex ratio at birth (converted to female-over-male ratio) Ratio: female healthy life expectancy over male value
 Ratio: female healthy life expectancy over male value") Table 2: Calculation of weights within each subindex Economic Participation and Opportunity Subindex per 1% point change Ratio: female labour force participation over male value 0.160 0.063 0.199 Wage
Table 2: Calculation of weights within each subindex Economic Participation and Opportunity Subindex per 1% point change Ratio: female labour force participation over male value 0.160 0.063 0.199 Wage
Translation from Norwegian
 Statistics for May 2018 Forced returns from Norway The National Police Immigration Service (NPIS) forcibly returned 402 persons in May 2018, and 156 of these were convicted offenders. The NPIS is responsible
Countries for which a visa is required to enter Colombia
 Albania EASTERN EUROPE Angola SOUTH AFRICA Argelia (***) Argentina SOUTH AMERICA Australia OCEANIA Austria Azerbaijan(**) EURASIA Bahrain MIDDLE EAST Bangladesh SOUTH ASIA Barbados CARIBBEAN AMERICA Belgium
Global Variations in Growth Ambitions
 Global Variations in Growth Ambitions Donna Kelley, Babson College 7 th Annual GW October Entrepreneurship Conference World Bank, Washington DC October 13, 216 Wide variation in entrepreneurship rates
IPUMS at the 58 th ISI ISI (Dublin, Aug 20-21, 21, 2011) IPUMS Workshop (Aug 20-21) 21)» STS065 Future of Microdata Ac
 IPUMS Workshop (Aug 20-21) 21)» STS065 Future of Microdata Ac") Welcome to the 11 th IPUMS-International International workshop: Dublin, Ireland, Aug 20-21, 21, 2011 *** Robert McCaa, Professor of population history University of Minnesota rmccaa@umn.edu for additional
Welcome to the 11 th IPUMS-International International workshop: Dublin, Ireland, Aug 20-21, 21, 2011 *** Robert McCaa, Professor of population history University of Minnesota rmccaa@umn.edu for additional
1994 No DESIGNS
 1994 No. 3219 DESIGNS The Designs (Convention Countries) Order 1994 Made 14th December 1994 Coming into force 13th January 1995 At the Court at Buckingham Palace, the 14th day of December 1994 Present,
Country pairings for the second review cycle of the Mechanism for the Review of Implementation of the United Nations Convention against Corruption
 Country pairings for the second review cycle of the Mechanism for the Review of Implementation of the United Nations Convention against Corruption In the first year, a total of 29 reviews will be conducted.
Diplomatic Conference to Conclude a Treaty to Facilitate Access to Published Works by Visually Impaired Persons and Persons with Print Disabilities
 E VIP/DC/7 ORIGINAL: ENGLISH DATE: JUNE 21, 2013 Diplomatic Conference to Conclude a Treaty to Facilitate Access to Published Works by Visually Impaired Persons and Persons with Print Disabilities Marrakech,
Country pairings for the first cycle of the Mechanism for the Review of Implementation of the United Nations Convention against Corruption
 Country pairings for the first cycle of the Mechanism for the Review of Implementation of the United Nations Convention against Corruption YEAR 1 Group of African States Zambia Zimbabwe Italy Uganda Ghana
REGIONAL INTEGRATION IN THE AMERICAS: THE IMPACT OF THE GLOBAL ECONOMIC CRISIS
 REGIONAL INTEGRATION IN THE AMERICAS: THE IMPACT OF THE GLOBAL ECONOMIC CRISIS Conclusions, inter-regional comparisons, and the way forward Barbara Kotschwar, Peterson Institute for International Economics
A GLOBAL PERSPECTIVE ON RESEARCH AND DEVELOPMENT
 UNESCO Institute for Statistics A GLOBAL PERSPECTIVE ON RESEARCH AND DEVELOPMENT The UNESCO Institute for Statistics (UIS) works with governments and diverse organizations to provide global statistics
The Conference Board Total Economy Database Summary Tables November 2016
 The Conference Board Total Economy Database Summary Tables November 2016 About This document contains a number of tables and charts outlining the most important trends from the latest update of the Total
AUSTRALIA S REFUGEE RESPONSE NOT THE MOST GENEROUS BUT IN TOP 25
 19 July 2013 AUSTRALIA S REFUGEE RESPONSE NOT THE MOST GENEROUS BUT IN TOP 25 Australia is not the world s most generous country in its response to refugees but is just inside the top 25, according to
PROTOCOL RELATING TO AN AMENDMENT TO THE CONVENTION ON INTERNATIONAL CIVIL AVIATION ARTICLE 45, SIGNED AT MONTREAL ON 14 JUNE parties.
 PROTOCOL RELATING TO AN AMENDMENT TO THE CONVENTION ON INTERNATIONAL CIVIL AVIATION ARTICLE 45, SIGNED AT MONTREAL ON 14 JUNE 1954 State Entry into force: The Protocol entered into force on 16 May 1958.
1 THICK WHITE SENTRA; SIDES AND FACE PAINTED TO MATCH WALL PAINT: GRAPHICS DIRECT PRINTED TO SURFACE; CLEAT MOUNT TO WALL CRITICAL INSTALL POINT
 Map Country Panels 1 THICK WHITE SENTRA; SIDES AND FACE PAINTED TO MATCH WALL PAINT: GRAPHICS DIRECT PRINTED TO SURFACE; CLEAT MOUNT TO WALL CRITICAL INSTALL POINT GRAPHICS PRINTED DIRECT TO WHITE 1 THICK
UNHCR, United Nations High Commissioner for Refugees
 States Parties to the 1951 Convention relating to the Status of Refugees and the 1967 Protocol Date of entry into force: 22 April 1954 (Convention) 4 October 1967 (Protocol) As of 1 February 2004 Total
1994 No PATENTS
 1994 No. 3220 PATENTS The Patents (Convention Countries) Order 1994 Made 14th December 1994 Laid before Parliament 23rd December 1994 Coming into force 13th January 1995 At the Court at Buckingham Palace,
STATUS OF THE CONVENTION ON THE PROHIBITION OF THE DEVELOPMENT, PRODUCTION, STOCKPILING AND USE OF CHEMICAL WEAPONS AND ON THEIR DESTRUCTION
 OPCW Technical Secretariat S/6/97 4 August 1997 ENGLISH: Only STATUS OF THE CONVENTION ON THE PROHIBITION OF THE DEVELOPMENT, PRODUCTION, STOCKPILING AND USE OF CHEMICAL WEAPONS AND ON THEIR DESTRUCTION
Trends in international higher education
 Trends in international higher education 1 Schedule Student decision-making Drivers of international higher education mobility Demographics Economics Domestic tertiary enrolments International postgraduate
Good Sources of International News on the Internet are: ABC News-
 Directions: AP Human Geography Summer Assignment Ms. Abruzzese Part I- You are required to find, read, and write a description of 5 current events pertaining to a country that demonstrate the IMPORTANCE
Country pairings for the first review cycle of the Mechanism for the Review of Implementation of the United Nations Convention against Corruption
 Country pairings for the first review cycle of the Mechanism for the Review of Implementation of the United Nations Convention against Corruption In the first year, a total of 27 reviews will be conducted.
VACATION AND OTHER LEAVE POLICIES AROUND THE WORLD
 VACATION AND OTHER LEAVE POLICIES AROUND THE WORLD VACATION AND OTHER LEAVE POLICIES AROUND THE WORLD AT A GLANCE ORDER ONLINE GEOGRAPHY 47 COUNTRIES COVERED 5 REGIONS 48 MARKETS Americas Asia Pacific
2018 Global Law and Order
 2018 Global Law and Order Copyright Standards This document contains proprietary research, copyrighted and trademarked materials of Gallup, Inc. Accordingly, international and domestic laws and penalties
The National Police Immigration Service (NPIS) returned 444 persons in August 2018, and 154 of these were convicted offenders.
 returned 444 persons in August 2018, and 154 of these were convicted offenders.") Monthly statistics August 2018 Forced returns from Norway The National Police Immigration Service (NPIS) returned 444 persons in August 2018, and 154 of these were convicted offenders. The NPIS is responsible
Monthly statistics August 2018 Forced returns from Norway The National Police Immigration Service (NPIS) returned 444 persons in August 2018, and 154 of these were convicted offenders. The NPIS is responsible
TAKING HAPPINESS SERIOUSLY
 TAKING HAPPINESS SERIOUSLY FLACSO-INEGI seminar Mexico City, April 18, 2013 John Helliwell Canadian Institute for Advanced Research and Vancouver School of Economics, UBC In collaboration with Shun Wang,
REPORT OF THE FOURTH SPECIAL SESSION OF THE CONFERENCE OF THE STATES PARTIES
 OPCW Conference of the States Parties Fourth Special Session C-SS-4/3 26 and 27 June 2018 27 June 2018 Original: ENGLISH REPORT OF THE FOURTH SPECIAL SESSION OF THE CONFERENCE OF THE STATES PARTIES 1.
Share of Countries over 1/3 Urbanized, by GDP per Capita (2012 $) 1960 and 2010
 1960 and 2010") Share of Countries over 1/3 Urbanized, by GDP per Capita (2012 $) 1960 and 2010 Share Urbanized 0.2.4.6.8 1 $0-1000 $1000-2000 $2000-3000 $3000-4000 $4000-5000 1960 2010 Source: World Bank Welfare Economics
Share of Countries over 1/3 Urbanized, by GDP per Capita (2012 $) 1960 and 2010 Share Urbanized 0.2.4.6.8 1 $0-1000 $1000-2000 $2000-3000 $3000-4000 $4000-5000 1960 2010 Source: World Bank Welfare Economics
Cambridge International Examinations Cambridge International Advanced Subsidiary and Advanced Level
 Cambridge International Examinations Cambridge International Advanced Subsidiary and Advanced Level *4898249870-I* GEOGRAPHY 9696/31 Paper 3 Advanced Human Options October/November 2015 INSERT 1 hour 30
92 El Salvador El Salvador El Salvador El Salvador El Salvador Nicaragua Nicaragua Nicaragua 1
 Appendix A: CCODE Country Year 20 Canada 1958 20 Canada 1964 20 Canada 1970 20 Canada 1982 20 Canada 1991 20 Canada 1998 31 Bahamas 1958 31 Bahamas 1964 31 Bahamas 1970 31 Bahamas 1982 31 Bahamas 1991
FREEDOM OF THE PRESS 2008
 FREEDOM OF THE PRESS 2008 Table of Global Press Freedom Rankings 1 Finland 9 Free Iceland 9 Free 3 Denmark 10 Free Norway 10 Free 5 Belgium 11 Free Sweden 11 Free 7 Luxembourg 12 Free 8 Andorra 13 Free
REINVENTION WITH INTEGRITY
 REINVENTION WITH INTEGRITY Using the UN Convention against Corruption as a Basis for Good Governance Regional Forum on Reinventing Government in Asia Jakarta, Indonesia November, 2007 The Integrity Irony
WORLDWIDE DISTRIBUTION OF PRIVATE FINANCIAL ASSETS
 WORLDWIDE DISTRIBUTION OF PRIVATE FINANCIAL ASSETS Munich, November 2018 Copyright Allianz 11/19/2018 1 MORE DYNAMIC POST FINANCIAL CRISIS Changes in the global wealth middle classes in millions 1,250
Table of country-specific HIV/AIDS estimates and data, end 2001
 Report on the global HIV/AIDS epidemic 2002 Table of country-specific HIV/AIDS estimates and data, end 2001 Global surveillance of HIV/AIDS and sexually transmitted infections (STIs) is a joint effort
GLOBAL PRESS FREEDOM RANKINGS
 GLOBAL PRESS FREEDOM RANKINGS 1 Finland 10 Free 2 Norway 11 Free Sweden 11 Free 4 Belgium 12 Free Iceland 12 Free Luxembourg 12 Free 7 Andorra 13 Free Denmark 13 Free Switzerland 13 Free 10 Liechtenstein
CENTRAL AMERICA AND THE CARIBBEAN
 CENTRAL AMERICA AND THE CARIBBEAN Antigua and Barbuda No Visa needed Visa needed Visa needed No Visa needed Bahamas No Visa needed Visa needed Visa needed No Visa needed Barbados No Visa needed Visa needed
Global Social Progress Index
 Global Social Progress Index How do we advance society? Economic Development Social Progress www.socialprogressindex.com The Social Progress Imperative defines social progress as: the capacity of a society
2017 BWC Implementation Support Unit staff costs
 2017 BWC Implementation Support Unit staff costs Estimated cost : $779,024.99 Umoja Internal Order No: 11602585 Percentage of UN Prorated % of Assessed A. States Parties 1 Afghanistan 0.006 0.006 47.04
Japan s s Strategy for Regional Trade Agreements
 Japan s s Strategy for Regional Trade Agreements JEF-AIM Symposium February, 4, 2005, Manila Yasuo Tanabe Vice President, RIETI (This Paper is based on METI, but rearranged by the author. It is the author
World Heritage UNITED NATIONS EDUCATIONAL, SCIENTIFIC AND CULTURAL ORGANIZATION
 World Heritage Distribution limited 4 GA WHC-03/4.GA/INF.9A Paris, 4 August 2003 Original : English/French UNITED NATIONS EDUCATIONAL, SCIENTIFIC AND CULTURAL ORGANIZATION FOURTEENTH GENERAL ASSEMBLY OF
Country pairings for the first review cycle of the Mechanism for the Review of Implementation of the United Nations Convention against Corruption
 Country pairings for the first review cycle of the Mechanism for the Review of Implementation of the United Nations Convention against Corruption In the first year, a total of 27 reviews will be conducted.
CAC/COSP/IRG/2018/CRP.9
 29 August 2018 English only Implementation Review Group First resumed ninth session Vienna, 3 5 September 2018 Item 2 of the provisional agenda Review of the implementation of the United Nations Convention
Rule of Law Index 2019 Insights
 World Justice Project Rule of Law Index 2019 Insights Highlights and data trends from the WJP Rule of Law Index 2019 Trinidad & Tobago Tunisia Turkey Uganda Ukraine United Arab Emirates United Kingdom
GENTING DREAM IMMIGRATION & VISA REQUIREMENTS FOR THAILAND, MYANMAR & INDONESIA
 GENTING DREAM IMMIGRATION & VISA REQUIREMENTS FOR THAILAND, MYANMAR & INDONESIA Thailand Visa on Arrival (VOA) Nationals of the following 18 countries may apply for a Thailand VOA. The applicable handling
The National Police Immigration Service (NPIS) forcibly returned 375 persons in March 2018, and 136 of these were convicted offenders.
 forcibly returned 375 persons in March 2018, and 136 of these were convicted offenders.") Statistics March 2018: Forced returns from Norway The National Police Immigration Service (NPIS) forcibly returned 375 persons in March 2018, and 136 of these were convicted offenders. The NPIS is responsible
Statistics March 2018: Forced returns from Norway The National Police Immigration Service (NPIS) forcibly returned 375 persons in March 2018, and 136 of these were convicted offenders. The NPIS is responsible
Cotton: World Markets and Trade
 United States Department of Agriculture Foreign Agricultural Service Circular Series FOP - November Cotton: World Markets and Trade Peru Cotton Production, Consumption and Imports Lb. Bales Production
Information note by the Secretariat [V O T E D] Additional co-sponsors of draft resolutions/decisions
![Information note by the Secretariat [V O T E D] Additional co-sponsors of draft resolutions/decisions](/thumbs/74/69643620.jpg "Information note by the Secretariat [V O T E D] Additional co-sponsors of draft resolutions/decisions") Information note by the Secretariat Additional co-sponsors of draft resolutions/decisions Draft resolution or decision L. 2 [102] The risk of nuclear proliferation in the Middle East (Egypt) L.6/Rev.1
Information note by the Secretariat Additional co-sponsors of draft resolutions/decisions Draft resolution or decision L. 2 [102] The risk of nuclear proliferation in the Middle East (Egypt) L.6/Rev.1
UNITED NATIONS FINANCIAL PRESENTATION. UN Cash Position. 18 May 2007 (brought forward) Alicia Barcena Under Secretary-General for Management
 Alicia Barcena Under Secretary-General for Management") UNITED NATIONS FINANCIAL PRESENTATION UN Cash Position 18 May 2007 (brought forward) Alicia Barcena Under Secretary-General for Management Key Components as at 31 December (Actual) (US$ millions) 2005
UNITED NATIONS FINANCIAL PRESENTATION UN Cash Position 18 May 2007 (brought forward) Alicia Barcena Under Secretary-General for Management Key Components as at 31 December (Actual) (US$ millions) 2005
APPENDIX 1: MEASURES OF CAPITALISM AND POLITICAL FREEDOM
 1 APPENDIX 1: MEASURES OF CAPITALISM AND POLITICAL FREEDOM All indicators shown below were transformed into series with a zero mean and a standard deviation of one before they were combined. The summary
RCP membership worldwide
 RCP membership worldwide Non-member Member of one RCP Member of two RCPs Member of three or more RCPs Inter-Governmental Consultations on Asylum, Refugees and Migration Policies (IGC) 16 States Established
India, Bangladesh, Bhutan, Nepal and Sri Lanka: Korea (for vaccine product only):
:") Asia Pacific Local Safety Office Australia & New Zealand: LSO_aust@its.jnj.com China: XJPADEDESK@ITS.JNJ.COM Hong Kong & Machu: drugsafetyhk@its.jnj.com India, Bangladesh, Bhutan, Nepal and Sri Lanka:
Asia Pacific Local Safety Office Australia & New Zealand: LSO_aust@its.jnj.com China: XJPADEDESK@ITS.JNJ.COM Hong Kong & Machu: drugsafetyhk@its.jnj.com India, Bangladesh, Bhutan, Nepal and Sri Lanka:
Tourism Highlights International Tourist Arrivals, Average Length of Stay, Hotels Occupancy & Tourism Receipts Years
 KINGDOM OF CAMBODIAA NATION RELIGION KING 3 TOURISM STATISTICS REPORT Oct tober 2013 MINISTRY OF TOURISM Statisticss and Tourism Information Department No. A3, Street 169, Sangkat Veal Vong, Khann 7 Makara,
PQLI Dataset Codebook
 PQLI Dataset Codebook Version 1.0, February 2006 Erlend Garåsen Department of Sociology and Political Science Norwegian University of Science and Technology Table of Contents 1. Introduction...3 1.1 Files...3
Asia Pacific (19) EMEA (89) Americas (31) Nov
 EMEA (89) Americas (31) Nov") Americas (31) Argentina Bahamas Barbados Belize Bermuda Bolivia Brazil Cayman Islands Chile Colombia Costa Rica Curaçao Dominican Republic Ecuador El Salvador Guatemala Honduras Jamaica Nicaragua Panama
Americas (31) Argentina Bahamas Barbados Belize Bermuda Bolivia Brazil Cayman Islands Chile Colombia Costa Rica Curaçao Dominican Republic Ecuador El Salvador Guatemala Honduras Jamaica Nicaragua Panama
Mapping physical therapy research
 Mapping physical therapy research Supplement Johan Larsson Skåne University Hospital, Revingevägen 2, 247 31 Södra Sandby, Sweden January 26, 2017 Contents 1 Additional maps of Europe, North and South
The World s Most Generous Countries
 The World s Most Generous Countries Copyright Standards This document contains proprietary research, copyrighted and trademarked materials of Gallup, Inc. Accordingly, international and domestic laws and
Statistical Appendix 2 for Chapter 2 of World Happiness Report March 1, 2018
 Statistical Appendix 2 for Chapter 2 of World Happiness Report 2018 March 1, 2018 1 Table 1: Average ladder and number of observations by domestic or foreign born in 2005-17 surveys - Part 1 Domestic born:
SUGAR YEAR BOOK INTERNATIONAL SUGAR ORGANIZATION 1 CANADA SQUARE, CANARY WHARF, LONDON, E14 5AA.
 SUGAR YEAR BOOK 2007 INTERNATIONAL SUGAR ORGANIZATION 1 CANADA SQUARE, CANARY WHARF, LONDON, E14 5AA www.isosugar.org The International Sugar Organization (ISO) presents the 60 th issue of the Sugar Year
Personnel. Staffing of the Agency's Secretariat
 International Atomic Energy Agency Board of Governors General Conference GOV/2005/54-GC(49)/4 Date: 9 August 2005 General Distribution Original: English For official use only Item 7(b)(i) of the Board's
QGIS.org - Donations and Sponsorship Analysis 2016
 QGIS.org - Donations and Sponsorship Analysis 2016 QGIS.ORG received 1128 donations and 47 sponsorships. This equals to >3 donations every day and almost one new or renewed sponsorship every week. The
VISA POLICY OF THE REPUBLIC OF KAZAKHSTAN
 VISA POLICY OF THE REPUBLIC OF KAZAKHSTAN Country Diplomatic Service National Term of visafree stay CIS countries 1 Azerbaijan visa-free visa-free visa-free 30 days 2 Kyrgyzstan visa-free visa-free visa-free
Partnering to Accelerate Social Progress Presentation to Swedish Sustainability Forum Umea, 14 June 2017
 Partnering to Accelerate Social Progress Presentation to Swedish Sustainability Forum Umea, 14 June 2017 Social Progress Index Framework Why SPI? GDP provides an incomplete picture of human and societal
Geoterm and Symbol Definition Sentence. consumption. developed country. developing country. gross domestic product (GDP) per capita
 per capita") G E O T E R M S Read Sections 1 and 2. Then create an illustrated dictionary of the Geoterms by completing these tasks: Create a symbol or an illustration to represent each term. Write a definition of
G E O T E R M S Read Sections 1 and 2. Then create an illustrated dictionary of the Geoterms by completing these tasks: Create a symbol or an illustration to represent each term. Write a definition of
KYOTO PROTOCOL STATUS OF RATIFICATION
 KYOTO PROTOCOL STATUS OF RATIFICATION Notes: R = Ratification At = Acceptance Ap = Approval Ac = Accession 1. ALBANIA ----- 01/04/05 (Ac) 30/06/05 2. ALGERIA ---- 16/02/05 (Ac) 17/05/05 3. ANTIGUA AND
A Global View of Entrepreneurship Global Entrepreneurship Monitor 2012
 A Global View of Entrepreneurship Global Entrepreneurship Monitor 2012 Donna Kelley, Babson College REITI Workshop Tokyo Japan January 21, 2001 In 2012, its 14 th year, GEM surveyed 198,000 adults in 69
Status of National Reports received for the United Nations Conference on Housing and Sustainable Urban Development (Habitat III)
") 1 Afghanistan In progress Established 2 Albania 3 Algeria In progress 4 Andorra 5 Angola Draft received Established 6 Antigua and Barbuda 7 Argentina In progress 8 Armenia Draft in progress Established
1 Afghanistan In progress Established 2 Albania 3 Algeria In progress 4 Andorra 5 Angola Draft received Established 6 Antigua and Barbuda 7 Argentina In progress 8 Armenia Draft in progress Established
TD/B/Inf.222. United Nations Conference on Trade and Development. Membership of UNCTAD and membership of the Trade and Development Board
 United Nations United Nations Conference on Trade and Development Distr.: General 9 August 2011 Original: English TD/B/Inf.222 Trade and Development Board Membership of UNCTAD and membership of the Trade
Global Access Numbers. Global Access Numbers
 Global Access Numbers Below is a list of Global Access Numbers, in order by country. If a Country has an AT&T Direct Number, the audio conference requires two-stage dialing. First, dial the AT&T Direct