GRTC Transit System 2016 Program Update. Revised: February 13, 2017
|
|
|
- Colin Harrison
- 5 years ago
- Views:
Transcription

1 GRTC Transit System 2016 Program Update Revised: February 13,
2 GRTC Transit System 2016 Program Update Page Intentionally Left Blank 2
3 GRTC Transit System 2016 Program Update Table of Contents Introduction GRTC s Commitment to Title VI 4 GRTC s Notice to Beneficiaries of Title VI 6 Title VI-related Complaint Procedures 7 List of Active Title VI-related Investigations, Complaints, and Lawsuits 8 Non-elected Committees and Councils 8 Major Fare and Service Changes 9 Demographic Data Collection and Analysis 10 Service Standards and Policies 13 Public Participation Plan 14 Language Assistance Plan (LAP) 15 Service and Fare Equity 22 Subrecipient Management under Title VI Contact Information and Board Approval Appendices Appendix A: Title VI Authorities 29 Appendix B: Title VI Notice (English/Spanish Poster) 30 Appendix C: Title VI Complaint Form 31 Appendix D: GRTC Public Comment Procedures 33 Appendix E: Demographic Charts by Block Group for GRTC Local Service Area 36 Appendix F: Level and Quality Service Assessment 48 Appendix G: Survey Report for Public Comments for Proposed Policy Changes 116 Appendix H: Fare Equity Analysis: Chesterfield Express Routes 131 Appendix I: Service Equity Analysis: Chesterfield Express Routes 145 Appendix J: Fare Equity Analysis: New Fare Media 157 Appendix K: Board Approval Documents 163 3
4 GRTC Transit System 2016 Program Update Introduction GRTC s Commitment to Title VI What is Title VI? Title VI of the Civil Rights Act of 1964 states that no person in the United States shall, on the ground of race, color, or national origin, be excluded from participation in, be denied the benefits of, or be subjected to discrimination under any program or activity receiving Federal financial assistance (42 U.S.C. Section 2000d). Recipients of public transportation funding from the Federal Transit Administration (FTA), inclusive of GRTC, are required to develop policies, programs, and practices that ensure that federal and state transit dollars are used in a manner that is nondiscriminatory. This document details how GRTC Transit System incorporates nondiscrimination policies and practices in providing services to the public. GRTC s Title VI Policy Statement GRTC Transit System is committed to ensuring that no person shall, on the grounds of race, color, national origin, as provided by Title VI of the Civil Rights Act of 1964 and the Civil Rights Restoration Act of 1987 (PL ), be excluded from participation in, be denied the benefits of, or be otherwise subjected to discrimination under any program or activity, whether those programs and activities are federally funded or not. Organization and Title VI Program Responsibilities GRTC s Title VI Officer is responsible for ensuring implementation of the agency s Title VI Program. He or she is responsible for supervising the staff assigned with Title VI responsibilities in implementing, monitoring, and reporting on GRTC s compliance with Title VI regulations, including: Identifying, investigating, and eliminating discrimination when found to exist; Processing Title VI complaints in accordance with the agency s Nondiscrimination Complaint Procedures; Meeting with staff periodically to monitor and discuss progress, implementation, and compliance issues; and Periodically reviewing and updating the agency s Title VI Program to assess if administrative procedures are effective, staffing is appropriate, and adequate resources are available to ensure compliance. Annual Nondiscrimination Assurance to the FTA As part of the Certifications and Assurances submitted to the FTA, GRTC submits a Nondiscrimination Assurance which addresses compliance with Title VI as well as nondiscrimination in hiring (BEO) and contracting (DBE), and nondiscrimination on the basis of disability (ADA). In signing and submitting this assurance, GRTC confirms to the FTA the agency s commitment to nondiscrimination and compliance with federal and state requirements. 4
5 GRTC Transit System 2016 Program Update Program Requirements All large public transit agencies that are recipients of FTA funds (of which GRTC is included) must comply with Title VI requirements as outlined by the Federal Transit Administration in Circular 4702.B. They are detailed on the following pages. General Record-Keeping and Notifications Providing notice to the public and any beneficiaries of the service of their rights under Title VI; Developing Title VI-related complaint procedures and forms; Maintaining a log of all Title VI-related complaints, investigations, and lawsuits; Developing and maintaining a record of the membership of the system s non-elected committees and councils, and how the system encourages the participation of minorities on such committees; Maintaining a log of all major service and fare changes; and Obtaining Board approval of all Title VI-related procedures. Data Collection and Analysis Collecting and maintaining demographic information about ridership, including demographic and service profile maps and charts; and Collecting demographic ridership and travel patterns through surveys. Policy & Program Development Developing service standards and policies; Developing a public engagement processes for setting the major service change policy; Developing a Public Participation Plan; Developing a Language Assistance Plan; Evaluating Service and Fare Equity; and Developing a plan for managing subrecipients. 5
6 GRTC Transit System 2016 Program Update GRTC s Notice to Beneficiaries of Title VI GRTC Transit System provides the following Title VI notice to its customers in English and Spanish: NOTICE TO BENEFICIARIES OF PROTECTION UNDER TITLE VI This notice is provided in compliance with 49 CFR Section 21.9 (d). Non-Discrimination Notice GRTC Transit System provides services and operates programs without regard to race, color, or national origin in compliance with Title VI. Request for Information To request additional information about GRTC Transit System's non-discrimination obligations, send your written request to: Title VI Officer, GRTC Transit System Headquarters, 301 East Belt Boulevard, Richmond, Virginia Complaint Process As a member of the general public if you desire to file a discrimination complaint under Title VI, the following procedure should be followed: Any person who believes he or she has been subjected to unlawful discrimination may directly file a complaint or use an authorized representative. A complaint form is available from the Title VI Officer or from the GRTC website, The form must be filled out completely with as many details as possible and sent to: Title VI Officer GRTC Transit System Headquarters 301 East Belt Boulevard Richmond, Virginia Figure 1 This notice is found on GRTC s website ( at GRTC s headquarters, and displayed on all transit buses. 6
7 GRTC Transit System 2016 Program Update Title VI-related Complaint Procedures Any individual may exercise his or her right to file a complaint with GRTC if that person believes that they (or any other program beneficiaries) have been subjected to unequal treatment or discrimination in the receipt of transit service. GRTC will make a concerted effort to resolve complaints using the agency s Nondiscrimination Complaint Procedures, as described below. All Title VI complaints and their resolution will be logged as described and reported with all program updates. Should any Title VI investigations be initiated by FTA, or any Title VI lawsuits be filed against GRTC, the agency will follow these procedures: Who takes discrimination complaints? Customer Service and/or Executive Office staff may take in discrimination complaints. Other departments, (e.g. Transportation, Planning & Scheduling) and switchboard operators should direct/transfer calls to customer service for proper log-in. How are discrimination complaints processed? Once Customer Service receivesthe discrimination complaint, the complaint is logged in a database under the category, Discrimination/Title VI. The Customer Service Manager will forward all discrimination complaints to the Title VI Officer for review. If Executive Office staff receives the discrimination complaint, the complaint is forwarded to the Customer Service Manager. Customer Service will then log the complaint and notify the Title VI Officer of such action. GRTC will notify the alleging party within three days of the complaint s receipt. This notification initiates the review period. How are discrimination complaints handled? Case investigation and documentation: The Title VI Officer will conduct a prompt investigation of each discrimination complaint filed and will develop a complete case record. A complete case record consists of the name and address of all parties interview/consulted and a summary of their statements, copies of summaries of pertinent documents, and a narrative summary of all evidence disclosed in the complaint investigation. It also includes the completed Title VI complaint form. A written report is to be prepared at the conclusion of the investigation and this shall include: summary of the complaint, description of the investigation, findings, and recommendations. Disposition approval and notice: The Title VI Officer will present recommendations to GRTC s Chief Operating Officer (COO) for approval of the disposition. If the complaint is determined to be valid, the recommendation will include proposed actions to address the situation. A resolution with no actions will be recommended if the complaint is found not valid or there is insufficient evidence to support the complaint. The Title VI Officer will notify the alleging party about the resolution/disposition of the complaint within 30 days of its receipt by the Title VI officer. Proper log of the resolution to the complaint will be kept on file. Appeals: The alleging party may submit an appeal within 30 days from the date the notice of disposition is issued. Appeals will be reviewed within 30 days. The appeal will be heard by the Chief Executive Officer (CEO). If the alleging party so chooses, they may at any time pursue a complaint through the Federal Transit Administration (FTA). 7
8 GRTC Transit System 2016 Program Update Monitoring: The Title VI Officer, Director of Planning & Scheduling, Director of Communications, and Customer Service Manager will conduct a quarterly review of all Title VI complaints reviewed by GRTC. Corrective actions taken at the time of each resolution will be reviewed in these quarterly sessions. The Title VI Officer may waive the requirement of a quarterly meeting if no complaint or corrective action has been taken in the closing quarter. See Appendix B (page 30) for a copy of GRTC s Title VI Complaint Form. List of Active Title VI-related Investigations, Complaints, and Lawsuits Date of Complaint Internal/External Summary (Basis) Issue Status Disposition August 10, 2016 External Race In review TBD June 28, 2016 External Race, Income In review TBD Table 1 Non-elected Committees and Councils GRTC has two directly appointed committees made up of citizens that have an interest in learning about GRTC activities and providing recommendations. The CARE Advisory Committee (CAC) is a group that meets to discuss paratransit needs and services. The Transit Advisory Group (TAG) meets about fixed-route needs and service. Both groups meet quarterly and are selected by GRTC staff through an application process. Terms are one to two years in length. GRTC is led by a Board of Directors consisting of six members. Three are appointed by the City of Richmond, Virginia and three are appointed by Chesterfield County, Virginia. Both jurisdictions share ownership of the transit system. GRTC itself does not select any members of the Board of Directors. Committee Transportation Advisory Group (TAG) Citizen s Advisory Committee (CAC) GRTC Board of Directors African - American American Indian/Alaska Native Asian Hawaiian/ Pacific Islander Hispanic of any race White No Response Total Members # % 25% 0% 0% 0% 0% 75% 12.50% 100% # % 40% 0% 0% 0% 0% 20% 40% 100% # % 33% 0% 0% 0% 0% 33% 33% 100% Table 2 8
9 GRTC Transit System 2016 Program Update Major Fare and Service Changes List of Fare Changes in the last 3 years (Fiscal Year Fiscal Year 2016): Date of Change Service Fare Before Change ($) Fare after Change ($) July, 2014 July, 2014 July, 2014 November, 2015 November, 2015 November, 2015 November, 2015 Route 81x, Chesterfield Express Route 82x, Chesterfield Express Those with CARE ID (paratransit) may ride Fixed Route for free Local Fixed Route Local Fixed-Route (Reduced Fare) Henrico and City Express Routes Petersburg Express Route $3.50 $6.00 $4.00 $6.00 $0.75 or $1.50 $0.00 Introduction of One-Day, Seven-Day and 30-Day Passes Introduction of One-Day, Seven-Day, and 30-Day Passes Introduction of One-Day, Seven-Day, and 30-Day Passes Introduction of One-Day, Seven-Day, and 30-Day Passes List of Major Service Changes in the Last 3 Years (Fiscal Year Fiscal Year 2016): Date of Change Service Type of Change February, 2015 February, 2015 Table 3 Route 81x, Chesterfield Express Route 82x, Chesterfield Express Table 4 $3.50, $17.50, and $60.00 $1.75, $8.25, and $35.00 $4.50, $22.50, and $80.00 $7.00, $35.00, and $ Reduction in service: five to three one-way trips per day Reduction in service: eight to six one-way trips per day 9

10 GRTC Transit System 2016 Program Update Demographic Data Collection and Analysis GRTC is required by FTA to develop demographic and service profile maps and charts as part of the Title VI update, because GRTC Transit System operates more than 50 fixed route vehicles in the peak service time and is located in a Metropolitan Statistical Area of more than 200,000 people. This data is used to gain a better understanding of GRTC s service area population and ridership base, and set a background context to evaluate service. GRTC s Service Area GRTC operates 35 local bus routes and 9 express bus routes. Local routes provide service at the neighborhood level, and exist on a loosely arranged hub-and-spoke model, with most local routes servicing the downtown core for destinations and transfers. Express routes mainly serve to bring commuters to Richmond s downtown business district or other job centers. In order to define GRTC s local service area, US Census block groups containing local fixed routes were used to approximate the ridership base. Census block groups were used because they are a more detailed dataset, which allows analysis on a more representative sample of the population living near the local transit routes. Express routes were not included in the local service area because of the more diffused location of the ridership base as well as the nature of express service which serves to offer commuting choices rather than provide a comprehensive transit service. Local Service Area Geography and Demographics GRTC s local service area includes most of the City of Richmond, significant parts of Henrico County, and limited areas of Chesterfield County. The level of transit service offered within this area varies, and is based on factors including population and/or job density, ridership levels, historical service areas, popular destinations, and funding availability. For the purposes of Title VI, GRTC analyzed US Census data for the population of the local transit service area. Data was gathered for minority status, low income status, and language proficiency status. 10 Figure 2
 American Indian and Alaska Native, which refers to people having origins in any of the original peoples of")
11 GRTC Transit System 2016 Program Update GRTC s Minority population by block group is shown below. Minority persons are defined by FTA as people who identify as any of the following: (1) American Indian and Alaska Native, which refers to people having origins in any of the original peoples of North and South America (including Central America), and who maintain tribal affiliation or community attachment. (2) Asian, which refers to people having origins in any of the original peoples of the Far East, Southeast Asia, or the Indian subcontinent, including, for example, Cambodia, China, India, Japan, Korea, Malaysia, Pakistan, the Philippine Islands, Thailand, and Vietnam. (3) Black or African American, which refers to people having origins in any of the Black racial groups of Africa. (4) Hispanic or Latino, which includes persons of Cuban, Mexican, Puerto Rican, South or Central American, or other Spanish culture or origin, regardless of race. (5) Native Hawaiian or Other Pacific Islander, which refers to people having origins in any of the original peoples of Hawaii, Guam, Samoa, or other Pacific Islands. Figure 3 11
 poverty guidelines.")

12 GRTC Transit System 2016 Program Update Low-Income persons are defined as individuals whose median household income is at or below 150% of the U.S. Department of Health and Human Services (HHS) poverty guidelines. Figure 4 Limited-English-Proficiency persons are those ver age five who report speaking English less than very well according to the American Community Survey, but identify with speaking another language very well. Figure 5 12
13 GRTC Transit System 2016 Program Update Charts showing the following details can be found in the Appendix. Minority population (as a percent of total population) by Block Group Limited English Proficiency (LEP) population (as a percent of total population over age 5) by Block Group Low Income population (as a percent of total population) by Block Group Demographic Ridership and Travel Patterns GRTC conducts a large-scale ridership survey at least every three years. The latest was completed in The purpose of the survey is to measure origins and destinations of riders as well as to collect opinions on GRTC s quality of service from riders. GRTC staff compile the survey data into a Level and Quality of Service Compliance Assessment (which is included in the appendix of this document). Service Standards and Policies GRTC monitors its level and quality of service on an ongoing basis in order to ensure equity in access to public transit services. Level of service refers to the amount of transit offered, and can be measured in a variety of ways. GRTC uses the following five indicators, which The Federal Transit Administration (FTA) considers to be significant measures of level of service: Vehicle load - the ratio of passengers to the total number of seats on a vehicle (how full the bus is); Vehicle assignment - the process by which transit vehicles are placed into service in depots and on routes throughout the transit provider s system (which bus goes where); Vehicle headways - the amount of time between two vehicles traveling in the same direction on a given line or combination of lines. A shorter headway corresponds to more frequent service; Distribution of transit amenities - items of comfort, convenience, and safety that are available to the general riding public (benches, shelters, trash cans, etc); and Service access/availability - a general measure of the distribution of routes within a transit provider s service area. GRTC also monitors quality of service through a large-scale customer satisfaction and origins/destinations survey at least every three years. The indicators used include: Bus/Stop Cleanliness Bus Temperature On-time adherence Schedule Driver Friendliness/Helpfulness Customer Service (phone/web) Notices Cost of fares GRTC completes a Level and Quality of Service Compliance Assessment based on this data every three years as required by FTA. The assessment measures for service equity on minority and non-minority routes (minority areas defined as areas with higher than median minority populations for the service area) to ensure compliance with Title VI. This assessment was last updated through FY15 and is located in Appendix F (page 48). 13
14 GRTC Transit System 2016 Program Update In the analysis, GRTC found that it was not meeting its set standard overall for weekday peak headways, weekday service span, and on-time performance. According to GRTC s standard, weekday peak headways on each route are supposed to be 30 minutes max, but they actually average around minutes and there is not much variation between peak and off peak service except for a few routes. Staff found potential disparities in terms of Title VI for the headways in that Minority and Low-Income Routes were more likely to have longer weekday off-peak headways, and Limited-English-Proficiency Routes were more likely to have longer weekday peak headways than other routes. For service span, GRTC s standard states that routes should have 18 hours of span, but on average routes had a little less than 17 hours. There were no issues in terms of Title VI. Regarding on-time performance, GRTC s standard states that local routes should meet an 80% on-time rate, but routes are actually averaging around 70%. There were no issues in terms of Title VI. Additionally, staff found one small area (about two blocks) where the transit access/distance to nearest route is higher than the set standard for the area based on the population density/personal vehicle access rates. This is due to geography and narrow streets. Staff has determined that altering routes in order to serve this area would be a great inconvenience to the existing ridership base, as re-routing the existing routes would cause the route to miss high ridership stops. In order to address the concerns regarding the headways, GRTC staff reviewed what caused the discrepancies. Potential reasons for the discrepancy include the fact that although the local routes have different purposes (i.e. core arterial vs. neighborhood circulator) they all have the same headway standards. They also have different ridership patterns (i.e. some routes have a heavier peak demand and less non-peak demand) and the headways have been tailored to the demand over the years. Another reason is that many routes are twinned to each other and share routing over more dense areas as they approach downtown, which effectively halves the headway, providing more frequent service than can be shown at the route level in areas with the highest ridership demand. Additionally, the standards themselves have not been reviewed in at least ten years, so staff will review the standards as part of the upcoming Transit Development Plan update in 2017 to ensure they are relevant. Public Participation Plan GRTC has created a Public Comment Process to ensure that no one is excluded from participating in GRTC s service planning and development process. It is included in the appendix. GRTC s Public Comment Process applies when: A fare change of any type is proposed; A major service change of any type is proposed; and Major Planning Programs (capital projects) are proposed, to include public meetings and public comment periods. For minor schedule and service changes not rising to the level of a major service change, GRTC will post service change notices online, and on appropriate buses and park-and-ride lots in advance of the change date. Proposed changes to bus stops or amenities in the City of Richmond follow the Process for Changes to Bus Stops and Amenities. Outreach to Limited English Proficiency populations will be done according to the Language Assistance Plan. 14
15 GRTC Transit System 2016 Program Update Language Assistance Plan (LAP) A Language Assistance Plan is included in the Title VI Program update to satisfy Executive Order 13166, Improving Access to Services for Persons with Limited English Proficiency, the intent of which is to ensure that persons with limited English proficiency (LEP) are accorded equal treatment by agencies receiving federal funding. The order and subsequent guidance has enabled GRTC to put together this plan, which helps identify the existence of any limited English proficient populations and the size of any such population, determine what methods may be used to assist that population and then assign resources for the tasks involved. GRTC has conducted a Four-Factor Analysis using US Census and American Community Survey data to discover the presence of LEP populations in the local service area. From this analysis GRTC developed the Language Assistance Plan (LAP), which acts as a guideline for including the LEP population when interacting with our customer base. The LAP has specific steps and activities that we can implement to engage the LEP population and make them aware of language assistance available to them. This plan is updated at least every three years with the Title VI Program Update. Four Factor Analysis The FTA recommends a Four Factor Analysis before completing an LAP, considering: 1. The number and proportion of LEP persons eligible in the GRTC service area who may be served or likely to encounter a GRTC program, activity, or service; 2. The frequency with which LEP persons come into contact with GRTC services and programs; 3. The nature and importance of GRTC s services and programs in people s lives; and 4. The resources available to GRTC for LEP outreach, as well as the costs associated with that outreach. GRTC completed the Four Factor Analysis, shown below, as part of the LAP. 1. Consider the number and proportion of LEP persons eligible in the GRTC service area who may be served or likely to encounter a GRTC program, activity, or service. Overall, the greater Richmond area is a diverse urban area with many different languages present. The table below shows the languages spoken in the GRTC local service area demographics using data from the 2014 American Community Survey Five-Year estimates. Overall, about 5.8% of the local service area population over age five is considered to have Limited English Proficiency. Language Total Speakers LEP Speakers* % of Total Population LEP Total Population 5 and older 399,755 23, % English Only 351, % Spanish 24,031 13, % French 1, % French Creole % Italian % Portuguese % German % Yiddish % 15
16 Language Total Speakers LEP Speakers* GRTC Transit System 2016 Program Update % of Total Population LEP West Germanic Languages % Scandinavian Languages % Greek % Russian % Polish % Serbo-Croatian % Other Slavic Languages % Armenian % Persian % Gujarati % Hindi % Urdu % Other Indic languages 1, % Other Indo-European Languages % Chinese 1, % Japanese % Korean 1, % Mon-Khmer/Cambodian % Hmong % Thai % Laotian % Vietnamese 2,056 1, % Other Asian Languages 1, % Tagalog % Other Pacific Island Languages % Navajo % Other Native American Languages 5-0.0% Hungarian % Arabic 2,201 1, % Hebrew % African Languages 2, % Other and Unspecified Languages % Table 5 The following map shows the distribution of the LEP population over the local service area, with one orange dot showing one LEP person. There are clear variations in the population distribution, with high densities of LEP populations in Western Henrico County and the southern part of the City of Richmond, and Northern Chesterfield County. 16

17 GRTC Transit System 2016 Program Update Figure 6 The amount of LEP speakers varies greatly by language. The top LEP languages represented are summarized in the table below. There are almost 14,000 LEP Spanish speakers, which makes it the most common LEP language in the local service area. Almost 3.4% of the service area is LEP Spanish speakers. The FTA advocates the use of the Safe Harbor Threshold as a way to decide which languages meet the requirements for written translation of vital documents. The threshold is defined as 1,000 persons or 5% of the service area population, whichever is lower. There are three languages with more than 1,000 LEP speakers in the local service area: Spanish, Vietnamese, and Arabic. Language Total Speakers LEP Speakers* % of Total Population* Spanish 24,031 13, % Vietnamese 2,056 1, % Arabic 2,201 1, % Other Indic languages 1, % Chinese 1, % African Languages 2, % Other Asian Languages 1, % Korean 1, % French 1, % Russian % Table 6 17
18 GRTC Transit System 2016 Program Update The following maps show the distribution of the Safe Harbor LEP languages of Spanish, Vietnamese, and Arabic. Figure 7 Figure 8 18
19 GRTC Transit System 2016 Program Update Figure 9 Since Spanish is the most common LEP language, data on the country of national origin was summarized in order to determine what dialects the majority of the Spanish-speakers may use. The data indicates many LEP Spanish speakers are likely coming from Mexico and Central American countries, including El Salvador, Guatemala, and Honduras. This result is comparative to the qualitative data gathered from the City of Richmond Office of Multicutural Affairs. Country Chesterfield Henrico Richmond Total Total (Estimate): 25,883 37,382 14,795 78,060 India 1,545 7, ,915 Mexico 2,361 2,337 2,069 6,767 El Salvador 3,735 1,247 1,491 6,473 Guatemala 2, ,533 4,465 Vietnam 1,562 2, ,048 China 832 1, ,289 Honduras 397 1,403 1,044 2,844 Korea 1, ,643 United Kingdom (inc. Crown Dependencies): ,184 Philippines ,964 Table 7 2. Consider the frequency with which LEP individuals come in contact with a GRTC program, activity, or service. GRTC does not directly collect onboard data on LEP individuals, so in order to estimate the frequency in which LEP persons come into contact with the bus service we use indirect methods. 19
20 GRTC Transit System 2016 Program Update The result of outreach to community organizations to LEP populations reveals that there is limited feedback from the Hispanic LEP community about the bus service. What feedback there was: o The community may not find the local bus service very useful o The bus does not go where the jobs are (construction jobs mentioned) o In at least one instance it was reported to an organization that two Spanish-speakers were made to feel unwelcome for speaking Spanish by fellow riders who spoke English GRTC s Customer Service department subscribes to a Tele-Language service that enables the representatives to include a translator of the caller s language on the call. This enables our representatives to communicate with speakers of 150 different languages. In the past year, only one call used the Tele-Language service, in Cambodian. Since the Customer Service department receives thousands of calls a year, this could be considered a negligible amount. Combining these indirect methods, it appears that LEP persons use transit less frequently than the service area population as a whole, and there may be significant barriers to use transit including lack of routing to the preferred destinations and negative experiences from fellow riders. 3. Consider the nature and importance of the program, activity, or service provided by GRTC to the LEP community. Since it appears that LEP individuals use GRTC transit service less frequently than the population as a whole, more work needs to be done to determine whether or not the system is meeting the needs of the LEP population. The results of the mapping exercise reveal that there are concentrations of Spanish-speaking LEP customers in the South side of Richmond/Northern Chesterfield County, and in Western Henrico County. Bus service is less concentrated in this area due to lower population density and lack of local transit funding in Chesterfield, and many routes operate Monday-Friday only as compared to the areas closer to downtown Richmond. Feedback was received from an outreach organization that there is a need in Northern Chesterfield County, where GRTC currently does not operate, to connect residents along the Jefferson Davis corridor to John Tyler Community College. 4. Consider the resources available to GRTC and the overall costs. GRTC recognizes the importance of providing language assistance to the growing LEP community. Results of discussion with LEP outreach organizations reveals that radio is the most popular choice of media. Another suggestion was for written information to use simple language and supplement with visualizations. GRTC has budgeted approximately $100,000 for LEP outreach, focusing on radio ads and translating vital information into Spanish. Conclusion from Four-factor analysis It appears that there is a growing LEP population in the GRTC Local Service Area. For the first time, languages other than Spanish meet the Safe Harbor Threshold. GRTC will continue its recent efforts to reach out to Spanish-speaking LEP communities and find out how to make service more useful or welcoming. GRTC will also begin to provide translation for Vietnamese and Arabic LEP communities. 20
21 GRTC Transit System 2016 Program Update Language Assistance Plan (LAP) Develop a Safe Harbor Protocol for Written Documents Responsible: Director of Communications, and Title VI Officer Timeline: Ongoing, Initial list by September 1, 2016 Budget: $1, Duties: 1) Develop a list of Vital Written Documents for translation. Tentative List: ADA Notice, Title VI Notice, Title VI Complaint Form, Title VI Complaint Procedures, Language-specific page on GRTC website, GRTC how-to videos (subtitles), and How-to-Ride Guide 2) Translate all vital written documents into all safe harbor languages and make accessible to the public via the website. Safe Harbor languages identified using 2014 ACS data for the local service area are Spanish, Vietnamese, and Arabic. 3) Continue to provide basic web translation in multiple languages using Google Translate toolbar. Develop LEP Protocol and Training Procedures for GRTC Staff Responsible: Director of Communications, Customer Service Manager, Chief of Transit Operations, Training Manager, and Title VI Officer Timeline: By Mid-2017 and On-going Budget: $ Duties: 1) LEP Protocol for Operations Staff includes developing actions and offering resources for front-line operations staff to provide basic communication to LEP individuals, including but not limited to, training on how to use Tele-Language telephone translation service, I Speak cards, pictograms, or other resources and what to do if there is a communication barrier. 2) LEP Protocol for Customer Service staff includes developing actions and offering resources to provide basic communication to LEP individuals, including but not limited to, training on how to use Tele-Language telephone translation service, identifying common LEP languages and phrases, and speaking simple phrases in LEP languages relating to identifying the language. 3) Develop a request procedure for translation and interpretation for public meetings, with advanced notification. 4) Develop and implement LEP Guidelines for specific projects or activities. Major projects may require more LEP resources, such as translated project sheets or announcements, or advertisements. This should be accounted for in major project outreach budgets. 21
22 GRTC Transit System 2016 Program Update Provide Directed Outreach to Hispanic/Spanish-speaking LEP Population in Service Area Responsible: Marketing Department Timeline: By Mid-2017 and On-going Budget: $101, (Fiscal Year 2017 budget used as a guide) Duties: 1) Provide radio ads on marketing topics on Spanish-language radio stations. 2) Maintain contact with local outreach organizations and partner with these organizations on local outreach events, such as Imagine Festival, Que Pasa Festival, Meet the bus, or similar activities. 3) Provide voice-over Spanish translation of all new How-to-videos. 4) Continue to provide Spanish-language option on GRTC s On-the-go Mobile App. 5) Provide Spanish-directed advertisements as resources allow. Monitoring and Updating the LAP Responsible: Marketing Department, and Title VI Officer Timeline: yearly, ongoing Budget: $ (primarily printing expenditures) 1) Solicit Feedback from LEP communities on interactions with GRTC service. Conduct focus groups prior to the next program update based on federal LEP guidance to help inform next LAP update. 2) Conduct yearly interviews with outreach organizations to determine attitudes, needs, and usefulness of public transit for LEP communities. 3) Meet yearly in Spring with senior managers on progress towards LAP tasks. Table 8 Service and Fare Equity GRTC has created a fare and service equity analysis policy and process to evaluate proposed service and fare changes. The following is the updated process for this program update. The Service and Fare Equity (SAFE) process shall be performed in any and all of the following conditions: Any fare change (increase or reduction) is considered on one or more routes or services (local, express, specialized or other) A major service change (increase or reduction) is considered on one or more routes or services Major Service Change Policy GRTC proposes service changes to meet the needs of the ridership base and match the available operating budget. All major service changes, as defined below, shall undergo a service equity analysis to ensure that these changes do not have disparate impacts on minority populations, or impose a disproportionate on low-income populations, consistent with the intent and requirements of FTA Circular B and Title VI of the Civil Rights Act of Any proposed service change meeting the following thresholds on a single route level in the GRTC system will constitute a major service change: 22
23 Category a. Change in number of trips Level of Change Required to be Classified as a Major Change 25% change in number of scheduled one-way trips on the Weekday, Saturday or Sunday schedule. b. Change in service span 25% change in the number of hours between the beginning and end of the Weekday, Saturday or Sunday schedule, in either direction. c. Redirecting a route Rerouting at least 25% of a route s path onto a different street or road, measured in single-direction route miles. d. Change in total miles serviced by the route 25% change in total miles on a route s path e. Shortlining or Longlining 25% change in number of scheduled one-way trips ending at a route s terminal points. GRTC Transit System 2016 Program Update Examples Decreasing number of trips from 80 daily one-way trips to 50 one-way trips. Changing Weekday span on a route from 20 hours to 15 hours or less. Moving two miles of an eight-mile route to another street or road (even if the new routing is very near the current routing). Extending or shortening a line. On a route originally going from points A to B to C, terminating certain trips at B. On a route originally going from A to B, extending certain trips to travel all the way to point C. f. Eliminating Route(s) Eliminating one or more routes. Discontinuing an existing route (even if replacing this route with nearby service). Table 9 Any proposed service change meeting the following system-level thresholds will also be considered a major change requiring a service equity analysis: Category Level of Change Required to be Classified as a Major Change Examples a. Adding New Route(s) Adding one or more new routes. Creating a new route to reaching a previously unserved area. b. Change total daily revenue hours 25% change in revenue hours over the system on the Weekday, Saturday or Sunday schedule. Table 10 Reduction of 30% of weekday revenue hours due to a budget shortfall. Cumulative Impacts: In certain cases, a single proposal for service changes may not on its own trigger the thresholds for a major service change. However, when combined with other recent changes, it is possible that a significant improvement or degradation in service has in fact occurred. For example, one could remove 10% of a route s one-way trips in March, and 20% more in September. In this case, if both service changes had occurred simultaneously, they would be considered a major service change. The threshold impacts of services changes that go into effect will be recorded to allow staff to identify cumulative service changes over time. The amount of time to consider cumulative changes shall be 18 months or five system service changes whichever is a longer amount of time. If, when combined with a new service change proposal, the cumulative impacts of changes during this period meet or exceed any of the thresholds identified above, the proposed service change shall be considered a major service change requiring a service equity analysis. 23
24 GRTC Transit System 2016 Program Update Exemptions: The following service changes are exempt from this policy. They shall not be considered major service changes, and they shall not be considered in any analysis of cumulative impacts: - Standard seasonal variations in service - Temporary additions of service lasting less than 12 months (i.e. demonstration projects) - Temporary detours due to street closures or construction activities that prevent the permanent route from being serviced and lasting less than 9 months - Temporary additions, deletions, disruptions, or reductions in service resulting from natural or human-caused disasters, and lasting less than 6 months. Disparate Impact Policy Disparate impact refers to a facially neutral policy or practice that disproportionately affects members of a group identified by race, color, or national origin, where the recipient s policy or practice lacks a substantial legitimate justification and where there exists one or more alternatives that would serve the same legitimate objectives but with less disproportionate effect on the basis of race, color, or national origin. (FTA) Title VI of the Civil Rights Act prevents discrimination based on race, color and national origin in federally-funded programs or activities. GRTC will ensure that all service changes will be equitable in terms of Title VI. In order to ensure equity in access to transit service across the service area, major service changes shall not adversely affect minority populations more than non-minority populations, by more than the threshold defined below. Furthermore, service changes that result in increases in service shall not benefit non-minority populations more than minority populations, by more than that same threshold defined below. If the difference in measured effects on minority and non-minority populations is greater than the set threshold, the proposed change would be considered to have a disparate impact on minority populations. The threshold shall be a 20-percentage point difference between: 1. The percentage of impacts borne by minority populations in the proposed service change. 2. The percentage of minority populations in GRTC s service area. If a proposed service change is found to have a disparate impact on minority populations, GRTC will analyze viable alternatives that would meet the objectives of the proposed service change and the goals of the agency. Such alternatives should be designed to avoid, minimize and mitigate any disparate impact on minority populations. If this alternatives analysis yields a modified service change proposal, the modified proposal will be analyzed in a service equity analysis. If no viable alternatives are found that reduce or eliminate the finding of disparate impact, and GRTC has a substantial and legitimate justification for the change, GRTC may implement the initially proposed service change. Disproportionate Burden Disproportionate burden refers to a neutral policy or practice that disproportionately affects low-income populations more than non-low-income populations. A finding of disproportionate burden requires the recipient to evaluate alternatives and mitigate burdens where practicable. (FTA) Per the requirements of FTA Circular B, and understanding the linked nature of civil rights and environmental justice issues, GRTC will also ensure that all service changes will be equitable with respect to low-income populations. In order to ensure equity in access to transit service across the service area, major service changes shall not adversely affect low-income populations more than non-low-income populations, by more than the threshold defined below. 24
25 GRTC Transit System 2016 Program Update Furthermore, service changes that result in increases in service shall not benefit non-low-income populations more than low-income populations, by more than that same threshold defined below. If the difference in measured effects on minority and non-minority populations is greater than the set threshold, the proposed change would be considered to have a disproportionate burden on low-income populations. GRTC shall also describe alternatives available to low-income passengers affected by the service change. The threshold shall be a 20-percentage point difference between: 1. The percentage of impacts borne by low-income populations in the proposed service change. 2. The percentage of low-income populations in GRTC s service area. If a proposed service change is found to have a disproportionate burden on low-income populations, GRTC will analyze viable alternatives that would meet the objectives of the proposed service change and the goals of the agency. Such alternatives should be designed to avoid, minimize and mitigate any disproportionate burden on low-income populations. If this alternatives analysis yields a modified service change proposal, the modified proposal will be analyzed in a service equity analysis. If no viable alternatives are found that reduce or eliminate the finding of disproportionate burden, GRTC may implement the initially proposed service change. Fare Change Policy GRTC proposes fare changes from time to time to meet the needs of the ridership base and match the available operating budget. All fare changes shall undergo a fare equity analysis to ensure that these changes are equitable in the effects they have on GRTC s ridership base, in terms of Title VI. Fare changes include changes to any current fare amount or fare media. Examples include but are not limited to: increases in fares, decreases in fares, introductions in new fares or fare media options, discontinuation of fares or fare media options. Exceptions to this policy shall include: - Special programs allowing all passengers to ride free as a part of air quality mitigation measures (ex. Spare the Air days) - Promotional fare reductions lasting less than six months - Fare reductions used in mitigation of other actions such as construction projects or disruptions in normal operations. Fare Disparate Impact Policy GRTC will ensure that all fare changes will be equitable in terms of Title VI. In order to ensure equity, fare increases, or reductions in fare media options, shall not adversely affect minorities moreso than non-minorities, by more than the threshold amount defined below. To further ensure equity, fare decreases or additions in fare media options shall not benefit non-minorities moreso than minorities, by more than that same threshold amount defined below. If the affected populations differ by a span greater than the set threshold, the proposed change would be considered to have a disparate impact on the minority population. The threshold shall be a 20-percentage point difference between the minority and non-minority populations affected by the fare change compared to the overall service area. 25
26 GRTC Transit System 2016 Program Update Fare Disproportionate Burden Policy GRTC will ensure that all fare changes will be equitable for low-income populations. In order to ensure equity, fare increases, or reductions in fare media options, shall not adversely affect low-income populations moreso than non-lowincome population, by more than the threshold amount defined below. To further ensure equity, fare decreases, or additions in fare media options, shall not benefit non-low-income populations moreso than low-income populations, by more than that same threshold amount defined below. If the affected populations differ by a span greater than the set threshold, the proposed change would be considered to have a disproportionate burden on the low-income population. The threshold shall be a 20-percentage point difference between the low-income and non-low-income populations affected by the fare change compared to the overall service area. GRTC s Process for completing a Service and Fare Equity (SAFE) Analysis: 1. As soon as any change in fare or service is proposed, describe in detail the proposed change. Be detailed in describing what routes, schedules, and service indicators (level and/or quality of service) would be affected. For example, will this be an across-the-board change or only affect certain routes? Also describe the need or impetus for the change. If it is a fare change, proceed to step four. 2. Is this considered a major service change under the policy? Explain. If no, review previous records from the last 18 month or five service changes to check for cumulative impacts. If yes, continue with the analysis. 3. What is the difference between the existing service and proposed service for those impacted by the change: is it an increase or a decrease in service? 4. Analysis of possible adverse effects: a. Determine the affected area. b. Describe the demographic and ridership data being used for the analysis and how it was collected. c. Describe how the data will be used to determine if the proposed change will have an adverse effect (use people-trips methodology, as seen in the Appendix). d. Compare the ridership population that will be affected by the change as compared to the general ridership population using percentages of the affected population and percentages of population for the service area. e. Analyze the data to describe the details and extent of the possible impacts. i. Create maps showing the affected areas and demographic data along with route information ii. Create tables showing impacts of each type of change and the affected and overall ridership population f. Determine whether the proportion of minorities and/or low-income population is affected is significant when compared to the general population set (use thresholds as defined in each policy). If not, finalize the analysis and provide to the Board. If so, steps need to be taken to describe these negative effects and to develop alternative options that mitigate, avoid, or minimize these effects. g. Repeat the analysis for any alternative options. h. Present the findings to the Board of Directors for review and acceptance. The following chart from FTA Circular 3702.B provides guidance in determining which analysis should take place depending on the potential impacts. 26
 is found in Appendix F.")
27 GRTC Transit System 2016 Program Update Figure 10 GRTC s Public Comments Process also needs to be followed for any fare increases or service reductions. A listing of SAFE analyses completed in the last three years (Fiscal Year Fiscal Year 2016) is found in Appendix F. Facility Equity Analysis GRTC will follow the requirements of the equity analysis when a new facility is needed. Subrecipient Management under Title VI GRTC passes through 5310 funds from the FTA to two local organizations through the JARC and New Freedom programs funds are formula funding for the purpose of assisting private, non-profit groups in meeting the transportation needs of older adults and people with disabilities when the transportation service provided is unavailable, insufficient, or inappropriate to meeting these needs. The JARC recipient is HumanKind Ways-to-Work, and the New Freedom recipient is Senior Connections. GRTC currently does not have any subrecipients who provide fixed-route transit service. Subrecipients are required to provide a Title VI Program to GRTC at least every three years, according to the general reporting requirements and guidelines. Contact Information and Board Approval For additional information on GRTC s Title VI Program Update, or its efforts to comply with the Civil Rights Act of 1964 or Executive Order Improving Access to Services for Persons with Limited English Proficiency, please contact: Title VI Officer GRTC Transit System 301 East Belt Blvd Richmond, Virginia Tel: (804)
28 Appendices GRTC Transit System 2016 Program Update A. Title VI Authorities B. Title VI Notice (English/Spanish) C. Title VI Complaint Form D. Public Comment Process E. Demographic Charts for the GRTC Local Service Area Minority Population by Block Group Low-Income Population by Block Group Limited-English-Proficiency Population by Block Group F. Level and Quality of Service Assessments completed Fiscal Year Fiscal Year 2016 G. Board Approval Documents 28
29 Appendix A: Title VI Authorities GRTC Transit System 2016 Program Update Title VI of the 1964 Civil Rights Act provides that no person in the United States shall, on the grounds of race, color, or national origin, be excluded from participation in, be denied the benefits of, or be otherwise subjected to discrimination under any program or activity receiving federal financial assistance (refer to 49 CFR Part 21). The Civil Rights Restoration Act of 1987 broadened the scope of Title VI coverage by expanding the definition of the terms programs or activities to include all programs or activities of Federal Aid recipients, sub-recipients, and contractors, whether such programs and activities are federally assisted or not. Additional authorities and citations include: Title VI of the Civil Rights Act of 1964 (42 U.S.C. Section 2000d); Federal Transit Laws, as amended (49 U.S.C. Chapter 53 et seq.); Uniform Relocation Assistance and Real Property Acquisition Policies Act of 1970, as amended (42.S.C. 4601, et seq.); Department of Justice regulation, 28 CFR part 42, Subpart F, Coordination of Enforcement of Nondiscrimination in Federally-Assisted Programs (December 1, 1976, unless otherwise noted); U.S. DOT regulation, 49 CFR part 21, Nondiscrimination in Federally-Assisted Programs of the Department of Transportation Effectuation of Title VI of the Civil Rights Act of 1964 (June 18, 1970, unless otherwise noted); Joint FTA/Federal Highway Administration (FHWA) regulation, 23 CFR part 771, Environmental Impact and Related Procedures (August 28, 1987); Joint FTA/FHWA regulation, 23 CFR part 450 and 49 CFR part 613, Planning Assistance and Standards, (October 28, 1993, unless otherwise noted); US. DOT Order , U.S. DOT Order on Environmental Justice to Address Environmental Justice in Minority Populations and Low Income Populations, (April 15, 1997); U.S. DOT Policy Guidance Concerning Recipients Responsibilities to Limited English Proficient Persons, (December 14, 2005), and Section 12 of FTA s Master Agreement, FTA MA 13 (October 1, 2006). 29
30 GRTC Transit System 2016 Program Update Appendix B: Title VI Notice (English/Spanish Poster) 30

31 Appendix C: Title VI Complaint Form GRTC Transit System 2016 Program Update 31
32 32 GRTC Transit System 2016 Program Update
33 Appendix D: GRTC Public Comment Procedures GRTC Transit System 2016 Program Update 33
34 34 GRTC Transit System 2016 Program Update

35 35 GRTC Transit System 2016 Program Update

36 GRTC Transit System 2016 Program Update Appendix E: Demographic Charts by Block Group for GRTC Local Service Area 36

37 37 GRTC Transit System 2016 Program Update

38 38 GRTC Transit System 2016 Program Update

39 39 GRTC Transit System 2016 Program Update

40 40 GRTC Transit System 2016 Program Update

41 41 GRTC Transit System 2016 Program Update

42 42 GRTC Transit System 2016 Program Update

43 43 GRTC Transit System 2016 Program Update

44 44 GRTC Transit System 2016 Program Update

45 45 GRTC Transit System 2016 Program Update

46 46 GRTC Transit System 2016 Program Update

47 47 GRTC Transit System 2016 Program Update
48 Appendix F: Level and Quality Service Assessment GRTC Transit System 2016 Program Update 48
49 GRTC Transit System Level and Quality of Service Analysis 1

50 GRTC Transit System Level and Quality of Service Analysis Page Intentionally Left Blank 50
51 Table of Contents GRTC Transit System Level and Quality of Service Analysis Executive Summary...52 Determining Minority, Low-Income, and LEP Routes...7 Service Standards Required to be Monitored by FTA...9 Transit Access/ Availability...9 Headway...13 Vehicle Load...14 Service Span...16 On-time...17 Service Policies Required to be Monitored by FTA...18 Vehicle Assignment...18 Distribution of Transit Amenities...20 Additional Service Standards Monitored by GRTC...22 Bus Stop Spacing...22 Transfer Frequency...24 Quality of Service Survey Results...25 Cleanliness...25 Travel Comfort...26 On-Time...27 Driver Friendliness/Helpfulness...28 Customer Service (Phone, Web)...28 Cost...29 Conclusion...30 Appendices...31 Appendix A...32 Appendix B...36 Appendix C...41 Appendix D...44 Appendix E...46 Appendix F...48 Appendix G...50 Appendix H...53 Appendix I...60 Appendix J...62 Appendix K
52 Executive Summary GRTC Transit System Level and Quality of Service Analysis GRTC Transit System is a public transit provider serving the Richmond region of central Virginia. The agency operates Fixed-Route transit service (both local and express) as well as Demand-response paratransit service. GRTC is partially funded by the Federal Transit Administration (FTA) and is therefore obligated to comply with Title VI of the Civil Rights Act of 1964 and Executive Order of Title VI ensures that no person in the United States shall, on the ground of race, color, or national origin, be excluded from participation in, be denied the benefits of, or be subjected to discrimination under any program or activity receiving Federal financial assistance. Minority Populations and Limited English Proficiency (LEP) populations are protected under this Act. Executive Order of 1994 established the mission of Environmental Justice in federal agencies and protects Low-Income populations. GRTC must ensure equitable service to the above populations as a means to continue to receive Federal funding. GRTC is a transit agency that operates more than 50 fixed-route vehicles in peak service and operates in an urbanized area with more than 200,000 residents. As part of Title VI, FTA requires transit agencies that fit this profile to monitor level and quality of service for civil rights equity at least every three years using FTA guidelines. This analysis document is prepared to fulfill this requirement and analyzes GRTC s Local Route service. The FTA offers guidance on how public transit agencies may monitor service for civil rights equity in the form of FTA Circular B: Title VI Requirements and Guidelines for Federal Transit Administration Recipients. This guidance outlines the factors that should be monitored in this analysis and are based on agency-established service standards and policies. These standards are listed below. GRTC s internal service performance standards can be found in GRTC s Fiscal Year Transit Development Plan (TDP). The standards and policies are detailed in the technical analysis section of this document. They include both the factors required by FTA as well as several additional standards. The factors outlined below have been analyzed in this report. Service standards required to be monitored by FTA: Transit Access/Availability (distance to a Route) Vehicle Headway (how often the bus comes by on each Route) Vehicle Load (how many people are on a bus at any given time) Service Span (how many hours per day the bus is available) On-time performance (how likely the bus arrives within 5 minutes of the expected time) Service policies required to be monitored by FTA: Vehicle Assignment (how buses are assigned to each Route for the day) Distribution of Transit Amenities (where benches, shelters, and trash cans are located througho out the system) Additional service standards monitored in this report: Bus Stop Spacing (how far apart along a Route stops are found) Transfer Frequency (percentage of customers making transfers) Directness of Routing (how direct the Routes are on the street network) Quality of service/customer satisfaction survey results: Cleanliness Travel Comfort 52
53 Quality of service/customer satisfaction survey results (continued): On-time adherence Schedule (how convenient) Driver friendliness/helpfulness Customer service (phone/web) Cost 53 GRTC Transit System Level and Quality of Service Analysis Analysis Results The table below provides a summary of the findings of the level and quality of service analysis. The table lists the identified factors used to monitor the service standards for equity and the results for the three populations of focus: Minority, Low-Income, and LEP. Out of the eighteen factors analyzed, there were four standards as outlined in GRTC s Transit Development Plans that were not fully met: Headway (specifically weekday peak), Service Span (specifically weekday service), On-time Performance, and Directness of Routing. Of these, Headway and Directness of Routing showed potential issues relating to Title VI in that there was a greater than 10% disparity between either Minority, Low-Income, or LEP routes and their counterparts (see table) in level of service. These results require further investigation and GRTC will take steps to mitigate any service equity concerns. There were no disparities in the survey results regarding quality of service. Category Minority Low-Income LEP Standard Standard Met or Title VI Issue Level of Service: Service Availability By Population Service Availability By Employment Headway Load Service Span On-time Performance Vehicle Assignment Distribution of Amenities Stop Spacing Transfer Frequency Directness of Routing Quality of Service: Cleanliness Travel Comfort On-time adherence Schedule (convenience) Driver friendliness/helpfulness Customer service (phone/web) Cost No issues meeting standard, no issues regarding Title VI = (blank) Issues in meeting standard, no issues regarding Title VI = No issues in meeting standard, potential Issues regarding Title VI = Issues in meeting standard, potential issues regarding Title VI =
54 Express, Seasonal, and Demand-Response Service GRTC Transit System Level and Quality of Service Analysis GRTC operates several Express Routes in addition to its local service. These Express Routes have limited stop service between suburban park-and-ride-locations and the downtown Richmond central business district. Most of these Routes have no stops between these two end points and are run only at peak commuter times. Because the nature of this service is different, the Express Routes are compared to each other rather than the local service. GRTC also operates one Seasonal Route which facilitates travel for visitors and employees to the Kings Dominion amusement park in Doswell, VA. The Express Routes and the Seasonal Route are not analyzed within the Level and Quality of Service Analysis. They are analyzed in a separate report. GRTC s Funding Sources/ Operational Environment GRTC Transit System is funded by a mix of federal and state formula based and discretionary grants, non -federal and state discretionary grants, local contributions, fare revenue, and advertising revenue. Each jurisdiction in GRTC s service area independently budgets the level of funding to contribute to GRTC s operating budget and to support public transit. GRTC operates a contract style service agreement with Henrico County, Chestefield County, and the City of Petersburg. Henrico County operates Local and Express Routes, Chesterfield County Operates two Express Routes, and the City of Petersburg operates one Express Route. These three jurisdictions are invoiced monthly for operated service miles for their jurisdictional specific Routes. The City of Richmond provides an annual operating subsidy to GRTC at the beginning of each fiscal year to support the Routes operating within the City Limits. The City of Richmond is also unique in giving GRTC the ability to make service adjustments without having to go through the City administration or elected officials for approval. All service changes for Henrico County, Chestefield County, and the City of Petersburg must be authorized by the administration and/or elected officials. 54
55 Determining Minority, Low-Income, and LEP Routes GRTC Transit System Level and Quality of Service Analysis Methodology/ Analysis To form a basis for comparison, FTA advises transit providers to assign Routes as Minority or Non-Minority Routes in order to monitor service in terms of Title VI. A Minority Route is defined by the FTA as: A Route that has at least 1/3 of its total revenue mileage in a Census Block or Block Group, or traffic analysis zone(s) with a percentage of Minority population that exceeds the percentage of Minority population in the transit service area. A recipient may supplement this service area data with Route-specific ridership data in cases where ridership does not reflect the characteristics of the Census Block, Block Group, or Traffic Analysis Zone. (FTA Circular B) GRTC defined its local service area as the Census 2010 Block Groups that touch within 1/4 mile of the Local Bus Routes (current Bus Routes as of October 2015 were used to define the local service area). Socioeconomic data on Minority status, Low-income status, and LEP status was gathered from American Community Survey (ACS) year estimates by Census Block Groups for the local service area. GRTC then determined the average percentage by block group for each of the above socioeconomic characteristics in the local service area. Block groups with a higher-than-average rate of any of these populations were then described as Minority Areas, Low-Income Areas and/or LEP areas. These categories are not mutually exclusive. For example, there could be block groups that fall under all three categories, some, or none. GRTC then calculated the total weekly scheduled revenue miles of each of its Local Routes (for the October 2015 booking) and how many of these miles traveled through the Minority block group areas, Low-Income Block Group Areas, and/or LEP block group areas. For Routes that travel along the boundary of two Block Group Areas, which was common as major roadways often form the boundary of Block Groups, the Block Group on the right side of the direction of travel was used. For the Low-income Routes, GRTC used 1/2 instead of 1/3 of Block Groups as the threshold, because all Local Routes had at least 1/3 of its revenue mileage going through Low-Income areas. The list of Routes and their Title VI designations are listed in the table on the following page. 55
56 GRTC Transit System Level and Quality of Service Analysis Route Name Minority Route? Low-Income Route? Limited-English- Proficiency Route? 1 Monument 2 Patterson 3 S Meadow/Robinson Minority Route Low-income Route 4 S Belmont/Robinson Low-income Route 6 Broad St Low-income Route 7 Seven Pines Minority Route Low-income Route 10 Riverview Minority Route Low-income Route LEP Route 11 Oliver Hill/Mosby Minority Route Low-income Route 16 Grove 18 Henrico Government Center Minority Route Low-income Route LEP Route 19 Pemberton LEP Route 21 Brook Azalea Minority Route Low-income Route 24 Westbrook/Crestwood Low-income Route 32 Ginter Park Minority Route Low-income Route 34 Highland Park Minority Route Low-income Route 37 Chamberlayne Minority Route Low-income Route 41 Oakwood/Church Hill Minority Route 43 Whitcomb/Fairmount Minority Route Low-income Route 44 Fairfield/Fairmount Minority Route Low-income Route 45 Jefferson Minority Route Low-income Route 51 Briel St/Church Hill Minority Route 52 Montrose Heights/E Main Minority Route Low-income Route 53 Darbytown/E Main Minority Route Low-income Route 56 E Laburnum Minority Route 60 Chippenham Mall/Hull St Minority Route Low-income Route LEP Route 61 Crutchfield/Midlothian Minority Route Low-income Route 62 Southwood/Hull St Minority Route Low-income Route 63 Chippenham Square/Midlothian Minority Route Low-income Route LEP Route 68 Broad Rock/Walmsley Minority Route Low-income Route LEP Route 70 Stony Pt/Forest Hill 71 Jahnke Rd/Forest Hill Minority Route Low-income Route 72 Ruffin Rd Minority Route Low-income Route 73 Ampthill Minority Route Low-income Route LEP Route 74 Oak Grove Minority Route Low-income Route 91 Laburnum Connector Minority Route 93 Azalea Connector Minority Route LEP Route 101 Southside Plaza/Belt Blvd Connector Minority Route Low-income Route Results Based on the described methdology, the results show that out of the 37 local routes, 29 are identified as Minority Routes, 27 are identifed as Low-Income Routes, eight are identified as LEP Routes, six Routes cross all three population categories, 24 Routes are both Minority and Low-Income, seven Routes are both Minority and LEP, and six Routes are both Low-Income and LEP. There are four Routes that do not fall in any of the three categories. 56
57 Service Standards Required to be Monitored by FTA Transit Access/ Availability GRTC Transit System Level and Quality of Service Analysis Definition/Standard Transit access/availability is defined by distance to a Bus Route. The closer one is to a Bus Route, the higher the access/availability. The standard is applied based on a tiered system where areas of higher density should have a shorter maximum distance to a transit line than areas of lower density. The standard is divided into two separate density categories: household/vehicle access density and employment density. The household/vehicle access density standard is shown below. American Community Survey data was used to divide areas into the distance categories (1/6 mile, 1/4 mile, 1/2 mile, and 1 mile). % of Households Population Density (Households per Acre) with 0 Vehicles Available Over 10 7 to 10 4 to 6.9 Under 4 Over 15.0% 1/6 mile 1/6 mile 1/4 mile 1/2 mile 10.0 to 15.0% 1/6 mile 1/4 mile 1/2 mile 1 mile 5.0 to 9.9 % 1/4 mile 1/2 mile 1 mile below 5.0% 1/2 mile 1 mile The employment density standard, below, is based on the number of employees at each place of employment in the service area. Places of employment with more than 100 employees should have access within 1/4-mile while places of employment with 25 to 50 employees should have access within one mile of a transit line. Number of Employees Maximum Distance to Transit Line Over 100 1/4 mile 50 to 100 1/2 mile 25 to 49 1 mile Methodology/Analysis - Household/Vehicle Access To measure household density, an analysis was conducted using American Community Survey data to determine population density and household vehicle access in the local service area. Using GIS, density was determined by Census Block Groups and then divided into the categories listed in the standards above. These categories were then combined into five overall areas for the distance standards (1/6 mile areas, 1/4 mile areas, 1/2 mile areas, 1 mile areas, and areas with no applicable standard). The resulting maps are listed below and are located in Appendix A. 1. Transit Accessibility: Household Density 2. Transit Accessibility: Household Vehicle Access 3. Service standard areas by Household/Vehicle Access density These areas were then compared to the current Local Routes. Buffers were drawn around Routes based on each particular area s access standard and areas that met the standard (inside the respective Route buffer) were separated from areas that did not meet the standard (outside the respective rrute buffer).the coverage map below summarizes the local service area into areas that meet the access standard, that don t meet the access standard, or are not subject to the standard due to low household density. Each area larger than a few square meters that does not meet the standard is labeled with the reason for the standard 57
 2. Funding/Permission not available for implementation (near edges of service area in Henrico or Chesterfield Counties) 3.")
 that pass by parallel to each other as they travel from the Central Business District on to the Northside and centers in the Gilpin Court Housing area.")
58 GRTC Transit System Level and Quality of Service Analysis not being met. The three most common reasons are highlighted below and are out of GRTC s control in providing access. 1. Vacant/Park/River Property (no need for access) 2. Funding/Permission not available for implementation (near edges of service area in Henrico or Chesterfield Counties) 3. Narrow Streets/Area Inaccessible to buses Result - Household/Vehicle Access There was one location where the accessibility standard was not met, without meeting any of the above reasons. This area is between two Routes (37 and 32) that pass by parallel to each other as they travel from the Central Business District on to the Northside and centers in the Gilpin Court Housing area. The two parallel Routes pass by in roads that have bridges over a small valley with railroad tracks. This area in question that is outside the access standard is near the valley/ railroad tracks and thus any access to the neighborhood is limited by this factor. The most feasible remedy would be to re-route Route 32 from 1st Street to St. John Street, to Charity St, back to 1st. This re-routing would add a couple minutes onto the Route and force the bus to use Charity Street (a narrow street), or take additional turns to avoid Charity Street. This Route change would bypass a highrise senior housing facility that currently has direct access along the Route. 58
 data and found 1,055 places of employment with at least 25 employees within the local service area.")
59 GRTC Transit System Level and Quality of Service Analysis Methodology/Analysis - Employment To measure employment density, this analysis used 2014 Census LODES-WAC (Longitudinal Employer-Household Dynamics Origin-Destination Employment Statistics Workplace Area Characteristics) data and found 1,055 places of employment with at least 25 employees within the local service area. They were split into categories based on how many employees were reported and were compared to the Access Standard (distance to Route) shown above. Total Meets Access Standard Substandard Accessibility # Employees # % # % # % more than % % % % % % % % % Overall, 903 out of the 1,055 business met the standard for distance, or about 85.6%. The map below provides a visual of the results. The category with the largest amount of substandard accessibility is places of employment with more than 100 employees. 59
60 GRTC Transit System Level and Quality of Service Analysis In order to compare the equity in meeting the standard, the number of places that did not meet the employment density access standard were separated based on whether they wre found in Minority, Low-Income, or LEP areas. These percentages were compared to the overall percentage of Minority, Low-Income, and LEP block group areas within the Local Service Area. Area Area (acres) Percent LSA Coverage Minority Block Groups 48, % Low-Income Block Groups 34, % LEP Block Groups 24, % Total Area 120, % The tables below show that the areas where places of employment do not meet the access standard are proportionate when divided between Minority, Low-Income, and LEP areas. Substandard Accessibility Minority Areas Difference from land # Employees # % # % Area Coverage More than % % 40.40% -8.7% % % 40.40% -7.1% % % 40.40% -22.2% Substandard Accessibility Low-Income Areas Difference from land # Employees # % # % Area Coverage More than % % 28.20% -1.4% % % 28.20% -6.0% % % 28.20% -10.0% Substandard Accessibility LEP Areas Difference from land # Employees # % # % Area coverage More than % % 20.20% 9.1% % % 20.20% 7.6% % % 20.20% -2.0% Results - Employment This analysis finds no significant areas of concern for Title VI reasons regarding transit access. 60
61 GRTC Transit System Level and Quality of Service Analysis Headway Definition/Standard Headway is defined as the amount of time between buses on a given Route, or how often a bus passes by a single point. Headways typically vary throughout the day, and by the day of week, to accommodate fluctuations in demand. Headways are usually shortest during the weekday peak commuter times between 6am and 9am and between 4pm and 6pm, and longest on Sundays when there is the least demand. Headways are determined on a Route-by-Route basis, and are mainly decided due to demand/ridership on a Route. Routes with the highest ridership have more trips and thus shorter headways. Headways are also affected by whether the Route is twinned with another Route or not. Several Routes share the same routing as each other, especially the closer they get to downtown. These Routes effectively have their headways in these shared areas because a customer can board either Route at the same stop and get to the same destination Fifteen to 20 minute headways are listed in the TDP for the peak headway standard. This should be considered for high demand Routes but is not feasible for lower demand routes due to cost considerations. The practical standard that GRTC uses in 30 minutes during peak service and up to 60 minutes during off-peak service. Headway Maximum Type of Service Peak Off-Peak Weekday 30 minutes 30 to 60 minutes Saturday ~ 60 minutes Sunday ~ Local Policy Driven Express ~ Demand Driven Methodology/Analysis In order to determine average headway, GRTC used October 2015 service booking data to determine the headway for each route for weekday peak, weekday off peak, Saturday, and Sunday schedules. Tables showing each Local Route s headways are shown in Appendix C, and in the following summary tables. Minority Analysis Non - Minority Overall Minority Diff % Diff Weekday Peak % Off-Peak % Saturday Peak % Sunday Peak % Low-Income Analysis Low - Non-Low Overall Income Income Diff % Diff Weekday Peak % Off-Peak % Saturday Peak % Sunday Peak % 61
62 GRTC Transit System Level and Quality of Service Analysis LEP Analysis Overall LEP Non-LEP Diff % Diff Weekday Peak % Off-Peak % Saturday Peak % Sunday Peak % Results As can be seen above, weekday headways do not meet the 30 minute standard. When compared by Route, Minority Routes have slightly longer peak headways (40 minutes vs 39 minutes) or about 3% difference. Low-Income Routes have on average 23% shorter peak headways, and LEP Routes have on average 18% longer headways. This difference in the LEP Routes requires further investigation. The Local Routes meet the off-peak weekday headway service standard, at about 50 minutes which falls within the 30 to 60 minute window. Minority Routes have about 26.2% higher off-peak weekday headways than Non-Minority Routes, though both fall under the standard. Low-Income Routes have about 13% higher off-peak headways (52 vs 46 minutes). LEP Routes have shorter off-peak weekday headways than Non-LEP routes. Overall, GRTC s Routes meet the standard for weekend service. GRTC will investigate the differences between Minority and Non-Minority Route headways during weekday off-peak times as well as LEP and Non-LEP Route headways during weekday peak times. Vehicle Load Definition/Standard Vehicle load refers to the number of passengers on board at a given time in relation to the seated capacity of the vehicle. A load of 1.0 means that every seat on the bus is taken by a passenger. A load of less than 1.0 means there are open seats, and a load of greater than 1.0 means there are people who have to stand. GRTC s standard for vehicle load is defined by service type and time of day as detailed below. Methodology/Analysis Maximum Loading Factor (Passenger/Seat) Service Type Peak Off-Peak Local Shuttle Load is shown by three categories with data used from data taken from the Automatic Passenger Counter data. The first is max load, or the maximum number of people recorded for that Route on a surveyed trip. The next is the percent of stops surveyed for which there are enough passengers to fill at least 70% of the seats on the bus (or 0.7 of the loading factor), and the last is the percent of stops surveyed for which there were enough passengers to fill at least 100% of the seats on the bus (or 1.0 of the loading factor). Appendix D shows the data used in this analysis. 62
63 GRTC Transit System Level and Quality of Service Analysis Results As seen in the tables below, on average the buses very rarely hit 100% or even 70% of the buses seated capacity. On averages, buses only get around 50% - 60% full on a given trip, and only exceed 70% load about 1% - 2% of the stops surveyed. When comparing between Minority, Low-income, and LEP Routes and other Routes, there is very little difference between the amount of time spent at 100% load. LEP routes do spend a little more time at 100% capacity than non-lep routes but it is very low 0.2% of stops surveyed. This triggers no issues for Title VI. Weekends show similar results. No categories on average spend more than 0.2% of stops at 100% capacity on average, triggering no issues for Title VI. Weekday Max Load Load Duration Category avg 70% 100% Minority 57% 1.0% 0.1% Non-Minority 59% 1.4% 0.1% Difference -2% -0.4% -0.1% Low-Income 60% 1.3% 0.1% Non-Low- 49% 0.5% 0.0% Income Difference 11% 0.8% 0.1% LEP 60% 2.0% 0.2% Non-LEP 56% 0.8% 0.1% Difference 4% 1.2% 0.1% Saturday Max Load Load Duration Category avg 70% 100% Minority 45% 0.6% 0.1% Non-Minority 57% 1.6% 0.1% Difference -11.8% -0.9% -0.1% Low-Income 49% 0.9% 0.1% Non-Low- 41% 0.5% 0.0% Income Difference 7.5% 0.4% 0.1% LEP 49% 1.5% 0.2% Non-LEP 47% 0.7% 0.0% Difference 2.1% 0.8% 0.2% Sunday Max Load Load Duration Category avg 70% 100% Minority 37% 0.1% 0.0% Non-Minority 44% 0.2% 0.0% Difference -7.3% -0.1% 0.0% Low-Income 41% 0.2% 0.0% Non-Low- Income 31% 0.0% 0.0% Difference 10.0% 0.1% 0.0% LEP 32% 0.0% 0.0% Non-LEP 39% 0.1% 0.0% Difference -7.6% -0.1% 0.0% 63
64 GRTC Transit System Level and Quality of Service Analysis Service Span Definition/Standard Service Span is the number of hours per day that a Route/Service is available. For example, a Route running in service from 6am to 6pm would have a span of 12 hours. A route running from 6am to 9am only, then running 4pm to 6pm only, would have a span of 5 hours. GRTC s standard for service span on Local Routes is below. Span is also determined by ridership, demand, and funding availability. Routes with low ridership generally have lower spans than the busier routes. Routes operated in Henrico County have spans restricted by funding availability. Methodology/Analysis Day Begin End Hours Weekday 5am 11pm 18 Saturday 6am 11pm 17 Sunday 6am 10pm 16 Minority Analysis Non - Minority Minority Diff % Diff Weekday % Saturday % Sunday % Low-Income Analysis Low - Income Non - Low Income Diff % Diff Weekday % Saturday % Sunday % LEP Analysis Non - Minority Minority Diff % Diff Weekday % Saturday % Sunday % Results On average, the Local Routes do not meet the weekday span requirement of 18 hours, they average around hours. On Saturday, they average about hours, which is over the 17 hour standard. They do meet the Sunday requirement averaging hours, which is over the 16 hour standard. Minority, Low-Income, and LEP routes spans are not more than 10% difference on all days, thus triggering no issues for Title VI. Individual Route spans can be found in the Appendix. 64
65 On-time GRTC Transit System Level and Quality of Service Analysis Definition/Standard On-time performance measures the percent of the time that a bus is less than one minute early and less than five minutes late to a timepoint stop along a Route. GRTC s standard for on-time is 80% on all Routes. On-time is measured as a means to determine the reliability/dependability of the service. Methodology/Analysis While GRTC strives to improve on-time performance, there are several factors that create a challenge. One is that a substantial portion of GRTC s local service is on busy city streets with no priority for public transit vehicles. There is a high density of signalized intersections as well as traffic. Broad Street is GRTC s most heavily traveled corridor, and there are traffic signals every few blocks. This is naturally going to cause variation in trip running times. However, these areas are also the areas with the highest population and employment density and therefore reliable transit is needed in these areas. Time Period Local Service Express Service Peak 80% 80% Off-Peak 80% n/a On-time % Minority 71.9% Non-Minority 65.2% Difference 6.7% Low-Income 71.7% Non-Low-Income 67.1% Difference 4.6% LEP 67.0% Non-LEP 71.4% Difference -4.4% Results Overall, Minority Routes and Low-Income Routes have a higher on-time percentage than Non-Minority and non-low-income Routes. LEP routes are on average about 4% less on time than Non-LEP Routes. These results trigger no Title VI issues. 65
66 Service Policies Required to be Monitored by FTA Vehicle Assignment 66 GRTC Transit System Level and Quality of Service Analysis Definition/Standard Vehicle assignment refers to the decision process to determine which bus travels on which Route in a given day. Vehicle assignment is monitored as there can be differences in the vehicles within the transit fleet, including age. This standard is to be monitored on a quarterly basis. GRTC s TDP does not give specific standards for revenue vehicle assignment, rather there is an internal policy to help assign vehicles: Considerations for vehicle assignment are the size of the buses, the street limitations and the age of the buses. First the larger capacity units are assigned to the heavier volume Routes based on anticipated routes. Larger vehicles are assigned to Routes where passenger boardings exceed 30,000 per month. Second, units are assigned according to the physical restrictions for street turns. Third, later model units are assigned to those Routes with higher mileage and time requirements to reduce maintenance calls. Routes with mileage of greater than 150 miles per day are assigned newer buses. The newer buses are those that were purchased after January 1, In addition, buses greater than the rolling average age of GRTC fleet should be assigned to non-minority Routes 50% or more of the time on an annual basis, for both am and pm assignments. (Reference) Methodology/Analysis To conduct the analysis, GRTC staff first determined that the average age of GRTC buses for the review period. Staff then tabulated the average vehicle age running on Minority Routes and Non-Minority Routes using GFI farebox software (Appendix 3, Data for Vehicle Assignment Analysis). It is important to note that this policy is not neutral when it comes to Title VI it specifically says that older vehicles are to be assigned to non-minority routes at least 50% of the time. Routes with over 30,000 average monthly ridership for FY15 to be given largest capacity vehicles: Route 6 Broad St Route 32 Ginter Park Route 37 Chamberlayne Route 34 Highland Park Route 60 Hull St/Chippenham Mall Routes with restricted street turns to be given smaller/lower height vehicles: Route 10 Riverview has narrow streets and many turns in the Randolph neighborhood Route 56 S Laburnum goes under a railroad bridge with height restrictions (no CNG) Routes by higher mileage (more than 150 miles per day) (to be given newer buses): All routes, except Routes 11, 21, 91, 93, and 101 List of buses greater than rolling age as of October 2014 and January 2015 ( ) to be assigned to Non-Minority Routes at least 50% of the time: Vehicles , 2003 Gillig Low-Floor 40-ft buses Vehicles , 2008 Gillig Low-Floor 40 ft buses Vehicles , 2001 Gillig Phantom 40 ft buses Vehicles , 2003 Gillig Phantom 40 ft buses Vehicles , 2001 Bluebird Excel 35 ft buses
67 GRTC Transit System Level and Quality of Service Analysis The reason for monitoring vehicle assignment is to ensure the equitable distribution of vehicles throughout the system. GRTC currently has several different vehicle models in service, with some differences between them. All Local Fixed-Route vehicles are wheelchair accessible, have AVL (GPS) on them, and have air-conditioning. All GRTC vehicles are accessible, though not all are low-floor. October 2014 Route Average Vehicle Age All Local Routes 5.19 Minority 5.24 Non-Minority 5.02 Difference % Low-Income 5.04 Non-Low-Income 5.54 Difference % LEP 4.46 Non-LEP 5.34 Difference % January 2015 Route Average Vehicle Age All Local Routes 5.09 Minority 5.12 Non-Minority 4.98 Difference % Low-Income 5.07 Non-Low-Income 5.12 Difference % LEP 5.13 Non-LEP 5.08 Difference % Results Judging from the above tables, in October 2014, on average, Minority Routes had a bus that was roughly 0.22 years (or about 80 days) older than Non-Minority Routes on a given trip. Both Low-Income Routes and LEP Routes were on average likely to have a younger bus than their Non-Low-Income and Non-LEP counterparts. In January 2015, Minority Routes on average had a bus that was roughly 0.14 years (or about 51 days) older than Non-Minority Routes. LEP Routes on average had a bus that was about 0.05 years older (or about 18 days) older than Non-LEP Routes. Overall, this is a very small difference (less than 5% difference based on average vehicle age). 67
68 Distribution of Transit Amenities GRTC Transit System Level and Quality of Service Analysis Definition/Standard GRTC places benches, trash cans, and shelters at bus stops for passenger convenience. These amenities are placed based on boarding and alighting counts, and customer requests. Jurisdictional procedures must be followed for placement. The standards are detailed below. Amenity Type Benches Shelters Trashcans Measurement Given physical considerations, GRTC will endeavor to provide benches for stops with 100 weekly boardings. Stops with fewer weekly boardings (50-100) will be evaluated on a case-by-case basis. GRTC will follow the guidelines outlined in the City of Richmond Amenities Procedure. Given physical considerations, GRTC will endeavor to provide shelters for stops with 400 weekly boardings. Stops with fewer weekly boardings ( ) will be evaluated on a case-by-case basis. The type of shelter (custom or neighborhood) will be evaluated on a case by case basis. GRTC will follow the guidelines outlined in the City of Richmond Amenities Procedure. Given physical considerations, GRTC will endeavor to provide trashcans for stops with 100 weekly boardings or alightings. Stops with fewer weekly boardings and alightings (0-100) will be evaluated on a caseby-case basis. GRTC will follow the guidelines outlined in the City of Richmond Amenities Procedure. Methodology/ Analysis GRTC has a total of 379 benches, 466 trash cans, and 92 shelters in use (October 2015). The table on the following page summarizes these statistics. 68
69 Bus Stops GRTC Transit System Level and Quality of Service Analysis Benches Amenities Count % of Total Count % of Total % Difference Total Minority % % -0.2% Non-Minority % % 0.2% Low-Income % % 9.7% Non-Now-Income % % -9.7% LEP % % -7.1% Non-LEP % % 7.1% Bus Stops Trash Cans Amenities Count % of Total Count % of Total % Difference Total Minority % % 1.4% Non-Minority % % -1.4% Low-Income % % 11.9% Non-Now-Income % % -11.9% LEP % % -5.8% Non-LEP % % 5.8% Bus Stops Shelters Amenities Count % of Total Count % of Total % Difference Total Minority % % 1.5% Non-Minority % % -1.5% Low-Income % % 13.1% Non-Now-Income % % -13.1% LEP % % -0.1% Non-LEP % % 0.1% Detailed maps that show a graphical representation of this analysis of the distribution of amenities can be found in the Appendix. 69

70 GRTC Transit System Level and Quality of Service Analysis Results On average, the distribution of bus stop amenities matches very closely with the distribution of bus stops by Block Group, meaning there is equitable distribution. LEP areas have 7.1% fewer benches than the overall service area, which is the greatest disparity. Low-Income Areas have greater than 10% difference more than other areas for shelters and trash cans. Overall the distribution of amenities triggers no issues in terms of Title VI. Additional Service Standards Monitored by GRTC Bus Stop Spacing Definition/Standard GRTC s standard for bus stop spacing takes into account the activity density of the service area. Areas of higher population/employment density in general should have stops closer together along a Route than suburban and rural areas. Type of Area Core (Richmond CBD) Urban Suburban Rural Stops per Mile feet feet feet feet 70
71 GRTC Transit System Level and Quality of Service Analysis Methodology/Analysis A range is given because the local geography varies by area and by Route. For example, several Routes go over bridges, and although the general area may be urban, it does not make sense to place a stop on the middle of a bridge. On the other hand, an area may have a lower density but may have steep slopes or less pedestrian access, making more closely spaced stops a necessity. In other cases, places where Routes overlap may result in stops that are closer together than the standard but are necessary to ensure that Routes have convenient stops for transfers to other Routes. Stop Spacing Average Spacing (ft) Minority 915 Non-Minority 823 Difference 92 11% Low-Income 858 Non-Low-Income 996 Difference % LEP 955 Non-LEP 879 Difference 76 9% Results On average, Local Routes had stop spacing of about 900 feet, which is within the spacing standards. One Route, had average spacing less than 600 feet, which was Route 3 at 590 feet. This Route has a majority of its touring through urban and suburban areas. For urban areas the spacing standard starts at 500 feet, so there is no issue seen with this spacing. Routes/variants with greater than 1200 feet average spacing included Route 11 (1216 feet), Route 18 (1319 feet), Route 56 (1677 ft), Route 91 (1331 feet), and Route 93 (1304 feet). Many of these Routes travel through suburban or rural areas for most of their routing. Route 11 is a short Route that travels over a long bridge and serves a geographically challenging area and therefore has fewer stops. Overall, bus stop spacing does not seem to be an issue in regards to Title VI. 71
72 Transfer Frequency GRTC Transit System Level and Quality of Service Analysis Definition/Standard Transfer Frequency refers to the number of customers that use more than one bus as a part of their journey. Ideally, there should be some transfers in a system as transferring reduces the need for redundant service along heavily travelled corridors. However, transfer frequencies that are too high are an inconvenience to customers because they can lengthen travel time (adds in wait time to catch a 2 nd bus). Methodology/Analysis % of transfers system-wide minimum of 5% by route maximum of 30% The average for Local Routes, using data from March 2015, is 28.3%. Transfer Frequency Overall 28.3% Minority 28.1% Non-Minority 29.1% Difference -1.0% Low-Income 28.5% Non-Low-Income 27.9% Difference 0.6% LEP 26.8% Non-LEP 28.7% Difference -1.9% Results There are 14 Local Routes with transfer frequency over 30%, which requires examination. However, there don t appear to be disparities based on Minority, Low-Income, and LEP Routes in regards to Title VI. Directness of Routing Definition/Standard Directness of routing is defined as the ratio of the miles traveled along a route to the straight-line distance between the two endpoints of the route. GRTC s TDP established a standard of 1.7 as the maximum directness ratio, meaning the travel distance should be less than 1.7 times the straight-line distance between a route s endpoints. Criteria Measurement Level Terminal Distance Route Distance/Straight-Line Mileage Maximum
73 GRTC Transit System Level and Quality of Service Analysis Methodology/Analysis Directness of Routing Ratio (Average by Variants) Overall 3.41 Minority 3.62 Non-Minority 2.81 Difference % Low-Income 3.47 Non-Low-Income 3.25 Difference % LEP 3.36 Non-LEP 3.43 Difference % Results Overall, GRTC s current directness ratio is about double the standard maximum, meaning that GRTC s Routes on average travel 3.4 times the as the crow flies distance from each end of line. On average, Minority Routes travel almost 29% longer between their termini than Non-Minority Routes, which warrants investigation. An investigation should take place to determine whether changes could be made to reduce the routing ratio for the Minority Routes. Quality of Service Survey Results Methodology/Analysis To assess quality of service in the local service area, GRTC must conduct a travel patterns and customer satisfaction survey on all or selected Routes. An onboard survey was conducted in April/May 2015 by the Southeastern Institute of Research on a sample of Routes. GRTC staff analyzed the survey data, categorizing the routes and grouping the results by Minority/Non-Minority, Low-Income/Non-Low-Income, and LEP/Non-LEP status. The below factors were analyzed for Title VI results. Results Cleanliness Riders were asked to give their rating on whether the buses were clean. When satisfaction ratings 4 or 5 were combined (as an estimate of satisfied customers) there was very little difference based on Minority/ Non-Minority, Low-Income and Non-Low-Income, and LEP and Non-LEP Routes. This triggers no issues regarding Title VI. 73
74 GRTC Transit System Level and Quality of Service Analysis Cleanliness - Continued Buses are Clean Rating Excellent Poor Don t Know Minority 32% 27% 25% 9% 6% 1% Non- Minority 29% 28% 27% 9% 7% 1% Low-Income 32% 26% 25% 10% 6% 1% Non-Low- Income 29% 31% 26% 7% 7% 1% LEP 31% 24% 30% 10% 5% 0% Non-LEP 30% 29% 26% 8% 6% 1% Buses are Clean Rating 4 or 5 Minority 59% Non- Minority 57% Difference 2% Low-Income 58% Non-Low- Income 60% Difference -2% LEP 55% Non-LEP 59% Difference -4% Travel Comfort Riders were asked to give their rating on whether the buses werecomfortable. Once again, when satisfaction ratings 4 or 5 were combined (as an estimate of satisfied customers) there was less than 10% difference based on Minority/Non-Minority, Low-Income and Non-Low-Income, and LEP and Non-LEP routes. This triggers no issues regarding Title VI. Buses are Comfortable Rating Excellent Poor Don t Know Minority 38% 33% 21% 5% 2% 1% Non- Minority 36% 30% 25% 5% 4% 1% Low-Income 37% 32% 22% 5% 3% 1% Non-Low- Income 38% 32% 21% 5% 2% 1% LEP 36% 29% 25% 7% 2% 1% Non-LEP 35% 35% 22% 5% 3% 1% Buses are Comfortable Rating 4 or 5 Minority 71% Non- Minority 66% Difference 5% Low-Income 69% Non-Low- Income 70% Difference -1% LEP 65% Non-LEP 69% Difference -4% 74

75 On-Time GRTC Transit System Level and Quality of Service Analysis On-time performance also scored similarly between routes. When satisfaction ratings 4 or 5 were combined there was very less than 10% based on minority/non-minority, Low-Income and Non-Low-Income, and LEP and Non-LEP routes. This triggers no issues regarding Title VI. On-time Arrival at my Destination Rating Excellent Poor Don t Know Minority 45% 28% 17% 6% 2% 2% Non- Minority 40% 27% 19% 4% 7% 3% Low-Income 44% 27% 17% 6% 3% 2% Non-Low- Income 41% 30% 19% 3% 5% 1% LEP 44% 30% 16% 4% 3% 2% Non-LEP 42% 29% 18% 6% 3% 2% On-time Arrival at my Destination Rating 4 or 5 Minority 73% Non- Minority 67% Difference 6% Low-Income 71% Non-Low -Income 72% Difference -1% LEP 74% Non-LEP 71% Difference 4% Schedule Schedule suitability also scored similarly between routes. When satisfaction ratings 4 or 5 were combined there was very little difference based on Minority/Non-Minority, Low-Income and Non-Low-Income, and LEP and Non-LEP routes. This triggers no issues regarding Title VI. The Bus Timetable (Schedule) is easy to Understand Rating Excellent Poor Don t Know Minority 50% 27% 14% 4% 2% 2% Non- Minority 44% 28% 17% 6% 3% 1% Low- Income 49% 27% 15% 4% 3% 2% Non-Low- Income 49% 27% 14% 6% 2% 2% LEP 51% 24% 15% 5% 3% 2% Non-LEP 47% 30% 16% 4% 2% 1% The Bus Timetable (Schedule) is easy to Understand Rating 4 or 5 Minority 77% Non- Minority 72% Difference 5% Low-Income 76% Non-Low- Income 77% Difference 0% LEP 75% Non-LEP 77% Difference -1% 75
76 Driver Friendliness/Helpfulness GRTC Transit System Level and Quality of Service Analysis Driver Helpfulness/Friendliness scored similarly between Routes. When satisfaction ratings 4 or 5 were combined (as an estimate of satisfied customers) there was very little difference based on Minority/ Non-Minority, Low-Income and Non-Low-Income, and LEP and Non-LEP Routes. This triggers no issues regarding Title VI. Drivers are Helpful Rating Excellent Poor Don t Know Minority 50% 28% 14% 3% 2% 3% Non- Minority 46% 28% 18% 3% 4% 2% Low- Income 49% 28% 14% 3% 2% 3% Non-Low- Income 49% 28% 18% 2% 3% 1% LEP 53% 27% 15% 2% 2% 1% Non-LEP 49% 29% 14% 3% 2% 3% Drivers are Helpful Rating 4 or 5 Minority 78% Non- Minority 74% Difference 4% Low-Income 77% Non-Low- Income 77% Difference 1% LEP 81% Non-LEP 78% Difference 3% Customer Service (Phone, Web) Customer Service (Phone, Web) also scored similarly between routes. When satisfaction ratings 4 or 5 were combined (as an estimate of satisfied customers) there was very little difference based on minority/non-minority, Low-Income and Non-Low-Income, and LEP and Non-LEP routes. This triggers no issues regarding Title VI. Representative s Knowledge about GRTC and its Services Rating Excellent Poor Don t Know Minority 47% 28% 16% 5% 3% 1% Non- Minority 45% 28% 13% 8% 5% 1% Low- Income 47% 28% 15% 6% 4% 1% Non-Low- Income 49% 26% 14% 8% 2% 2% LEP 50% 27% 15% 5% 3% 1% Non-LEP 43% 28% 17% 7% 4% 1% Representative s Knowledge about GRTC and its Services Rating 4 or 5 Minority 75% Non-Minority 73% Difference 2% Low-Income 75% Non-Low-Income 74% Difference 0% LEP 76% Non-LEP 71% Difference 5% 76
77 GRTC Transit System Level and Quality of Service Analysis Customer Service (Phone, Web) - Continued Representative Provided the Necessary Information Rating Excellent Poor Don t Know Minority 48% 28% 15% 5% 3% 1% Non- Minority 46% 28% 14% 5% 5% 2% Low- Income 47% 29% 15% 5% 3% 1% Non-Low- Income 52% 23% 15% 5% 3% 3% LEP 50% 25% 16% 5% 3% 1% Non-LEP 43% 29% 15% 5% 5% 2% Representative Provided the necessary Information Rating 4 or 5 Minority 76% Non-Minority 74% Difference 2% Low-Income 76% Non-Low- Income 75% Difference 1% LEP 75% Non-LEP 73% Difference 3% Cost And finally, cost also scored similarly between routes. When satisfaction ratings 4 or 5 were combined (as an estimate of satisfied customers) there was very little difference based on Minority/Non-minority, Low-Income and Non-Low-Income, and LEP and Non-LEP Routes. This triggers no issues regarding Title VI. Cost of the Trip Rating Excellent Poor Don t Know Minority 49% 27% 15% 4% 2% 3% Non- Minority 42% 25% 19% 6% 4% 3% Low Income 48% 26% 16% 5% 2% 3% Non-Low- Income 44% 27% 17% 4% 5% 2% LEP 45% 30% 14% 5% 3% 3% Non-LEP 46% 27% 18% 4% 3% 3% Cost of the Trip Rating 4 or 5 Minority 76% Non- Minority 67% Difference 9% Low- Income 74% Non-Low- Income 70% Difference 4% LEP 75% Non-LEP 72% Difference 3% 77
78 Conclusion GRTC Transit System Level and Quality of Service Analysis This analysis showed that overall there is very little disparity in applying GRTC s service standards across minority, low-income, and LEP routes and their counterparts. For the most part, the standards were met. The standards that were not met for the system included: Weekday headways (average of 40 minutes instead of 30 minutes), Weekday service span (average of 16.7 hours instead of 18), On-time adherence (average of about 70.5% instead of 80%), and Directness of routing (average ratio of about 3.41 instead of 1.7). Weekday peak headways showed potential disparities between Minority and Non-Minority Routes and Low-Income and Non-Low-Income Routes, although the standard was not met for the Routes overall. Weekday non-peak headways showed potential disparities between LEP and Non-LEP Routes, although non-peak headways did meet the standard. In addition, directness of routing showed potential disparities between Minority and Non-Minority Routes Staff will investigate whether the LEP Routes should have. shorter headways and whether minority routes should have more direct routing between their terminus points. Additionally, there is one small area that does not meet the standard for service accessibility that should be examined to see if there are option for serving this area that meet the standard. Staff will also investigate whether econfiguring of the service standards to include factors that better reflect the demand for service would be a more appropriate way to measure compliance, and disparities. The on-board survey results showed very close similarity between the Minority, low-income and LEP Routes and their counterparts, with no response showing more than a 9% disparity between categories. The lowest-rated factor all around was cleanliness, with only about 50% - 60% of respondents reporting satisfaction with whether the bus was clean. The highest rated aspect was driver helpfulness, with between 70% and 80% of respondents showing satisfaction. 78
79 GRTC Transit System Level and Quality of Service Analysis Appendices 79
80 GRTC Transit System Level and Quality of Service Analysis Appendix A Minority, Low-Income, and LEP Areas 80

81 81 GRTC Transit System Level and Quality of Service Analysis

82 82 GRTC Transit System Level and Quality of Service Analysis

83 83 GRTC Transit System Level and Quality of Service Analysis
84 GRTC Transit System Level and Quality of Service Analysis Appendix B Transit Accessibility Maps 1. Household Density in Local Service Area 2. Household Vehicle Access in Local Service Area 3. Service Standards by Household/Vehicle Density 4. Places of Employment by Number of Employees 84

85 GRTC Transit System Level and Quality of Service Analysis 85

86 86 GRTC Transit System Level and Quality of Service Analysis

87 87 GRTC Transit System Level and Quality of Service Analysis

88 88 GRTC Transit System Level and Quality of Service Analysis
89 GRTC Transit System Level and Quality of Service Analysis Appendix C Average Headways by Route October 2015 Service Booking 89
90 Route Overall Average Peak Average GRTC Transit System Level and Quality of Service Analysis WEEKDAY SATURDAY SUNDAY Off Peak Average Comments Overall Average Comments Overall Average No Saturday Service No Sunday Service *Mid-day short trip *No midday service *No midday service *No midday service No Saturday Service No Saturday Service No Saturday Service No Saturday Service 85.7 *No mid-day service. No Sunday Service No Sunday Service No Sunday Service No Sunday Service *No midday service 41.4 *No mid-day service Comments *Limited mid-day service. *Limited mid-day service. 90
91 Route Overall Average Peak Average GRTC Transit System Level and Quality of Service Analysis WEEKDAY SATURDAY SUNDAY Off Peak Average Comments Overall Average Comments Overall Average Comments N/A *Only 1 trip made during offpeak hours (05:59-06:53) No Saturday Service No Sunday Service N/A 47.5 *No trips during peak hours No Saturday Service *No mid-day service No Sunday Service No Sunday Service *Limited mid-day service No Saturday Service No Sunday Service *Limited mid-day service No Saturday Service No Saturday Service No Sunday Service No Sunday Service No Sunday Service *Limited morning service. 91
92 GRTC Transit System Level and Quality of Service Analysis Appendix D Average Vehicle Load by Route January 2015 Service Booking 92
93 GRTC Transit System Level and Quality of Service Analysis Weekday Saturday Sunday Max Load Load Duration Max Load Load Duration Max Load Load Duration Route Patron Seats 70% 100% Patron Seats 70% 100% Patron Seats 70% 100% % 0.3% % 0.3% % % 0.4% % % % 0.1% % % % % % % 5.9% 0.8% 34 92% 5.4% 0.6% 25 67% 1.10% % 0.7% %. 8 21% % % % 0.1% % % 1.7% 0.1% %. 7 26% % % 0.4%. 9 36% 0.10% % 2.1% 0.1% 25 66% 1.0% 0.1% 20 54% 0.30% % 1.6% 0.1% 18 50% % % 2.0% 0.2% 29 77% 1.9% 0.1% 24 63% 0.10% %. 9 24% % % 2.5% 0.2% 26 70% 2.5% % 0.10% % 0.6% % 0.3% % 0.10% % 0.5% % 0.1% % %. 8 22% % % 0.6% % 0.1% % % 0.1% % 0.2% % % 0.1% % 6.5% 0.6% 29 77% 4.6% 0.9% % % 0.2% % 0.50% % 0.3% % 0.7% % 0.40% % 2.7% 0.1% 18 47% 0.4% % 3.2% 0.4% % 2.0% 0.1% 25 67% 2.1% % 0.20% % 1.8% 0.1% 19 51% 0.2% % % 0.5% % 1.7% % 0.8% % % 0.6% % % 0.20% % 0.1% % %. 6 21%.. 93
94 GRTC Transit System Level and Quality of Service Analysis Appendix E Service Span by Route October 2015 Service Booking 94
95 95 GRTC Transit System Level and Quality of Service Analysis WEEKDAY SATURDAY SUNDAY Route Start End Span Start End Span Start End Span 1 5:21 0:07 18:46 5:58 23:56 17:58 5:58 23:56 17:58 2 5:42 1:10 19:28 6:12 0:30 18:18 6:12 0:30 18:18 3 5:03 1:37 20:34 5:02 0:34 19:09 5:44 0:34 18:50 4 5:21 1:01 19:41 5:25 0:58 19:33 6:11 0:59 18:48 6 5:32 2:30 20:58 5:30 2:27 20:57 5:30 1:26 19:56 7 5:42 20:17 14:35 No Service No Service 10 5:02 1:00 19:58 6:06 0:38 18:32 6:03 0:38 18: :14 17:40 9:26 No Service No Service 16 5:25 20:15 14:50 No Service No Service 18 6:40 19:40 13:00 No Service No Service 19 6:10 19:23 13:13 No Service No Service 21 5:38 18:21 12:43 6:20 17:10 10:50 6:13 17:11 10: :20 23:50 18:30 5:33 22:17 16:44 5:55 21:11 15: :05 1:03 19:58 5:25 0:30 19:13 5:24 0:56 19: :08 0:53 19:45 5:25 0:51 19:26 5:00 23:50 18: :31 3:10 21:39 5:42 2:52 21:10 6:01 1:01 19: :25 0:37 19:21 5:44 0:39 18:55 5:44 0:40 18: :21 0:45 19:43 6:00 0:42 18:42 6:15 0:39 18: :15 0:13 18:58 5:55 0:09 18:14 6:41 0:06 17: :15 1:10 19:55 6:22 0:42 18:20 6:44 0:40 17: :11 19:14 13:03 5:58 18:28 12:30 5:58 18:28 12: :49 23:24 18:35 4:54 23:01 18:07 4:51 22:06 17: :13 23:46 18:33 5:19 23:52 18:33 5:24 23:37 18: :59 17:21 11:22 No Service No Service 60 5:00 19:25 14:25 6:45 19:05 12:20 6:48 18:57 12: :41 0:42 19:01 5:50 0:06 18:16 5:36 0:06 18: :22 1:19 9:57 5:00 0:44 19:44 5:17 0:49 19: :00 22:57 17:57 7:26 22:02 14:36 No Service 68 4:48 20:08 15:20 No Service No Service 70 6:05 0:00 17:55 6:05 23:28 17:23 9:32 22:46 13: :25 20:01 14:36 6:34 20:02 13:28 5:57 19:51 13: :42 23:40 17:58 No Service No Service 73 5:03 0:58 19:55 6:07 1:26 19:19 6:07 1:26 19: :42 1:22 19:40 5:55 0:01 18:06 5:55 0:01 18: :35 18:30 11:55 No Service No Service 93 6:15 19:01 12:46 No Service No Service 101 9:00 20:06 11:06 9:00 18:16 9:16 No Service
96 GRTC Transit System Level and Quality of Service Analysis Appendix F FY2015 On-time Performance by Route 96
97 Route Jul- 14 Aug- 14 GRTC Transit System Level and Quality of Service Analysis FY2015 On-time Performance by Route (% by timepoint served) Sep- 14 Oct- 14 Nov- 14 Dec Jan- 15 Feb- 15 Mar- 15 Apr- 15 May- 15 Jun- 15 Jun
98 GRTC Transit System Level and Quality of Service Analysis Appendix G Vehicle Assignment Data by Route 1. October 2014 Sample 2. January 2015 Sample 98
99 GRTC Transit System Level and Quality of Service Analysis Route Trips Counted Total Age-trips Average Age
100 GRTC Transit System Level and Quality of Service Analysis Route Trips Counted Total Age-trips Average Age
101 GRTC Transit System Level and Quality of Service Analysis Appendix H Transit Amenities in the Local Service Area 1. Amenities in Minority Areas 2. Amenities in Non-Minority Areas 3. Amenities in Low-Income Areas 4. Amenities in Non-Low-Income Areas 5. Amenities in LEP Areas 6. Amenities in Non-LEP Areas 101
102 GRTC Transit System Level and Quality of Service Analysis 102
103 103 GRTC Transit System Level and Quality of Service Analysis
104 GRTC Transit System Level and Quality of Service Analysis 104

105 105 GRTC Transit System Level and Quality of Service Analysis
106 106 GRTC Transit System Level and Quality of Service Analysis

107 107 GRTC Transit System Level and Quality of Service Analysis
108 GRTC Transit System Level and Quality of Service Analysis Appendix I Average Bus Stop Spacing by Route (Average by Variant) 108
109 GRTC Transit System Level and Quality of Service Analysis Route Average Feet
110 GRTC Transit System Level and Quality of Service Analysis Appendix J Transfer Frequency by Route Average March 2015 GFI Farebox Sample 110
111 GRTC Transit System Level and Quality of Service Analysis Route Total Ridership Transfers Used Percent Transfer 1 11,805 4, % 2 19,207 5, % 3 15,485 4, % 4 12,102 4, % 6 67,787 23, % 7 23,807 5, % 10 10,625 3, % 11 2, % 16 6,541 1, % 18 4, % 19 4,752 1, % 21 1, % 24 8,953 2, % 32 44,864 12, % 34 32,845 9, % 37 51,173 12, % 41 10,060 3, % 43 25,027 8, % 44 16,997 6, % 45 21,632 6, % 51 3, % 52 9,882 3, % 53 11,401 2, % % 60 30,607 7, % 61 14,037 3, % 62 5,361 1, % 63 16,133 4, % 68 13,528 3, % 70 18,361 4, % 71 16,056 4, % 72 4,823 1, % 73 23,516 7, % 74 26,418 4, % 91 8,051 1, % 93 1, % 101 1, % 111
112 GRTC Transit System Level and Quality of Service Analysis Appendix K Directness of Routing (Average by Variant) October 2015 Service Booking Sample 112
113 GRTC Transit System Level and Quality of Service Analysis Route Route Name Inbound Outbound Total 1 Monument Actual Distance Traveled (miles) Direct Length (EOL to EOL) Directness Ratio Weekdays until 7p Nights & Weekends Patterson Weekdays until 7p Nights & Weekends Robinson/S Meadow Robinson/ S Belmont Broad Seven Pines Counter-Clockwise Loop Riverview Clockwise Loop Weekends & Weekdays before 8a & after 5p Weekdays 8a-6p Oliver Hill Grove A.M. Peak & P.M. Peak Henrico Govt. Shuttle Mid-Day A.M. Loop P.M. Loop Pemberton Brook Azalea Crestwood/Westbrook Base Route Via Westwood & Hamilton- Monday through Friday Only Via Technical Center- Monday through Friday Only Ginter Park Weekend
114 Route Route Name Inbound Outbound Total GRTC Transit System Level and Quality of Service Analysis Direct Length (EOL to EOL) Directness Ratio 34 Highland Park Chamberlayne Ave Church Hill/Oakwood Fairmount/Whitcomb Fairmount/Fairfield Jefferson Church Hill/Briel E Main/Montrose A.M. Loop P.M. Loop E Main/Darbytown South Laburnum Hull Street/Chippenham Mall Monday through Friday Weekend Midlothian/Crutchfield Hull Street/Southwood 63 Weekday Saturday Sunday Midlothian/Chippenham Square Weekdays & Saturday Select Trips Via Centura College Broad Rock/Walmsely Forest Hill/Stony Point Weedays & Saturday Sunday trips Forest Hill to Stony Point Forest Hill/Jahnke Sunday to Chippenham Hospital Weekday & Saturday to Spring Rock Green Weekday Peak Service
115 Route Route Name Inbound Outbound Total GRTC Transit System Level and Quality of Service Analysis Direct Length (EOL to EOL) Directness Ratio 72 Ruffin Rd Ampthill Oak Grove Monday through Friday before 6pm Nights & Weekends Laburnum Connector Azalea Connector 101 AM Routing PM Routing Southside Plaza/Belt Blvd Connector Starting from Southside Plaza Starting from Crutchfield Late afternoon trips
116 Appendix G: Title VI Survey and Results GRTC Transit System 2016 Program Update 116
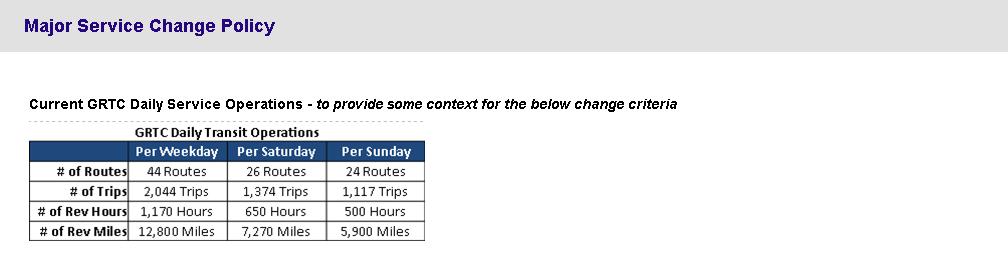
117 117 1
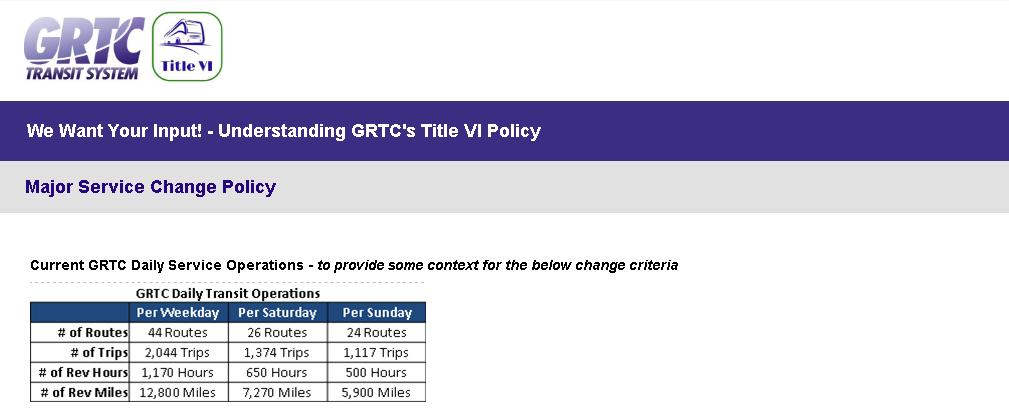
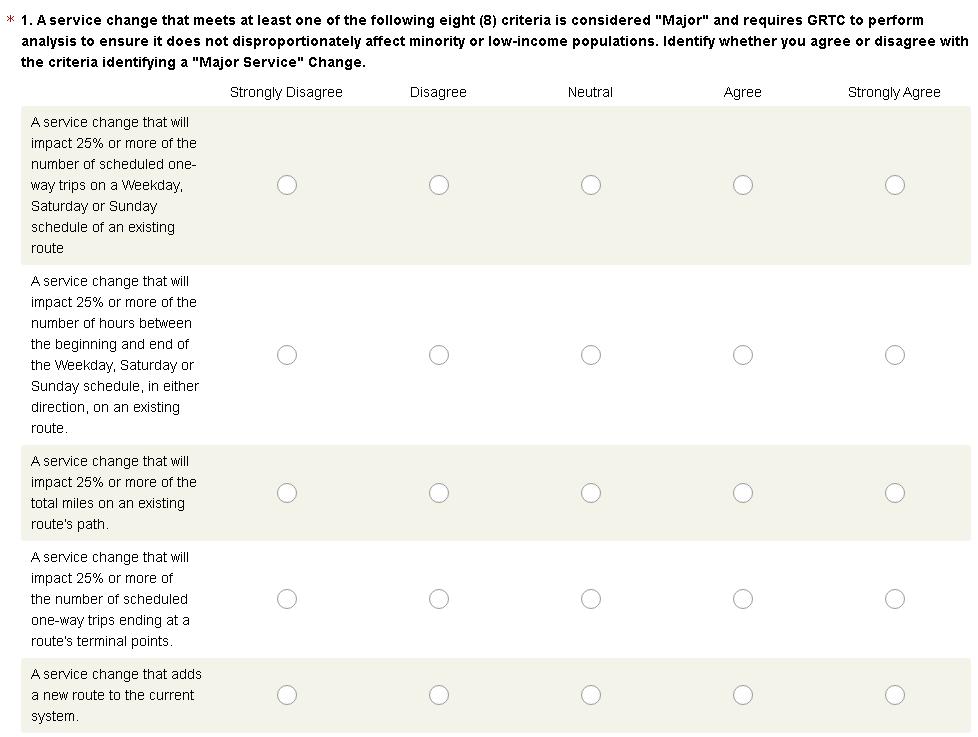
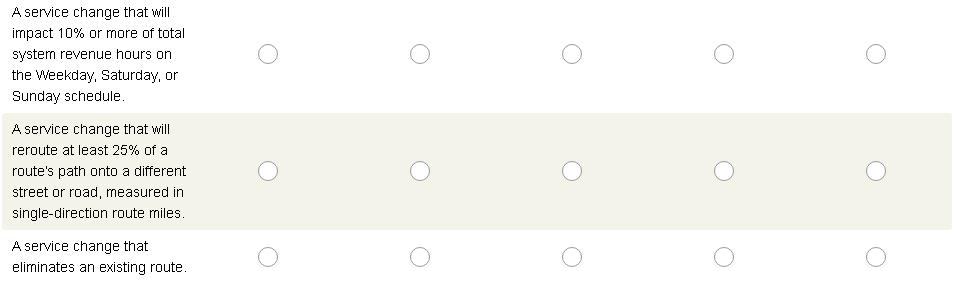
118 118 2
119 119 3
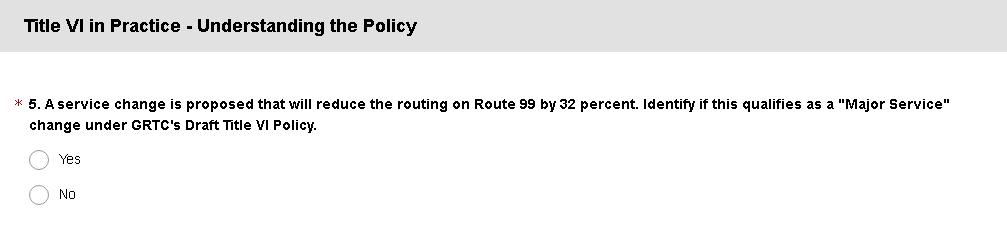
120 120 4
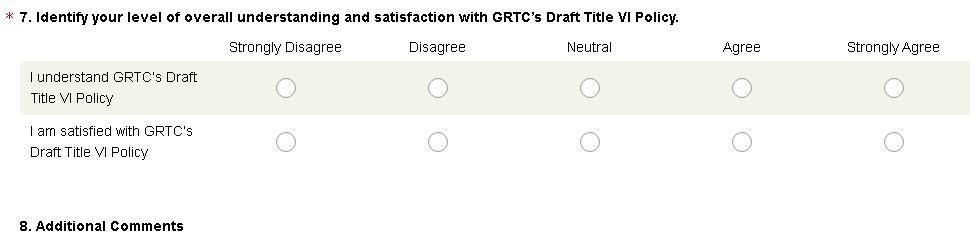
121 121 5
122 GRTC Transit System and Service Equity - Understanding GRTC's Draft Title VI Policy Survey Results Overview As part of the 2016 Title VI Program Update, GRTC Transit System requested feedback from the public on its Draft Major Service Change, Disparate Impact, and Disproportionate Burden Policies. Title VI refers to the Title VI of the Civil Rights Act of 1964, which prevents discrimination based on race, color, or national origin in any federally-funded program or activity. The Federal Transit Administration (FTA) provides guidelines to public transit agencies on how to comply with Title VI, including requirement to define what a major service change is, and how to ensure these changes are fair for all customers. The FTA requires the policies to set a threshold for how much a change in service can affect minority populations and low-income populations in the service area before it would be considered a disparate impact (minority populations) or disproportionate burden (low-income populations). This report summarizes the feedback results. Methodology An eight question survey was designed using Survey Monkey that described the Draft Major Service Change, Disparate Impact, and Disproportionate Burden Policies. Using a likert scake, the survey identifed the degree respondents agreed or disagreed with the draft policy criteria, as well as their overall understanding and satisfaction with the draft policy. The survey was open between August 3rd and August 22nd. The survey could be accessed from a link on the GRTC website. Hardcopies of the survey were distributed at the Temporary Transfer Plaza on August 17th. Two public meetings were held at City Hall on August 17th allowing individuals to ask questions about the draft policies, and take the survey in-person. Results 82 individuals responded to the Major Service Change Policy question. 63 individuals responded to the remainder of the survey questions. 58% to 69% of respondents either strongly agreed or agreed with the eight proposed Major Service Change criteria. More than 50% of respondents either strongly agreed or agreed with the proposed Disparate Impact and Disproportionate Burden Policies. 47% of individuals expressed overall understanding of all the proposed policies and 44% expressed overall satisfaction with the proposed policies. Around 40% of respondents identified with being neutral about their overall satisfaction with the proposed policies. 17% disagreed or strongly disagreed about being overall satisfied with the proposed policies. The most common theme in the open ended comments were that the policies were too confusing. Next Steps The results expressed that the majority of respondents were in agreement with the policies, therefore GRTC administration will move the draft policy forward for Board Approval on September 20th. Pending board approval, the policy will be adopted and put into place for the next three years. 122 Updated: August 26,

123 GRTC Transit System and Service Equity - Understanding GRTC's Draft Title VI Policy Survey Results Major Service Change Policy There are eight proposed Major Service Change Policy Criteria. Individuals were asked to identify whether they strongly agreed, agreed, were neutral, disagreed, or strongly disagreed with each of them. The below table displays the results. Of the 82 individuals who responded to this question, the majority strongly agreed or agreed with each of the eight criteria. The agreement range was from 58% to 69% for the various criteria. A service change that will impact 25% or more of the number of scheduled oneway trips on a Weekday, Saturday or Sunday schedule of an existing route 32% 37% 13% 7% 11% A service change that will impact 25% or more of the number of hours between the beginning and end of the Weekday, Saturday or Sunday schedule, in either direction, on an existing route. 32% 31% 17% 9% 11% A service change that will reroute at least 25% of a route s path onto a different street or road, measured in single-direction route miles. 32% 32% 22% 8% 8% A service change that will impact 25% or more of the total miles on an existing route s path. 26% 33% 24% 9% 9% A service change that will impact 25% or more of the number of scheduled oneway trips ending at a route s terminal points. 25% 39% 16% 10% 10% A service change that eliminates an existing route. 38% 21% 15% 7% 20% A service change that adds a new route to the current system. 34% 33% 19% 8% 8% A service change that will impact 10% or more of total system revenue hours on the Weekday, Saturday, or Sunday schedule. 18% 40% 31% 11% 0% 10% 20% 30% 40% 50% 60% 70% 80% 90% 100% Strongly Agree Agree Neutral Disagree Strongly Disagree Updated: August 26,
124 GRTC Transit System and Service Equity - Understanding GRTC's Draft Title VI Policy Survey Results Disproportionate Burden Policy "Disproportionate burden refers to a neutral policy or practice that disproportionately affects low-income populations more than non-low-income populations. A finding of disproportionate burden requires the recipient evaluate alternatives and mitigate burdens where praticable" (FTA). The GRTC proposed threshold shall be a 20- percentage point difference between: 1) The percentage of impacts borne by low-income populations in the proposed service change; 2) The percentage of low-income populations in GRTC's service area. Disparate Impact Policy "Disparate impact refers to a neutral policy or practice that disproportionately affects members of a group identified by race, color, or national origin, where the recipient's policy or practice lacks substantial legitimate justification, and where there exists one or more alternatives that would serve the same legitimate objectives but with less disproportionate effect on the basis of race, color, or national origin (FTA)". The GRTC proposed threshold shall be a 20-percentage point difference between: 1) The percentage of impacts borne by minority populations in the proposed service change; 2) The percentage of minority populations in GRTC's service area. Respondents were provided the above descriptions and instructed to identify whether they strongly agreed, agreed, were neutral, disagreed, or strongly agreed with the policy thresholds of 20-percentage points. More than 50% of the 63 respondents either strongly agreed or agreed with the policy thresholds. Around 30% were neutral. The results are displayed in the chart below. Disparate Impact 14% 41% 29% 8% 8% Disproportionate Burden 13% 40% 30% 13% 5% 0% 20% 40% 60% 80% 100% Updated: August 26, 2016 Strongly Agree Agree Neutral Disagree Strongly Disagree 3 124


125 GRTC Transit System and Service Equity - Understanding GRTC's Draft Title VI Policy Survey Results Understanding the Policy Two hypothetical questions were asked to infer the respondent's understanding of the three policies. 63 individuals responded to both questions, 80% selected the correct answer to the question determining whether the hypothetical change would be identified as a major change under the draft policy. 30% of respondents selected the correct answer of Disparate Impact for the question requesting whether the analysis of the major change triggered a disparate impact or disproportionate burden thresholds. The results below display trends in the respondent's selecting the correct answer to the questions. A service change is proposed that will reduce the routing on Route 99 by 32 percent. Identify if this qualifies as a "Major Service" change under GRTC's Draft Title VI Policy. 20% Yes No 80% The results of the analysis by block group show the proposed "major service" change adversely affects minority populations 22% greater than non-minority populations, and there is a 0% difference in the effects on low-income and non-low income populations 35% 22% 30% 13% Disparate Impact (Only) Disproportionate Burden (Only) Disparate Impact and Disproportionate Burden Neither Updated: August 26,

126 GRTC Transit System and Service Equity - Understanding GRTC's Draft Title VI Policy Survey Results Overall Understanding and Satisfaction Individuals were asked to identify their level of overall understanding and satisfaction with GRTC's Draft Title VI Policy. 47% of the 63 respondents either strongly agreed or agreed with the statement of understanding the policy. 27% of individuals selected neutral. 44% of the 63 respondents strongly agreed or agreed with the statement of satisfaction. This percent was closely followed by 39% selecting neutral. Disagree and Strongly Disagree were selected the least by respondents. The results are displayed in the chart below. I understand GRTC s Draft Title VI Policy 16% 31% 27% 13% 13% I am satisfied with GRTC s Draft Title VI Policy 10% 34% 39% 6% 11% 0% 10% 20% 30% 40% 50% 60% 70% 80% 90% 100% Strongly Agree Agree Neutral Disagree Strongly Disagree 126 Updated: August 26,
127 GRTC Transit System and Service Equity - Understanding GRTC's Draft Title VI Policy Survey Results Major Service Change Policy Open Ended Statements 29 of the 82 respondents provided open ended feedback. There was not a consistent theme among the open ended statements. 1 People work on weekends too! 2 Enough changes have already been put in affect to change more wouldn't be correct. 3 Because people are on schedules and everyone does not drive. You all doing all these changes but when will you all find a new location for the transfer plaza. There is not enough shelters, clearly there is no 4 consideration for your olders and disables...they are out in the heat For the last 2 how far away would the stops be moved from where they are how how much further will I have to walk before I'm able to get to my stop 5 coming into work or going home in the evening. Which route(s) are being spoken of for possible elimination? structure of the survey. I am for public transportation and one that serves the community. I am an advocate for reduced fare for those who are in a lower 6 economic situation. I would be willing to pay more so those who have either no means or less means have it easier for them to access public 7 I do believe this is a consideration that will adversely affect the minority population, as well as other GRTC patrons 8 There is a need for transportation in these areas. Without adequate groceries and shopping as well as employment in these area, it pertinent to remain you change it anymore how are we going to eat and sleep comfortably? The county already stopped us from getting at least decent jobs like myself I 9 attend college during the day. I can't even get s part time job out in the county because it wouldn't be any hours and a waste of my time! But I do feel as 10 The questions were hard to understand if you are not familiar with transportation information and or data. Hard to give you feedback because of the transportation. More buses should be running on the weekend you have to understand most people don't drive and our only transportation is the public bus system. If though that the routes for example The 6 should run similar to the 1 that will eliminate stopping at every corner when traveling a far distance as such. People just hop on the 6 because it's going down broad not being considerate of people actually going down to Willow lawn Because it's already hard enough change's now that makes it hard for people to get around,as is now you want to make more changes? Is it better for us or for Ya'll?? The changes will be putting people in danger when they have to walk a long distants to catch bus in a high crimes areas. Like changing the stop Chambers and Bowens.I catch bus to early to be walking these streets alone at 5:30 am. This is trouble waiting to happen.been catch this bus for 28 years and i pay 60 dollar a month for a bus pass to walk blocks for the bus.yes i got a problem with that.. I don't understand what you are asking. The link to the survey identified it as System and Service Equity Understanding GRTC s 12 Title VI Policy". I don't know what that is. 13 I disagree because people without cars would be limited to only certain areas to work and shop. The term "major" implies majority, which as described above as 10% or 25% does not seem to rise to the level of a major change. If however, small 14 incremental changes in those same percentages continue to be made, I would likely change my opinion. I believe all of these changes represent major service changes. Changes to am areas access to public transit can greatly enhance or harm a person's life by 15 Updated: August increasing 26, 2016or decreasing access
128 GRTC Transit System and Service Equity - Understanding GRTC's Draft Title VI Policy Survey Results 16 Its hard enough already I disagree with eliminations because people needs the buses to get where they need to go, jobs, church, school, food shopping all kinds of things. When 17 you can't afford a car the bus is very important. 18 I think that common sense should be used not just some criteria u are dealing with people not crterias I believe that more the route 72 needs two run seven day's out of the week because u have a lot of Senior citizens that live down Ruffin road and so the 19 people that work at Philip Morris can have a way to work at night instead of having to walk from bells road I also want to say that we need two buses on the route 73 after seven pm on the weekends and that the route 73 needs more time on it on the weekends 20 Stop changing routes.have buses route to white oak village stores more often. Adding a route, or changing it's length may not automatically trigger a review if it improves access. Reducing the frequency, location, or duration of 21 service may trigger a review. The severity has less to do with the percentage of change to the route than the impact on specific populations. 22 THIS IS TOO COMPLICATED. JUST SAY WHAT YOU WANT TO DO, IN PLAIN ENGLISH! 23 No cuts Rider Needs Transportation. 24 Adding service also seems like less of a concern (though I suppose with fixed budget, it presumably occurs by cutting or reducing another line?). 25 The system is faulty enough!!!! 26 People live entire lives using public transit. All changes can be major. Eliminating a route on its own is not necessarily a major change. For example, eliminating the 53 while extending the 52 to cover the few blocks the 53 currently covers that the 52 doesn't is not a major change, especially as the routes work in tandem (and are even on the same printed schedule). Given the short walk to Williamsburg Ave, eliminating the 53 and doubling the frequency of the 52 without changing its routing might also not be major. I would say most route eliminations are, but especially when routes are operated in tandem, as in one route with two branches (e.g. the 1 and the 2, or both parts of the 32), eliminating one branch of one route (the 32) is not functionally different from eliminating one branch of two routes (the 1-2). They may or may not be major changes (removing the 37 would certainly be, for example!), but it is not a sufficient condition on it's own to signify a major change. I use the route elimination as an example, because it's seemingly the most drastic. But none of the proposed changes are necessarily major. 27 For example, if you added or removed just one trip on the 56, that would be considered major, because it would be +33%/-50%, but adding or removing one bus a weekday would not by most people be considered major. I don't know what would be a good measure of major change, and maybe this is the best that can be reliably used, but I don't think any individual criteria necessarily implies a major change. Criteria 2 is unclear about whether you mean the total number of service hours. Criteria 3 seems to be addressing the same thing as Criteria 7 but Criteria 28 7 is clearer. Criteria 1 and Criteria 4 seem to be addressing the same problem but Criteria 1 is clearer % is too low a threshold but something affected a quarter of the ridership would appear to be important. In fact, instead of looking at buses (trips, miles, hours), it might be better to look at people. Does the number of people served by any service increase or decrease over a certain amount? Does the number of people served by frequent service (establish a metric, say every 15 minutes) increase or decrease? Same for span (people served by service for, say, 80+ hours a week)? Establish a walk shed of 1/4 to 1/2 a mile. If two routes travel parallel a block apart and one is eliminated, access to service may not be reduced. that should be looked at. It might be easier just to look at bus numbers, because that's easier to use than census data, but it's the effect on people Updated: August 26,
129 GRTC Transit System and Service Equity - Understanding GRTC's Draft Title VI Policy Survey Results Disparate Impact and Disproportionate Burden Policy Open Ended Statements 12 of the 63 respondents provided open ended feedback. Two of the 12 respondents stated they thought the proposed 20 percentage threshold was to great (comments 5 and 6). Five respondents stated they thought the policies were too complicated (comments 2, 3, 5, 8, and 10). 1 When the routes were re-routed it already affect many people to change it more wouldn't be fair. Again, please make these surveys more clear with your wording so not to confuse the public. This survey does an injustice to the public and is not meant 2 to inform, but to confuse. If you have future opinion surveys, please make them user friendly to all of the public so you can gather actual data and information and not confusing data and or input to support possibly a hidden agenda. 3 minorities have far less capabilities to secure other methods of transport 4 I need GRTC to get back an forth to work!!! 5 This is a little heavy for a layperson. I don't really have an understanding of the consequences of the definition of the policy, and have no context at all. 20 percentage points seems like a lot. Shouldn't the percentage of impact be the same as the percentage of the population? A 10% difference would 6 make more sense to me. 7 I think the threshold should be smaller, and public transit should actively seek to provide access in low-income areas. 8 To complicated a criteria 9 Low income is low income NO matter the person's race, sex, nationality etc. 10 TOO COMPLICATED 11 Changes SHOULD take rider's convienence first! I think this language is good. If it's viable to not disproportionately impact or burden protected populations, that should be done. But if there are important goals to fill and there is a burden, especially a small one, that just cannot be viably relieved without compromising the objectives of the 12 change, then it should be able to go through. But, as mentioned in the last step, we should only get to this question if the change is major, which should be determined based on if the change largely affects people, not buses. Updated: August 26,
130 GRTC Transit System and Service Equity - Understanding GRTC's Draft Title VI Policy Survey Results Additional Comments 1 Better access times 2 None I am a highly educated individual and have concerns about the validity of the responses you will get in this survey. 1) The topic is extremely difficult to understand. It should be described more clearly. And there should be links to supporting information and examples...optional links, so those who don't feel the need to see supplemental info don't get tired of the survey and quit before it ends. 2) the questions are poorly worded. "Identity your level of 3 understanding" should be on a numerical scale. Instead, one must agree or disagree with a sentence. Why? The first question made it very hard to tell what I was exactly agreeing or disagreeing to or with. Frankly, I'd check with some survey research experts to confirm validity before relying on this data. 4 Please make these surveys more understandable and not confusing. 5 Need more time on every route that service broad street east end and South side Wording is not clear enough. Not everyone has high school or further education degrees. Some have dropped out of school and have to take bare 6 minimum wage or less jobs. Some employers know how to use the labor laws to underpay their employees legally. 7 Have buses run more often. Have buses go out to chesterfield town center and often and weekends. It seems like a sharper (if harder to measure) way to focus on affect is to highlight riders/potential riders affected than to focus just on how much a given route or amount of service time might change. I realize that is probably harder to measure, but seems like it should maybe be one of the criteria? Maybe 8 there is a threshold # of riders who would be effected (or more precisely, threshold # of boardings?)? Just a thought. Seems like the people are the key thing to focus on more directly than just alteration to the route? I do think 20% is good line for Disparate Impact and Disproportionate Burden. Thank you! On question 5, I thought the question was "should it", not "would it". I think in most cases a 32% reduction would be a major change, but if buses are going from running every 5 minutes to every 7.5, or every 8 hours to every 12, that's not major, while going from every 20 minutes to every 30 or every 60 to every 90 would be a major change. Again, disparate impact and disparate burden are well written, but the trigger for getting there should be 9 more contextual and based on people, not buses. While there may be a concern that people may lose service and civil rights may be violated, if GRTC directors are properly doing their job, changes that badly violate civil rights wouldn't even be proposed once the impact was found. We the citizens, through our elected representatives appointing these directors, can affect what should or shouldn't happen. 130 Updated: August 26,
131 GRTC Transit System 2016 Program Update Appendix H: Fare Equity Analysis: Chesterfield Express Routes 131
132 Fare Equity Analysis Chesterfield Express Route Fare Increase (July 1, 2014 proposed effective date) The purpose of a Fare Equity Analysis is to determine if a proposed fare change is equitable for all customers in light of federal civil rights legislation and guidance (for more information, refer to FTA Circular 4702.B and GRTC s Title VI Program document). The analysis seeks to determine the possible impacts of the proposed fare change. If any discriminatory effects are found, action must be taken to find alternatives to the proposal. If there are no alternatives, work must be done to mitigate the impacts as much as possible. GRTC follows the analysis based on the questions as outlined below. For questions or comments please contact: Title VI Officer Director of Planning, Scheduling, and Government Relations GRTC Transit System 301 East Belt Blvd Richmond VA, As soon as any change in fare or service is proposed, describe in detail the proposed change. Be detailed in describing what routes, schedules, and service indicators (level or quality of service) would be affected. For example, will this be an across-the-board change or only affect certain routes? Also describe the need or impetus for the change. The proposed change is to increase the fare for all Chesterfield Express routes to $6.00 per oneway trip. This proposal only applies to routes: 81x, Chesterfield Express (current fare $3.50), and 82x, Commonwealth 20/Swift Creek Express (current fare $4.00). The fare increase would apply to all trips/times on the above routes. The fare increase was proposed in May 2014 by Chesterfield County Government Staff, in response to a projected shortfall of $163,000 in Chesterfield County s FY2015 budget. These two 132 Page 1 of 13
133 routes are Chesterfield s only fixed route service through GRTC. There are no local Chesterfield Routes. 2. Is this considered a major fare or service change under the policy? Explain. If no, keep a record of question 1 on file for records management. If yes, continue with the analysis. As with any proposed fare change of any amount, GRTC s Major Fare and Service Change Policy applies. Therefore a fare equity analysis should be conducted. 3. What is the difference between the existing service and proposed service for those impacted by the change? Analysis of possible adverse effects: a. Determine the affected area. 133 Page 2 of 13
134 Due to the nature of express bus service, the affected area is more difficult to discern than for a local route. This is because express routes mainly serve to offer commuting choices rather than comprehensive transit service. Express routes are run at peak hours only, and have minimal stops. They do not qualify for half-fares. Most riders drive to a park-and-ride location, and ride the bus to Richmond s central business district (downtown), and back at the end of the day. These riders have diffuse origins that span many census tracts, and only represent a tiny fraction of those tracts populations. Advice from FTA suggested using a three-to-five mile boundary of census block group data around park-and-ride locations to estimate ridership population. GRTC chose census block groups whose centroid was within a four-anda-half-mile radius in order to accommodate the irregular block group boundaries. As a method of confirming whether the 5-miles radius would adequately estimate the express route ridership-shed, the area was compared to a survey of riders of Henrico Express routes from January Survey takers on these routes were asked to provide their address to determine approximate origins for the riders. This analysis confirmed that a 3-5 mile radius was an accurate gauge of the ridership shed for express route riders based on geocoded addresses. These survey results also showed that there are a few riders who reverse commute from downtown to the park-and-ride area and travel to nearby destinations. However the vast majority (about 97%) follow the pattern from the suburban area to the CBD in the morning and back in the afternoon. Thus for this analysis the affected area is shown below: 134 Page 3 of 13
135 b. Describe the demographic and ridership data being used for the analysis and how it was collected. Demographic Data used in the analysis includes: US Census data: o 2010 population counts by Block Group, Chesterfield County o 2011 American Community Survey Data, Household Income Status by Census Tract, Chesterfield County o 2011 American Community Survey Data, Language Status for all people over age 14, Chesterfield County The US Census data is used to determine the total population and minority status of the population (non-minority defined as white, non-hispanic population). 135 Page 4 of 13
136 The American Community Survey Census Tract data is used to determine low income status (population living in households with less than 150% of poverty level) and LEP status (proportion over age 14 who speak a language, but who speak English less than very well ). Usually for a fare equity analysis, FTA suggests that ridership survey data rather than Census demographic data should be used. This is because in most transit systems, different fare media (ex. cash vs. stored-value card) vary in the single-trip fare cost. It is necessary to determine a) if there are differences in use of fare media by the population based on socioeconomic characteristics, and b) if the proposed changes affect users differently because of this condition. GRTC is satisfied with using demographic data instead of ridership data in this analysis for the following reasons: a) GRTC does not offer different fare rates of any type on express buses b) GRTC uses demographic data in its regular Title VI program in determination of minority and non-minority local routes. c. Describe how the data will be used to determine if the proposed change will have an adverse effect. The data will be used to determine if the proposed change will have any discriminatory or adverse effects, including disparate impact and disproportionate burden, on GRTC s ridership base for the purposes of Title VI. This will be done by comparing the demographic base of the Chesterfield express routes with the demographic base of Chesterfield County as a whole. This comparison group (Chesterfield County residents) was chosen because they could possibly be affected by the budget shortfalls, even if they are not current express route riders. Since there is no other transit service funded by Chesterfield County, there is no logical comparison group other than Chesterfield residents. City of Richmond and Henrico County census data were not used in comparison because these jurisdictions funds transit separately and any budgeting shortfalls in Chesterfield County would not affect other service. If the impacts of the changes (increased fare) affect certain groups more than others, it is possible that the below effects could occur: 136 Page 5 of 13
137 Disparate Impact (Minorities): GRTC defines a disparate impact as an impact that affects a protected population (based on race, color, or national origin) at a higher rate than the overall population. For example, if proportionately more minorities lived within the express route service area than in the comparison area, then there could be a disparate impact from a fare increase. Disproportionate Burden (Low-Income): A disproportionate burden is similar to a disparate impact, except the affected population is a low-income population rather than a minority population based on race, color, or national origin. A disproportionate burden would be found if a change impacted lowincome persons at a higher rate than as found in the comparison population. LEP: LEP (Limited English Proficiency) persons fall under Title VI protection. GRTC compares to see if the affected population s proportion of LEP persons is higher than the comparison population for possible disproportional effects. The above effects can be determined through demographic data or ridership data. GRTC uses demographic data. Ridership data would be the more appropriate data to use if GRTC had varying fare media costs. Some transit agencies offer many types of fare media (ex. Cash, swipecards, stored-value cards, day passes, month passes) with varying prices and riding privileges that result in varying costs for a one way trip. For example, someone who buys a stored value card may be offered a discounted per-trip cost than if they paid for fares with cash. Or someone may buy a month-long pass and ride as many times as they wish for one monthly rate. It is important to determine if the effects of the proposed fare change on various types of media will affect various populations differently, especially considering Title VIprotected classes. One theoretical example is that low-income households may be more likely to use cash fare than the general population. If the fare change raised prices on cash fares more than other fare media, there could be a disproportionate burden on the low-income population. 137 Page 6 of 13
138 d. Compare the location of the proposed change to the most recent demographic data on file. Is the affected area a minority, low-income, or LEP area according to the data? Before one can make the determination as to whether the location of the proposed change is considered a minority, low-income, or LEP area, one must determine the comparison population. FTA defines minority, low-income, and LEP areas as areas that have median levels of the respective characteristics that are higher than the median levels of the local service area. Since GRTC does not typically include express route ridership areas in the local service area calculations for the purposed of the Title VI system update, and since the impetus for the proposed fare increase comes from budget shortfalls in Chesterfield only, routes funded through other jurisdictions cannot be affected. Therefore it was determined that the comparison population for this analysis are the residents of Chesterfield County as a whole. Because this is a proposed express route-only fare increase, the affected ridership population is those who live in census block groups within a 4.5 miles radius of the Chesterfield express route park-and-ride lots. In this case, there is potential for a disparate impact or disproportionate burden if these areas had a higher proportion of minorities, LEP individuals, or low-income persons than the comparison population. e. Compare the ridership population that will be affected by the change as compared to the general ridership population. Could there be a potential disparate impact or disproportionate burden? Explain. Henrico Demographics Population (BG) Total % minority Median % Minority by BG %low-income (Census Tract) %LEP (Census Tract) Express Ridership area Chesterfield Residents % difference 161, ,236 n/a 19.5% 29.7% -10.2% 16.8% 24.8% -8% 12.2% 16.1% -3.9% 3.4% 4.3% -0.9% 138 Page 7 of 13
139 The analysis compared the express bus ridership base with the Chesterfield County resident base. The data shows that the express population base has lower proportions of minority, lowincome, and LEP persons than the County overall. f. Analyze the data to describe the details and extent of the possible impacts. i. Create maps showing the affected areas and demographic data along with route information The maps below show the affected areas within Chesterfield County. The first map shows the census block groups of people who could be impacted by an increase in express route fare (the Express Route Service Area). It shows the percentage of the population that is considered a minority under Title VI, by Census Block Group. 139 Page 8 of 13
140 The second map shows Census Tracts with the amount relative amount of low-income individuals. An individual is considered to be low-income if they live along or in a household making less than 150% of the poverty rate. It is a sliding scale, based on the year and household size. For example, for the 2011 data below, an individual living alone and making less than $17,226, or an individual living in a household of a family of four with two children making less than $34,218, would both be considered low-income. 140 Page 9 of 13
141 The last map highlights the percentage of persons by Census Tract who are considered to be Limited English Proficiency persons. 141 Page 10 of 13
142 ii. Create tables showing impacts of each type of change and the affected and overall ridership population Impacts of the proposed fare change: Current price per trip Proposed price per trip $ Difference % Difference Route 81x Cash $3.50 $6.00 $ % $5 Go Card $3.50 $6.00 $ % $10 Go Card $3.50 $6.00 $ % $25 Go Card $3.50 $6.00 $ % Swipe card $3.50 $6.00 $ % Elderly $3.50 $6.00 $ % Disabled $3.50 $6.00 $ % CARE $3.50 $6.00 $ % Transfer to Express from local ($1.50 fare) Transfer to Express from Local senior/disabled ($0.75 local fare, free transfer) $3.75 $6.25 $ % $3.00 $5.50 $ % Current price per trip Proposed price per trip $ Difference % Difference Route 82x Cash $4.00 $6.00 $ % $5 Go Card $4.00 $6.00 $ % $10 Go Card $4.00 $6.00 $ % $25 Go Card $4.00 $6.00 $ % Swipe card $4.00 $6.00 $ % Elderly $4.00 $6.00 $ % Disabled $4.00 $6.00 $ % CARE $4.00 $6.00 $ % Transfer to Express from local ($1.50 fare) $4.25 $6.25 $ % 142 Page 11 of 13
143 Transfer to Express from Local senior/disabled ($0.75 local fare, free transfer) $3.50 $6.00 $ % As shown above, the fare changes should not affect different socioeconomic groups differently since there are no differences in fare charges by media type. As seen in the table above, GRTC does not offer discounts on the price per trip on express routes based on type of fare media purchased. Trips are always the same price as the cash fare price. On local routes, qualified senior/disabled customers receive half price fares or free trips on local routes. They do not receive these privileges on the Chesterfield express routes that are subject to the proposed fare change. They are currently not charged the $0.25 transfer fee, but must pay the difference between the reduced fare and the express fare. Since half-fare trips are not required by FTA during peak times, and express routes are only run during peak times, it is within the GRTC s rights to require full-price fares on these express routes. GRTC is not proposing to alter this policy for this proposed fare change. Because of this fact, GRTC does not see that the fare change will affect different groups in disproportionate ways. g. Determine whether the proportion of minorities, low-income population is affected is significant when compared to the general population set (use thresholds as defined in each policy). If not, finalize the analysis and provide to the Board. If so, steps need to be taken to describe these negative effects and to develop alternative options that mitigate, avoid, or minimize these effects. GRTC s Disproportionate Burden and Disparate Impact Policies both currently use a 10% threshold for finding a significant difference between the respective protected population and the general population. For example, if the affected group has at least a 10% higher proportion of minorities or low-income people than the comparison group, it would be considered to be significant, and there is a strong chance that there would be a disproportionate burden or disparate impact. However, because it has been shown that the affected area in this case (the Express Route Service Area) has a lower proportion of minorities and low-income people than the Local Route Service Area, it is determined that neither a Disproportionate Burden nor a 143 Page 12 of 13
144 Disparate Impact would result the proposed fare changes. Therefore, GRTC sees no Title VIrelated reason to mitigate or find alternatives for the proposed fare change. h. Repeat the analysis for any alternative options. N/A i. Present the findings to the Board of Directors for review and acceptance. 144 Page 13 of 13
145 GRTC Transit System 2016 Program Update Appendix I: Service Equity Analysis: Chesterfield Express Routes 145
146 Service Equity Analysis Chesterfield Express Route Service Reduction (effective date February 2015) The purpose of a Service Equity Analysis is to determine if a proposed service change is equitable for all customers in light of federal civil rights legislation and guidance (for more information, refer to FTA Circular 4702.B and GRTC s Title VI Program document). The analysis seeks to determine the possible impacts of the proposed service change. If any discriminatory effects are found, action must be taken to find alternatives to the proposal. If there are no alternatives, work must be done to mitigate the impacts as much as possible. GRTC follows the analysis based on the questions as outlined below. For questions or comments please contact: Title VI Officer Director of Planning, Scheduling, and Government Relations GRTC Transit System 301 East Belt Blvd Richmond VA, As soon as any change in fare or service is proposed, describe in detail the proposed change. Be detailed in describing what routes, schedules, and service indicators (level or quality of service) would be affected. For example, will this be an across-the-board change or only affect certain routes? Also describe the need or impetus for the change. There is a possibility that the funding source for Routes 81x Chesterfield Express, and 82x Swift Creek/Commonwealth 20 Express will run out in early The funding source is the Chesterfield County Government and it is allocated through the County s yearly budget. In FY2015, the allocated amount was $163,000. The FY2015 funding is not enough to keep the current level of service for the entire fiscal year. For this reason, service must be either eliminated or reduced if more funding is not allocated. If more than two one-way trips are eliminated on either Route 81x or 82x, it would be considered a major service change. It would require a service equity analysis. 146 Page 1 of 11

147 2. Is this considered a major fare or service change under the policy? Explain. If no, keep a record of question 1 on file for records management. If yes, continue with the analysis. Any change of at least 25% in service hours or change in 25% of routing on a route is considered a major service change under GRTC s Major Fare and Service Change Policy. Under the policy, any route elimination is considered a major change. A fare and service equity analysis must be completed if there is any increase in fare or a major reduction in service. For Route 81x, this proposed change includes a 0% change in routing and fare, and a 60% change in the number of one-way trips per day (from 5 to 2 ). Therefore this is considered a major change, and a fare and service equity analysis is therefore required for these proposed changes. For Route 82x, this proposed change includes a 0% change in routing and fare, and a 25% change in the number of one-way trips per day (from 8 to 6). Therefore this is considered a major change, and a fare and service equity analysis is therefore required for these proposed changes. 147 Page 2 of 11
148 3. What is the difference between the existing service and proposed service for those impacted by the change? Analysis of possible adverse effects: a. Determine the affected area. Due to the nature of express bus service, the affected area is more difficult to discern than for a local route. This is because express routes mainly serve to offer commuting choices rather than comprehensive transit service. Express routes are run at peak hours only, and have minimal stops. They do not qualify for half-fares. Most riders drive to a park-and-ride location, and ride the bus to Richmond s central business district (downtown), and back at the end of the workday. These riders have diffuse origins that span many census tracts, and only represent a tiny fraction of those tracts populations. Advice from FTA suggested using a three-to-five mile boundary of census block group data around park-and-ride locations to estimate ridership population. GRTC chose census block groups whose centroid was within a four-anda-half-mile radius in order to accommodate the irregular block group boundaries. As a method of confirming whether the 5-miles radius would adequately estimate the express route ridership-shed, the area was compared to a survey of riders of Henrico Express routes from January Survey takers on these routes were asked to provide their address to determine approximate origins for the riders. This analysis confirmed that a 3-5 mile radius was an accurate gauge of the ridership shed for express route riders based on geocoded addresses. Thus for this analysis the affected area is shown below: 148 Page 3 of 11
149 b. Describe the demographic and ridership data being used for the analysis and how it was collected. Demographic Data used in the analysis includes: US Census data: o 2010 population counts by Block Group, Chesterfield County o 2011 American Community Survey Data, Household Income Status by Census Tract, Chesterfield County o 2011 American Community Survey Data, Language Status for all people over age 14, Chesterfield County The US Census data is used to determine the total population and minority status of the population (non-minority defined as white, non-hispanic population). 149 Page 4 of 11
150 The American Community Survey Census Tract data is used to determine low income status (population living in households with less than 150% of poverty level) and LEP status (proportion over age 14 who speak a language, but who speak English less than very well ). GRTC is satisfied with using demographic data instead of ridership data in this analysis for the following reasons: a) GRTC does not offer different fare rates of any type on express buses b) GRTC uses demographic data in its regular Title VI program in determination of minority and non-minority local routes. c. Describe how the data will be used to determine if the proposed change will have an adverse effect. The data will be used to determine if the proposed change will have any discriminatory or adverse effects, including disparate impact and disproportionate burden, on GRTC s ridership base for the purposes of Title VI. This will be done by comparing the demographic base of the Chesterfield express routes with the demographic base of Chesterfield County as a whole. This comparison group (Chesterfield County residents) was chosen because they could possibly be affected by the budget shortfalls, even if they are not current express route riders. Since there is no other transit service funded by Chesterfield County, there is no logical comparison group other than Chesterfield residents. City of Richmond and Henrico County census data were not used in comparison because these jurisdictions funds transit separately and any budgeting shortfalls in Chesterfield County would not affect other service. If the impacts of the changes affect certain groups more than others, it is possible that the below effects could occur: Disparate Impact (Minorities): GRTC defines a disparate impact as an impact that affects a protected population (based on race, color, or national origin) at a higher rate than the overall population. For example, if proportionately more minorities lived within the express route service area than in the comparison area, then there could be a disparate impact from a service decrease. 150 Page 5 of 11
151 Disproportionate Burden (Low-Income): A disproportionate burden is similar to a disparate impact, except the affected population is a low-income population rather than a minority population based on race, color, or national origin. A disproportionate burden would be found if a change impacted lowincome persons at a higher rate than as found in the comparison population. LEP: LEP (Limited English Proficiency) persons fall under Title VI protection. GRTC compares to see if the affected population s proportion of LEP persons is higher than the comparison population for possible disproportional effects. The above effects can be determined through demographic data or ridership data. GRTC uses demographic data. d. Compare the location of the proposed change to the most recent demographic data on file. Is the affected area a minority, low-income, or LEP area according to the data? Before one can make the determination as to whether the location of the proposed change is considered a minority, low-income, or LEP area, one must determine the comparison population. FTA defines minority, low-income, and LEP areas as areas that have median levels of the respective characteristics that are higher than the median levels of the local service area. Since GRTC does not typically include express route ridership areas in the local service area calculations for the purposed of the Title VI system update, and since the impetus for the proposed service decrease comes from budget shortfalls in Chesterfield only, routes funded through other jurisdictions cannot be affected. Therefore it was determined that the comparison population for this analysis are the residents of Chesterfield County as a whole. Because this is a proposed express route-only service decrease, the affected ridership population is those who live in census block groups within a 4.5 miles radius of the Chesterfield express route park-and-ride lots. In this case, there is potential for a disparate impact or disproportionate burden if these areas had a higher proportion of minorities, LEP individuals, or low-income persons than the comparison population. 151 Page 6 of 11
152 e. Compare the ridership population that will be affected by the change as compared to the general ridership population. Could there be a potential disparate impact or disproportionate burden? Explain. Demographics Population (BG) Total % minority Median % Minority by BG %low-income (Census Tract) %LEP (Census Tract) Express Ridership area Population Chesterfield Population % difference 161, ,236 n/a 19.5% 29.7% -10.2% 16.8% 24.8% -8% 12.2% 16.1% -3.9% 3.4% 4.3% -0.9% The analysis compared the express bus ridership base with the Chesterfield County resident base. The data shows that the express population base has lower proportions of minority, lowincome, and LEP persons than the County overall. f. Analyze the data to describe the details and extent of the possible impacts. i. Create maps showing the affected areas and demographic data along with route information The maps below show the affected areas within Chesterfield County. The first map shows the census block groups of people who could be impacted by the service decrease (the Express Route Service Area). It shows the percentage of the population that is considered a minority under Title VI, by Census Block Group. 152 Page 7 of 11

153 The second map shows Census Tracts with the amount relative amount of low-income individuals. An individual is considered to be low-income if they live along or in a household making less than 150% of the poverty rate. It is a sliding scale, based on the year and household size. For example, for the 2011 data below, an individual living alone and making less than $17,226, or an individual living in a household of a family of four with two children making less than $34,218, would both be considered low-income. 153 Page 8 of 11

154 The last map highlights the percentage of persons by Census Tract who are considered to be Limited English Proficiency persons. 154 Page 9 of 11

155 155 Page 10 of 11
156 ii. Create tables showing impacts of each type of change and the affected and overall ridership population (see above) g. Determine whether the proportion of minorities, low-income population is affected is significant when compared to the general population set (use thresholds as defined in each policy). If not, finalize the analysis and provide to the Board. If so, steps need to be taken to describe these negative effects and to develop alternative options that mitigate, avoid, or minimize these effects. GRTC s Disproportionate Burden and Disparate Impact Policies both currently use a 10% threshold for finding a significant difference between the respective protected population and the general population. For example, if the affected group has at least a 10% higher proportion of minorities or low-income people than the comparison group, it would be considered to be significant, and there is a strong chance that there would be a disproportionate burden or disparate impact. However, because it has been shown that the affected area in this case (the Express Route Service Area) has a lower proportion of minorities and low-income people than the Local Route Service Area, it is determined that neither a Disproportionate Burden nor a Disparate Impact would result the proposed service changes. Therefore, GRTC sees no Title VI-related reason to mitigate or find alternatives for the proposed service change. However, there is still an internal policy requirement to hold public meetings and allow for comment periods before the change goes into effect. h. Repeat the analysis for any alternative options. N/A i. Present the findings to the Board of Directors for review and acceptance. Page 11 of
157 GRTC Transit System 2016 Program Update Appendix J: Fare Equity Analysis: New Fare Media 157
158 1 TITLE VI FARE ANALYSIS Title VI of the Civil Rights Act of 1964 states that no person in the United States shall, on the ground of race, color, or national origin, be excluded from participation in, be denied the benefits of, or be subjected to discrimination under any program or activity receiving Federal financial assistance (42 U.S.C. Section 2000d). Recipients of public transportation funding from the Federal Transit Administration (FTA), including GRTC, are required to develop policies and practices that ensure that federal and state transit funding is used in a manner that is nondiscriminatory. Furthermore, GRTC has committed to the FTA Title VI objectives set forth in Circular 4702.B ensuring that programs and activities are made available and equitably distributed, whether they are federally funded or not. GRTC Service and Fare Equity Policy Major Fare or Service Change To evaluate proposed fare and service changes, GRTC has created a fare and service equity analysis policy and process to be performed in any of the following conditions: A fare change (increase or reduction) is considered on one or more routes or services (local, express, specialized or other) A major service change is considered on one or more routes or services A major service change is defined in the major service change policy as: change in 25% of bus stops and/or 25% of routing/miles and/or 25% of hours of service. Given the changes to fares and fare structure, further analysis to assess potential for disparate impacts was examined. Disparate Impact The Federal Transit Administration defines disparate impact as a, facially neutral policy or practice that disproportionately affects members of a group identified by race, color, or national origin, where the recipient s policy or practice lacks a substantial legitimate justification and where there exists one or more alternatives that would serve the same legitimate objectives but with less disproportionate effect on the basis of race, color, or national origin. As consistent with federal regulations, GRTC defines a disparate impact as an impact that affects a protected population (based on race, color, national origin) at a higher rate than the overall population. Any time a major fare or service change takes place, it shall be measured by comparing the existing service with the proposed service as part of a required fare and service equity analysis. GRTC policy determines that the proposed fare or service has a disparate impact on minority populations when there is greater than 10% difference in the percentage of protected populations affected by the change compared to the local service areas. In this analysis, if the quantitative results indicate that the service changes impact low-income, minority, or low English proficiency persons at a rate 10% greater than the service area population as a whole, there could be a disparate impact. 158
159 Fare Proposals GRTC s Title VI policy states that an analysis process will be performed in the case that a fare change (increase OR reduction) is considered on one or more routes or service (local, express, specialized, or other). This assessment covers two proposed fare changes: 1. Replacement of the existing transfer fare with a One Ride Plus Pass fare option, and 2. Introduction of multi-use passes (1-Day pass, 7-Day pass, 30-Day pass). Replacement of Existing Transfer Fare with One Ride Plus Pass Fare As discussed in Chapter 4, GRTC has proposed eliminating the existing transfer fare ($0.25) and introducing a One Ride Plus Pass fare, which would cost $1.75. Under this proposal, the cost of a one-way ride with a transfer will remain the same for all customers, the only change will be the manner in which the transfer fare can be purchased. Rather than purchasing a transfer for $0.25, customers will pay this fee when they purchase their original ticket, making the cost of a One Ride Plus Pass fare $1.75. The elimination of a transfer fare ($0.25) was designed to reduce abuse of the transfer system while maintaining equivalent fare pricing for those who need to take multiple buses to reach their destination. The One Ride Plus Pass fare accomplishes this objective. Introduction of Multiple-Use Passes GRTC plans to introduce multiple-use passes (1-Day, 7-Day, 30-Day) in order to reduce the amount of paper fares in circulation and create a more modernized fare structure that encourages higher ridership. This fare change would reduce the price of riding GRTC for very frequent riders. Methodology The 2015 GRTC on-board survey collected ridership and demographic data necessary to conduct a fare equity analysis consistent with the policies described above. Since the proposal is to replace the existing transfer fare with a One Ride Plus Pass fare and to introduce multiple use passes, there is no potential adverse effect on riders. As such, the focus for this analysis is on the potential benefits rather than negative effects. That is, there could be a possible disparate impact if minority, low-income, or limited English proficiency riders were being limited or denied the benefits of the fare policy proposal in comparison to non-title VI riders. The methodology developed to analyze the impact of the fare proposals on Title VI compared to non-title VI populations included the following steps: 1. Defining the term low-income as those with an annual household income at or below the U.S. Department of Health and Human Services (HHS) poverty guidelines of being at or below $24,250 (assumed for a family of four in 2015). Using GRTC 2015 Survey Data, those with an annual household income less than $25,000 a year were defined as low-income. 2. Defining the term minority to mean those who self-identify as any ethnicity other than white alone. 3. Defining the term limited English proficient as those who do not speak English as their primary language and who have a limited ability to read, speak, write, or understand English. Using GRTC 2015 Survey Data, those who speak a language other than English as their primary language in their household were defined as having limited English proficiency. 4. Utilizing GRTC Survey Data from spring 2015 to develop the tables in the analysis below. 159
160 This report details the findings of an onboard survey of GRTC riders. The fieldwork for this survey was conducted from March 2015 to May A total of 1,519 surveys were completed by GRTC riders. Key information in the survey includes ridership demographic characteristics, such as race, primarily language spoken at home, and total household income. 5. Using GRTC 2015 Survey Data to determine if the proposed fare change will have a disparate impact on minority, low-income, or limited English proficiency populations. Equity Evaluation of Proposed Changes One Ride Plus Pass The elimination of the transfer fare and the introduction of a One Ride Plus Pass has no financial impact on customers. While customers will no longer be able to purchase a transfer for $0.25, they will be able to buy a One Ride Plus Pass, which applies the $0.25 transfer fee to the initial pass payment. As such, the cost of a One Ride Plus Pass is $1.75 ($1.50 base fare plus $0.25 transfer fee). Therefore, there is no change to the cost of transferring, just a change in the manner in which transfer passes are purchased. Therefore, there is no disproportionate burden on minority, low-income, or limited English proficiency riders and no disproportionate benefit for non-title VI riders. Multiple-Use Passes As previously discussed, there will be no negative customer impact resulting from the introduction of multiple use passes, only a significant benefit (reduced cost) for very frequent riders. As such, the analysis focused on the benefits received by different groups based on the introduction of multiple use passes. Ridership survey data was analyzed to determine whether the group that stands to benefit from the introduction of multiple use passes is less minority, low-income, or low English proficient than all ridership. The greatest savings will be experienced by individuals who ride GRTC ten or more times a week, through the use of multiple use passes in particular the 30-Day pass. As such, the study team compared the percentage of lowincome riders, minority riders, and riders with limited English proficiency who make more than 10 trips on GRTC per week to the percentage of all riders who make more 10 or more trips on GRTC per week. Figures 15 and 16 shows the frequency of use by Title VI population groups, those who ride GRTC 10 or more times a week, is greater than the overall population who ride 10 or more times per week. Therefore, a greater benefit from the multiple use passes is derived by low income, minority, and limited English proficiency populations compared with the overall population in the GRTC service area. When analyzed for all persons who ride GRTC less frequently, less than 10 times per week, Title VI populations benefit slightly less from multiple use passes than is the case for the overall population in the service area who also ride GRTC less than 10 times per week (see Figure 19 and Figure 20). For less frequent riders over all, there will be a greater benefit to non-low-income riders compared to low-income riders. However, the percent difference (1.6%) is below the 10% threshold set by GRTC s Disparate Impact Policy. Therefore, there is no disparate impact on low-income riders by the introduction of multiple use passes. Similarly, while infrequent non-minority riders will use multiple use passes slightly more compared to infrequent minority riders, the percent difference (0.1%) is significantly below the 10% threshold set by GRTC s Disparate Impact Policy. Therefore, there is no disparate impact on minority riders by the introduction of multiple use passes. Finally, while infrequent non-limited English proficiency riders will use multiple use passes more often than infrequent limited English proficiency riders, the percent difference (7.0%) is below the 10% threshold set by GRTC s Disparate Impact Policy. Therefore, there is no disparate impact on limited English proficiency riders by the introduction of multiple use passes. 160
161 Figure 19 Percent of Populations that will Benefit from Introduction of Multiple Use Passes 70% 60% 50% 40% 30% 20% 10% 0% -10% Low-Income Minority Limited English Proficiency Overall Less than 10 trips per week 10 or more trips per week Figure 20 Percent of Title VI Populations that will Benefit from Introduction of Multiple Use Passes Low-Income Minority Limited English Proficiency Overall Less than 10 trips per week 42.9% 41.4% 36.0% 43.0% 10 or more trips per week 57.1% 58.6% 64.0% 57.0% As these passes are such an important new offering, GRTC has ensured that the sales locations for these passes are thoughtfully located and readily available. The most commonly used passes are available for purchase: on the vehicle; via the Mobile Pay App; online; and at retail/ridefinders outlets. Figure 21 shows where customers can purchase the range of fare types offered by GRTC. 161

162 Figure 21 Pass Purchase Locations by Type The on-board, Mobile Pay App, and online options significantly help with accessibility. GRTC should review the distribution of retail fare sales outlet locations to assure convenient availability of multiple use pass sales outlets in equitable proximity to all populations. 162
163 Appendix K: Board Approval Documents GRTC Transit System Level and Quality of Service Analysis Level and Quality Service Assessment Board Approval Signatures (Page 164) Title VI Program Update Board Approval Signatures (Page 169) 163
164
165
DEMOGRAPHIC PROFILE Skagit County, Washington. Prepared by: Skagit Council of Governments 204 West Montgomery Street, Mount Vernon, WA 98273
 DEMOGRAPHIC PROFILE 2013 Skagit County, Washington Prepared by: Skagit Council of Governments 204 West Montgomery Street, Mount Vernon, WA 98273 CONTENTS TABLE OF CONTENTS Introduction... 1 Persons and
Town of Guilford 223 Marble Road Guilford, NY POLICY AND PROCEDURE
 Town of Guilford 223 Marble Road Guilford, NY 13780 POLICY AND PROCEDURE LANGUAGE ACCESS PLAN POLICY ~~~~~~~~~~~~~~~~~~~~~~~~~~~~~~~~~~~~~~~~~~~~~~~~~~~~~~~~~~~~~ Policy: It is the policy of the Town of
Title VI Report of the Franklin Regional Transit Authority
 Effective: July 31, 2016 Title VI Report of the Franklin Regional Transit Authority Franklin Regional Transit Authority 12 Olive St. Greenfield MA 01301 413-774-2262 7/31/2016 Introduction This update
West Plains Transit System City of West Plains, MO. Title VI Program. Date filed with MoDOT Transit Section:
 West Plains Transit System City of West Plains, MO Title VI Program Date filed with MoDOT Transit Section: March 31, 2014 Amended August 26, 2015 1 Title VI Plan Table of Contents A. Introduction / Title
Selected National Demographic Trends
 Selected National Demographic Trends Tawara D. Goode Director, Georgetown University National Center for Cultural Competence Assistant Professor, Center for Child and Human Development Spring 2016 University
Environmental Justice Demographic Profile
 CENTRAL PUGET SOUND REGION Environmental Justice Demographic Profile January 2016 Contents INTRODUCTION... 3 OBJECTIVES... 4 DEFINITIONS... 4 Minority Populations... 4 Low-Income Population... 4 Other
SANTA CRUZ METROPOLITAN TRANSIT DISTRICT ADMINISTRATIVE CODE TITLE VI TITLE VI PROGRAM REGULATION AND COMPLAINT PROCEDURE CHAPTER 1
 SANTA CRUZ METROPOLITAN TRANSIT DISTRICT ADMINISTRATIVE CODE TITLE VI TITLE VI PROGRAM REGULATION AND COMPLAINT PROCEDURE CHAPTER 1 (This Chapter replaces AR-1029 pursuant to Resolution No. 16-03-05) Table
INSTRUCTIONS FOR FOOD & NUTRITION PRE-AWARD CIVIL RIGHTS COMPLIANCE REVIEW
 INSTRUCTIONS FOR FOOD & NUTRITION PRE-AWARD CIVIL RIGHTS COMPLIANCE REVIEW This form is used to provide Civil Rights information required by the United States Department of Agriculture (USDA) and the Texas
CITY OF SANTA ROSA CITY COUNCIL MAYOR AND CITY COUNCIL APPROVAL OF SANTA ROSA CITYBUS TITLE VI PROGRAM UPDATE
 CITY OF SANTA ROSA CITY COUNCIL Agenda Item #11.3 For Council Meeting of: March 19, 2013 TO: SUBJECT: STAFF PRESENTER: MAYOR AND CITY COUNCIL APPROVAL OF SANTA ROSA CITYBUS TITLE VI PROGRAM UPDATE RACHEL
Title VI Review: Service and Facility Standards Monitoring
 Title VI Review: Service and Facility Standards Monitoring Prepared by SRF Consulting Group, Inc. SRF No. 7709 Table of Contents Executive Summary...5 Technical Analysis of Service Standards... 5 Additional
Title VI Program. Business Services Division Office of Diversity & Inclusion Title VI Unit
 Title VI Program Business Services Division Office of Diversity & Inclusion Title VI Unit November 3, 2016 Title VI Program The Santa Clara Valley Transportation Authority (VTA) is an independent special
TITLE VI PLAN Adopted April 4, 2014
 TITLE VI PLAN Adopted April 4, 2014 1 2 This page left blank intentionally II. Organization, Staffing and Structure A. Organizational Chart Reporting Relationships B. Staffing and Structure Executive
Title VI & Environmental Justice Plan
 Corvallis Area Metropolitan Planning Organization Title VI & Environmental Justice Plan Compliance with Federal Requirements under 49 CFR Part 21 and 23 CFR Part 200 Corvallis Area Metropolitan Planning
APTA Legal Affairs Conference Civil Rights Panel February 25, 2013
 APTA Legal Affairs Conference Civil Rights Panel February 25, 2013 1 Bay Area Demographics Title VI/Disparate Impact Legal Standards Federal & State Scope Example(s) LEP Legal Standards Today s Presentation
Last First Middle. Number Street City State Zip Code. Monday Tuesday Wednesday Thursday Friday Saturday Sunday
 GOODWILL INDUSTRIES OF NORTHEASTERN PA 925 PROSPECT AVENUE, SCRANTON, PA 18505 Phone: (570) 343-1166 Fax: (570) 343-6765 Residential: (570) 706-9586 Fax: (570) 706-9587 www.goodwillnepa.org Applicants
TITLE VI PROGRAM POLICY
 TITLE VI PROGRAM POLICY The Napa Valley Transportation Authority (NVTA) is committed to ensuring that no person is excluded from participation in, or denied benefits of its transit services on the basis
March 2016 University Link Bus Integration Service Changes. Title VI Service Equity Analysis Final Adopted Changes
 March 2016 University Link Bus Integration Service Changes Title VI Service Equity Analysis Final Adopted Changes February 2016 Introduction Federal Transit Administration (FTA) Circular 4702.1B, Chapter
Appendix A. Environmental Justice Analysis
 Appendix A. Environmental Justice Analysis Project Memorandum Re: KY 536 Scoping Study Environmental Justice Analysis Date: December 22, 2014 Introduction This Environmental Justice Report presents a review
DRAFT Title VI Major Service Change and Service Equity Policies
 DRAFT Title VI Major Service Change and Service Equity Policies Long Beach Transit 10/1/2015 Contents PURPOSE... 2 BACKGROUND... 3 MAJOR SERVICE CHANGE POLICY... 4 DISPARATE IMPACT POLICY.... 5 DISPROPORTIONATE
City of Elk Grove Application for Appointment
 City of Elk Grove Application for Appointment Elk Grove Youth Commission INSTRUCTIONS: Provide all information requested; use ink; any attachments must be single sided on 8.5 x 11 paper. If you will be
City of Gloversville, Transit System
 City of Gloversville, Transit System TITLE VI PLAN August 2017 City of Gloversville Title VI Plan - August 2017 Page 1 * Adopted by the City of Gloversville Legislature by Resolution #72-2017 on August
Application for Employment
 Application for Employment Mission Statement The Metro YMCAs of the Oranges strengthens community through youth development, healthy living and social responsibility The YMCA maintains a zero tolerance
Name Home Phone( ) LAST FIRST MIDDLE Cell Phone( ) Address: Address NO STREET CITY STATE ZIP
 LAST FIRST MIDDLE Cell Phone( ) Address: Address NO STREET CITY STATE ZIP") Canadian County Children s Justice Center EMPLOYMENT APPLICATION (rev. 01-11) Canadian County is an equal opportunity employer and will consider all applicants for all positions equally without regard
Canadian County Children s Justice Center EMPLOYMENT APPLICATION (rev. 01-11) Canadian County is an equal opportunity employer and will consider all applicants for all positions equally without regard
EMPLOYMENT APPLICATION
 EMPLOYMENT APPLICATION POSITION DESIRED: Today s Date: _ Professional License/Certification # (State of California): Other State License/Certification #: Issue Date: Exp. Date: Issue Date: Exp. Date: Has
Application for Employment Pre-Employment Questionnaire
 Kemco Industries, Inc. An Equal Opportunity Employer Application for Employment Pre-Employment Questionnaire Kemco Industries, Inc. is an equal opportunity employer and its policy is to fill every position
If you are under 18 years of age, can you provide required proof of Yes No your eligibility to work?
 BELKNAP COUNTY 34 County Drive Laconia, NH 03246 (603) 527-5400 Application for Employment We consider applicants for all positions without regard to race, color, religion, creed, gender, national origin,
TITLE VI PROGRAM Original Document Date: 3/9/2016 Revised Document Date: 1/3/2019
 TITLE VI PROGRAM Original Document Date: 3/9/2016 Revised Document Date: 1/3/2019 1 Contents General Requirements and Guidelines... 4 A. Statement of Policy... 4 B. Notice to Public... 4 C. Title VI Complaint
Preliminary Audit of the City s Diversity Report # June, 2016
 Preliminary Audit of the City s Diversity Report # 2016-02 June, 2016 Jorge Oseguera, City Auditor John Silva, Independent Budget Analyst The City of Sacramento s can be contacted by phone at 916-808-7270
Environmental Justice Methodology Technical Memorandum
 Appendix D Environmental Justice Methodology I-290 Eisenhower Expressway Cook County, Illinois Prepared For: Illinois Department of Transportation Prepared By: WSP Parsons Brinckerhoff September 2016 This
Application for Employment
 (An Equal Opportunity Employer) Application for Employment PERSONAL INFORMATION DATE (PRINT) NAME LAST FIRST MIDDLE CURRENT ADDRESS STREET CITY STATE ZIP PHONE NUMBER CELL NUMBER ARE YOU 18 YEARS OR OLDER
SOCIAL SECURITY NUMBER *last 4 digits*
 MSDE OFFICE USE ONLY Approved Disapproved APPLICATION FOR EMPLOYMENT Maryland State Department of Education Staff Recruitment Section 200 West Baltimore Street Baltimore MD 21201 410-333-3045 (TTY) 410-333-8950
ESPERANZA HEALTH SYSTEMS, LTD. D/B/A LA HACIENDA TREATMENT CENTER ARBITRATION AGREEMENT
 ESPERANZA HEALTH SYSTEMS, LTD. D/B/A LA HACIENDA TREATMENT CENTER ARBITRATION AGREEMENT PLEASE READ AND SIGN THIS PAGE BEFORE COMPLETING THE APPLICATION PACKET Esperanza Health Systems, Ltd. D/B/A/ La
Limited English Proficiency (LEP)
") Limited English Proficiency (LEP) 2018 CDBG-DR Problem Solving Clinic Atlanta, GA December 12-14, 2018 Welcome & Speakers Session Objectives To help grantees understand the limited English proficiency
Limited English Proficiency (LEP) 2018 CDBG-DR Problem Solving Clinic Atlanta, GA December 12-14, 2018 Welcome & Speakers Session Objectives To help grantees understand the limited English proficiency
McALESTER PUBLIC SCHOOLS McAlester, Oklahoma APPLICATION FOR SCHOOL SECRETARY & TEACHER ASSISTANT
 McALESTER PUBLIC SCHOOLS McAlester, Oklahoma APPLICATION FOR SCHOOL SECRETARY & TEACHER ASSISTANT I am applying for: Secretary Teacher Assistant Date: Social Security Number: Name: Phone: ( ) Home Address:
Employment Application EQUAL OPPORTUNITY EMPLOYER
 San Gabriel/Pomona Regional Center 75 Rancho Camino Drive Pomona, CA 91766 (909) 620-7722 Application EQUAL OPPORTUNITY EMPLOYER READ INSTRUCTIONS CAREFULLY BEFORE COMPLETING THIS APPLICATION PRINT Legibly
February 1, William T Fujioka, Chief Executive Officer. Dean C. Logan, Registrar-Recorder/County Clerk
 January 31, 2012 Page 1 of 13 TO: Supervisor Zev Yaroslavsky, Chair Supervisor Gloria Molina Supervisor Mark Ridley-Thomas Supervisor Don Knabe Supervisor Michael D. Antonovich William T Fujioka, Chief
EMPLOYMENT APPLICATION CITY OF BILLINGS P.O. BOX 1178 BILLINGS, MT Notice to Applicants PERSONAL INFORMATION
 EMPLOYMENT APPLICATION CITY OF BILLINGS P.O. BOX 1178 BILLINGS, MT 59103 Notice to Applicants We welcome you as an applicant for employment. It is the policy of the City of Billings to consider applicants
City of Newark Newark Boulevard, 4th Floor Newark, CA
 City of Newark 37101 Newark Boulevard, 4th Floor Newark, CA 94560-3796 EMPLOYMENT APPLICATION Date Received: Accepted Rejected Rejection for: Late Application Incomplete Application Experience Education
Employment Application
 Employment Application Current job opportunities are posted on our website at www.ariseinc.org/employment. We consider applicants for all positions without regard to race, religion, creed, gender, age,
TOWN OF PLAINFIELD, INDIANA TITLE VI NON-DISCRIMINATION PLAN 2018
 TOWN OF PLAINFIELD, INDIANA TITLE VI NON-DISCRIMINATION PLAN 2018 206 W. Main Street Plainfield, Indiana 46168 (317) 839-2561 TOWN OF PLAINFIELD, INDIANA TITLE VI NON-DISCRIMINATION PLAN TABLE OF CONTENTS
PUBLIC PARTICIPATION PLAN Providing Public Participation Opportunities for Involvement in the Metropolitan Planning Process
 THE NORTHWEST ARKANSAS METROPOLITAN PLANNING ORGANIZATION Northwest Arkansas Regional Transportation Study (NARTS) PUBLIC PARTICIPATION PLAN Providing Public Participation Opportunities for Involvement
1001 Westbrook Street Portland, Maine TITLE VI PROGRAM
 1001 Westbrook Street Portland, Maine 04102 TITLE VI PROGRAM August 2017 TABLE OF CONTENTS I. Introduction 4 II. Administration 5 III. Responsibilities and Objectives... 6 IV. Legislation and Guidance
NATIONAL MANGO BOARD FOREIGN PRODUCER NOMINATIONS
 NATIONAL MANGO BOARD FOREIGN PRODUCER NOMINATIONS February 04, 2019 The National Mango Board (NMB) is seeking nominations from mango foreign producer organizations to fill three (3) member seats on the
STORER TRANSIT SYSTEMS DRIVER APPLICATION FOR EMPLOYMENT
 STORER TRANSIT SYSTEMS DRIVER APPLICATION FOR EMPLOYMENT Applicant Name Date of Application I am applying for the position of driver at the following location(s) (check all that apply): 1216 Doker Dr,
WALTON COUNTY PROPERTY APPRAISER S OFFICE APPLICATION FOR AT-WILL EMPLOYMENT
 WALTON COUNTY PROPERTY APPRAISER S OFFICE APPLICATION FOR AT-WILL EMPLOYMENT P.O. BOX 691, DEFUNIAK SPRINGS, FL 32435 (850) 892-8123 FAX (850) 892-8374 We are proud to be an Equal Employment Opportunity,
Data Brief Vol. 1, No. 1
 Asian Americans and Pacific Islanders in the United States Aged 55 Years and Older: Population, Nativity, and Language Asian Americans and Pacific Islanders (AAPIs) are one of the fastest growing populations
APPLICATION FOR EMPLOYMENT. Please Print. Name Last First Middle. Address. City, State and Zip. Phone Missouri Driver s License No.
 APPLICATION FOR EMPLOYMENT Remit to: Human Resources Dept. CITY OF TROY 800 Cap Au Gris Troy, Missouri 63379 (636) 528-4712 (636) 462-2619 (fax) Please Print Date Name Last First Middle Address _ City,
City of Newark Newark Boulevard, 4th Floor Newark, CA
 City of Newark 37101 Newark Boulevard, 4th Floor Newark, CA 94560-3796 EMPLOYMENT APPLICATION Date Received: Accepted Rejected Rejection for: Late Application Incomplete Application Experience Education
Driver Application (Please Print Clearly)
") Full-Time Seasonal Applicant Name: Date: Current Phone # Street City State Zip Are you at least 22 years of age OR older? Y or N Do you have an authorization to work in the U.S.? Y or N Do you have a valid
Full-Time Seasonal Applicant Name: Date: Current Phone # Street City State Zip Are you at least 22 years of age OR older? Y or N Do you have an authorization to work in the U.S.? Y or N Do you have a valid
Application for Employment
 Application for Employment Main Office/Terminal Location: 6001 Palmer Avenue Eddyville, IA 52553 Phone: 641/969 4534 Fax: 641/969 4338 Terminal Location: 1501 East Main Street Knoxville, IA 50138 Phone:
SAN FRANCISCO MUNICIPAL TRANSPORTATION AGENCY
 THIS PRINT COVERS CALENDAR ITEM NO. : 12 DIVISION: Transit Services BRIEF DESCRIPTION: SAN FRANCISCO MUNICIPAL TRANSPORTATION AGENCY The San Francisco Municipal Transportation Agency (SFMTA) Board of Directors
Title VI Plan For the Federal Transit Administration And Washington State Department of Transportation
 Title VI Plan For the Federal Transit Administration And Washington State Department of Transportation July 1 31, 2015 June 30, 2017 Table of Contents Introduction... 3 Title VI Complaint Procedures...
EMPLOYMENT APPLICATION
 EMPLOYMENT APPLICATION Thank you for your interest in a position with the Niagara Frontier Transportation Authority (NFTA), or its wholly owned subsidiary, Niagara Frontier Transit Metro System, Inc. (
BATS Title VI Policies and Procedures
 BATS Title VI Policies and Procedures October 1, 2018 METROPOLITAN PLANNING ORGANIZATION (MPO) / BRUNSWICK AREA TRANSPORTATION STUDY (BATS) Glynn County Community Development Department 1725 Reynolds Street,
EMPLOYMENT APPLICATION
 EMPLOYMENT APPLICATION Oklahoma Health Care Authority Human Resources Department 4345 N. Lincoln Boulevard Oklahoma City, Oklahoma 73105 PHONE: 405.522.7093 FAX: 405.530.7218 EMAIL: personnel@okhca.org
Heritage Language Research: Lessons Learned and New Directions
 Heritage Language Research: Lessons Learned and New Directions Terrence G. Wiley President, Center for Applied Linguistics Professor Emeritus, Arizona State University Overview This presentation will provide
LA METRO 2017 DISPARITY STUDY
 LA METRO 2017 DISPARITY STUDY www.bbcresearch.com bbc@bbcresearch.com 303-321-2547 DISPARITY STUDY OBJECTIVES Assess whether minority-/women-owned businesses (M/Ws) face discrimination 1. Assess any underutilization
Mobility 2045 Supported Goals. Public Benefits of the Transportation System
 Mobility 2045 Supported Goals Ensure all communities are provided access to the regional transportation system and planning process. Encourage livable communities which support sustainability and economic
APPLICATION FOR HOUSING WAIT LIST
 PROVIDENCE STAFF USE ONLY Date/Time Received: Staff Initials: APPLICATION FOR HOUSING WAIT LIST We do not have any vacancies at this time. To be placed on our wait list(s), please complete this application,
APPLICATION FOR HOUSING WAIT LIST
 PROVIDENCE STAFF USE ONLY Date/Time Received: Staff Initials: Vincent House 1423 First Avenue, Seattle WA 98101 Phone: 206-682-9307 Fax: 206-682-0548 TTY: 800-833-6388 WA Relay: 711 APPLICATION FOR HOUSING
LOUISIANA UNITED METHODIST CHILDREN AND FAMILY SERVICES, INC. P.O. BOX 929 RUSTON, LA
 LOUISIANA UNITED METHODIST CHILDREN AND FAMILY SERVICES, INC. P.O. BOX 929 RUSTON, LA 71273 WWW.LMCH.ORG EMPLOYMENT APPLICATION Louisiana United Methodist Children and Family Services believes ensuring
Preliminary Application for Housing. Please Check One Facility Per Application! DGN I, Inc. DGN II, Inc. DGN III, Inc. Head of Household (HOH):
:") Douglas Gardens Senior Housing, Inc. Management Agent 705 SW 88th Avenue Pembroke Pines, Florida 33025 TTY/VCO 800-955-8771 / Phone 954-704-3464 / Fax 954-438-1050 Preliminary Application for Housing Please
Douglas Gardens Senior Housing, Inc. Management Agent 705 SW 88th Avenue Pembroke Pines, Florida 33025 TTY/VCO 800-955-8771 / Phone 954-704-3464 / Fax 954-438-1050 Preliminary Application for Housing Please
YOUTH AIDE Job Announcement Spring 2018
 CITY OF SACRAMENTO Department of Parks and Recreation Landscape and Learning Youth Employment Program YOUTH AIDE Job Announcement Spring 2018 The Landscape and Learning program is an employment program
Application for Employment
 Application for Employment It is the policy of BGCGW that all applicants for employment and all employees are recruited, hired, and assigned on the basis of merit without regard to race, color, religion,
City of Boise Boise Fire Department LEP Assessment and Plan
 City of Boise Boise Fire Department LEP Assessment and Plan As part of the City of Boise s LEP, the Boise Fire Department has developed the following plan to provide meaningful access to its services for
WINSTON-SALEM URBAN AREA TITLE VI AND ENVIRONMENTAL JUSTICE PLAN
 WINSTON-SALEM URBAN AREA TITLE VI AND ENVIRONMENTAL JUSTICE PLAN December 2008 TABLE OF CONTENTS ABBREVIATION AND ACRONYM DEFINITIONS 1 BACKGROUND 2 MISSION AND POLICY. 2 GOALS 3 COMPLIANCE GOALS 3 PLANNING
Return to facility/person you obtained the application.
 Instructions for manual employment applications Today s Date: Due to the volume of applications received, we will not be able to respond to requests of application status. Please ensure you indicate your
YOUTH AIDE Job Announcement Summer 2018
 CITY OF SACRAMENTO Department of Youth, Parks, & Community Enrichment Landscape and Learning Youth Employment Program YOUTH AIDE Job Announcement Summer 2018 The Landscape and Learning program is an employment
Winnebago County Circuit Clerk's Office Charlotte LeClercq, Deputy Chief (815) West State St. Rockford, IL 61101
 West State St. Rockford, IL 61101") PERSONAL Last name First name Middle name Current address City State Zip code Email address Known by other names Home phone number Alternate phone number Are you 18 years of age or older? Winnebago County
PERSONAL Last name First name Middle name Current address City State Zip code Email address Known by other names Home phone number Alternate phone number Are you 18 years of age or older? Winnebago County
CITY OF WATERBURY HUMAN RESOURCES DEPARTMENT
 HUMAN RESOURCES DEPARTMENT OPEN COMPETITIVE EXAMINATION FOR: POLICE OFFICER Open Competitive Exam # 2150 SALARY: $1,095.00 per week FRINGE BENEFITS: Choose from available health insurance plans (employee
APPLICATION FOR EMPLOYMENT
 5230 West Highway 98 Panama City, FL 32401-1041 APPLICATION FOR EMPLOYMENT DATE OF APPLICATION: All sections of this application must be completed Incomplete applications will not be considered. Resumes
Position Applied For: Application Date:
 An Equal Opportunity /Drug-Free Work Environment Employment Application (Please Print or Type) All sections must be fully completed in order to qualify for employment consideration. Position Applied For:
PRE-EMPLOYMENT 1700 Hillside Blvd. QUESTIONNAIRE Colma, CA AN EQUAL Tel: (650)
") LUCKY CHANCES Casino & Fine Dining PRE-EMPLOYMENT 1700 Hillside Blvd. QUESTIONNAIRE Colma, CA 94014 AN EQUAL Tel: (650) 758-2237 OPPORTUNITY EMPLOYER Fax: (650) 758-6462 Email: Jobs@LuckyChances.com APPLICATION
LUCKY CHANCES Casino & Fine Dining PRE-EMPLOYMENT 1700 Hillside Blvd. QUESTIONNAIRE Colma, CA 94014 AN EQUAL Tel: (650) 758-2237 OPPORTUNITY EMPLOYER Fax: (650) 758-6462 Email: Jobs@LuckyChances.com APPLICATION
Transit Connection, Inc. MVBP RR 1, Box 3 Edgartown, MA
 Transit Connection, Inc. MVBP RR 1, Box 3 Edgartown, MA 02539 508.693.9440 www.vineyardtransit.com Dear Applicant, Thank you for considering Transit Connection, Inc. (TCI) for employment. As the operations
APPLICATION FOR EMPLOYMENT
 PERSONAL INFORMATION (PLEASE PRINT OR TYPE) DATE: NAME: (FIRST, MIDDLE, LAST) SSN: PHONE: ALT. PHONE: E-MAIL ADDRESS: ( ) ( ) REFERRAL SOURCE WALK IN ADVERTISEMENT RELATIVE EMPLOYMENT AGENCY EMPLOYEE OTHER
NAME: LAST NAME FIRST NAME MIDDLE INITIAL
 JOHNSTON PUBLIC SCHOOLS 10 Memorial Avenue Johnston, Rhode Island 02919 Phone: 401-233-1900 / Fax: 401-233-1907 www.johnstonschools.org COACH ASSISTANT COACH VOLUNTEER COACH APPLICAT ION FO R EM PLOYM
Hardee County Board of County Commissioners Equal Employment Opportunity (EEO) Self-Identification Form (completion of this form is voluntary)
 Self-Identification Form (completion of this form is voluntary)") Please submit to: Hardee County Board of County Commissioners HR Department 205 Hanchey Road, Wauchula, Florida 33873 Phone: (863) 773-2161 Hardee County Board of County Commissioners Equal Employment
Please submit to: Hardee County Board of County Commissioners HR Department 205 Hanchey Road, Wauchula, Florida 33873 Phone: (863) 773-2161 Hardee County Board of County Commissioners Equal Employment
SUPERIOR COURT OF CALIFORNIA, COUNTY OF LOS ANGELES LIMITED ENGLISH PROFICIENCY (LEP) PLAN
 PLAN") I. Purpose This Limited English Proficiency (LEP) Plan outlines how the Superior Court of California, County of Los Angeles ("Court" ) provides equal access to justice for LEP persons consistent with Title
I. Purpose This Limited English Proficiency (LEP) Plan outlines how the Superior Court of California, County of Los Angeles ("Court" ) provides equal access to justice for LEP persons consistent with Title
2011 National Household Survey Profile on the Town of Richmond Hill: 1st Release
 2011 National Household Survey Profile on the Town of Richmond Hill: 1st Release Every five years the Government of Canada through Statistics Canada undertakes a nationwide Census. The purpose of the Census
High Desert ESD Employment Application 2804 SW Sixth Street Redmond OR Attn: HR Specialist Phone: (541) FAX:
 FAX:") High Desert ESD Employment Application 2804 SW Sixth Street Redmond OR 97756 Attn: HR Specialist Phone: (541) 693-5600 FAX: 541-693-5601 www.hdesd.org Last Name First Name M.I. Date Mailing Address City
High Desert ESD Employment Application 2804 SW Sixth Street Redmond OR 97756 Attn: HR Specialist Phone: (541) 693-5600 FAX: 541-693-5601 www.hdesd.org Last Name First Name M.I. Date Mailing Address City
Employment Application
 Employment Application It is the policy of Frank Beverage Group to ll every position without regard to race, color, religion, creed, sex, marital status, age, national origin, ancestry, physical or mental
QUARTERLY STATISTICAL DATA OF PUBLIC ASSISTANCE FAMILIES IN THE COUNTY OF SANTA CLARA
 QUARTERLY STATISTICAL DATA OF PUBLIC ASSISTANCE FAMILIES IN THE COUNTY OF SANTA CLARA October, 26 Robert Menicocci Director Social Services Agency Prepared by Data Analysis, Program Integrity & Research
Language Assistance Plan For Washington Metropolitan Area Transit Authority. October 2007
 Language Assistance Plan For Washington Metropolitan Area Transit Authority October 2007 1 10/19/2007 TABLE OF CONTENTS Executive Summary... 1 I. Background... 5 II. WMATA Efforts to Serve LEP Persons...
OFFICE OF THE CONTROLLER. City Services Auditor 2005 Taxi Commission Survey Report
 OFFICE OF THE CONTROLLER City Services Auditor 2005 Taxi Commission Survey Report February 7, 2006 TABLE OF CONTENTS INTRODUCTION 3 SURVEY DATA ANALYSIS 5 I. The Survey Respondents 5 II. The Reasonableness
Suffolk County Soil and Water Conservation District
 Suffolk County Soil and Water Conservation District LANGUAGE ACCESS POLICY: Providing Meaningful Language Assistance November 2013 1 LEP IMPLEMENTATION GUIDE TABLE OF CONTENTS I. SCSWCD LEP Plan Purpose
Labor Force Characteristics by Race and Ethnicity, 2015
 Cornell University ILR School DigitalCommons@ILR Federal Publications Key Workplace Documents 9-2016 Labor Force Characteristics by Race and Ethnicity, 2015 Bureau of Labor Statistics Follow this and additional
Illinois State Toll Highway Authority SPECIAL PROVISIONS FOR EQUAL EMPLOYMENT OPPORTUNITY PROGRAM
 Illinois State Toll Highway Authority SPECIAL PROVISIONS FOR EQUAL EMPLOYMENT OPPORTUNITY PROGRAM I. OBJECTIVE OF THE EQUAL EMPLOYMENT OPPORTUNITY PROGRAM (EEO): To promote equality of employment opportunity
PROTECTING CALIFORNIA S DEMOCRACY: ENSURING COMPLIANCE WITH FEDERAL AND STATE BILINGUAL VOTING ASSISTANCE LAWS
 PROTECTING CALIFORNIA S DEMOCRACY: ENSURING COMPLIANCE WITH FEDERAL AND STATE BILINGUAL VOTING ASSISTANCE LAWS For more information, contact Eugene Lee, Voting Rights Project Director, Asian Pacific American
The management team at Kensington Village Apartments looks forward to your residency. In order to move in we will require:
 Dear Prospective Resident, The management team at Kensington Village Apartments looks forward to your residency. In order to move in we will require: 1. A completed application from each applicant 18 years
APPLICATION FOR EMPLOYMENT Montgomery County Olen Underwood Juvenile Justice Center Montgomery County, TX
 1 APPLICATION FOR EMPLOYMENT Montgomery County Olen Underwood Juvenile Justice Center Montgomery County, TX 200 Academy Drive Conroe, TX 77301 Ph # (936) 538-3485 Fax # (936) 538-3461 An Equal Employment
Asian Pacific American Heritage Month: May 2004
 CB04-FF.06 April 19, 2004 Asian Pacific American Heritage Month: May 2004 In 1978, a joint congressional resolution established Asian Pacific American Heritage Week. The first 10 days of May were chosen
APPENDIX B. Environmental Justice Evaluation
 Appendix B. Environmental Justice Evaluation 1 APPENDIX B. Environmental Justice Evaluation Introduction The U.S. Department of Transportation has issued a final order on Environmental Justice. This final
NECTD Title VI Policy and Procedures. northeastern connecticut transit district nectd.org
 NECTD Title VI Policy and Procedures northeastern connecticut transit district nectd.org Introduction The Northeastern Connecticut Transit District (NECTD) is committed to a policy of non-discrimination
FY Purdue University Minority-Owned and Women-Owned Business Enterprise Utilization. Office of Supplier Diversity Development
 FY 2013 Purdue University Minority-Owned and Women-Owned Business Enterprise Utilization Office of Supplier Diversity Development PURDUE UNIVERSITY MINORITY-OWNED BUSINESS ENTERPRISE AND WOMEN-OWNED BUSINESS
LANGUAGE ACCESS PLAN AT A GLANCE
 LANGUAGE ACCESS PLAN AT A GLANCE Executive Summary CHA s Office of Diversity was tasked to manage translation and interpretation services in January of 2015. Following a series of internal and external
Area Year 2000 Year 2030 Change. Housing Units 3,137,047 4,120, % Housing Units 1,276,578 1,637, % Population 83,070 96,
 4.3 POPULATION, HOUSING AND ENVIRONMENTAL JUSTICE This section describes potential project-related impacts to population, housing and employment associated with the Canoga Transportation Corridor Project.
FY Purdue University Minority-Owned and Women-Owned Business Enterprise Utilization. Office of Supplier Diversity Development
 FY 2012 Purdue University Minority-Owned and Women-Owned Business Enterprise Utilization Office of Supplier Diversity Development PURDUE UNIVERSITY MINORITY-OWNED BUSINESS ENTERPRISE AND WOMEN-OWNED BUSINESS
APPLICATION FOR EMPLOYMENT
 APPLICATION FOR EMPLOYMENT We are an equal opportunity employer and do not unlawfully discriminate in employment. No question on this application is used for the purpose of limiting or excluding any applicant
Lutheran Senior Services of Southern Chester County (PA), Inc. Luther House II, Inc. Luther House III, Inc. Luther House IV, Inc.
, Inc. Luther House II, Inc. Luther House III, Inc. Luther House IV, Inc.") Lutheran Senior Services of Southern Chester County (PA), Inc. Luther House II, Inc. Luther House III, Inc. Luther House IV, Inc. Thank you for your interest in Luther House. There are a total of 256 apartments
Lutheran Senior Services of Southern Chester County (PA), Inc. Luther House II, Inc. Luther House III, Inc. Luther House IV, Inc. Thank you for your interest in Luther House. There are a total of 256 apartments
MONTEREY - SALINAS TRANSIT
 MONTEREY - SALINAS TRANSIT MARINA AREA SERVICE STUDY FINAL REPORT SEPTEMBER 2009 1. EXECUTIVE SUMMARY 01 2. CUSTOMER SURVEY ANALYSIS 05 3. COMMUNITY SURVEY ANALYSIS 35 TABLE OF CONTENTS 4. CSUMB SURVEY