Vienna. transnational organized crime threat assessment. Not for quotation
|
|
|
- Annice Preston
- 6 years ago
- Views:
Transcription
1 UNITED NATIONS OFFICE ON DRUGS AND CRIME Vienna transnational organized crime threat assessment DRAFT - 26/03/2010 Not for quotation
2
3 CONTENTS CONTENTS PREFACE EXECUTIVE SUMMARY 1 INTRODUCTION 19 CHAPTER 1. THE THREAT OF TRANSNATIONAL ORGANIZED CRIME 25 CHAPTER 2. TRAFFICKING IN PERSONS To Europe for sexual exploitation From East Asia to the world 53 CHAPTER 3. SMUGGLING OF MIGRANTS From Latin America to North America From Africa to Europe 77 CHAPTER 4. COCAINE From the Andean Region to North America From the Andean Region to Europe 105 CHAPTER 5. HEROIN From Afghanistan to the Russian Federation From Afghanistan to Europe 129 CHAPTER 6. FIREARMS From the United States to Mexico From Eastern Europe to the world 151 CHAPTER 7. ENVIRONMENTAL RESOURCES Wildlife from Africa and South-East Asia to Asia Timber from South-East Asia to the European Union and Asia 173 CHAPTER 8. COUNTERFEIT PRODUCTS Consumer goods from East Asia to Europe Medicines from South- and East Asia to South-East Asia and Africa 195 CHAPTER 9. MARITIME PIRACY Maritime piracy off the coasts of the Horn of Africa 209 CHAPTER 10. CYBERCRIME Identity theft Child pornography 225 CHAPTER 11. REGIONS UNDER STRESS: WHEN TOC THREATENS GOVERNANCE AND STABILITY 235 The impact of cocaine trafficking on stability The impact of cocaine trafficking on the Andean Region The impact of cocaine trafficking on West Africa The impact of cocaine trafficking on Mesoamerica 253 The impact of heroin trafficking on stability The impact of heroin trafficking on South-West and Central Asia The impact of heroin trafficking on South-East Europe The impact of heroin trafficking on South-East Asia 273 The impact of minerals smuggling on Central Africa 277 The impact of maritime piracy on the Horn of Africa 283 CONCLUSION 291 ENDNOTES 299 ii Case studies of transnational threats i
4
5 KEY FINDINGS KEY FINDINGS There are two ways of looking at transnational organized crime (TOC): some focus on multi-crime groups of professional criminals, while others focus on illicit markets. To date, most of the attention has been given to the first approach, addressing TOC groups, using the tools of arrest and seizure, and this approach has seen some success at the national level. National successes have often pushed trafficking flows into other countries, however, with the flow often settling along the path of least resistance, frequently in countries with little capacity to bear the burden of TOC. Most organized crime problems today seem to be less a matter of a group of individuals who are involved in a range of illicit activities, and more a matter of a group of illicit activities in which some individuals and groups are presently involved: strategies aimed at the groups will not stop the illicit activities if the dynamics of the market remain unaddressed. Most TOC flows begin on one continent and end on another, often by means of a third, so only interventions at the scale of the problem global are likely to have a sustained effect. The first step in addressing these global markets is to better understand them, and the detailed descriptions of contraband flows offered in this report is a step in that direction. With regard to human trafficking, a greater variety of nationalities of victims have been detected in Europe than in any other region, while victims from China have been detected in a greater variety of countries than any other nationality. After a strong increase at the end of the Cold War, human trafficking to Europe for the purpose of sexual exploitation appears to have stabilized, with women from a wide variety of countries displacing the Eastern European victims that formerly dominated this market. Although frequently characterized as migrant smuggling, the debt-bondage of illegal Chinese labourers is so great that the phenomenon is better classified as human trafficking, and this flow appears to be growing as overseas commercial interests expand. With regard to migrant smuggling, the two most prominent flows are the movement of workers from Latin America to North America and from Africa to Europe. Most irregular migrants to the United States of America enter clandestinely across the south-west border of the country and over 90% are assisted by professional smugglers, but this flow appears to be declining in response to the global financial crisis. The routes for migration from sub-saharan Africa to Europe have shifted dramatically in response to enforcement efforts, so the smugglers are often opportunistic entrepreneurs. While the number of detected migrants has recently declined dramatically, it is too early to draw conclusions about the long-term trend. With regard to heroin trafficking, some 95% of the global heroin supply comes from opium poppy cultivated in Afghanistan, and the majority of this is consumed in Europe, the Russian Federation and countries en route to these destinations. The route to the Russian Federation takes advantage of cross-border social and ethnic linkages in the new states of Central Asia, mostly moving the heroin in small amounts on board commercial and private vehicles. In contrast, the flow to Europe appears to be more highly organized, with much larger shipments crossing a greater number of borders involving states with much higher interdiction capacity. With regard to cocaine trafficking, the vast bulk of the flow proceeds from the Andean region to North America (often via Central America) and Europe (often via West Africa). Consumption of cocaine in the United States has been in long-term decline since the 1980s and has dramatically dropped off since This is likely due to enforcement efforts in Latin America, but these efforts have increased competition and violence between trafficking groups. International attention and intervention, as well as political changes, appear to have substantially reduced trafficking through West Africa after Demand in Europe appears to be stabilizing after rapid growth in the last decade. With regard to firearms trafficking, traffickers service two primary markets for illicit arms those who need weapons for criminal purposes (such as Case studies of transnational threats v
6 KEY FINDINGS the flow from the United States to Mexico), and those who need them for political ones (such as the flow from Ukraine to Africa). Different types of arms and techniques are implicated in each case. Most of the firearms trafficked from the United States to Mexico appear to be acquired from licensed dealers by straw purchasers and then trafficked across the border in very small batches by a large number of couriers taking advantage of the high levels of cross-border traffic. This long-standing flow appears to be stable. With massive stocks of arms from the Soviet era, Ukraine remains vulnerable to trafficking through misuse of export documents and corruption, but the pressures of the financial crisis are likely to be offset by the global decline in civil conflict. With regard to environmental resource trafficking, the trafficking of wildlife from Africa and South-East Asia to other parts of Asia and the trafficking of timber to China and Europe represent two of the best documented flows. While the poaching of large species in Africa captures most of the attention and the demand for rhinos appears to have recently increased dramatically, the growing consumption of a wide variety of smaller species in South-East Asia could have greater long-term environmental consequences and almost certainly brings more money to organized crime. Measures have been taken to prevent the import of illegally harvested wood, but corruption and timber laundering in third countries are undermining these efforts, even as demand grows. With regard to product counterfeiting, the outsourcing of production to Asia has fuelled global economic growth, but it has also created opportunities for counterfeiting. This can be seen in the flow of counterfeit consumer goods to Europe and the flow of counterfeit medicines to South-East Asia and Africa. With regard to maritime piracy, the traditional robbery on the high seas has been transformed into a form of kidnapping for ransom, as Somali pirates, sometimes directed by shipping industry insiders, seek a growing number of targets further and further from their national waters. With regard to cybercrime, the Internet has allowed traditional acquisitive crime, such as identity theft, and transnational trafficking, such as the trade in child pornography, to vastly increase in scope. Online identity theft is still far less common than other forms of the crime, but the potential is much greater, and appears to be most advanced in the United States in terms of both victims and perpetrators. The production and distribution of child pornography used to be both dangerous and inefficient, and there was a risk that the rise of the Internet would increase demand to the point that multi-crime groups began victimizing children for profit. To date, this risk does not appear to have been realized, though, as an increasing share of child pornography distributed is exchanged between peers on a noncommercial basis. Transnational organized crime can have an impact on political stability in vulnerable countries, including both in countries where insurgencies are funded though trafficking (in the Andean Region, South and Central Asia and Central Africa), and in countries where violence and corruption pose a serious challenge to the rule of law (West Africa and Mesoamerica). Global strategies are required to address each TOC problem, in some cases involving better regulating licit commerce as a way of controlling illicit trade. The flow of counterfeit goods into Europe, while small in comparison to licit goods, appears to have increased dramatically in recent years, and the lack of accountability for these items renders some classes of goods a serious public safety concern. Trafficking of medicine is an opportunistic crime, emerging where regulatory capacity is low, not where profits would be highest. Because many of these products are dilute versions of genuine products, they may foster the evolution of drug-resistant strains of deadly pathogens. vi TRANSNATIONAL ORGANIZED CRIME THREAT ASSESSMENT
7 EXECUTIVE SUMMARY EXECUTIVE SUMMARY Transnational organized crime only found its way onto the international agenda recently, but has gathered considerable attention in recent years. The United Nations Convention against Transnational Organized Crime entered into force in The next year, the United Nations High-level Panel on Threats, Challenges, and Change, identified transnational organized crime as one of six clusters of threats with which the world must be concerned now and in the decades ahead. 1 In February 2010, the UN Security Council noted with concern the serious threat posed in some cases by drug trafficking and transnational organized crime to international security in different regions of the world and invited the Secretary-General of the United Nations to consider these threats as a factor in conflict prevention strategies, conflict analysis, integrated missions assessment and planning. 2 Stopping the operations of transnational organized crime has thus become a matter of international priority. Translating political will into concrete results will mean achieving two difficult goals: understanding transnational organized crime and integrating national responses into international strategies. This report is a contribution to the first effort. A non-exhaustive list of the transnational organized crime problems confronting us would surely include human trafficking, migrant smuggling, heroin trafficking, cocaine trafficking, firearms trafficking, environmental resources trafficking, counterfeit goods trafficking, maritime piracy and cybercrime. Because most of these problems involve the trafficking of people or goods internationally, this report focuses on documenting two distinct flows as examples of each organized crime problem. This allows discussion of concrete details on how the trafficking is being conducted and who is involved. It also allows more accurate estimation of the size of the flow than is generally possible when speaking in global terms. Finally, this report looks at certain regions that are particularly vulnerable to the destabilizing impact of organized crime. What is transnational organized crime? Under the Organized Crime Convention, transnational organized crime (TOC) is any serious transnational offence undertaken by three or more people with the aim of material gain. This understanding is broader than that popularly used, which tends to focus on multi-crime groups of career criminals. This focus on the groups rather than the offences has deep implications for the way TOC is understood and addressed. Law enforcement officials tend to conceive of TOC as groups of people, because the tools they possess the powers of arrest and seizure can only be levelled against individuals. But TOC problems are often caused by factors other than the people presently implicated. To solve these problems, tools are needed beyond those given to law enforcement officials. Law enforcement officials are also limited to action within their national jurisdiction. Facilitated by the Convention and similar mechanisms, bilateral and regional cooperation are possible, but the TOC problems examined in this report are often global in scale. To resolve global issues, global strategic thinking is required. Gathering reliable information on which to base this strategy is no easy task. Unlike the conventional crimes (murder, rape, robbery et cetera), citizens rarely approach the police with complaints about organized crime. Many of the offences are victimless, in the sense that none of the parties participating has any interest in bringing the matter to the attention of the police. Consequently, most organized criminal activity is only registered when the police take the pains to proactively investigate it. Some enforcement agencies lack the capacity, or the mandate, to do this. Of all the areas under consideration, the most is known about drug trafficking. UNODC and concerned governments have conducted surveys of the major cultivation areas for coca bush and opium poppy for many years, and so estimates can be made with some precision as to how much cocaine and heroin are being produced. Many countries submit their drug seizure data to UNODC, and many of the main destination countries have survey data on the size of the drug-using population. Supply, demand and seizures can be triangulated to give a more reliable picture than any single data source could generate. But there are still serious deficiencies in our knowledge about the way drug markets operate. Even less is known about other areas of transnational organized crime, and there are few global databases on these topics. The matter is made all the more confusing because the nature of transnational organized crime is changing all the time. Drug epidemics have come and gone and resurfaced in new environs. Human 1

8 EXECUTIVE SUMMARY FIG. 1: MAIN GLOBAL TRANSNATIONAL ORGANIZED CRIME FLOWS DISCUSSED IN THIS REPORT Russian Federation United States of America West Central Europe North Africa South- East Europe Ukraine Gulf area, Middle East Central Asia Afghanistan China India Mexico Myanmar Caribbean Source: UNODC Central America Andean region Brazil West Africa Central Africa DR of the Congo Southern Africa East Africa Horn of Africa South East Asia Heroin Smuggling of migrants Cocaine Workers from China Counterfeit medicines Timber Gold Cassiterite rest of the world Japan UNODC / SCIENCES PO Counterfeit consumer goods Wildlife Firearms Female trafficking victims (main sources) Piracy off the Horn of Africa 2 TRANSNATIONAL ORGANIZED CRIME THREAT ASSESSMENT
9 EXECUTIVE SUMMARY trafficking and firearms flows have rapidly expanded in areas of conflict and subsided just as rapidly. The end of the Cold War, the decline in the number and severity of civil wars, and the advance of globalization all have impacted on organized crime in unpredicted ways. Future trends are likely to be affected by global shifts in demographics, migration, urbanization, conflict and economics. To avoid being blindsided, the international community needs to better understand the way that TOC patterns relate to broader social changes. Aside from what little is known about specific markets, can anything sensible be said about trends in transnational organized crime generally? There appears to be general consensus that both highly structured and loosely structured organizations are involved in transnational organized crime, and a number of authorities have argued that the former are losing out to the latter. Under enforcement pressure, the narrative goes, the traditional, hierarchical organized crime groups have developed a cell structure similar to that seen in terrorist groups, with small networks doing the work formerly performed by more rigid structures. Rather than being an adaptive response of traditional groups, it appears that these networks of market-driven individuals have always existed in transnational trafficking, but were less visible to law enforcement authorities focused on local crime problems. Perhaps it is safest to say that the groups themselves have become less important than the markets with which they engage. Today, organized crime seems to be less a matter of a group of individuals who are involved in a range of illicit activities, and more a matter of a group of illicit activities in which some individuals and groups are presently involved. If these individuals are arrested and incarcerated, the activities continue, because the illicit market, and the incentives it generates, remain. To solve TOC problems, it is necessary to come to terms with these markets on the scale at which they operate. The following case studies are an attempt at assessing some of these flows. Trafficking in persons Trafficking in persons is a truly global phenomenon: in data recently reported to UNODC, victims from at least 127 countries were detected, and 137 countries reported having detected victims. While this sample may not be representative of the entire victim pool, two thirds of the victims reported were women, and 79% of the victims were subjected to sexual exploitation. The European Union has one of the best documented pools of victims of trafficking for the purposes of sexual exploitation, with a greater variety of nationalities (at least 95) than any other part of the world. This market is the subject of the first flow study. The nationality detected in the greatest number of countries around the world, however, is Chinese, and this flow is the subject of the second study. Trafficking of women to Europe With the end of the Cold War, a large number of labourers of all sorts moved from Eastern to Western Europe. Some of these labourers were or became sex workers, and not all came voluntarily. In 2005/2006, 51% of human trafficking victims detected in Europe were from the Balkans or the former Soviet Union, in particular Romania, Bulgaria, Ukraine, the Russian Federation and the Republic of Moldova. But this appears to be changing, as women trafficked from other parts of the world are becoming more prominent. In many instances, women, some of whom may have once been victims themselves, play an important role in exploiting the victims. The traffickers are often of the same nationality as the victim, although there are important exceptions. The techniques used to recruit victims seem to vary by source country: in Ukraine, for example, victims may be collected through employment agencies, while in West Africa, family and social networks are utilized. As a general rule, groups engaging in trafficking for sexual exploitation are small, although there have been exceptions. FIG. 2: ORIGINS OF TRAFFICKING VICTIMS DETECTED IN WEST AND CENTRAL EUROPE, Central Europe 7% Balkans 32% Former Soviet Union 19% Africa 5% Others 21% South America 13% East Asia 3% Source: Elaboration of UNODC-UN.GIFT data 3
10 EXECUTIVE SUMMARY FIG. 3: The chapter estimates that there are 140,000 trafficking victims in Europe, generating a gross annual income of US$2.5 billion for their exploiters. With an average period of exploitation of two years, this would suggest over 70,000 new entries every year. The trend appears to be stable. Labour trafficking from East Asia East Asia, particularly China, has emerged as a world leader in the export of labour, and not all migration from that region is regular. Illegal emigration from China is very expensive, and since few of China s poor can afford to pay to be smuggled based on their existing resources, most agree to pay the smuggler out of future earnings. This creates a situation which is often characterized as migrant smuggling, but in fact is human trafficking. Although the migrants voluntarily take on the debt, the debtor assumes an ownership interest in the victims, and cannot afford to allow them freedom of movement. The result is coerced labour, almost always exploitative, and generally backed by the threat of violence. Snakehead traffickers transport migrants in a variety of ways, but routes are often convoluted and the length of the passage prolonged. While not all snakeheads are triad members, there is evidence of triad involvement in human trafficking. On arrival, migrants may be employed in sex work or other forms of labour, particularly in textile manufacturing and restaurant work. Previously, Chinese sex workers were imported primarily to service the Chinese community, but more recently, they have risen in prominence in the general trade, becoming the most detected foreign nationality in some countries. MOST DETECTED NATIONALITIES OF FOREIGN VICTIMS OF HUMAN TRAFFICKING IN THE NETHERLANDS (COUNT), Smuggling of migrants Due to global inequalities and restrictive immigration policies, many workers from developing regions are willing to borrow heavily from their communities and risk their lives to access opportunities in the more affluent countries. Since they cannot do this legally, they often employ organized criminals to assist them, and become more likely to do so as immigration controls tighten. Because these services are illegal, those who provide them have tremendous power over their charges, and abuses are commonplace, particularly when the movement is clandestine. This report examines two northward smuggling flows: from Latin America to North America and from Africa to Europe. Latin America to North America The USA hosts the second-largest Spanish speaking population in the world, including more than 9 million people born in Mexico. Over a third of the population speaks Spanish in the border states of California, Texas and New Mexico. Combined with the fact that some 150 million Latin Americans live on less than two dollars per day, this expatriate population exerts a powerful pull on the poorer states to the south. Mexican immigrants can expect to greatly improve their standard of living without having to master a new language or leave behind their cultural group. As a result, an estimated 80% of the illegal immigrant population in the United States is from Latin America. Most clandestine entrants to the USA come across the Mexican land border, most of these entrants are Mexican, and over 90% of illegal Mexican migrants are assisted by professional smugglers. Some 88% of the total 792,000 migrants apprehended in 2008 were Mexican nationals, and the remainder were mostly other Latin Americans Chinese Nigerian Hungarian Sierra Leonean Source: Dutch National Rapporteur Bulgarian Romanian Although migrants have been detected travelling by rail, on foot and even using dedicated tunnels, most of the migrants are smuggled in trucks. The smuggling generally takes the migrants some distance from the border. Smuggled migrants may be collected in stash houses, either before the crossing or once inside the USA. The smugglers group the migrants in these houses in order to receive the rest of the smuggling fee. This is normally paid by migrants relatives in the country of origin or in the USA. While delaying payment until the crossing is complete provides some security that migrants will not simply be dumped in the desert, it also transforms the migrants into hostages, the collateral on which the transaction is secured. In Mexico, non- 4 TRANSNATIONAL ORGANIZED CRIME THREAT ASSESSMENT
11 EXECUTIVE SUMMARY Mexican migrants have been held for ransom as well. While some sophisticated operations have been detected, it appears that a large number of small groups handle the bulk of the trade. Overall, it appears that about 3 million Latin Americans are smuggled illegally across the southern border of the USA every year. Since 90% of them are assisted by smugglers, the income for the smugglers is likely to be around 7 billion dollars per year. This market appears to have been in sharp decline since Between 2005 and 2008, the number of Mexican apprehensions decreased by 35% and apprehensions of other nationals decreased by 62%. Africa to Europe The dynamics behind African migration to Europe are similar to those behind Latin American migration to the USA, except the push and pull factors are even stronger. The fact that illegal immigration from Africa to Europe is a fraction the size of that from Latin America to the USA is probably partly due to the relative difficulty of making the crossing, and partly due to the relatively small size of the African expatriate population in Europe. Nonetheless, Europe does host the largest African-born population outside Africa, and remittances form a significant share of GDP in many African countries. Most migrant smuggling routes involve long land passages and short maritime hops to European islands. Both parts of this voyage are hazardous, and the migrants are subject to exploitation throughout their journey. The routes taken have changed dramatically in response to enforcement action. For example, the Canary Islands grew rapidly until 2006, at which point enforcement pushed the flow toward Lampedusa, until a cooperation agreement between Italy and the Libyan Arab Jamahiriya in May 2009 abruptly shut this route down. Since these islands are not the final destination of the migrants, they rely on the authorities to transport them to the mainland. Many European countries do not have repatriation agreements with African countries, and migrants without identification papers are generally released with an order to depart. Counting on this outcome, most African migrants actively seek to be detected by the authorities. This makes assessing the flow relatively simple. Some 55,000 migrants were smuggled into Europe in 2008, worth about US$150 million to the small groups of smugglers who found themselves positioned along the route at that time. The overall flow appeared to be slowly growing until 2009, but it FIG. 4: 100% 95% 90% 85% 80% 75% 70% 65% 60% 55% 50% FIG. 5: 12% 10% 8% 6% 4% 2% 0% remains to be seen whether the financial crisis will reverse this trend in Europe as it has in the United States. Cocaine SHARE OF MEXICAN ILLEGAL IMMIGRANTS MAKING USE OF SMUGGLERS, Source: Mexican Migration Project REMITTANCES AS PERCENTAGE OF GDP TOP 20 AFRICAN COUNTRIES, 2007 Senegal Cape Verde Morocco Sierra Leone Liberia Guinea-Bissau Gambia Kenya Egypt Nigeria Mali Tunisia Benin Uganda Sudan Djibouti Guinea Mauritius Comoros Niger Source: World Bank Cocaine comes from three countries, but control over production has long been in the hands of Colombian traffickers. Until recently, almost all cocaine production was directed north, to the US market, but US demand has been declining since the 1980s, and recently fell precipitously. At the same time, cocaine demand in Europe began to grow, and has increased rapidly in the twenty-first century. 5
12 EXECUTIVE SUMMARY FIG. 6: DISTRIBUTION OF THE COCAINE USER POPULATION IN EUROPE, Other European countries, 8% EFTA countries, 2% UK, 23% Following the dismantling of the Medellin and Cali cartels in the early 1990s, the Colombian organized crime groups got smaller and violence declined. At the same time, Mexican groups grew in size and strength, and today are responsible for most of the violence in Mexico. Other EU countries, 13% France, 5% Germany, 9% Italy, 19% Source: Multiple sources Spain, 21% From South America to North America The ways cocaine is moved from South America to North America have varied over time, partly in response to enforcement efforts and partly due to changes in the groups doing the trafficking. Today, cocaine is typically transported from Colombia to Mexico or Central America by sea (usually by Colombians) and then onwards by land to the United States and Canada (usually by Mexicans). The US authorities estimate that close to 90% of the cocaine entering the country crosses the US/ Mexico land border, and some 70% of the cocaine leaves Colombia via the Pacific, 20% via the Atlantic, and 10% via the Bolivarian Republic of Venezuela and the Caribbean. Some 196 tons of cocaine are needed to satisfy US demand, a flow valued at US$38 billion in 2008, but this money is not evenly distributed. The coca farmers in the three Andean countries earned about US$1.1 billion that year. The amounts generated from processing and trafficking activities within the Andean countries for cocaine destined to be shipped towards North America amounted to around US$400 million. The total gross profits accruing to those importing cocaine to Mexico can be estimated at around US$2.4 billion (excluding costs of shipping), and the Mexican cartels reaped US$2.9 billion that year moving the cocaine across the border into the USA. The largest profits, however, are generated within the USA: US$29.5 billion between the US wholesale level and US consumers. Out of these gross profits, the bulk is made between the mid-level dealers and the consumers, accounting for more than US$24 billion or 70% of the total size of the US cocaine market. From the Andean Region to Europe The number of cocaine users in Europe has doubled over the last decade, from 2 million in 1998 to 4.1 million in 2007/2008. The overall level of cocaine use is still lower than in North America, but individual European countries, notably Spain and the United Kingdom, now have higher annual preva- FIG. 7: DISTRIBUTION OF COCAINE SEIZURES MADE IN CENTRAL AMERICA, THE CARIBBEAN AND MEXICO, % 90% 80% 70% 60% 50% 40% 30% 20% 10% 0% Mexico Central America Caribbean Source: UNODC, Annual Reports Questionnaire Data / DELTA 6 TRANSNATIONAL ORGANIZED CRIME THREAT ASSESSMENT
13 EXECUTIVE SUMMARY lence rates than the USA. The European cocaine market grew in value from US$14 billion in 1998 to US$34 billion in 2008, about the same size as the US market. Preliminary data suggest the rapid growth of the European cocaine market is beginning to level off, however. Most of the trafficking of cocaine to Europe is by sea. Most cocaine shipments to Europe are destined for one of two regional hubs: Spain and Portugal in the south and the Netherlands and Belgium in the north. Colombia remains the main source of the cocaine found in Europe, but direct shipments from Peru and the Plurinational State of Bolivia are far more common than in the US market. The routes taken to arrive in Europe have changed in recent years. Between 2004 and 2007, at least two distinct transshipment hubs emerged in West Africa: one centred on Guinea-Bissau and Guinea, and one centred in the Bight of Benin which spans from Ghana to Nigeria. Political turmoil in the northern hub and successful interdiction elsewhere appears to have dampened this transit route for the time being, although it could quickly re-emerge. The Bolivarian Republic of Venezuela has also emerged as a key transit country for shipments to Europe, particularly for large maritime shipments. In the end, about 124 tons of cocaine are distributed in Europe, worth some US$34 billion. It appears that less than 1% of the value of cocaine sales in Europe goes to the Andean coca farmers, and another 1% goes to traffickers within the Andean region. The international traffickers who ship the cocaine from the Andean region to the main entry points (notably Spain) obtain 25% of the final sales value. A further 17% is generated in shipping the cocaine from the entry points to the wholesalers in the final destination countries across Europe. The largest income is generated in the destination countries, between the wholesaler and the consumer, generating more than 56% of the total. As there are far more dealers at the national level, however, the per capita income of the dealers at the national level in Europe is lower than among the smaller group of internationally operating cocaine dealers. Western Europe (US$20 billion). Most of the profits go to the organized crime groups along the route, but some goes to fund insurgents in Afghanistan. Afghanistan to the Russian Federation After the fall of the Soviet Union, the use of heroin appears to have rapidly grown in the Russian Federation, but began to stabilize around Today, there are an estimated 1.5 million heroin users in the Russian Federation, making it the single largest national heroin consumer in the world. To get to Russian markets from Afghanistan, land transport appears to be the most popular route. Twenty years ago, all the countries north of Afghanistan were part of the USSR, so cross-border linkages are common. These new states are mostly poor and some have had problems with political insurgencies. Underresourced and struggling to find their feet, stopping trans-shipment of heroin was not an early priority. Today, efforts are being made, and several tons of heroin are seized each year, but some 70 tons manage to make their way through to satisfy demand in the Russian Federation. To get 70 tons to the Russian consumer, some 95 tons, or 25% of all Afghan heroin exports, must pass from Afghanistan into Central Asia, with Tajikistan handling most of this volume. Both large, well-organized groups and small entrepreneurs appear to be engaged in trafficking, with the drug typically changing hands multiple times before reaching the consumer. Cross-border familial and ethnic linkages appear to be important in facilitating the flow. FIG. 8: GLOBAL HEROIN CONSUMPTION (340 TONS), 2008 (SHARE OF COUNTRIES/REGIONS) Pakistan, 6% (19 tons) Others, 7% (24 tons) Africa, 7% (24 tons) Islamic Republic of Iran, 5% (17 tons) China, 13% (45 tons) India, 5% (17 tons) S&SE Asia, 5% (17 tons) Heroin The origin of most of the world s heroin is concentrated in a handful of provinces in embattled Afghanistan. Afghan heroin feeds a global market worth about US$55 billion annually. The Balkan and Northern routes are the main heroin trafficking corridors linking Afghanistan to the huge markets of the Russian Federation (US$13 billion) and USA& Canada, 6% (22 tons) Europe (except Russia&Turkey), 26% (87 tons) Source: UNODC Russian Federation, 21% (70 tons) 7
14 EXECUTIVE SUMMARY FIG. 9: Italy 20% UK 21% France 11% These 70 tons are sold for US$13 billion in Russian markets, and this flow appears to have been increasing since Afghanistan to Europe ESTIMATED HEROIN CON- SUMPTION DISTRIBUTION IN EUROPE (TOTAL 87 TONS) Germany 8% Source: UNODC R est of E urope 40% The Balkan route proceeds by land from the Islamic Republic of Iran (or Pakistan into the Islamic Republic of Iran) via Turkey and through South-East Europe. To satisfy European demand for 87 tons of heroin, about 140 tons must depart Afghanistan along this route, largely due to high levels of seizures in the Islamic Republic of Iran and Turkey. Most of this heroin is consumed in just four countries: the United Kingdom, Italy, France and Germany. Organized crime groups involved in international trafficking on the Balkan route are often composed of nationals from the source or transit countries. But, at various stages, many of the traffickers may be transportation professionals contracted to do the job, not necessarily members of the group that owns the drugs. Opiates destined for Western Europe are trafficked out of Afghanistan by Baluchi and Pashtun networks operating in the border regions of Afghanistan, Pakistan and the Islamic Republic of Iran. Baluchi groups are believed to offload their shipments in the Islamic Republic of Iran to groups with greater regional and international ties, such as Azeri, Arab, Persian and Kurdish groups. Once opiates have changed hands, these groups are then mainly responsible for shipping the drugs from the eastern to the western borders of the Islamic Republic of Iran. Once in Turkey, large shipments are broken down into smaller parcels for distribution in Europe. In the Balkans, relatively little heroin is seized, suggesting the route is exceedingly well organized and lubricated with corruption. Balkan groups are important through the Balkans, but do not appear to control the drugs in destination markets. In most European countries, nationals control the local drug markets. The Netherlands acts as another redistribution center, after Turkey. Firearms The trafficking of firearms is unlike many of the other forms of trafficking discussed in this report because firearms are durable goods. In addition, the modern pistol or assault rifle represents a mature technology, so current weapons holders do not need to regularly update their stock to remain competitive. Consequently, the number of new small arms purchased each year is only about 1% of those already in circulation, and this likely applies to both licit and illicit markets. There are two primary markets for illicit arms those who need weapons for criminal purposes, and those who need them for political ones. The movement of firearms from the United States to Mexico represents an example of the first, while the outflow of guns from Ukraine serves as an example of the second. From the United States to Mexico The United States of America is an obvious source of weapons for criminals in Mexico. The United States has the most heavily armed civilian population in the world, with about one quarter of all adults having at least one firearm. The gun trade in the United States is subject to competitive pressures, so weapons are also inexpensive in comparison to countries where firearms sales are highly regulated, such as Mexico. It appears that most of the firearms trafficked into Mexico are purchased from one of the 6,700 gun dealers along the border with Mexico using straw purchasers and driven across the border by a large number of cross-border smugglers. Very small batches of weapons are moved across at the regular crossing points, concealed in private vehicles. About 88 million passenger cars cross the border each year, and most of those crossing the border do so every day; a single smuggler following this ebb and flow can transport more than 500 weapons per year in loads too small to be suspected as organized trafficking. In the end, the cross-border trade in arms is best seen as a market, rather than a group-driven activity. Mexico already has a lot of illicit arms, however: an estimated 10 million unregistered weapons, or enough to arm one in three of the adult males in the 8 TRANSNATIONAL ORGANIZED CRIME THREAT ASSESSMENT
15 EXECUTIVE SUMMARY country. In this context, trafficking serves mainly to top up the market. Based on what is known about the size of the groups that provide the bulk of demand the drug cartels an estimated 20,000 weapons are trafficked each year, worth at most US$20 million. From Eastern Europe to the world The dissolution of the former Soviet Union left many of the new countries, particularly on strategic borders, with an unwanted legacy: large stockpiles of aging, but still functional, arms and ammunition. Ukraine is a case in point. After dissolution, Ukraine essentially inherited 30% of the Soviet military-industrial complex. The country currently holds an estimated 7 million small arms. In absolute terms, this is the third largest stockpile in the world, after China and the Russian Federation, but Ukraine emerges as the country with the most spare firearms per active duty soldier. This large stockpile poses a danger to the international community because Ukraine has proven vulnerable to weapons trafficking in the past. Since Ukrainian independence in 1992, there have been numerous reports of attempted or completed transfers to states subject to sanctions or involved in regional conflicts, particularly in Africa. To arm a revolution or embargoed military, a large number of weapons is required. It is generally difficult to steal and clandestinely traffic sufficient quantities to make the venture worthwhile, so most military arms trafficking takes place under a veneer of legality. Like other commodities where the legality of a shipment is entirely dependent on paperwork, most large-scale arms trafficking hinges on corruption. Most transactions involve a combination of officials and international arms brokers. These brokers sell their connections, their access to fraudulent paperwork, and their transportation services to both insurgent groups and embargoed states. They operate chains of shell companies and often own small fleets of surplus planes and other vehicles. Because warring parties may lack an international currency, brokers may take payment in the form of natural resource concessions, making money on both the sale of the arms and the sale of exported commodities. As a result, they may have a background in dealing in natural resources. In terms of valuation, arms trafficking to political combatants is episodic, and so it is difficult to speak of a consistent flow. During a crisis, demand may be high, only to subside as peace is restored. Looking just at shipments connected to the case of the FIG. 10: Russian Federation Rep. of Korea FIG. 11: Ukraine Viet Nam China Germany DPR Korea Turkey I. R. of Iran India United States India China Germany France Brazil Mexico Russian Federation Yemen South Africa England and Wales Colombia Ukraine FIREARMS PER ACTIVE DUTY SOLDIER, TOP 10 LARGEST NATIONAL ARSENALS MV Faina, a ship bearing arms that were eventually diverted to South Sudan, some 40,000 Kalashnikovs were sold in 2007/2008, valued at some US$33 million. The value of the larger shipments, which included heavy weapons and tanks, has been placed at US$2.5 billion. Environmental resources 5 There are many forms of transnational organized environmental crime, and as global regulations grow, new forms will emerge. Classically, there are two major subheadings under which these offences fall. One is crime related to pollution, in particular hazardous waste dumping and the trade in ozone millions Source: Elaborated from estimates in Small Arms Survey Source: Elaborated from estimates in Small Arms Survey 2007 TOTAL CIVILIAN FIREARMS HOLDINGS, SELECTED COUNTRIES 54 9
16 EXECUTIVE SUMMARY FIG. 12: kg of raw ivory equivalent seized 40,000 35,000 30,000 25,000 20,000 15,000 10,000 5,000 0 depleting substances. The second is crimes related to illicit harvesting of natural resources, in particular threatened animal species, timber and fish. This discussion focuses on two important instances of environmental resource theft and trafficking: the trafficking of endangered species from Africa and South-East Asia to Asia as a whole, and the trafficking of timber from South-East Asia to Europe and Asia. Wildlife from Africa and South-East Asia to Asia Between them, sub-saharan Africa and South-East Asia are home to a large share of the world s endangered large mammal species. Both regions face serious challenges to environmental protection, including a lack of effectively managed resources for law enforcement, few alternative livelihoods for rural people, long hunting traditions, periodic insurgencies and conflicts, weak border enforcement, and some enforcement officials who may find the economic potential of this market more attractive than their salary. These problems are not unique to these regions, but, unfortunately, the wildlife species are. The first step in the trafficking chain is poaching. Well-organized groups have been documented, and it is clear that some have turned environmental exploitation into a business. Not all players in the market are full-time professionals, and some of those sourcing wildlife products may be informal participants. In Africa, every state with a wildlife population is affected by poaching, but it appears that Central Africa is the main source of elephant ivory, and Southern Africa the main source of rhino horn. QUANTITIES OF IVORY SEIZED ANNUALLY AND RE- CORDED IN THE ELEPHANT TRADE INFORMATION SYSTEM, Source: TRAFFIC Some of these products are retailed to tourists locally, but very large consignments of ivory have been detected en route to Asia, representing larger organizations. There is evidence of militants being involved in the trade, including Somali and Sudanese groups. In South-East Asia, a much wider variety of smaller wildlife is harvested, but the volumes are staggering, and the environmental implications less well understood. One large species, the tiger, is on the verge of being poached into extinction in the wild. Border crossings are frequently made at points controlled by insurgent groups. Between 5,000 and 12,000 African elephants are killed every year to supply the market with between 50 and 120 tons of ivory annually. The East Asian ivory market appears to be worth about US$62 million per year. While seizures are smaller, rhino horn is worth far more than elephant ivory per kilogram. About 800 kilograms has entered the market in recent years, worth just over US$8 million per year. Tiger parts continue to fetch high prices, but have become so scarce that if as much as 5% of the remaining tiger population were poached, this market would be worth less than US$5 million per year. Timber from South-East Asia to the European Union and Asia The transportation of wild animal parts, when detected, tends to raise questions. In contrast, the transport of large volumes of timber and wood products is a staple of international commerce. As with other ostensibly licit goods, the legality of any particular shipment of timber is based on paperwork. Fraudulent paperwork can be used for a number of purposes. It can transmute a protected hardwood into a more mundane variety. It can render a product originating in a protected area into one from an authorized source. In Asia, much of this paperwork is not forged it is bought from corrupt officials in timber source countries. Illegal logging gangs operate throughout the source countries, with varying degrees of assistance from corrupt officials, particularly in the military. Brokers are often based in third countries in the region. Due to the bulk of the product, timber is generally transported by sea or by road, entering through official border crossings. Timber of questionable origin may be laundered by being re-exported or processed within the region. According to a 2008 assessment, as much as 40% of wood-based products imported into the EU from 10 TRANSNATIONAL ORGANIZED CRIME THREAT ASSESSMENT
17 EXECUTIVE SUMMARY South-East Asia are said to have originated from illegal logging. If just 20% of EU timber imports from this region were illegal, this would represent a market of some US$1.75 billion, and a similar share is consumed in the region. In particular, Chinese demand for both whole logs and timber has grown exponentially in recent years, and much of this wood is sourced in South-East Asia. Counterfeit goods Product counterfeiting is a form of consumer fraud: a product is sold, purporting to be something that it is not. The practice is widespread products destined for 140 countries were detected in 2008 and poses a serious global challenge. The branding of a product provides implicit quality assurance and a legal line of accountability that consumers have come to take for granted. Unaccountable products are often dangerous products, and the damage is not just felt in the receiving countries: the producing countries also suffer. Even as the major brands work to improve labour standards and workplace safety at their outsourced manufacturing sites, counterfeit goods producers take advantage of global sweatshops. As licensed manufacturers try to improve their environmental impact standards, counterfeiters enjoy the cost savings of dirty production. In short, anywhere that the international community attempts to establish good practice standards for industry, counterfeiters undercut them. Counterfeit goods from Asia to Europe Much of global economic growth in recent years has derived from outsourcing, but unfortunately this practice in which the designers and manufacturers of a product often live on different continents has fostered the growth of counterfeiting. China, in particular, has grown rapidly as the world s workshop, and some two thirds of counterfeits detected globally in recent years were shipped from China. This production is typically decentralized, as is manufacturing in China generally. A large number of firms can produce virtually any product desired, and since many products are not branded until they are closer to their destination markets, the lines between licit and illicit production can become blurred. The number of counterfeits detected at the European border has increased dramatically in recent years, and most of these products originate in China (including Hong Kong, China and Taiwan, Province of China). It remains unclear how much of this flow is due to push factors and how much to pull. As many are licit products on their face, most of US$ millions FIG. 13: 6,000 5,000 4,000 3,000 2,000 1,000 0 VALUE OF IMPORT OF WHOLE LOGS AND TIMBER TO CHINA, these goods are shipped out by the same means as other manufactured goods, although they may be falsely declared to avoid inspections and evade taxes. The bulk proceeds by sea. Some are further processed, including mislabelling, in free trade zone in transit or once in Europe. Once in Europe, the goods are distributed in a variety of ways. Some are sold through ostensibly licit discount retailers, but a large share appears to be distributed through informal markets, including flea markets. Street retailing is also important, usually making use of the labour of illegal immigrants. There have been documented instances in which migrants, indentured to those who smuggled them into the country, have been compelled to work in the counterfeit vending trade. Based on European seizures and consumer surveys, the value of this market can be estimated at US$8.2 billion per year. FIG. 14: 60,000 50,000 40,000 30,000 20,000 10, ,694 6,253 Source: China Statistical Yearbook ATTEMPTS TO IMPORT COUNTERFEIT GOODS DETECTED AT THE EUROPEAN CUSTOMS UNION BORDER, ,056 7,553 10,709 22,311 26,704 37,334 Log Imports Timber Imports 43,671 49, Source: European Commission 11
18 EXECUTIVE SUMMARY FIG. 15: Ghana Zimbabwe Mali Kenya Gabon Mozambique Sudan PERCENTAGE OF CHLOROQUINE TABLETS FAILING POTENCY TESTS IN SELECTED COUNTRIES, % Source: World Health Organization Counterfeit medicines from Asia to South-East Asia and Africa Asia has also emerged as a key source of medicine, especially for developing countries, and some share of this trade involves counterfeit pharmaceuticals. The debate around what constitutes a counterfeit drug has become highly politicized. From a crime perspective, any mislabelled product, whether intended to deceive as to the maker or the content, constitutes consumer fraud. When drugs are not of the potency or even of the type they are labelled to be, the results can be catastrophic, and not only for the buyer. Dilute medication can fuel the breeding of drug resistant strains of pathogens with global implications. A large share of certain key medicines tested in both South-East Asia and Africa have failed potency tests and many are clear forgeries. It is clear that organized criminal groups are deliberately defrauding consumers in some of the poorest parts of the world, often with lethal results. The consensus, increasingly backed by forensic research, is that these drugs are originating primarily in India and China. This crime is perpetrated for relatively meagre profits, considering the volumes involved and likely outlay. Consumers in these regions spend less than US$10 per capita per annum. If one tenth of their expenditure was wasted on counterfeits, this would represent a market of some US$1.6 billion per year. Maritime piracy 57 Unlike most of the other organized crime problems discussed in this report, maritime piracy is not a trafficking issue. No contraband is moved, no illicit market serviced. Rather, it is a violent, acquisitive crime that exploits a dense international flow of commercial vessels. The term piracy encompasses two distinct sorts of offences: The first is robbery or 67 hijacking, where the target of the attack is a maritime vessel or its cargo; the second is kidnapping for ransom, where the object of the attack is the crew. The Somali situation is unique in that almost all of the piracy involves kidnapping for ransom. Modern piracy off the coast of Somalia is said to have arisen from efforts of local fishermen who formed vigilante groups to protect their territorial waters. Today, in a situation similar to what has happened in the Niger Delta, the political aims of the pirates have all but been forgotten. While the rhetoric remains, the true end of these attacks is the enrichment of the pirates. Drifting further and further from the Somali coasts, the pirates are attacking commercial freighters, pleasure craft and other vessels that have nothing to do with Somalia. Rather than championing the cause of the Somali people, pirates today attack vessels bearing the food aid on which so many Somalis depend. At present, most of the piracy appears to be conducted by a small number of dedicated groups, with limited ties to militants and insurgents on the mainland. This could easily change, however, as wealth generated though this activity becomes attractive to those who control the landing sites. In relative terms, piracy generates fortunes. In absolute terms, the true figure is unlikely to exceed US$100 million. Cybercrime Cybercrime also differs from the product trafficking markets considered in the earlier chapters. Cybercrime has been used to describe a wide range of offences, including offences against computer data and systems (such as hacking ), computer-related forgery and fraud (such as phishing ), content offences (such as disseminating child pornography) and copyright offences (such as the dissemination of pirated content). This discussion focuses on two of the most problematic: the well-established fraud of identity theft and the previously unprofitable trade in child pornography. The former is an acquisitive crime, an updated version of check kiting. The latter is a kind of electronic trafficking, transmitting contraband across borders through the Internet. Identity theft Today, identity-related offences are both the most common form of consumer fraud, and the fastest growing. The misuse of credit card information is often identified as the most common form of identity-related crime, but most of this activity occurs offline. Electronic banking has offered opportunities for acquiring the cash more directly. The most 12 TRANSNATIONAL ORGANIZED CRIME THREAT ASSESSMENT
19 EXECUTIVE SUMMARY FIG. 16: PIRACY INCIDENTS ATTRIBUTED TO SOMALI PIRATES, Oman 500 km Oman 500 km Eritrea Yemen Eritrea Yemen Djibouti Djibouti Ethiopia S o m a l i l a n d l a n d P u n t Ethiopia S o m a l i l a n d l a n d P u n t Somalia Somalia Kenya Kenya United Republic of Tanzania Comoros Seychelles United Republic of Tanzania Comoros Seychelles Oman 500 km Oman 500 km Eritrea Yemen Eritrea Yemen Djibouti Djibouti Ethiopia S o m a l i l a n d l a n d P u n t Ethiopia S o m a l i l a n d l a n d P u n t Somalia Somalia Kenya United Republic of Tanzania Comoros Seychelles Kenya United Republic of Tanzania Comoros Seychelles UNODC / SCIENCES PO Sources: Source: ICC: International Maritime Bureau, Piracy and armed robbery against ships, Annual Report 2009 Each dot represents an actual or attempted piracy attack recent techniques used to acquire identity information by Internet-related methods can be broken into three large headings: phishing, or deceiving Internet users into divulging their personal information; malware, or the use of unintentionally-installed software which collects and transmits personal information; and hacking, or illegally accessing computer systems remotely. Number of pirate attacks in the area, Identity theft is not necessarily a crime that needs to be committed with the help of others. Both the seller and the buyer of identity-related information are involved in the offence, but they do not form a group any more than do the buyers or sellers of any other commodity. One of the great advantages of the Internet for criminals is that it allows the formation of exactly these ad-hoc associations between otherwise unrelated individuals. 13
20 EXECUTIVE SUMMARY FIG. 17: BREAKDOWN OF GOODS AND SERVICES AVAILABLE FOR SALE ON SAMPLED UNDER- GROUND ECONOMY SERVERS, BY TYPE, 2008 Mailers 3% Cash out services 3% Full identities 4% Proxies 4% Others 25% addresses 5% accounts 5% The USA has been reported as the leading source of credit card numbers advertised on underground economy servers. Figures from the USA show that most computer crime against US citizens is committed by other US citizens. Based on US data, the value of Internet-related identity crime globally can be estimated at some 1 billion dollars annually. Child pornography Credit card information 32% Bank account credentials 19% Source: Symantec Global Internet Security Threat Report 2008 Until recently, the production and acquisition of child pornography were highly risky activities. Only a limited number of paedophiles had access to the facilities to produce hard copy materials, most materials were produced by amateurs, and their dissemination was limited to social networks that were both difficult to establish and fragile. One of the risks associated with the growth of the Internet is that the greater accessibility of child pornography could lead to greater demand, and thus greater profitability in the production and sale of these materials. If child pornography were to approach the profitability of adult pornography, this could attract the attention of organized crime groups, transforming what had been a furtive paper exchange into a professional operation and leading to greater levels of victimization. The risk could be particularly acute in developing countries. To date, this threat does not appear to have been realized. Although some large-scale commercial websites have been detected, most of the traffic in these materials appears to occur on a voluntary basis between amateur collectors, increasingly though peer-to-peer networks. The share of websites that are commercial seems to vary dramatically by jurisdiction. This may be related to the likelihood of being prosecuted in any given jurisdiction. This is not to minimize the importance of the problem. Amateur producers may victimize children opportunistically (including their own offspring) and publicize the results. Because the victims and the offenders are so often related in some way, and because most of the exchange appears to take place between fellow offenders, most of the production seems to take place in the consumer countries. Research on the ethnicity of the victims suggests few are from Africa, Asia or Latin America. Although there have been multibillion dollar estimates of the size of the child pornography industry, the existing data do not support an estimate of more than 1 billion dollars globally, with US$250 million likely a better approximation. Clearly, child pornography is not a crime that can be reduced to a dollar figure. Transnational organized crime and instability TOC can present a major challenge even where the state is strong, but when, for a variety of reasons, the rule of law is already weakened, it can pose a genuine threat to stability. As this crime further undermines governance and stability, countries can become locked in a vicious circle where social trust is lost and economic growth undermined. This challenge is sometimes overstated, but it is very real in some parts of the world. The clearest examples are found in countries where insurgents draw funds from taxing, or even managing, organized criminal activities, particularly drug trafficking. South-West Asia, South-East Asia and the Andean region are cases in point, and troubled areas in these regions have become the world s leading sources of some illicit drugs. In the absence of the sort of outside funding found during the Cold War, rebel groups must derive their sustenance from the regions they control, and these unstable areas are often already enmeshed in drug trafficking. The money associated with organized crime can be so great that militants may forget about their grievances and focus on satisfying their greed. Even where this is not true, drugs pay for bullets and provide a lifestyle to combatants that makes them less likely to come to the negotiating table. Drug trafficking is not the only organized crime activity that can keep a rebellion afloat, however. As the example of the Democratic Republic of the Congo illustrates, insurgents can harvest and traffic the natural resources present in the areas they control, generating incomes for warlords that dwarf what they could earn in peacetime. Some of the 14 TRANSNATIONAL ORGANIZED CRIME THREAT ASSESSMENT
21 EXECUTIVE SUMMARY % FIG. 18: SHARE OF ALL CHILD PORNOGRAPHY WEB SITES REVIEWED BY CYBERTIP.CA THAT WERE COMMERCIAL, when rebels gain exclusive control of a portion of a country. The pseudo-states thus created have no international accountability and, particularly when strategically placed, often become trafficking hubs and retail centres for all manner of illicit goods and services. They also continue to pose a threat to national and international security, providing a safe haven for international fugitives, including terrorists Russia 8 8 Canada France USA Germany Spain Source: Canadian Centre for Child Protection UK world s poorest countries have been robbed of their most valuable resources in this way, and untold environmental damage has been done. Africa is especially vulnerable to this type of abuse, as diamond-fuelled wars in Angola and Sierra Leone demonstrate. The oil-driven conflict in the Niger Delta provides a current example. Organized crime can become even more important But conflict zones are not the only places where transnational organized crime can pose a threat to the state. There are a number of areas around the world where criminals have become so powerful that, rather than seeking to evade the government, they begin to directly confront it. In these cases, a pattern of symptoms is typically manifest. Investigators, prosecutors and judges who pursue organized criminals are threatened and killed. Journalists and activists may also be targeted. Corruption is detected at the highest levels of government, and law enforcement can become paralysed by mistrust. Portions of the country may effectively drift beyond state control. This is the situation presently confronted in some parts of Central America and West Africa, both of which have suffered from a long history of violence and instability. FIG. 19: TRANSNATIONAL ORGANIZED CRIME AND INSTABILITY Russian Federation United States of America West Central Europe South-East Europe Central Asia Caribbean Gulf area, Middle East West Africa Horn of Africa South-East Asia Andean region Central Africa East Africa Sources: UDCP/PRIO Armed Conflict Dataset version ; ICC International Maritime Bureau, Piracy and armed robbery against ships, Annual Report 2009; UN/UNODC Cocaine trafficking Main source countries High homicide rates linked to cocaine trafficking Heroin trafficking Main source countries Conflict resulting in 1,000 or more battle deaths in 2008 Conflict resulting in battle deaths in 2008 Area of instability with presence of UN peace missions UN regional peace mission Piracy off the Horn of Africa Trafficking from eastern Democratic Republic of the Congo Gold Cassiterite 15
22 EXECUTIVE SUMMARY TOC PROBLEM ESTIMATED EXTENT ESTIMATED ANNUAL VALUE (US$) ESTIMATED TREND POTENTIAL EFFECTS TO EUROPE FOR SEXUAL EXPLOITATION 70,000 victims (annual) 140,000 victims (stock) 2.5 billion (stock) Stable Human rights violations TRAFFICKING IN PERSONS FROM CHINA TO THE WORLD About 10,000 per year to the USA Stock of about 25,000 victims in the USA 550 million in the USA Increasing Death of migrants, human rights violations SMUGGLING OF MIGRANTS FROM LATIN AMERICA TO NORTH AMERICA 3 million entries (annual) 6.6 billion (income for smugglers) Declining Irregular migration, vulnerability of migrants FROM AFRICA TO EUROPE 55,000 migrants (annual) 150 million (income for smugglers) Declining Irregular migration, death of migrants COCAINE FROM THE ANDEAN REGION TO NORTH AMERICA 309 tons (depart) 196 tons (at destination) 38 billion (at destination) Declining Addiction; drug related crime, corruption and violence in Colombia; links with illegal armed groups in Colombia; destabilization and corruption in neighbouring states, Central America and Mexico FROM THE ANDEAN REGION TO EUROPE 212 tons (depart) 124 tons (at destination) 34 billion (at destination) Stable Addiction, drug related crime and violence, destabilization and corruption in Andean countries, the Caribbean and West Africa HEROIN FROM AFGHANISTAN TO THE RUSSIAN FEDERATION 95 tons (depart) 70 tons (at destination) 13 billion (at destination) Increasing Addiction, spread of HIV/ AIDS; increase in organized crime, funding for criminals and insurgents, corruption FROM AFGHANISTAN TO EUROPE (EXCL. RUSSIA) 140 tons (depart) 87 tons (at destination) 20 billion (at destination) Stable Addiction, increase in organized crime; funding for criminals and insurgents, corruption 16 TRANSNATIONAL ORGANIZED CRIME THREAT ASSESSMENT
23 EXECUTIVE SUMMARY TOC PROBLEM ESTIMATED EXTENT ESTIMATED ANNUAL VALUE (US$) ESTIMATED TREND POTENTIAL EFFECTS TRAFFICKING OF FIREARMS FROM THE UNITED STATES TO MEXICO FROM UKRAINE TO THE WORLD 20,000 weapons, mostly handguns 40,000 Kalashnikovs in 2007/ million Stable 33 million (in 2007/2008 at destination) Declining Rising deaths in Mexico s drug cartel wars Death and instability TRAFFICKING OF NATURAL RESOURCES WILDLIFE FROM AFRICA AND SOUTH-EAST ASIA TO ASIA TIMBER FROM SOUTH-EAST ASIA TO THE EUROPEAN UNION AND ASIA Elephant ivory: 75 tons Rhino horn: 800 kg Tiger parts: Perhaps 150 tiger skins and about 1,500 kg of tiger bones Perhaps 20 million cubic meters Elephant ivory: 62 million Rhino horn: 8 million Tiger parts: 5 million Assorted South-East Asian wildlife: 4 billion. 3.5 billion (at destination) Increasing Declining: Indonesia, Myanmar; Possibly increasing in Lao PDR, Papua New Guinea Tigers and black rhinos may become extinct in the wild; impact on South-East Asia wildlife unclear; promotion of corruption and organized crime Deforestation, loss of habitat, loss of species, climate change, increased rural poverty especially amongst indigenous people, irregular migration, flooding, soil erosion PRODUCT COUNTER- FEITING CONSUMER GOODS FROM ASIA TO EUROPE MEDICINE FROM ASIA TO SOUTH- EAST ASIA AND AFRICA Some two billion articles per year Billions of dose units 8.2 billion (at destination) 1.6 billion (at destination) Increasing Unclear Loss of product safety and accountability, loss of revenue Death, drug-resistant pathogens MARITIME PIRACY OFF THE COAST OF SOMALIA 217 attacks in million Increasing Difficulties in establishing Government authority, negative impact on local and international commerce CYBERCRIME IDENTITY THEFT Around 1.5 million victims 1 billion Unclear Increase in the costs of credit, depressive effects on the economy, loss of trust in e-commerce CHILD PORNOGRAPHY Perhaps 50,000 new images generated annually 250 million Unclear Child victimization 17
24 EXECUTIVE SUMMARY CONCLUSION Most of the trafficking flows examined in this report are the product of market forces, rather than the plotting of dedicated criminal groups. Demand exists for drugs, prostitution, cheap labour, firearms, wild animal parts, knock-off goods, hardwoods and child pornography. The consumption of these goods apparently carries little moral stigma, and little chance of apprehension, in the circles where the consumers operate; the demand endures, despite dramatic adaptive shifts in the production and trafficking of the contraband. To deal with these markets, creative solutions are needed, drawing on techniques normally not necessarily found in the law enforcement toolkit. will allow each flow to be scrutinised for vulnerabilities, the weak link in the chain to be identified. In every instance, there are likely points of insertion that have been overlooked simply because no one was examining all aspects of the problem and the way they interact to create transnational criminal markets. Groups of professional, multi-crime offenders are significant in some areas, however. For example, within the cocaine flow to the United States, which has run strongly for decades, the Mexican cartels have emerged, showing a willingness to engage in other forms of acquisitive crime, such as kidnapping and extortion. In these cases, there is no choice but to break up these groups, and the most direct way of doing this is through arrest and incarceration. Whether driven by markets or groups, in almost every instance, these problems are transcontinental. Drugs link South America and Asia to North America and Europe. People are trafficked and smuggled from one end of the earth to the other. Commercial flows in raw materials and manufactured goods are truly globalized, the illicit along with the licit. As a result, what happens in the Andean countries, for example, has an impact on South America, Central America, North America, West Africa and Europe. And what happens in any of these regions has an impact on the Andean Region. International cooperative action is developing and progress is necessary and inevitable. The control of crime must be seen as part of the larger project of global governance. Globalization has progressed faster than our collective ability to regulate it, and it is in the unregulated areas created by this disjuncture that organized crime opportunities have grown. Bringing the rule of law to the international flow of goods and services is essential if the problems of organized crime are to be uprooted. There is no choice to tackle these problems at the scale they have emerged: globally. Local efforts are key, but will only serve to displace the flow until a coordinated approach is adopted. A global approach 18 TRANSNATIONAL ORGANIZED CRIME THREAT ASSESSMENT
25 INTRO- DUCTION INTRODUCTION With transnational threats, States have no choice but to work together. We are all affected whether as countries of supply, trafficking or demand. Therefore, we have a shared responsibility to act. United Nations Secretary-General Ban Ki-moon 1 The number of human beings living together on the planet grows every year, and so does the volume of exchanges among them. The vast majority of these exchanges are legitimate and beneficial, but a significant share is not. The growth of global crime is a threat to the rule of law, without which there can be no sustainable world development. Transnational criminal markets crisscross the planet, conveying drugs, arms, trafficked women, toxic waste, stolen natural resources or protected animals parts. Hundreds of billions of dollars of dirty money flow through the world every year, distorting local economies, corrupting institutions and fuelling conflict. What people all over the world wish each other at the beginning of a new year, health, peace and prosperity, is what transnational organized crime markets destroy, bringing instead disease, violence and misery to exposed regions and vulnerable populations. Governments have realized the danger and decided to react. International conventions have been adopted to step up the collective response to these common threats. In 2003, the United Nations Convention against Transnational Organized Crime entered into force. The next year, the United Nations High-level Panel on Threats, Challenges, and Change, identified transnational organized crime as one of six clusters of threats with which the world must be concerned now and in the decades ahead. 2 In February 2010, the UN Security Council noted with concern the serious threat posed in some cases by drug trafficking and transnational organized crime to international security in different regions of the world. 3 Stopping the operations of transnational organized crime has thus become a matter of international priority. Translating political will into concrete results will mean achieving two difficult goals: understanding transnational organized crime and integrating national responses into international strategies. This report is a contribution to the first effort. 1 Statement at UN Security council, SC/9867, February A more secure world: Our shared responsibility, Report of the High-level Panel on Threats, Challenges and Change, United Nations, 2004, p 2. 3 Presidential Statement S/PRST/2010/4. What is organized crime? There are at least two competing definitions: one that focuses on particular groups of people, and one that focuses on particular types of crime. Both definitions have some validity, and neither is sufficient to completely describe the global reality. Understanding the way that real-life organized crime situations fit these two definitions makes a big difference in the ways we might go about solving these problems. When most people say organized crime, it is often a shorthand way of referring to groups of people, usually the mafia and similar groups. Understood in this way, organized criminal activity is simply whatever these organized crime groups do. The people are consistent across time, although what they do may change: today maybe extortion, tomorrow maybe heroin trafficking, or check kiting, or procurement fraud, or all of the above. The emphasis is on the group, not the nature of the crime. This is an important distinction, because it implies a number of assumptions about the way that organized crime works. Law enforcement agencies use this definition almost as a matter of course, because the criminal justice system is designed to deal with specific offences committed by specific people. Police arrest suspects and seize their property, prosecutors secure convictions one-by-one, and only individual people can be sent to prison. When actors in such a system plan proactively, they are limited by the tools at hand, and this affects the way they conceptualize the problem. They can chart and pursue organized crime groups, which are made up of people they can arrest and prosecute. They cannot deal with the transnational markets in which these individuals are active, because they lack the jurisdiction and equipment to do so. But there is another way of looking at organized crime, a vision reflected in the United Nations Convention against Transnational Organized Crime. Essentially, organized crime is any serious offence committed by a group of three or more people with the aim of making money. This definition is broad enough to encompass a range of activities, not just those committed by career criminals. For many of these activities, the organizing principle is the invisible hand of the market, not the master designs of criminal organizations. Looking at the world through this broader definition, it is often the groups that come and go, while the market remains constant. From this point of view, disrupting any particular Case studies of transnational threats 19
26 INTRODUCTION FIG. 20: GLOBAL TRANSNATIONAL ORGANIZED CRIME FLOWS DISCUSSED IN THIS REPORT Russian Federation United States of America West Central Europe North Africa South- East Europe Ukraine Gulf area, Middle East Central Asia Afghanistan China India Mexico Myanmar Caribbean Source: UNODC Central America Andean region Brazil West Africa Central Africa DR of the Congo Southern Africa East Africa Horn of Africa South East Asia Heroin Smuggling of migrants Cocaine Workers from China Counterfeit medicines Timber Gold Cassiterite rest of the world Japan UNODC / SCIENCES PO Counterfeit consumer goods Wildlife Firearms Female trafficking victims (main sources) Piracy off the Horn of Africa 20 TRANSNATIONAL ORGANIZED CRIME THREAT ASSESSMENT
27 INTRO- DUCTION criminal organization will not solve the problem, because the incentives remain in place, and other people will rise to service the market. Law enforcement agencies, acting alone, cannot address these problems, because their toolkits are limited to interventions against specific wrongdoers. To take on organized crime in the broader sense, the intervention of other agencies is required, those with the power to change the regulations and structures that give form to a criminal market. Failure to identify the market-driven dimension of organized crime, and particularly of transnational organized crime, is one of the reasons these problems can prove so intractable. There is often a fundamental mismatch between the nature of the issue and the body assigned to deal with it. Police and prosecutors can do a splendid job of jailing offenders, and still make little headway in reducing the supply of drugs, or the number of human trafficking victims, or any of a number of the flows discussed in the chapters that follow. Making progress on global organized crime will require policymakers to have a broader understanding of the subject matter. Another factor confounding progress is that organized crime today is truly global. Illicit commerce has globalized as quickly, if not quicker, than its legal counterpart. As will be illustrated in the examples that follow, most forms of transnational trafficking start on one continent and wind up on another, often by means of a third. In this context, purely national or even regional approaches are unlikely to solve the problem. At best, they may displace it, as traffickers find new sources, transit zones, or destinations for their contraband. In particular, law enforcement, like all national actors, is not geared to deal with international issues. Regional organizations and INTERPOL have done much to facilitate information sharing and joint operations, but, in the end, each criminal must be prosecuted in a national criminal justice system. And after years of struggling with transnational organized crime, the world still does not have global strategies for solving perennial problems like the trade in heroin or cocaine. In fact, from an operational point of view, these issues are rarely addressed on a world-wide basis. The task is daunting because information on organized crime is often limited to anecdotes and case studies. There are few global data sets on organized crime topics, and none are comprehensive. The topic is sensitive and international data sharing has been slow to develop. Particularly when it comes to estimating the size of the problem and trends in its development, any assessment is likely to be controversial. This report endeavors to make the best reading of the available information, acknowledging that these estimates must remain tentative until the data are improved. The situation is also difficult to track because global organized crime markets are so dynamic. As with other global geopolitical events, a complex web of interacting factors can cause sudden shifts in the nature of illicit commerce. Issues of inequality, migration, and the informal economy all play a role in the way organized crime develops. All this illustrates that organized crime is not a niche subject, of interest only to professional investigators and Hollywood directors. It has become central issue in international affairs, an important factor in the global economy, and an immediate reality for people around the world. Aside from the direct effects drug addiction, sexual exploitation, environmental damage and a host of other scourges organized crime has the capacity to undermine the rule of law and good governance, especially in developing countries. It is time the topic be placed where it belongs: at the center of our understanding of a globalized world. This report is offered as a small step in that direction. The first chapter discusses our current understanding of transnational organized crime as a whole and what may influence its evolution. There is hardly any region in the world that is not affected by transnational illicit flows and activities, but some regions pay a particularly heavy price when these cross their territory. Chapter two examines a number of cases where transnational organized crime and instability amplify each other to create vicious circles in which countries may become locked. The following chapters review a number of transnational threats, ranging from trafficking in persons (ch. 2), to smuggling of migrants (ch. 3), to cocaine and heroin trafficking (ch. 4 and 5), trafficking in firearms (ch. 6), smuggling of natural resources (ch. 7), to the illicit trade in counterfeit goods (ch.8), to maritime piracy (ch. 9) and to cybercrime (ch.10). Maritime piracy and some forms of cybercrime are predatory offences rather than forms of illicit enterprise, as is typical in trafficking this important distinction will be discussed in the relevant chapters. In each case, a brief overview is followed by a closer examination of some of the most acute cases. The list is not exhaustive, and important aspects of the problem such as money-laundering, criminal Case studies of transnational threats 21
28 INTRODUCTION networks and groups, or a systematic review of the regional impact of transnational organized crime, could not be included in this report. Nevertheless, the cases put together in the following pages offer not only one of the most comprehensive presentations of current transnational crime threats currently available, but also a striking view of the global dimensions of organized crime today. 22 TRANSNATIONAL ORGANIZED CRIME THREAT ASSESSMENT
29 1 THE THREAT OF TRANSNATIONAL ORGANIZED CRIME A global threat assessment
30
31 1 THE THREAT OF TRANSNATIONAL ORGANIZED CRIME What do we mean by transnational organized crime? The term organized crime appears to have emerged in Chicago in 1919, 1 and the term retains undertones of the bootlegging gangs prevalent during that era. But the phenomenon of organized criminal activity far pre-dates this coinage and its manifestations have developed considerably since that time. Depending on the definition, offences that could be classed as organized crime have always been with us, but it was only recently that the nations of the world began to compare notes and collaborate on a collective response. Although the development of multilateral agreements to control the transnational drug trade began a century ago, and a number of international instruments to address certain offences have been in existence for some time, there was not, until recently, an agreement on how transnational organized crime should be addressed. The rapid growth in the scale and scope of the problem in the post-cold War world led to the passage of the United Nations Convention against Transnational Organized Crime, which came into effect in late Remarkably, the Convention contains no precise definition of transnational organized crime, nor does it contain a list of the kinds of crimes that might fall under this heading. This is not a problem unique to the Convention as noted above, there is no consensus definition of organized crime among either practitioners or theoreticians. A very wide range of criminal activities can be conducted transnationally in an organized fashion, and new forms of crime emerge constantly as global and local conditions change over time. In order to accommodate this complexity, a precise definition was omitted. Instead, the Convention defines organized criminal group. This is needed because the Convention requires parties to criminalize participation in an organized criminal group. 2 But the purpose of the Convention is to prevent and combat transnational organized crime, not organized crime groups. Attacking the groups is just one tactic toward this end. Under the Convention, an organized criminal group is: a group of three or more persons that was not randomly formed; existing for a period of time; acting in concert with the aim of committing at least one crime punishable by at least four years incarceration; in order to obtain, directly or indirectly, a financial or other material benefit. Since most groups of any sort contain three or more people working in concert and most exist for a period of time, the true defining characteristics of organized crime groups under the Convention are their profit-driven nature and the seriousness of the offences they commit. The Convention covers only transnational crimes, but transnational is similarly cast broadly. It covers not only offences committed in more than one state, but also those that take place in one state but are planned or controlled in another. Also included are crimes in one state committed by groups that operate in more than one state, and crimes committed in one state that impact on other states. In the interconnected world of today, that covers many significant aspects. The implied definition of transnational organized crime encompasses virtually all profit-motivated criminal activities with international implications. This broad definition takes account of the global complexity of the issue and allows cooperation on the widest possible range of common concerns, but leaves the exact subject matter rather vague. A better idea of the offences intended is provided in the attached Protocols, which relate to specific crimes: trafficking in persons, smuggling of migrants and firearms trafficking. These issues which typically involve countries of origin, transit and destination are areas where international cooperation is essential, since it is beyond the capacity of any single state to take comprehensive action to tackle the problem. What do we know about it? Unlike the conventional crimes (murder, rape, robbery et cetera), citizens rarely approach the police with complaints about organized crime. Many of the offences are victimless, in the sense that none of the parties participating has any interest in bringing the matter to the attention of the police. Even when there is a clear victim, this person may be reluctant to report for fear of reprisals. Further, to sell contraband or illicit services, criminal markets have to be open enough to attract customers, and to operate in this way suggests some degree of tolerance on behalf of the authorities. Corrup- Case studies of transnational threats 25
32 THE THREAT OF TRANSNATIONAL ORGANIZED CRIME tion is often implicit, and members of the public may be left with the impression that complaints would be useless. Why inform the police about businesses operating in plain sight? Consequently, most organized criminal activity comes to the attention of the police only when they take the pains to proactively investigate it. The ability to detect organized crime is contingent on a police force with the resources to take on this additional work, beyond the considerable case load involved in responding to citizen complaints. It also requires a police force with the skills to conduct long-term, often clandestine, investigations. And it requires a police force able to resist the corrupting influence of organized crime groups, whose resources may far exceed those of law enforcement. In many parts of the world, one or more of these elements is missing, so very little organized crime activity is registered. Even in countries with plenty of capacity, the attention given to any given area of organized crime differs. The definitions of crime can also vary based on local values. As a result, the criminal justice statistics may reflect political priorities more than the state of the underlying problem. Of all the areas under consideration, the most is known about drug trafficking. UNODC and concerned governments have conducted surveys of the major cultivation areas for coca bush and opium poppy for many years, and so estimates can be made with some precision as to how much cocaine and heroin are being produced. Many countries submit their seizure data to UNODC, and most of the main destination countries have survey data on the size of the drug-using population. Supply, demand and seizures can be triangulated to give a more reliable picture than any single data source could generate. As a result, some trends can be tracked with considerable confidence. It is clear, for example, that longterm declining demand for cocaine in the United States and rapidly growing demand for it in Europe have reconfigured global drug markets. Between 2004 and 2008, West Africa suddenly became an important transit area for the drug in a way never seen before. Also novel is the growing trafficking of cocaine base products from the Plurinational State of Bolivia to neighbouring developing countries in the Southern Cone. These phenomena can be tracked through supply, demand and seizure statistics. But there remain many gaps in our knowledge of the drug markets. Aggregated national seizure figures say very little about the nature of the trafficking: the who, what, where and how of smuggling drugs. For this, more research and detailed reports of individual seizures and arrests are needed. Under the drug Conventions, States parties are obligated to send to UNODC details of specific seizures which are deemed important because they throw light on the sources from which drugs are obtained, the quantities involved, the methods employed by illicit traffickers or because they illustrate new trends. 3 These details are consolidated in the UNODC Individual Seizures Database. Some countries go beyond the requirements of the Conventions and send complete details of all drug seizures above a threshold amount, 4 but too few regularly comply with this obligation for these data to provide a comprehensive global picture. Less is known about the scale and nature of human trafficking. UNODC recently spearheaded the UN.GIFT project, which, among other things, gathered data from 155 countries and territories on human trafficking victims and perpetrators. 5 The amount and reliability of this information varied greatly between countries, however, and some important countries did not participate. Most importantly, it is difficult to say what share of the victims are detected and whether these people are representative of the market as a whole. It remains likely that law enforcement is just skimming the surface in many parts of the world. And, unfortunately, the UN.GIFT report was a one-off assessment; a mechanism for collecting these data on a regular basis is not yet available. Transnational firearms trafficking presents even greater obstacles, since the Convention does not provide for international seizure data pooling. 6 Even groups that have been involved in monitoring the small arms situation for years have trouble quantifying the extent of transnational trafficking. When large seizures are made, it is difficult to distinguish firearms that have been trafficked from those that have been legally imported and then diverted to the illicit market domestically. For the emerging issues, the process of gathering information is at its earliest stages. Most information remains anecdotal. Some of these areas, however, touch on well-documented aspects of the licit economy, such as the smuggling of counterfeit goods and environmental resources. For example, groups like the European Customs Union publish statistics on their seizures of counterfeit products each year. Similarly, the International Chamber of Commerce keeps detailed records of piracy incidents, and the Convention on International Trade 26 TRANSNATIONAL ORGANIZED CRIME THREAT ASSESSMENT
33 1 in Endangered Species of Wild Flora and Fauna (CITES) secretariat maintains a longstanding database on elephant ivory seizures. How is the global situation changing? Data from these sources can tell us something about developments in specific markets, but can anything sensible be said about trends in transnational organized crime generally? Much of the discussion to date has been conducted by law enforcement authorities, and, for reasons described above, law enforcement authorities have been deeply concerned about the nature of the groups involved in organized crime. There appears to be general consensus that both highly structured and loosely structured organizations are involved in transnational organized crime, and a number of authorities have argued that the former are losing out to the latter. For example, in 2001, the European Commission claimed: traditional hierarchical structures are being replaced by loose networks of criminals... 7 In 2004, a United Nations High-Level Panel found that: Organized crime is increasingly operating through fluid networks rather than more formal hierarchies. This form of organization provides criminals with diversity, flexibility, low visibility, and longevity. 8 In its 2006 Organized Crime Threat Assessment, Europol notes: OC groups are also becoming increasingly heterogeneous and dynamically organised in structural terms, moving towards loose networks rather than pyramidal monoliths. 9 According to the 2008 United States Department of Justice s Strategy to Combat International Organized Crime: International organized criminals have evolved toward loose network structures and away from traditional hierarchical structures. 10 If true, this represents a remarkable development across a range of highly disparate activities, from elephant poaching in Central Africa to child pornography rings in Eastern Europe. To understand this point better, it is necessary to look in some depth as to what are meant by hierarchical structures and loose networks. It may be that these law enforcement authorities are rather documenting the decline of organized crime of the first type (group-driven) and the rise of organized crime of the second type (market-driven). Human beings seem to have a natural tendency to self-organize, and do so spontaneously when no higher authority provides order. People and activities that the state fails to regulate tend to fall under the control of local actors, who then vigorously defend this power from reacquisition by the state. Without the formal apparatus of government and access to the courts, local strong men are compelled to settle disputes with violence, or at least the credible threat of violence. These strong men, and the organizations they build, constitute the hierarchical groups most commonly associated with organized crime in the public imagination. Concrete examples include the various mafia organizations in Italy; the American ethnic mafias (Italian, Irish, Jewish, Polish and others); the Yakuza of Japan; the Triads of Hong Kong and the Tongs of Chinatowns worldwide; the favela gangs of Brazil; some street gangs in the United States, Central America and the Cape Flats of South Africa; and many others. This form of organized crime grows in geographic areas and communities that the state has neglected, such as slums and new immigrant neighbourhoods. Socially excluded communities frequently respond to the lack of opportunity by creating their own sources of credit, job access and security. Unregulated, these schemes can devolve into loan sharking, labour racketeering and protection rackets. What began as the efforts of a marginalized community to protect and provide for itself can transform over time into a source of predation, threatening their own community and the society at large. Similarly, where the state forbids goods and services for which there is nonetheless strong demand (for example, drugs, gambling and prostitution), selfappointed authorities can assume a regulatory role. Distribution centres are often located in marginal areas, and organized crime groups have strong incentives to keep these areas marginal. In order to secure the loyalty of the local population, they may offer a range of community services, providing support for people not sufficiently served by the state. But however beneficent they may appear locally, they remain violent criminals, enriching themselves through antisocial activities, and ultimately accountable only to themselves. These territorial organized crime groups have been known by different names around the world, and Case studies of transnational threats 27
34 THE THREAT OF TRANSNATIONAL ORGANIZED CRIME some of the currently active groups have existed for generations. As longstanding organizations, they have been essentially conservative, usually hierarchical, and often clannish. Their concerns have been chiefly local, providing for and exploiting their parent communities, while combating rival groups and the state. They tend to be engaged in multiple criminal activities in their territories, rather than specializing in a particular commodity or service. The latest wave of globalization has proven to be both an opportunity and a challenge for these traditional organized crime groups. Although many have been involved in transnational trafficking for years, their rigid structure and focus on maintaining local authority has caused some to miss emerging global opportunities. This has led a number of authorities to argue that they are being replaced by smaller, more flexible groups, or networks. One popular notion is that networks are an adaptive response to law enforcement pressure on the more visible traditional hierarchies, essentially the next generation in organized crime. As traditional groups are weakened through repeated arrests and seizures, the narrative goes, market gaps are quickly filled by low-profile, agile groups. This alleged evolution in organized crime would be parallel to the development of cell structure in terrorism. In fact, these networks are hardly groups at all, any more so than a widget manufacturer, a shipping company and a local widget retailer are a group. With no independent institutional identity, they are nothing more than commercial connections of varying durability between individuals, all responding to a common interest in making money. And rather than being an adaptive response of traditional groups, networks of market-driven individuals have probably always existed in transnational trafficking, but were less visible to law enforcement authorities focused on local crime problems. When organized crime first rose in prominence, law enforcement authorities may have focused on an opponent that was organized similarly to themselves. This impression was bolstered by the discovery of the mob meeting at Apalachin, New York, in 1957, where some 70 senior gang members from around the country were present. This incident was taken as confirmation that the enemy was a kind of anti-government or criminal corporation, secretly coordinating the illicit activities of the nation. When the European authorities began looking for similar structures at about that time, they may have imported a perceptual bias from the United States. 11 Some commentators have even suggested that the leadership of the traditional hierarchical groups were coordinating their activities in a vast global conspiracy. 12 This portrayal of organized crime provided a kind of local rival army with which to war, and glossed over any structures that did not fit the model. The media fascination with the image of an underground empire continued to grow, and the fear this generated may have become a source of funding for further law enforcement against these groups. Only with growing scrutiny over time has this image begun to crumble, and what had appeared to be concerted action was, in many instances, determined to be the activity of a range of actors responding to market forces. It is also possible that while transnational trafficking markets have grown, traditional turf-based activities may have declined in value, leading to a decline in the prominence of territorial groups. Turf-based groups have always profited from transnational trafficking, either by trafficking on their own behalf or by taxing sale of contraband in their areas. But a number of social changes and policy developments may have made conditions less favourable for oldschool racketeering in the wealthier countries, including: the growth in easy access to credit; the decline in the influence of labour unions; policies favouring the integration of new immigrants and the decline in ethnically homogeneous neighbourhoods; the outsourcing of manufacturing to developing countries; containerized shipping; greater transparency in hiring practices and government contracting; controls on patronage politics in developed counties; the growth of private security companies; and liberalized policies on gambling and prostitution in many areas. With growing regulation at a national level, it may be that the criminal opportunities today are rather found in the unguarded interstices of the transnational arena. Perhaps it is safest to say that the groups themselves have become less important than the markets with which they engage. For example, many types of groups have engaged in cocaine trafficking since the current boom began in the 1970s, with routes and conveyances shifting in response to enforcement efforts, internecine wars, trends in demand and the intricacies of geopolitics. Some of these groups were involved in a range of criminal activities, but far more were specialized in cocaine. Many of these groups came and went, but the cocaine continued to flow. The nature of these groups was, in the end, less significant than the issues of supply and demand. 28 TRANSNATIONAL ORGANIZED CRIME THREAT ASSESSMENT
35 1 Today, organized crime seems to be less a matter of a group of individuals who are involved in a range of illicit activities, and more a matter of a group of illicit activities in which some individuals and groups are presently involved. If these individuals are arrested and incarcerated, the activities continue, because the illicit market, and the incentives it generates, remain. Strategies aimed at the groups will not stop the illicit activities if the dynamics of the market remain unaddressed. Law enforcement seems to have had trouble making the leap from focusing on groups to focusing on markets. Police officers, investigators and prosecutors are employed to make cases against individuals and groups of individuals in a particular jurisdiction. They lack the authority and the tools to take on an entire trafficking flow. As hammers, they seek nails, and tend to conceptualize organized crime as the activities of a collection of particular people, rather than a market with a dynamism of its own. 13 This focus on building cases has been a real barrier to making progress against criminal markets because, in most countries, the combating of organized crime has been seen as almost exclusively a matter of law enforcement. The situation is further complicated because the problem is international while the tools are inherently national. Penal law is a matter of national legislation, which itself is the codification of long-standing cultural norms. Further, the criminal justice system is an essential mechanism for the maintenance of internal stability. As each breach of the criminal law represents a kind of governance failure, particularly when executed by an organized group, this activity is often regarded as a matter of national security. High-level corruption is often involved, which can be embarrassing for affected states. There are also legal issues involved in discussing the facts of pending cases and strategic reasons for silence on ongoing investigations. In short, the subject matter is sensitive, making international information-sharing and multilateral interventions difficult. And, historically, crime has been primarily a local issue, so there has been little motivation to collaborate across borders on the topic. As the following section argues, this attitude is bound to change due to our growing appreciation of the threat posed by organized crime. What factors influence the evolution of organized crime threats? Transnational organized crime has evolved over time. Drug epidemics have come and gone and resurfaced in new environs. Human trafficking and firearms flows have rapidly expanded in areas of conflict and subsided just as rapidly. The end of the Cold War, the decline in the number and severity of civil wars and the advance of globalization have all impacted on organized crime in unpredicted ways. In many instances, the inability of the global community to predict these trends has resulted in damage that could have been avoided with a little foresight. Of course, predicting storms in the complex weather of global affairs is a matter of considerable complexity and uncertainty. But much can be learned by looking retrospectively at dynamics that have affected organized crime problems in the past. This report does not hazard much prognostication, but it does explore some of the risk factors that affect the way transnational organized crime evolves over time. The enhanced movement of everything A term with nearly as many meanings as users, globalization generally refers to the growing interconnectedness of the nations of the world following the global liberalization of trade at the end of the Cold War. Enhanced flow of goods was accompanied by enhanced flow of capital and services and outsourcing of manufacturing. Global tourism has expanded, facilitated by less restrictive visa regimes and cheaper airfares. The simultaneous expansion of the Internet and telecommunications has also led to globalization in a cultural sense. Today, a wide range of products and services can be accessed virtually anywhere in the world. But the process of globalization has outpaced the growth of mechanisms for global governance, and this deficiency has produced just the sort of regulation vacuum in which transnational organized crime can thrive. People and goods can move more cheaply than ever before, and criminals and contraband can only be interdicted by national governments. Human and commercial flows are too intense to easily distinguish the licit from the illicit. Silos of sovereignty provide sanctuary to those who, however harmful their activities, are of use to the authorities in one country or another. The open seas, which constitute three quarters of the earth s surface, remain essentially ungoverned. 14 And the rapid pace of change itself provides opportunities for organized crime. The ease with which people and goods travel between nations today confounds the regulatory attempts of any individual nation. The number of air passengers has grown at approximately 5% per Case studies of transnational threats 29
36 THE THREAT OF TRANSNATIONAL ORGANIZED CRIME year over the past 30 years, enabled by the introduction of wide-body jumbo jets in the 1970s, as well as airline deregulation. 15 In 2007, the world s airlines flew more than 29 million scheduled flights, transporting over 2.2 billion passengers between some 3,750 airports in cities across the world. 16 As capacity has increased, prices have declined. In one US study to measure the effects of airline deregulation in the late 1970s, median fares were found to have declined by almost 40% between 1980 and It is now easy and affordable to travel to cities previously considered remote and inaccessible. The expansion of civil aviation provides mobility needed for both licit and illicit international activity. FIG. 22: GROWTH IN INTERNATION- AL TRADE, Trend by region (billion dollars) UNODC / SCIENCES PO x 873 x 538 x ,021.3 Middle East USSR/CIS 4,353.1 Asia 6,446.6 Europe Air transport prevails in the movement of people, but the bulk of goods are moved by sea. More than 90% of global trade is transported by sea, and these flows are rapidly expanding: in 1996, 332 million tons of goods were transported worldwide, and by 2007, this had increased to 828 million tons. 18 Containerization has greatly accelerated the flow of goods through ports, and international commerce has become dependent on this new pace. As with air travel, for the first time, it has become economically feasible to move goods between countries formerly divided by insuperable space. More and more manufacturing is outsourced, increasing the importance of rapid mass movement of goods. Between 2002 and 2007, the amount of cargo moving through the top seven Chinese ports tripled. 19 Very little of this cargo can be inspected x 311 x 129 x 123 x 90 Total (billion dollars) , Africa North America South and Central America Source: World Trade Organization 15,717 FIG. 21: NUMBER OF TWENTY-FOOT CONTAIN- ER EQUIVALENT UNITS (TEU) MOVED THROUGH SHANGHAI PORT, ,000,000 25,000,000 26,150,000 7,377 20,000,000 21,710,000 TEUs 15,000,000 10,000,000 5,000,000 8,620,000 11,280,000 14,557,000 18,084,000 UNODC / SCIENCES PO 1,838 3, Source: American Association of Port Authorities World Port Rankings, various years Source: World Trade Organization 30 TRANSNATIONAL ORGANIZED CRIME THREAT ASSESSMENT
37 1 Even more rapid has been the expansion in the growth of global communications. The number of mobile phone subscribers increased from some 200 million in 1997 to 3.3 billion in The International Telecommunications Union estimates the 2008 number at 4.1 billion; a yearly increase of almost 25%. While telecommunication used to be tied to a location, it has now become as mobile as its users. Moreover, in December 1991, the internet was comprised of 10 websites; in July 2009, the number was close to 240 million. 20 It is impossible to police these information flows. Old forms of crime are supported by information technology, and new forms are emerging, unique to the virtual world. An example of a traditional crime that has been revolutionized by global communications is child pornography. Far from being a new phenomenon, the internet has enabled cheap and instant global distribution to millions of customers from concealed origins, usually situated in countries where prosecution is unlikely. In the past, the images would have had to be processed, printed and the hard copies distributed via mail or retail outlets. As with many other technology-related crimes, legislation (and by extension enforcement) is struggling to keep up. In a recent study of 187 countries worldwide, 93 countries were found to lack legislation that specifically addresses child pornography, and of the countries that do have such legislation, 24 do not provide for offences facilitated by computer technology. 21 This means that the majority of the world s countries has not kept pace with developments in the world of crime. Similarly, internet fraudsters and identity thieves can find victims in the wealthy countries while safely ensconced in nations with little power or will to stop them. The money they skim can easily be moved through dozens of national banking systems in a matter of minutes, making their transactions nearly impossible to trace. The high volume of legal funds circulating around the globe makes the movement of dirty money less conspicuous. Criminal cash is often moved to a different jurisdiction for placement in the legitimate financial system, investment in property or to pay for illicit commodities or services. 22 Grey and black markets FIG. 23: FIG. 24: MILLIONS OF INTERNET USERS, Source: International Telecommunications Union MILLIONS OF MOBILE PHONE SUB- SCRIBERS, ,417 1, Source: International Telecommunications Union Most definitions of organized crime specify its profit-driven nature, and, like licit business, criminal enterprise is subject to the vagaries of the international economic climate. Certain economic circumstances seem to favour the rapid development of organized crime, and the single most important global economic event of recent times the fall of the Berlin Wall and the collapse of the former Soviet Union continues to resound in the underworld. Aside from opening the way to globalization as discussed above, the rapid social changes it brought in a large number of countries generated precisely the sort of gaps in governance that typically spawn organized crime , , ,344 1, ,757 3, Case studies of transnational threats 31
38 THE THREAT OF TRANSNATIONAL ORGANIZED CRIME The rapid shift from being highly managed societies to free-market democracies created deep challenges for all the Warsaw Pact countries. As the massive edifice of communism collapsed, much was damaged by the rubble, and the dust obscured a great many crimes. The old rules of social and economic behaviour were suddenly suspended, while new norms had yet to take hold. Countries that had been dependent on the Soviet Union for direction and guidance were suddenly left to their own devices. Whole social sectors were thrown open, essentially unregulated. Of course, organized crime had existed under communism, particularly in the form of consumer goods smuggling, which generally took place with the corrupt complicity of the security services. The groups involved were well positioned to take advantage of the confusion, and the lines between capitalism and looting could be hard to discern. Security in this period was essential, both to protect established interests and to repel petty interlopers. Those that survived emerged billions of dollars richer, with massive influence in both the political and economic worlds. Aside from creating new players, economic shifts can affect established ones, and organized crime can deeply impact the formal economy. For example, Japan s construction bubble in the 1980s brought new power to the Yakuza. Long employed by legitimate interests to resolve disputes outside Japan s legal system, the Yakuza were used in land sharking forcing reluctant tenants and property holders to make room for the new developments. They also invested heavily in the boom, so that when the bubble burst, their interference with the collection process has been said to be a key cause of the recession that followed. 23 Organized criminals are subject not just to shifts in the licit economy, but to shifts in the illicit one as well. For example, Jamaica suffered for decades under organized violence linked to patronage politics, culminating in the 1980 elections. During the 1980s, large amounts of cocaine transited Jamaica en route to the crack markets of the north-eastern United States, where Jamaican nationals also dominated key markets. In the 1990s, the cocaine flows began to shift from the Caribbean to Central America, as radar surveillance prevented trafficking by air and as Mexican groups increasingly dominated cocaine importation and distribution in the US. As Jamaican groups lost this key source of income, it appears that many compensated by engaging in predatory crimes in their own communities, including extortion and robbery. Violence levels increased commensurably, giving the country one of the highest murder rates on earth in recent years. It is still too early to discern the impact of the current economic crisis. It stands to reason that growing unemployment and declining licit opportunities would cause some to become less picky about their source of income or the origins of the products they consume. On the other hand, many of the items traded by organized crime are essentially luxury goods and services, not the staples of life, and tightening economic conditions would affect illicit markets as well. For example, in order for human trafficking to be feasible, forced labour must be cheaper than voluntary labour, even after the additional costs of securing and retaining victims are factored in. Women trafficked for sexual exploitation have to compete with voluntary sex workers, whose numbers can be expected to swell if economic conditions worsen. The growth in supply is likely to cause a drop in price, chasing what is likely to be a declining demand from a cash-strapped male population. The net result would be smaller incentives for trafficking. Similarly, sweatshop labour would have to be cheaper to maintain than a voluntary workforce, in a market where demand for manufactured products is likely to decline. Young, urban, foreign and poor Crime and violence are strongly associated with the increasing number of young people, particularly in developing countries. Almost 85% of the world s youth currently live in developing countries, and by 2025, this figure will grow to 89.5%. 24 And while 0.9 people per 100,000 die each day in youth homicides in high income countries, in Africa, the figure is 17.6 and in Latin America, Moreover, for every fatality, there are from 20 to 40 victims of non-fatal youth violence. These marginalized young people provide foot soldiers to organized crime. In addition, a growing share of these young people are being raised in cities, without the support and normative infrastructure of the traditional rural lifestyle. More than half of humanity is already living in cities; a share that is projected to reach 60% within two decades, with most of the growth taking place in developing countries. Since most developing countries lack the capacity to accommodate this rapid inflow, many will be brought up in slums, where quality of life is low and competition for scarce resources is fierce. Urban lifestyles require cash; which is difficult to access legally in 32 TRANSNATIONAL ORGANIZED CRIME THREAT ASSESSMENT
39 1 countries with high unemployment levels. As a result, crime rates are higher in cities, especially in slums, where drug addiction and gang activity proliferate. 25 It is these areas that give rise and shelter to a variety of organized crime activities. Urban violence and crime are on the rise in developing countries; from 1980 to 2000, recorded crime rates increased by almost one third. In developing countries, an estimated 60% of all urban residents have been victims of crime over the past five years, rising to 70% in Latin America and Africa. 26 Difficult conditions at home can provide a substantial push to emigration. But while global capital flows freely, labour still does not. Market demand for workers draws them in from around the globe, oblivious to the immigration code. This creates demand for a service to overcome the legal barriers, precisely the kind of service in which organized crime specializes. The result is migrant smuggling and the many abuses that accompany it. There are more than 200 million international migrants in the world today, which is two and a half times the number in 1965, and a significant share of these migrants are undocumented. Human mobility has become a life choice driven by disparities in demography, income and employment opportunities across and within regions. 27 And since this migration is essential to both developing and developed countries, it will be extremely difficult to stop through law enforcement. Demographic trends show that the working age population in developed countries is expected to decline by 23% by 2050 without immigration. 28 The working age population of Africa, on the other hand, is expected to almost triple, from 408 million in 2005 to 1.12 billion in FIG. 25: MAIN MIGRATION FLOWS, 2005 South America Central America and Caribbean Mexico United States of America Canada Russian Federation Japan, Republic of Korea China South-East Asia and Pacific Australia and New Zealand Europe Central Asia Near East and Caucasus North Africa Gulf area Indian subcontinent The map shows a snapshot of migrant stocks in Number of migrants West Africa East and Central Africa Share of migrants (in % of population) world average lack of data 500,000 to ,000,000 3,000,000 Southern Africa 5,000,000 9,300,000 Sources: Marie-Françoise Durand, Philippe Copinschi, Benoît Martin, Delphine Placidi, Atlas de la mondialisation, Paris, Presses de Sciences Po, 2009 Development Research Centre on Migration, Globalisation and Poverty, Global Migrant Origin Database Updated March 2007, Washington (D. C.), Banque mondiale et Brighton, Université du Sussex, UNODC / SCIENCES PO Case studies of transnational threats 33
40 THE THREAT OF TRANSNATIONAL ORGANIZED CRIME FIG. 26: Migrant stocks* (thousand) * Total migrants by destination country , , , , , ,032.0 MIGRANT STOCK EVOLUTION BY COUNTRY/REGION, , , , , , , , , ,202.3 Gulf CIS (USSR) United States of America Europe West Africa Near East and Caucasus Mexico Japan, Republic of Korea, Democratic People s Republic of Korea Australia and New Zealand Canada already a major revenue-generating transnational criminal activity, and given that illegal immigration is likely to increase, so will the size of the illicit economy related to migrant smuggling and the number of criminals involved in the trade. Migration, be it legal or illegal, may also broaden the reach of existing criminal networks. Although most migrants, including many of those who enter their destination country illegally, are generally lawabiding citizens, among them, there are inevitably affiliates of a variety of criminal networks. These people bring with them their crime-related skills and knowledge as well as their criminal contacts. Chinese, Nigerian, Italian and Russian groups are well-known examples of network proliferation through migration. Revolutionaries or criminals? Another source of rapid change and governance gaps is conflict. Most wars today are civil wars, usually fought by dissident groups and regional secessionists. In the post-cold War world, these groups may be compelled to find funding through illicit activities. If they control territory, they can use this land to facilitate transnational trafficking. The money this brings in can become an end in itself. After some time, it may be difficult to differentiate political dissidents and criminal groups. This issue is discussed further in this report. 2, ,494.4 Central America and Caribbean Why should we be concerned? , , , , , , Source: UN Population Division 3, , , , , ,084.2 China South-East Asia and Pacific East and Central Africa Southern Africa South America Indian subcontinent Most irregular migrants resort to the assistance of profit-seeking smugglers. 30 For example, Dutch customs data on asylum seekers who arrived in the Netherlands in 2000 showed that 97% had received assistance from smugglers. Migrant smuggling is UNODC / SCIENCES PO The threat posed by transnational organized crime is often misunderstood. There is a tendency to oversimplify, and, in particular, to equate the damage done by organized crime with the amount of violence associated with the market. But the threat posed is much deeper than a body count, tragic though this loss of life may be. Many forms of organized crime do involve violence or the threat of violence. For example, to subjugate human trafficking victims, violence or the credible threat of violence is almost always present. In other markets, violence is needed to ensure contract compliance and to resolve disputes. Professional criminals may seek to minimize the extent of violence to ensure the smooth flow of profits and to avoid unwanted attention, but few would be able to conduct their business without recourse to the gun. Relying on homicide figures as a proxy for the threat would be a big mistake, however, because some of the areas most afflicted by organized crime have very low violence levels, just as some authoritarian 34 TRANSNATIONAL ORGANIZED CRIME THREAT ASSESSMENT
41 1 societies have very low crime rates. Typically, the better organized the crime, the less violence associated with it. The groups concerned have paid off the appropriate officials, resolved intra- and intergroup tensions, and terrified the public to the extent that very little additional violence is required. As noted above, crime groups sometimes provide social services and support that the state does not, winning them popular support. If law enforcement is ever roused into action, the violence associated with this disruption of the criminal equilibrium can even fuel calls for enforcement to desist. So, the real threat of organized crime cannot be reduced to the violence associated with criminal markets. Rather, it is best described under two headings: Direct impacts, which are essentially the reasons each criminal activity was prohibited in the first place; Indirect impacts, in particular the ways organized crime as a category undermines the state and legitimate commercial activity. Direct impact It is easy to lose sight of the reasons why organized criminal activities were prohibited in the first place. For some markets, like drug trafficking or migrant smuggling, most of the parties are willing participants. Many die as a result of their choices, but in a world increasingly governed by the principle of let the buyer beware, it is possible to absolve ourselves of responsibility for this loss. Unless we happen to know one of the victims, these personal costs are not tallied as social costs, and so the impact of crime becomes obscured. In addition, the impact of organized crime is often realised in a different country than that where the profits accrue. Crimes may appear victimless when the victims are located on the other end of the world, and criminals who bring in money by exporting problems may receive popular support. For example, people residing in the under-governed areas of countries that produce drugs may see no problem with working for the trafficking groups, who may provide more security and support than the state. The drug addicts are located overseas, and so do not form part of the calculus of local actors. Similarly, those who use drugs in developed countries rarely consider the way that their consumption may be affecting violence and stability in producer and transit countries. Only when viewed globally are the net costs of trafficking apparent, and only national governments, not their organized crime substitutes, have any incentive to look globally. Certain drugs are prohibited because they cause addiction and lead to serious physical and mental health problems. The impact inevitably extends beyond the users, affecting their families, communities and the society at large. The costs of drugrelated accidents, lost productivity, child neglect and abuse, psychological damage and the like are tremendously difficult to tally. It is a challenge to simply estimate the number of drug addicts in the world. Addicts in developing countries often go uncounted, while some of those in richer nations handle the matter privately. Based on the available data, it is possible to estimate that between 172 million and 250 million adults used illicit drugs in On the upper end, this is more than the population of any but the three largest nations in the world. Perhaps 18 to 38 million could be classed as problem drug users. On the upper end, this is more than the populations of Switzerland, Bulgaria, Honduras, Israel, and Hong Kong, China combined. We also know that some 4.4 million people are currently in drug treatment worldwide, equivalent to the entire population of Ireland. Studies of people arrested for a range of crimes in the United States, Australia, and elsewhere have found that most test positive for drug use. In a 2008 study in the United States, 87% of people arrested in 10 major cities tested positive for drugs. 31 millions of people FIG. 27: SIZE OF GLOBAL DRUG-USING POPULATIONS, Drug users Problem drug users Addicts in treatment Source: World Drug Report Case studies of transnational threats 35
42 THE THREAT OF TRANSNATIONAL ORGANIZED CRIME Few would dispute the seriousness of the crime of human trafficking, but far less is known about its extent. Based on data from 111 countries and territories (not including China or India), 21,400 victims were detected world-wide in These are just the victims detected, and it is estimated that only one in 20 or one in 30 victims are ever recognised. If true, this represents and immense pool of human suffering. In addition, there are as many as a million images of child pornography currently circulating on the Internet, each of which represents an act of human trafficking and a crime against the most basic moral principles. The impact of these crimes is impossible to quantify. Many mistakenly believe the primary impact of product counterfeiting is loss of revenues to rights holders, but the crime has far more serious implications. Manufacturers of counterfeits have little incentive to adhere to safety regulations, since they have no reputation to protect or liability to fear. Substandard or outright hazardous products, from toys to auto break pads, pose a serious public safety threat. Of greatest concern is counterfeit medication, which, in addition to hastening the death of the many who go untreated, can contribute to the generation of drug-resistant strains of the most deadly pathogens. dominant groups will be nullified. In areas where the official state structures are particularly bad, organized crime groups may appear relatively attractive. But the solution in these cases is to improve governance, not to cede authority to those who enrich themselves through antisocial activities. Since the network groups do not seek to wrest territory from state control, their impact is even more insidious, but can be just as important. Most transnational trafficking requires smuggling, and the surest means of smuggling is through corruption. In poorer states, the corruption can go straight to the top, and the highest authorities can quickly become manipulated by traffickers. If opposed, these groups can engineer the removal of problematic officials, up to and including the chief executive. If the state is uncooperative, it can support opposition groups or insurgents. Under these circumstances, the rational choice may be to give in to the traffickers. This is a situation the international community cannot afford to permit. The profits generated through natural resource smuggling are driving whole ecosystems to the brink of extinction. The true costs of this crime are impossible to reduce to a dollar figure a world less diverse, the end of whole life forms, a shortsighted error impossible to correct. Indirect impact Aside from the damages directly caused by specific forms of crime, there is one that is common to all: the insidious erosion of state control. Traditional organized crime groups displace state authority, by filling the governance niches neglected by the official structures and by co-opting whatever vestigial state agents remain. In other words, organized crime groups gradually undermine the authority and the health of the official government. Why is this a problem? Insofar as the official state structures provide value, this value is threatened by the growth of parallel structures. Organized crime groups are inherently unaccountable, they are not subject to democratic controls, and their chief aim is the enrichment of their membership, not the advancement of society. Where they are predominant, development can become impossible, because any contract that is not to the advantage of the 36 TRANSNATIONAL ORGANIZED CRIME THREAT ASSESSMENT
43 2 TRAFFICKING IN PERSONS
44
45 2 TRAFFICKING IN PERSONS Global overview Trafficking in persons involves the use of violence, threats or deception to create a pliant and exploitable work force. 1 It is a truly global phenomenon: victims from at least 127 countries have been detected, and 137 countries report having detected victims. 2 Given this diffusion, it is difficult to estimate the size of the problem. Many countries have only recently passed, and some have yet to pass, legislation making human trafficking a distinct crime. Definitions of the offence vary, as does the capacity to detect victims. According to official figures, at least 22,000 victims were detected globally in 2006, 3 but some countries where human trafficking is known to be a problem do not report detecting victims. 4 The current best estimate on the global dimension of human trafficking comes from the International Labour Organization (ILO). According to this estimate, at least 2,450,000 persons are currently being exploited as victims of human trafficking. 5 Using a broad definition, ILO estimated the global economic costs suffered by all victims of forced labour to be US$21 billion in The total illicit profits produced in one year by trafficked forced laborers was estimated at about US$32 billion in The data remain patchy, however, and any global estimate must be regarded as tentative. The United Nations Protocol to Prevent, Suppress and Punish Trafficking in Persons, especially Women and Children, 8 which supplements the Convention against Transnational Organized Crime, is cast broadly enough to encompass a wide range of forms of exploitation, but in practice, two major categories of transnational activity can be identified: trafficking for the purposes of sexual exploitation, and labour exploitation, including the use of child labour. In data recently collected by UNODC on the number of victims detected by state authorities around the world, two thirds of the detected victims were women, and 79% of the victims were subject to sexual exploitation. But these figures should not be mistaken for a description of the total victim pool. Some national laws only address trafficking in women or only recognize victims of trafficking for sexual exploitation as trafficking victims. Even where the law provides for other forms of trafficking, sexually exploited women and children may be prioritized for enforcement and assistance, and so the profile of victims detected may be different from those that are not detected. FIG. 28: COUNTRIES COVERED BY THE UNODC/UN.GIFT DATA COLLECTION, UNODC / SCIENCES PO Source: UNODC/UN.GIFT Countries covered by the UNODC/UN.GIFT data collection ( ) 39
46 TRAFFICKING IN PERSONS FIG. 29: PROFILE OF VICTIMS IDENTIFIED BY STATE AUTHORITIES IN 61 COUNTRIES, 2006 FIG. 30: DISTRIBUTION OF VICTIMS IDENTIFIED BY STATE AUTHORITIES ACCORDING TO THE FORM OF EXPLOITATION, 2006 Boys 9% Me n 12% Girls 13% Forced labour, 18% Sexual exploitation, 79% Women 66% Other forms, 3% Source: UNODC/UN.GIFT Source: UNODC/UN.GIFT Since victims are often recruited by means of deception, traffickers need to gain the trust of potential victims. For this reason, recruitment is often carried out by nationals of the same country as the victims. The use of women to recruit other women has been documented by studies conducted in this field. 9 For most forms of crime, women are much less likely to be perpetrators than men; human trafficking appears to be an exception. The victims trust is also needed at destination to reduce the risk of escape. An analysis of the nationality of the victims shows that in destination countries, traffickers are often either nationals of the destination country or of the same nationality as the victims. Trafficking for sexual exploitation Whether the number of victims of sexual exploitation is greater than the number of victims of labour exploitation is debatable, but it is clear that the countries of the world regard the former as the greater problem. This is in keeping with the general tenor of criminal law: in most countries, sexual violation is considered an aggravating factor in any form of assault. The crime of forced prostitution garners more outrage than other forms of forced labour, and so many countries have laws aimed specifically at this practice. For most people, the world of commercial sex is unknown terrain. While as much as half the young people in some developed countries will experiment with illicit drugs, a much smaller percentage have any experience with commercial sex. This makes it difficult for policymakers to weigh the evidence and generate a reasonable assessment of the nature and scope of the problem. To come up with an accurate estimate of the scale of human trafficking for sexual exploitation, it is helpful to get some sense of the size of the market for commercial sex (see Box later in this chapter), since trafficked women are but a subset of a larger body of commercial sex workers. The purveyors of trafficked women are in direct competition with both domestic and international sex workers who were not trafficked. Those who traffic women also have to consider costs. Trafficking in women can be an extremely labour-intensive process, and the prices victims reportedly command have consequently been very high. All of these factors act as constraints on the demand for women trafficked for sexual exploitation. Sudden geopolitical or economic shifts, such as the end of the Cold War, the integration of China into the world economy or violent conflicts like the Yugoslav Wars can create new opportunities for human traffickers. The end of the Cold War was key in precipitating one of the best documented human trafficking flows in the world: the movement of Eastern European women into West European sex 40 TRANSNATIONAL ORGANIZED CRIME THREAT ASSESSMENT
47 2 markets. Today, women of more nationalities (at least 95) have been trafficked into Europe than to any other known destination. In addition, new (previously undetected) nationalities have increasingly been detected among trafficking victims in Europe. This problem is the subject of the first flow study below. Trafficking for labour exploitation Trafficking for the purpose of forced labour appears to be limited to labour-intensive enterprises with rigid supply curves: typically, the so called dirty, dangerous or demeaning jobs. As a country develops and public welfare protections are established, fewer citizens are willing or able to take on these jobs at an internationally competitive wage. In some circumstances, demand for trafficked labour, including the labour of children, can be generated. Coerced labour is more profitable for short-run productions. The longer the exploitation, the lower the net productivity of the coerced labourer and the greater the risk to the offender. There are many factors that can render a source country vulnerable to human trafficking, the most commonly cited of which is poverty. But there are many poor countries that do not seem to produce large numbers of trafficking victims, so poverty alone is not enough to explain the phenomenon. Diaspora populations in destination countries are surely one factor, as is the presence of organized crime in the source country. 10 A large part of the population living in poverty, a widespread diaspora and sophisticated organized crime structures all contribute to the trafficking of Chinese nationals. Chinese victims have been officially detected in at least 25 countries, and documented in about 65, including unusual destinations such as Afghanistan, Ghana and Zambia. This is the broadest spread of any nationality. Trafficking of Chinese victims to the world is the subject of the second flow study below. 41
48
49
50 TRAFFICKING IN PERSONS What is the nature of the market? A greater variety of nationalities has been found among human trafficking victims in West and Central Europe than in any other part of the world, and most of these victims (84%) were trafficked for the purpose of sexual exploitation. Both the detection rate and the type of exploitation detected are affected by enforcement patterns, however. In 2006, the entire Western Hemisphere only recorded some 150 convictions for human trafficking, which is about the same number as Germany alone (see Figure 9). It is difficult to say to what extent this is indicative of a greater problem or whether it is simply a matter of greater vigilance. In recent years, the majority of human trafficking victims detected in Europe have come from the Balkans and the former Soviet Union, in particular Romania, Bulgaria, Ukraine, the Russian Federation and the Republic of Moldova. Victims from at least some of these five countries have also been located in all parts of Europe. But the dominance of these groups appears to be changing as new source countries emerge on the European scene. Although trafficking from South America occurs in a smaller number of countries, it is often severe in the places where it does occur. The main destinations for South American victims are Spain, Italy, Portugal, France, the Netherlands, Germany, Austria and Switzerland. 12 Almost all of this trafficking is for the purpose of sexual exploitation and it includes transgender victims. 13 Among South Americans, Brazilian victims have been increasingly detected in Europe. Trafficking originating in this country mainly affects the poor communities of the north (such as Amazonas, Pará, Roraima and Amapá), rather than the richer regions of the south. Trafficking from Africa affects mainly West African communities, in particular Nigerian women and girls. 14 Trafficking originating from North Africa (Morocco and Tunisia) is still very limited, but may be increasing. Trafficking from East Africa (Uganda and Kenya) is found mainly in the United Kingdom. 15 Trafficking from East Asia has traditionally involved mainly Thai women. More recently, Chinese nationals are also affected, as are women from Viet Nam and Cambodia. These women are normally exploited in indoor prostitution, such as massage parlours, saunas or beauty centres. How is the trafficking conducted? Every trafficking group has its own modus operandi for the recruitment, transportation and exploitation of victims. The most common recruiting method FIG. 31: WOMEN TRAFFICKED TO EUROPE FOR SEXUAL EXPLOITATION (CITIZENSHIP OF VICTIMS DETECTED), Number Poland Czech Republic Russian Federation 2,348 1, to 5 Ukraine Republic of Moldova Romania Bulgaria Morocco China Nigeria UNODC / SCIENCES PO Source: UNODC/UN.GIFT Brazil Paraguay Unspecified citizenship 44 TRANSNATIONAL ORGANIZED CRIME THREAT ASSESSMENT
51 2 used by Balkan-based groups consists of promises of employment. 16 In Ukraine, traffickers entice 70% of their victims through promises of work, participation in beauty contests, modelling opportunities, affordable vacations, study abroad programmes or marriage services. 17 Trafficking originating from the Balkans, the former Soviet Union and Central Europe is characterized by recruitment conducted by victims acquaintances. According to studies conducted in the Czech Republic, 18 Poland 19 and Romania, 20 the majority of victims are recruited through acquaintances, friends or relatives. Similar patterns have been reported in the South Caucasus. 21 Studies from Ukraine indicate that 11% of victims were trafficked with the active cooperation of their husbands. 22 While some of these victims are recruited knowingly into prostitution, they may nonetheless end up in exploitative situations through deception, coercion or violence. 23 According to one Ukrainian study, nearly 20% of the victims are promised work as exotic dancers, masseuses and the like. While most of these women understand that they will have to render sexual services, they are unaware of the conditions under which they will work. 24 Violence is frequently used to control victims. Trafficking by Balkan-based groups is described as very violent. 25 Similarly, Russian organized criminal gangs engaged in human trafficking are reported to adopt particularly harsh methods of control. Often, before being presented to clients, women are raped by the traffickers themselves, in order to initiate the cycle of abuse and degradation. Some women are drugged to prevent them from escaping. 26 Studies conducted in Romania, the Czech Republic and Poland show that violence towards the victims normally occurs at the destination site. 27 Because of the short distances, most women trafficked from Central Europe and the Balkans are transported by bus or car. 28 Victims originating from the former Soviet Union are trafficked by making use of counterfeit passports, false visas and/ or false marriages. In some cases, trafficking victims are highly visible and engage in street-level prostitution, but in most cases, sex trafficking takes place in underground venues, such as private homes or brothels. Often, public and legal locations such as massage parlours, spas and strip clubs act as fronts for illegal prostitution and trafficking. FIG. 32: Romania Aggregated Americas Germany Source: Elaboration of UNODC/UN.GIFT data In the context of the Latin American human trafficking flow, cases were registered where victims were forced to recruit friends and/or family members. 29 Traffickers in Latin America may also make use of entertainment networks, fashion agencies, employment agencies, marriage and tourism agencies and newspaper advertisements to recruit victims. 30 Because of the long distances involved, Latin American women trafficked to Europe are normally transported by air to major European airports. Regular three-month tourist visas may be used to cross the borders. 31 Trafficking victims travelling from Brazil to Europe may pass through Europeanadministrated territories in the Caribbean or South America to reduce the risks of being intercepted in FIG. 33: NUMBER OF CONVICTIONS FOR THE OFFENCE OF TRAFFICKING IN PERSONS IN SELECTED WEST AND CENTRAL EUROPEAN COUNTRIES AND IN OTHER REGIONS, Aggregated Africa Bulgaria The Netherlands NATIONALITIES OF TRAFFICKING VICTIMS DETECTED IN WEST AND CENTRAL EUROPE, (%) Central Europe 7% Balkans 32% Former Soviet Union 19% African 5% Others 21% South American 13% East Asian 3% Source: Elaboration of UNODC/UN.GIFT data 45
52 TRAFFICKING IN PERSONS FIG. 34: MOST FREQUENTLY DETECTED NATIONALITIES OF VICTIMS IN SELECTED COUNTRIES (COUNT) Germans Romanians Czech Russians Bulagians Poles number of victims Slovaks Nigerians Thai Romanians Russians Bulgarians Ukrainians Nigerians Moldovans Lithuanians Albanians Germany ( ) Greece ( ) Bosnians Serbians Moldovans Ukrainians Romanians number of victims Russians Croatians Ukrainians Czechs Vietnamese Bulgarians Bos nia and Herzegovina ( ) Czech Rep. ( ) Source: Official National Statistics Europe. Suriname is also a transit country to Europe. 32 Once in Europe, women and transgender individuals may be exploited in the streets or indoors, depending on the destination. Studies of Nigerian victims report that acquaintances, close friends or family members play a major role in the recruitment of victims. Recruitment frequently occurs in the victim s own home. 33 Nigerian trafficking is characterized by a debt bondage scheme. Victims trafficked into Europe (Italy, the Netherlands, Belgium, Spain and others) are forced to pay back inflated smuggling fees. 34 Victims mainly travel to Europe by plane from Lagos or other international airports from West Africa. 35 Victims may also have been transported by land and sea across the Mediterranean. The vast majority of West African women and girls are exploited in street prostitution. Who are the traffickers? Most convicted traffickers are male, as are convicts of virtually every other crime. Female offending rates are higher for human trafficking than for other crimes, however. This may be due in part to the importance of trust between the victim and the perpetrator. Additionally, in some markets, victims may become exploiters over time, as this may be the only way to escape further exploitation TRANSNATIONAL ORGANIZED CRIME THREAT ASSESSMENT
53 2 FIG. 35: 37 MEANS OF COERCION USED IN THE NETHERLANDS ON SAMPLED VICTIMS (N:155), Threat of violence Watch/lock victim up Violence Debt Confiscation of passport Feigned love Threat of violence against family Threat of disclosing prostitution work Voodoo 0% 10% 20% 30% 40% 50% 60% 70% 80% 90% Source: Dutch national rapporteur In the countries that formerly comprised the Soviet Union in particular, the majority of recruiters are women, often persons previously engaged in prostitution. 38 A study by the International Organization for Migration (IOM) on trafficking in the former Soviet Union reports cases where repatriated trafficked women became recruiters, as this is one of the few employment options available to previously trafficked women. 39 A study by the United Nations Interregional Crime and Justice Research Institute (UNICRI) on Romanian trafficking to Germany reports that women are used not only as recruiters of other women but also as guardians in the destination country. 40 In 2007, of the 121 people arrested for human trafficking in Greece, 38 were women. Of these, more than 40% were Russian, Ukrainian and Kazakh, whereas the same nationalities accounted for only 7% of the males arrested. The prevalence of female traffickers is also characteristic of Nigerian trafficking, 41 and women may evolve over time from victim to exploiter. 42 The Nigerian networks have loose structures and operate mainly in and from Nigeria, although they have bases in Europe through which the women are transported before arriving at their final destination. The exploitation in Europe is handled by resident Nigerian women, referred to as madams. 43 A large part of the West African trafficking into Europe originates from, or passes through, the FIG. 36: SHARE OF FEMALES AMONG CONVICTS FOR TRAFFICKING OFFENCES AND FOR ALL OFFENCES, TIP-average All crimes -average % 50% 40% 30% 20% 10% 21% 22% 23% 23% 18% 18% 13% 13% 9% 8% 26% 14% 28% 13% 30% 9% 53% 9% 0% Netherlands Germany Slovakia Romania Portugal Hungary Czech Republic Cyprus Latvia Source: UNODC/UN.GIFT 47
54 TRAFFICKING IN PERSONS FIG. 37: MOST FREQUENTLY DETECTED NATIONALITIES OF OFFENDERS IN SELECTED COUNTRIES number of offenders Greeks Bulgarians Romanians Russians Ukrainians Albanians Dutch Moroccans Turks Romanians Greece 2007 Netherlands Romanians Italians Albanians Nigerians Chinese number of offenders Polish Thais Turks Moldovans Russians Azerbaijanis Kyrgyz Uzbeks Ukrainians Georgians Italy Turkey 2006 Source: Official National Statistics Nigerian state of Edo and its capital Benin City. It is mainly conducted by Edo traffickers, known as Binis. 44 In Europe, the perpetrators are frequently not nationals of the country where they operate, in contrast to some other regions. Often, their nationality corresponds to that of the victim. For example, only 39% of the traffickers prosecuted in Greece in 2007 were Greek. More than half came from Bulgaria, Romania, the Russian Federation and Ukraine, the largest source countries for trafficking victims. A similar situation is found in Italy. This suggests that diaspora communities are a vector for trafficking, but there are exceptions. In Germany, Turks are the most commonly encountered foreign traffickers, but no Turkish victims have been detected. The same is true with Moroccans in the Netherlands. As a rule, groups engaging in trafficking for sexual exploitation are small. 45 The Russian Federation provides a case in point, where many of the groups comprise two or three people. 46 But again, there are exceptions. Azerbaijani authorities detained over 40 members of a trafficking group with cells in five countries. The network covered a huge area extending from Central Asia to Turkey and was engaged in human trafficking and the issuance of fake documents, which they used to import the victims TRANSNATIONAL ORGANIZED CRIME THREAT ASSESSMENT
55 2 In Romania, based on a sample of 30 cases, UNICRI found 23 involved groups of three or more people, while seven cases were conducted by individuals operating alone. Most of the groups sampled in this study were very small, however; usually made up of a recruiter, a transporter and an exploiter. Within the larger networks there was usually a structured division of labor and often additional accomplices who performed support tasks on an irregular basis. 48 European groups may be involved in recruiting in source countries in Latin America. This is the case for the Brazilian flow, which appears to be in the hands of European and Asian organizations. The involvement of Asian organized crime groups in Brazil has been documented. 49 About one third of the recruiters in one research sample (52 of 161) were European or Asian. 50 Other studies report that trafficking of Brazilian women to Spain and Portugal is conducted through cooperation among different groups, in which Russian groups are said to play a dominant role. 51 How big is the flow? The ILO estimates that the minimum number of victims trafficked for all purposes in Europe and North America is 279,000 in Based on data gathered by UNODC, the total number of victims detected in West and Central Europe was 7,300 in If about one victim in 20 were detected, the number of trafficking victims in Europe would be around 140, To reconcile this with the estimate of the number of sex workers in Europe generally (see Box), about one sex worker in seven would be a trafficking victim. A high figure, but not beyond the realm of possibility. 55 Research on the period of exploitation suggests a turnover period of two years on average. 56 This means some 70,000 women would need to be trafficked anually to replace those leaving the market. If there were indeed 140,000 trafficking victims in Europe, they could produce perhaps 50 million sexual services annually. 57 At 50 per client, 58 this would constitute a market worth 2.5 billion annually. More research is required, however, on both the client load and the rate for services for both trafficked women and other sex workers. For this to be possible, there must be commensurate demand. Assuming 5% of the adult (15-49) male population of Europe sees a sex worker on a monthly basis (see Box), there would be demand for 600 How big is the commercial sex market in Europe? Notwithstanding the existence of different markets for sex, including sex tourism, transgender prostitution and male prostitution, commercial sexual services in Europe are consumed almost entirely by men and performed in great part by women. National survey data suggest the percentage of men who have purchased sexual services in their lifetimes varies considerably between countries and over time. According to the Kinsey surveys in the 1940s, 70% of adult males reported having paid for sex at least once in their lives, 59 but this was at a time when non-compensated extramarital sex was far less common than today. More recent surveys suggest the figure today is closer to 19%. 60 Recent surveys in other countries suggest a similar figure in Sweden (13%), 61 the Netherlands (14%), 62 Australia (15%) 63 and Switzerland (19%). 64 Spain (39%) is an outlier in Europe, 65 as is Puerto Rico (61%) in North America. 66 The comparable figure is even higher in Thailand (73%). 67 Self-reported annual prevalence for buying sex has been estimated at 13-15% of the adult male population in the Central African region, 10-11% in Eastern and Southern Africa, and 5 7% in Asia and Latin America. The median for all regions was about 9 10%. 68 A British study found that 4% of the men polled reported having paid for sex in the previous five years. 69 Another British study found that 10% had paid for sex in their lifetimes, of which two thirds (7%) had paid for it in the last year and 27% (3%) were regular clients of prostitutes. Over half of these men reported having paid for sex while abroad, and less than 2% had paid for sex both domestically and abroad, suggesting that about half of these men were not clients for British sex workers. 70 A Spanish study found that 25% of men had paid for heterosexual sex at some time in their lives, 13.3% in the last 5 years and 5.7% in the last 12 months. 71 How many women are required to meet this demand? An estimate of the number of women engaging in transactional sex in 25 European countries (comprising 74% of the total European population) suggests a sex worker population of some 700,000 women, or 0.63% of adult women (15-49) of these countries. 72 Extrapolating to the entire European population, this would indicate a total of about one million sex workers. If 0.6% of the women are selling sex and 6% of the men are buying it (the prevalence in the Spanish Study cited above), this suggests a ratio of about one sex worker per 10 annual clients, which is clearly too little to be possible, even if they were all regular customers. Doubling or even tripling the share of men visiting sex workers would only double or triple this client load. Despite the estimates, either less than 0.6% of European women sell sex professionally, or more than 6% of men purchase sex on annual basis, or both. More research is required on the nature, structure, economics and scale of this industry. million sex services annually, meaning trafficking victims would meet about 8% of demand. Detecting trends in the number of trafficking victims is difficult, because awareness of the problem and legislation to deal with it is evolving. As a result, it is difficult to distinguish trends in enforcement from trends in prevalence. The number of victims of trafficking for sexual exploitation detected by the authorities in Europe increased about 20% between 2005 and Some countries (for example, Germany and Romania) have registered a recent decrease in the number of criminal proceedings and a reduction in the absolute numbers of victims detected. At the same time, other countries in West and Central Europe registered an increase in detected cases. 49
56 TRAFFICKING IN PERSONS FIG. 38: Decreasing trends, 26% SHARE OF COUNTRIES REPORTING TRENDS IN RECORDED CONVICTIONS IN WEST AND CENTRAL EUROPE, S table or no clear trends, 48% Increasing trends, 26% Source: UNODC/UN.GIFT Some trends can be seen in the profile of the victims, however. Today, it appears that about 60% of the victims detected originate from the Balkans, Central Europe and the former Soviet Union. Perhaps 13% come from Latin America, about 5% from Africa and about 3% from East Asia. A large share of the victims (about 20%) are either of unspecified origins or are local victims. This is a different profile than in the past. In the late 1990s, for example, Albania was a hot spot for human trafficking. In 1996, about 40% of the victims of trafficking for sexual exploitation in Italy were Albanians. This dropped to 20% in and 10% after A similar trend was recorded for Ukrainian and Moldovan victims. The trafficking originating from the Russian Federation and Ukraine, although still prominent, appears to have decreased in the last ten years in all West and Central European countries. This decline coincided with an increase in detected victims from the Balkans, particularly Romania and Bulgaria, but this trafficking flow also appears to have decreased after New nationalities have appeared on the European scene in the last few years. While generally small, the share of Chinese, Paraguayan, Sierra Leonean, Uzbek and Turkmen victims has been increasing over time. This shows a diversification of the sources of women trafficked for sexual exploitation. In addition, an increase of domestic trafficking has been recorded in all of West and Central Europe. In Turkey, Uzbek and Turkmen women seem to be replacing the Russians and Ukrainians. Similarly, in Spain the increase of Paraguayan and Brazilian trafficking victims appears to have compensated for the decrease in trafficking from Colombia. This suggests that human trafficking rings may react to changes in traditional origin countries, such as increased awareness among potential victims, stringent law enforcement action or improved livelihoods. FIG. 39: SHARE OF SELECTED NATIONALITIES OF VICTIMS DETECTED IN ITALY, % 40% % of victims detected 35% 30% 25% 20% 15% % 5% 0% Albanians Ukrainians Moldovans Source: Anti-mafia bureau and project WEST 50 TRANSNATIONAL ORGANIZED CRIME THREAT ASSESSMENT
57 2 FIG. 40: SHARE OF SELECTED NATIONALITIES OF DETECTED VICTIMS IN SPAIN AND TURKEY % of victims detected 50% 45% 40% 35% 30% 25% 20% 15% 10% 5% 0% % of victims detected 40% 35% 30% 25% 20% 15% 10% 5% 0% Uzbek and Turkmen in Turkey Rus s ian, Ukrainian in Turkey Colombian in Spain Brazilian and Paraguayan in Spain Source: UNODC/UN.GIFT 51
58
59
60 TRAFFICKING IN PERSONS What is the nature of this market? In addition to leading the world in the export of manufactured goods, China has also emerged as a world leader in the export of labour, and not all Chinese migration is regular. Despite the tremendous demand for labour due to China s rapidly growing economy, many Chinese invest large sums and even risk their lives to be smuggled to overseas job markets. This is because while China s unemployment rate is very low (4%), and a remarkable 92% of the Chinese population aged is economically active, 76 China accounts for 22% of the world s poor, and 52% of the population lives on less than US$2 per day. 77 This suggests that the country hosts hundreds of millions of people who could be classed as the working poor, for whom a better life overseas might be attractive. Those who choose to migrate appear to be contributing to the expansion of the Chinese economy. Chinese migrants are investing in China s domestic economy as well as in the country s economic expansion abroad. The United Nations Population Fund (UNFPA) estimates that 70% of the 2006 Chinese foreign direct investment (FDI) inflows 78 came from the Chinese diaspora. Chinese remittances from abroad grew from about US$1 billion in 1995 to about 21 billion in At the same time, the presence of Chinese migrants is strongly correlated with Chinese outward FDI, suggesting that migrants are supporting these investments. 80 South-East Asia and South America have long been recipients of Chinese outward FDI, while investment in Eastern Europe and Africa is growing. Migration appears to parallel these investment flows. While much of this migration is licit, some is not. Illegal emigration from China is very expensive, as detailed below. Few people living on two dollars a day can afford to pay to be smuggled based on their existing resources, and so most agree to pay the smuggler out of future earnings. This creates a situation which is often characterized as migrant smuggling, but in fact is human trafficking. Although the victim voluntarily takes on the debt, the debtor assumes an ownership interest in the victim, and cannot afford to allow the victim freedom of movement. The result is coerced labour, almost always exploitative, and generally backed by the threat of violence. 81 Although they are not the largest national group of victims, 82 Chinese victims have been detected in more countries than any other nationality, a fact that suggests there is something unique about the trafficking of Chinese citizens. Between 2005 and 2008, Chinese victims of human trafficking have been detected by the authorities in at least 25 countries, and differently documented in about 65 countries in different regions of the world, including areas not normally seen as human trafficking destinations, such as parts of Africa and the Pacific Islands. 83 China itself is also affected by domestic trafficking. 84 FIG. 41: COUNTRIES WHERE CHINESE VICTIMS OF HUMAN TRAFFICKING HAVE BEEN DETECTED China UNODC / SCIENCES PO Source: UNODC/UN.GIFT, other sources Official source Other source No data or no Chinese victims officially reported 54 TRANSNATIONAL ORGANIZED CRIME THREAT ASSESSMENT
61 2 FIG. 42: COUNTRIES WITH THE HIGHEST EMPLOYMENT LEVELS OF PEOPLE AGED (MOST RECENT DATA AVAILABLE) FIG. 43: Brazil GINI INDEX IN THE WORLD S LARGEST ECONOMIES (MOST RECENT) 57 92% China United States percentage employed 91% 90% 89% Rus s ian Federation Japan United Kingdom Italy Spain % Germany 28 87% China Rw anda Burundi S olomon Is lands Source: International Labour Organization Vietnam France Source: World Development Indicators, World Bank China is very large and culturally diverse, so it is not surprising that migration affects some areas of the country more than others. The earliest migrants were often Cantonese-speaking sailors or labourers, but the bulk of recent migrants come from the south-eastern provinces of Fujian and Zhejiang and migrate to join other members of their community in the destination country. 85 In both instances, early migrants worked over time to bring relatives over to well-developed Chinatowns in urban centres around the world. The very latest wave of migration is different, however. The closure of state-run enterprises in the north-east of China has led to rapid and less organized migration from that area. These new flows are attracting more women than men, 86 and are characterized by a less communitarian migratory pattern. They are therefore more vulnerable to human trafficking. 87 How is the trafficking conducted? Chinese human trafficking occurs on the basis of a debt bondage scheme and in the context of assisted irregular migration from China. Chinese irregular migration is mainly conducted by groups with the sinister-sounding title of snakeheads. Snakehead fees are high and those indebted to them may be pressured in various ways to prioritize repayment. 88 In a study conducted in New York and Los Angeles, researchers found a wide range of smuggling fees for different services. These prices are generally far beyond the means of the average Chinese citizen. The cost of being smuggled from China to the USA, for example, is generally in range of US$50,000-60, FIG. 44: India, 41% SHARE OF THE GLOBAL POOR, 2003 China, 22% Nigeria, 8% Pakistan, 4% Bangladesh, 3% Others, 21% Source: Country Responsibilities in Achieving the Millenium Development Goals, Boston University working paper, 2003 Indentured labourers have little negotiating power and are vulnerable to exploitation. Labourers are expected to work long hours under difficult conditions until they can repay debts. 90 If the debt is not repaid on time, irregular migrants and their guarantors may risk kidnapping, torture and other forms of violence. 91 Some studies report that migrants smuggled to western countries by Chinese snakeheads are exploited for illegal activities, such as drug couriering 92 or selling pirated discs in the streets. 93 Part of this vulnerability is due to cultural displacement. Due to the insularity of many Chinese expatriate communities, migrants typically arrive with little or no command of the local language and may develop little on the job. Finally, labourers in China expect to work long hours under difficult 55
62 TRAFFICKING IN PERSONS FIG. 45: RELATION BETWEEN CHINESE INVESTMENTS ABROAD AND MIGRATION FDI stock 90 4 Chinese migrants stock ( ) FDI billions US$ Millions of chinese migrants Africa Middle East Oceania Europe and Central Asia Americas Asia 0 Source: UNODC elaboration of official FDI statistics and global migration database Services conditions with little personal life until they can earn a start-up stake and repay debts. 94 The victims coming from the impoverished northeastern regions typically move to the south-east before being trafficked, where they mix with other migrants. The former Soviet Union and Eastern PRICES OF SMUGGLING SERVICES FROM CHINA TO NEW YORK AND LOS ANGELES, 2003 Most quoted price range (US$) Passport purchase 10,000-25,000 Expenses for passport seller in China Photo substitution (passport photo alteration) Maiguan (bribery at border checkpoint) 5,000 3,000-5,000 8,000 Client recruitment 500-1,000 Escort (through transit point) 4,000-5,000 Bribery of port inspector (to allow stowaway) Smuggling boat captain payoff (per trip) 1,000-5, ,000 Debt collection fee (per client) 500 Eligible bachelors (for fraudulent marriages) Source: Zhang and Chin, Characteristics of the Chinese Human Smugglers: A cross-national Study, ,000-30,000 Bloc states have long been a conduit for Chinese migrants to Europe. 95 The Russian Federation is also a possible transit country if the destination is North America. Countries in Latin America (Mexico, Suriname) can be used as transit areas to the USA or Canada. The border crossing between the USA and Mexico may be subcontracted to Mexican groups. 96 Southern California has been an important point of entry for migrants trafficked from China via Central America and Mexico. 97 The journey tends to be punctuated by long layovers and Chinese victims may be stationed in transit countries for years. For example, some Chinese victims were recently found being exploited in restaurants of Montevideo, Uruguay. Their ultimate destination was the USA. 98 Human trafficking into Australia is conducted by sea and air. Maritime routes are more frequently used because they are more flexible and ports of entry can be changed to avoid detection. Trafficking by air is more complicated and generally relies upon the purchase of Taiwanese passports. 99 While migrants are exploited in a variety of industries, one area where Chinese forced labour has become more prominent in recent years is prostitution. Traditionally, Chinese brothels were accessible just to the Chinese communities, but this appears to be changing in some parts of the world. While the traditional Chinese brothels used to be socially controlled, the new forms of Chinese prostitution seem to be more amenable to trafficking in persons TRANSNATIONAL ORGANIZED CRIME THREAT ASSESSMENT
63 2 In Taiwan, Province of China, for instance, the spatial environment in which prostitution is conducted has changed. Rather than the traditional brothels, more and more sex work is being conducted in private apartments, the so-called one studio, one phoenix system, which is more conducive to exploitation since the women are relatively isolated. 101 To stock these apartments, women may be trafficked from the mainland by making use of fake marriages, counterfeit passports or smuggling by sea with fishing boats from the Fujian coasts. 102 Typically, they are accompanied by a jockey who controls and regulates the woman s daily life on arrival. Once in Taiwan, Province of China, the migrants are forced into prostitution to repay the smuggling fee, which typically ranges from US$3,500-6,000. The woman in debt bondage can be sold from one group to another until she pays off the debt, which is typically inflated by various charges related to her upkeep. Should she wish to return home, she will have to pay to be smuggled again. As in Taiwan, Province of China, three types of Chinese prostitution can be indentified today in Europe. The first is conducted in traditional brothels meant for ethnic Chinese only. The other two are street prostitution and prostitution in closed apartments or massage centres, which are both accessible to the general public. Traditional brothels are less prone to make use of trafficking victims, 103 while the other two forms are more likely to be exploitative. Apartment-based prostitution is generally marketed through oriental massage ads in newspapers. 104 The more exploitative forms of prostitution typically recruit women from the areas of new emigration (from the north-eastern parts of the country), as opposed to the traditional brothels where women from the south-east are more likely to be found. Chinese are also trafficked to Europe for forced labour. In France, Chinese victims are particularly prominent in the catering and textile sectors. In Italy, trafficked Chinese are also exploited in the textile industry. Recent cases revealed poor labour and living conditions in the textile district of Prato, which is home to the largest Chinese community in Italy. 105 In Spain, 30 Chinese traffickers were recently arrested, also related to the textile industry. 106 In the Netherlands, in contrast, Chinese victims were detected mainly in restaurants and in the agricultural and cleaning sectors. 107 In Europe, as in other parts of the world, counterfeit documents, tourist or student visas, and false marriages are used to smuggle victims to their destinations. Chinese FIG. 46: Textile-Chinese victims, 15 Textile - non Chinese victims, 4 Commerce, 5 human trafficking in North America is similar to that in Asia and Europe. 108 The modalities of Chinese victims trafficking in Africa and the Middle East are still largely unknown. In 2009, in Ghana, three Chinese nationals were found guilty of trafficking Chinese women for sexual exploitation. The victims understood that they were to work in a restaurant in Accra, but were eventually forced into prostitution due to debt bondage. The victims were recruited in the city of Harbin, in the north-east. The brothel was open to the public, but most of the clientele were Lebanese, Indian and Chinese. 109 The use of Chinese restaurants as brothels targeting foreigners has also been reported in Kabul (Afghanistan). Here, IOM assisted more than 90 Chinese women forced into prostitution between 2006 and Victims in this case also originated from the north-eastern or south-eastern parts of the Chinese mainland. 110 Who are the traffickers? NUMBERS OF VICTIMS OF FORCED LABOUR IN FRANCE, ACCORDING TO SECTORS OF EXPLOITATION, 2008 Others, 5 Construction, 33 Service, 3 Source: Office central de lutte contre le travail illegal Chinese organized crime runs the gamut from mafia-like secret societies to street gangs and informal networks. Exploitation of prostitution, migrant smuggling and trafficking in persons are among the illegal activities of these groups, in China and elsewhere. Some Chinese gangs have specialized in protecting the sex establishment; one example is the Heavenly Alliance. 111 Other groups are more directly involved in the smuggling of women abroad and in the exploitation of the indebted migrants. Hotel, bars and catering - non Chinese victims, 7 Hotel, bars and catering - Chinese victims, 8 Agriculture, 19 57
64 TRAFFICKING IN PERSONS The term Triads is commonly used to define a traditional type of Chinese organized crime or secret society. Triads are rooted in Chinese history, operating in Hong Kong, Taiwan and the Chinese mainland, as well as in Chinatowns all over the world. Not all Chinese organized crime is reliant on the Triads, but they play an important intermediary role for many illicit activities. As well known standing organizations, they have a reputation to maintain, and therefore evoke a measure of trust in the underworld. Similar to the Yakuza in Japan, they may be employed by otherwise licit businesspeople when they need to apply informal pressure. They act as brokers or guarantors for a range of illicit transactions. They license illicit activity in the areas they control, and facilitate corruption for less wellconnected criminals. Triads are traditionally hierarchical, with strict rules, structures and ceremonies regulating relations between the members of the group. Although there is a hierarchy to triad leadership, those lower on the ladder have much freedom of movement. The members of the society conduct their business individually, leveraging the membership of a triad to ask favours, receive protection and for networking. Triad groups that bear the same name are not necessarily under central control a legitimate member can set up operations abroad and recruit new members under the brand. The tie that binds members of the Triad is the guanxi (connection) that compels members to provide favours to other members, wherever they are in the world. 112 Not all Chinese criminal groups are triads, and not all human trafficking is triad-linked. There are many local groups that focus exclusively on migrant smuggling and are not formally affiliated to the traditional organized crime structures. The typical Chinese smuggling ring comprises the following actors: Recruiters, often friends or relatives who put the would-be-migrant in contact with the smugglers. Coordinators, who subcontract the various services needed to effect the smuggling. Transporters, who are in charge of moving the migrants from and to airports or ships. Document vendors, who are able to produce the needed documents to facilitate the transportation of immigrants. Guides and crew members, who move illegal migrants from one transit point to another. Enforcers, who maintain order during the travel. Debt collectors, who are responsible for locking up the illegal migrants until the debt is paid back. 113 Human trafficking is reportedly one of the major activities of Chinese groups in South-East Asia (Thailand, the Philippines, Malaysia and Indonesia), including the Wang Kao Niu gang, the 14K triad, and the San Yee On triad. The 14K and the San Yee On gangs are reported to have connections in Japan, Belgium, the Netherlands, France, Italy, the United Kingdom, Ireland, Spain, Romania, Hungary, the Czech Republic, Slovakia, the Republic of Moldova and Serbia. Other groups active in Europe include the Hong Kong-based Wo Group and the Red Sun. 114 In 2008, the Italian National Anti-Mafia Bureau (DIA) indicated that trafficking in persons for sexual exploitation became the most prominent illegal activity of the triads in Italy. 115 In North America, in addition to the 14K, San Yee On, and Wo Group triads, groups include the Big Circle, the Four Seas Gang, the Luen Group and the United Bamboo. 116 In the USA, Fujian Chinese are particularly implicated. 117 FIG. 47: Counterfeiting trademarks and produtcs 39% DISTRIBUTION OF CHINESE CITIZENS ARRESTED IN ITALY, BY OFFENCE COMMITTED (JUNE 2007 TO DECEMBER 2008) Others 1% Robbery 2% Extortion 2% Organized crime 3% Damages 10% Sexual Exploitation 43% Source: National Anti-Mafia Bureau - Italy 58 TRANSNATIONAL ORGANIZED CRIME THREAT ASSESSMENT
65 2 How big is the flow? The largest flow of trafficked Chinese appears to take place within Asia, and seems to be growing over time. Chinese are also trafficked to Europe and North America, with clear recent increases in Europe. In Africa, the Middle East, Latin America and the Pacific, Chinese human trafficking was only recently recorded. In terms of absolute numbers, Chinese internal trafficking appears to be the most severe trafficking flow on the Asian continent. In 2006, 2,160 cases of domestic trafficking were investigated, involving 3,371 offenders. 118 Sexual exploitation is the most frequently reported form of exploitation for Chinese victims detected in Asia and the Pacific, although forced labour has been reported in Mongolia. 119 In Latin America, trafficking in persons from China has been reported in Argentina, Brazil, El Salvador, Mexico, Suriname, Uruguay and the Bolivarian Republic of Venezuela, as well as parts of the Caribbean. Victims were exploited mainly in forced labour, but some were sexually exploited. 120 According to the Organization of American States (OAS), official migration statistics and estimates show an increase in the size of the Chinese communities in the Americas, as well as an increase in the number of detected cases of human trafficking where Chinese were found to be victims. 121 Chinese women trafficked for sexual exploitation have been reported and assisted in the USA and Canada. Chinese victims represented 7% of all the victims detected in the USA in According to a 1999 survey of foreign-born Chinese in the USA, some 82% of those who were smuggled into the USA after 1993 suffered detention by their smugglers or exploiters once they arrived. 123 Using this detention as a rough indicator for human trafficking, it could be estimated that about 10,000 Chinese were trafficked internationally into the USA during those years. 124 The same study indicates that, on average, a Chinese migrant would need 26 months to repay the debt resulting from paying the smuggling fee. 125 Based on data gathered in studies in New York and Los Angeles, 126 this trafficking flow would generate revenues of US$550 million, resulting in an annual profit of some US$100 million. Chinese victims have been detected in all European subregions; Southern Europe (Italy, Spain and Cyprus), Western Europe (Austria, France, the FIG. 48: Bulgarians, 21 Polish, 15 Romanians, 28 Brazilians, 32 Nigerians, 29 Moroccans, 11 Chinese, 48 Others, 121 Source: Immigration Office Federal Public Service of Home Affairs FIG. 49: Moroccans 7% Haitians 1% Romanians 4% Polish 13% NUMBER OF DETECTED VICTIMS OF HUMAN TRAF- FICKING AND SMUGGLING, BY NATIONALITY, BELGIUM DISTRIBUTION OF DETECTED VICTIMS OF HUMAN TRAFFICKING FOR FORCED LABOUR, BY NATIONALITY, FRANCE, 2008 French 20% Serbs 4% Portuguese 1% Congolese 1% Dominicans 1% Brazilians 23% Chinese 23% Source: Office central de lutte contre le travail illégal (OCLTI) Netherlands, Belgium, Ireland and the United Kingdom) and Central Europe and the Balkans (Albania and Bosnia and Herzegovina). 127 Chinese victims have been reported as transiting Scandinavia. Some studies reported exploitation of Chinese workers in agriculture in the Russian Federation. 128 In Italy, the first case of trafficking for sexual exploitation involving Chinese was detected in
66 TRAFFICKING IN PERSONS FIG. 50: MAIN ORIGINS OF FOREIGN CITIZENS ARRESTED IN ITALY FOR SEXUAL EXPLOITATION, BY NATIONALITY (JUNE 2007 TO DECEMBER 2008) Chines e Romanians Albanians North Africans Nigerians Bulgarians Source: National Anti-Mafia Bureau - Italy Four years later, the triads became the largest foreign group involved in sexual exploitation in the country. 130 Similar trends were seen in the Netherlands where, for the first time, Chinese massage centres were described as an emerging form of prostitution in Today, Chinese victims are the most prominent foreign group of victims. 132 While there is much anecdotal evidence of trafficking of Chinese to Africa and the Middle East, there have been few officially reported cases. FIG. 51: MOST DETECTED NATIONALITIES OF FOREIGN VICTIMS OF HUMAN TRAFFICKING IN THE NETHERLANDS (COUNT), Chines e Nigerians Hungarians S ierra Leonean Bulgarians Romanians Source: Dutch National Rapporteur 60 TRANSNATIONAL ORGANIZED CRIME THREAT ASSESSMENT
67 2 IMPLICATIONS FOR RESPONSE The international community acknowledges the need for a policy response articulated in five pillars, key to a comprehensive action against trafficking in persons: prosecution, protection, prevention, national coordination and cooperation, and international coordination and cooperation. The United Nations Protocol on Trafficking in Persons entered into force on 25 December Since then, many countries have passed appropriate legislation, and this represents a significant step forward. Fewer have actually used this legislation to convict anyone, however. In fact, 40% of countries with dedicated laws did not record a single conviction for trafficking in persons from 2003 to 2008, and most of those that have applied the law have registered relatively few convictions. Convicting human traffickers can be tricky, because victims are often so traumatized by the experience that they are unable to assist in the prosecution. But human traffickers have their own vulnerabilities. Victims tend to be employed in certain sectors, like textiles, manufacturing, catering and prostitution. The sex trade in particular is exposed because it must maintain some degree of publicity to attract customers. Often, trafficking victims are offered through front businesses, like massage parlours or escort services, with a very public face. Even where criminal prosecution is not possible, civil action can be taken against offending businesses, for violation of health or labour standards, or for employing illegal immigrants. Part of the reason few convictions have been returned may be due to the fact that although the Protocol has been ratified, some countries have not provided for all the institutional arrangements it recommends. Victim support, for example, serves both to protect this highly vulnerable class of people and to bolster the criminal justice response, facilitating victim participation in the trial. But whether the victim wishes to testify or not, they must not be further victimized by law enforcement or immigration authorities, and care must be taken to ensure they are released into a situation where repeat victimization is unlikely. of awareness, and the flow of victims from this region appears to be in decline. Awareness campaigns targeted at expatriate communities in destination countries, focusing on the problematic industries, can also be beneficial. These campaigns should be evidence-based and evaluated for impact. In areas where prostitution is legal or tolerated, careful monitoring is required to ensure that workers, especially foreigners, are not being exploited. The scrutiny should be applied to all aspects of the sex trade, including cover enterprises like massage parlours and strip clubs. While domestic trafficking occurs, human traffickers commonly exploit the cultural dislocation of immigrants, and there are many well-established intercontinental flows. Putting a stop to human trafficking will require documenting these flows and creating strategic plans to address them. Since they do not suffer the ill-effects themselves, transit countries may be completely unaware of the key role they play. These countries must be informed and involved in finding solutions. Enforcement or prevention efforts in one geographic area may simply divert it to other regions. Plans must be global in scope, and based on strong international cooperative agreements concerning both law enforcement and victim assistance. The problem of human trafficking is not only a criminal justice issue. It involves broader social issues, including labour, urban management, immigration and foreign policies. National and international strategies to stop human trafficking should reflect this complexity, ensuring input and assistance from agencies with expertise in these matters. Of course, prevention is better than cure, and there are many ways that human trafficking can be prevented in both source and destination countries. Public education efforts in Eastern Europe have apparently paid dividends: surveys of potential migrants in some vulnerable areas show high levels 61
68
69 3 SMUGGLING OF MIGRANTS A global threat assessment
70
71 3 SMUGGLING OF MIGRANTS The United Nations defines smuggling of migrants as: the procurement, in order to obtain, directly or indirectly, a financial or other material benefit, of the illegal entry of a person into a State of which the person is not a national or a permanent resident. 1 The criminal, under this definition, is the smuggler, not the smuggled. The aim of the Migrant Smuggling Protocol is not to stop illegal immigration. It is to stop organized criminals from profiting off an inherently vulnerable population. This population is vulnerable because of the great differences in opportunities experienced in different parts of the world. By accident of birth, many young people face a much bleaker future than their counterparts abroad, if they accept the impermeability of national borders. A large number of people are willing to take great risks in order to gain a chance at a better future away from their homeland, including violating immigration laws. In some communities, the practice is very common, and illegal immigration bears no social stigma. Because they must enter their destination country illegally, undocumented migrants may feel compelled to enlist the help of smugglers, either for the purposes of entering the country clandestinely or for assistance in acquiring fraudulent paperwork to secure a visa. Because these services are illegal, those who provide them have tremendous power over their charges, and abuses are commonplace, particularly when the movement is clandestine. Many die on their way to their destination, or are abandoned without resources en route. As with many other illegal transnational activities, efforts to stop illegal immigration can create opportunities for organized criminals. The interdependency of the global economy today explains why migrant smuggling is a growing criminal enterprise. Capital flows virtually unimpeded around the world; the same is not true for labour. The two are connected, however, as a growing share of national incomes are dependent on transnational remittance flows, particularly in the smaller economies. Remittance flows are largest for lower-middle income countries, not the poorest of the poor. These flows do not necessarily come from the richest countries they need only be richer than the source countries to attract labour. Both developing and developed countries need well-regulated migration. Many developed countries are facing low or even negative population growth, and populations are ageing. At the same time, many developing countries are still seeing population growth that exceeds economic growth, but restrictions to legal migration have arguably increased in the last thirty years. There are an estimated 50 million irregular international migrants in the world today. 2 A good share of these people paid for assistance in illegally crossing borders. The fees involved can be many times their FIG. 52: HUMAN DEVELOPMENT INDEX, Lack of data UNODC / SCIENCES PO Source: UNDP Case studies of transnational threats 65
72 SMUGGLING OF MIGRANTS FIG. 53: MIGRANTS REMITTANCES AS A SHARE OF NATIONAL GDP (TOP 25 COUNTRIES), % 45% 40% 35% 30% 25% 20% 15% 10% 5% 0% Tajikistan Tonga Moldova Lesotho Guyana Lebanon Samoa Jordan Honduras Kyrgyz Republic Jamaica El Salvador Haiti Bosnia and Herzegovina Nepal Serbia Albania Nicaragua Guatemala Philippines Senegal Cape Verde Bangladesh Dominican Republic Togo Source: World Bank FIG. 54: TRENDS IN REMITTANCE INFLOWS, Lowincome countries Middleincome High income US$ Millions - Migrant Remittance Inflows 350, , , , , ,000 50, Source: World Bank annual income before migrating. They may borrow heavily against the expectation of greater future earnings, and their debtors may be equally poor people who invest everything in the hope of forthcoming remittances. Of course, not every illegal migrant requires assistance in getting to their destination, but a surprising share do, even when the path seems fairly direct. A number of factors can favour high levels of organization, including the distance to be travelled, the degree of cultural isolation of the migrants and the difficulties of evading law enforcement. In practice, migrants may pay for assistance in making some border crossings while tackling others independently. They may travel alone until they meet resistance, and only then seek assistance. The nature of that assistance is likewise varied. Many smugglers may also run legitimate businesses. For example, licensed travel agents may provide advice and assistance to people wishing to migrate illegally. 3 Some are merely opportunistic carriers or hospitality providers who choose to look the other way. Demand for transport and sanctuary may suddenly emerge as migration routes shift, and in some parts of the world, small businesspeople cannot afford to be choosy about their clientele. 4 Many may fail to appreciate the moral downside of helping people find a better life. On the other hand, full-time professional criminals some specialized in smuggling people, some not are important in many flows around the world. Both formal and informal structures may operate without conflict, so long as business is plentiful. Smugglers are often either of the national origin or ethnic background of the migrant group they serve, or of the country of transit, depending on the role played. One typology distinguishes local smugglers from stage coordinators. Stage coordinators help migrants navigate through a particular country or part of their journey, and, for reasons of communication and trust, are generally of the same 66 TRANSNATIONAL ORGANIZED CRIME THREAT ASSESSMENT
73 3 FIG. 55: POPULATION GROWTH RATE, SELECTED COUNTRIES (MOST RECENT) 4% 3% 2% 1% 0% -1% Liberia Uganda Congo DRC Somalia Afghanistan Paraguay Sierra Leone Angola Guatemala Honduras Nicaragua Morocco Brazil Mexico Turkey United States Canada China France United Kingdom Italy Germany Poland Japan Russia Source: World Development Indicators, World Bank ethnic background/origin as the migrants. They subcontract services to smugglers who come from the area to be crossed and thus know the terrain best. 5 Services may be purchased as a package from origin to destination, or piecemeal, with more comprehensive and safe approaches commanding higher prices. Air travel with visa fraud is the preferred route for most who can afford it, and those less well-resourced are compelled to take their chances with more arduous land and sea voyages. 6 Many migrants optimize their value for money by combining strategies. 7 The following two flow studies exemplify many of these observations, and illustrate the pull the affluent north has upon its southern neighbors. The single largest number of migrant apprehensions found anywhere in the world is along the southern border of the USA, a flow that, despite proximity, is largely handled by organized groups. A flow with similar dynamics and growing potential is that from Africa to Europe. These are not the only two major illegal migration flows in the world, of course. There are also a number of undocumented migrants from East Africa to Yemen, and a flow of people through Central Asia to the Russian Federation and beyond. But the flows to the USA and Europe are probably the most lucrative ones for smugglers, and so they are the topic of the flow studies below. FIG. 56: 100% 80% 60% 40% 20% 0% REGIONAL SHARES OF WORLD POPULATION, HISTORICAL AND PREDICTED est Source: Population Division, United Nations Department for Social and Economic Affairs Oceania Northern America Europe Latin America and Caribbean Africa Asia Case studies of transnational threats 67
74
75
76 SMUGGLING OF MIGRANTS FIG. 58: Argentina Chile Brazil Antigua & Barbuda Paraguay Costa Rica Panama Belize Grenada Ecuador Dominica Colombia Bolivia Mexico Jamaica Honduras Domincan Republic Antigua & Barbuda Peru Haiti Nicaragua El Salvador Cuba Guatemala What is the nature of the market? The USA is a nation of immigrants, and its receptivity to immigration has long been one of the country s strengths. It presently hosts in absolute terms - by far the largest foreign-born population of any country in the world. This situation is a manifestation of deeply held American values, including a belief in social mobility and self-reliance. Compared to the European Union, for example, the USA offers a relatively slender social safety net to new arrivals. From an economic perspective, it therefore risks less by allowing an immigrant into the country. People emigrate to the USA from all over the world, but Latin America provides the largest regional share, accounting for over a third of the foreignborn population. Most of these migrants are authorized, but it is estimated that just under a third of all immigrants to the USA are illegal, and about 80% of the illegal emigrant population in the country is from Latin America. 8 Of all illegal immigrants in the USA, an estimated 25-40% entered the country on a legal visa and REFUSAL RATE FOR VISA REQUESTS (B-VISAS ONLY), FOR LATIN AMERICANS (FY 2007). IN YELLOW, THE TOP 5 NATIONALITIES FOR IRREGULAR MIGRANTS APPREHENDED AT THE BORDER 9 0% 10% 20% 30% 40% 50% 60% then overstayed, with the remainder having entered the country clandestinely. The nationalities most likely to be denied a visa are also among those most likely to be detected entering clandestinely. Most clandestine entrants to the USA come across the Mexican border, and most of these entrants are Mexican. Given the proximity of the country, it is not surprising that most Mexican illegal immigrants enter the country by clandestinely crossing the border, rather than relying on a visa overstay or other overt means. 10 As is explained below, over 90% of illegal Mexican migrants are assisted by professional smugglers. The USA hosts the second-largest Spanish-speaking population in the world. More than 9 million people born in Mexico alone were living in the USA at the time of the 2000 census, the single largest foreign national contributor to the population. Over a third of the population speaks Spanish in the border states of California, Texas and New Mexico. Combined with the fact that some 150 million Latin Americans live on less than two dollars per day, this expatriate population exerts a powerful pull on the poorer states to the south. 11 Mexican immigrants can expect to greatly improve their standard of living without having to master a new language or leave behind their cultural group. Migrants make an important contribution to the economy of Latin American countries. Remittances from Mexican migrants to the USA increased from US$3.6 billion in 1995 to US$20 billion in Central American countries figure prominently Stock of migrants FIG. 57: 45,000,000 40,000,000 35,000,000 30,000,000 25,000,000 20,000,000 15,000,000 10,000,000 5,000,000 0 INTERNATIONAL MIGRATION STOCK, TOTAL BY COUNTRY, 2005 USA Russia Germany Ukraine France Source: US Department of State Source: World Development Indicators 70 TRANSNATIONAL ORGANIZED CRIME THREAT ASSESSMENT
77 3 FIG. 60: ORIGIN OF ESTIMATED FOREIGN-BORN POPULATION IN THE USA (LEFT) AND TOP COUNTRIES OF FOREIGN BIRTH (RIGHT), 2000 Oceania Nothern 1% America 3% Africa 3% Europe 16% Central America (including Mexico) 35% Caribbean 10% Foreign born population (est) 10,000,000 9,000,000 8,000,000 7,000,000 6,000,000 5,000,000 4,000,000 3,000,000 2,000,000 Asia 26% South America 6% 1,000,000 0 Mexico China Philippines India Viet Nam Cuba Rep. of Korea Source: US Census Bureau, Census 2000 among those countries with the highest share of GDP attributable to remittances. But remittances do not come from nowhere they represent value created in the US economy. As the US population becomes more skilled, there is a demand for unskilled and semi-skilled labour, particularly in industries such as construction and agriculture. 13 Former Federal Reserve Chairman Alan Greenspan testified before Congress that illegal immigration significantly supported the US economy by providing a flexible workforce and creating a safety value to accommodate fluctuations in demand for labour. 14 Unfortunately, it also creates opportunities for organized crime. How is the smuggling conducted? The 3,000 kilometre south-west border of the USA is relatively sparsely populated, much of it desert, with the thin Rio Grande river separating Mexico and the US state of Texas. It is among the most crossed international borders in the world, dotted with a series of twin cities, the most prominent of which are San Diego/Tijuana, El Paso/Juarez, Nogales/Nogales, Laredo/Nuevo Laredo, McAllen/ Reynosa and Brownsville/Matamoros. Many of these pairings allow day commuters to pass with limited controls, with security checks only some distance from the border. This necessary accommodation of the hundreds of thousands of people who cross every day effectively broadens the area where illegal entry is possible. FIG. 59: Number of apprehensions at all borders, 2008 UNODC / SCIENCES PO Country of origin Mexico 693,692 APPREHENSIONS OF IRREGULAR MIGRANTS AT THE US BORDERS Honduras 23,789 Guatemala 22,670 El Salvador 17,911 Cuba 3,896 Brazil 2,649 Ecuador 2,322 Domincan Rep. 1,934 Nigaragua 1,862 China 1,772 Colombia 1,460 Haiti 1,098 Peru 949 India 822 Other countries 14,842 Source: US Department of Homeland Security Evolution of apprehensions in the USA (number of migrants), ,600,000 1,500,000 1,200,000 1,100,000 1,000,000 UNODC / SCIENCES PO 900, , , Total At the South-West border Source: US Department of Homeland Security Case studies of transnational threats 71
78 SMUGGLING OF MIGRANTS FIG. 61: MIGRANT FLOWS FROM LATIN AMERICA TO THE USA, United States of Am erica 60,000 Colorado 50,000 CALIFORNIA ARIZONA ,000 30,000 San Diego Tijuana El Centro Mexicali Yuma Tucson NEW MEXICO Ciudad Juarez El Paso Rio Grande Marfa Number of migrants apprehended at the US border TEXAS 20,000 10,000 UNODC / SCIENCES PO Other sectors* * Washington, New York, Michigan, North Dakota, Montana, Maine, Florida, Louisiana, Puerto Rico, Washington and Vermont Del Rio Nuevo Laredo Laredo 200 km Mexico Rio Grande Valley Source: US Department of Homeland Security Reynosa Matamoros Some 97% of the illegal migrants who enter the USA clandestinely do so over this border. 15 Coastal apprehensions comprised less than 1% of the total unauthorized migrants intercepted in Currently, Arizona sees more illegal border crossers than any other state, which was not the case ten years ago, while California recently regained some lost popularity. Some 88% of the total 792,000 migrants apprehended in 2008 were Mexican nationals. The remainder were mostly other Latin Americans. 17 The number of apprehensions of irregular other than Mexican migrants increased rapidly in the beginning of this decade (up 220% from 2002 to 2005) 18 but decreased in the last few years (down 60% from 2005 to 2008). 19 Given the scale and scope of migration in this area, and cultural affinities between the USA and Mexico, the need for assistance in crossing the border might be unclear. But US border enforcement is apparently quite effective at deterring independent border crossers, because a very large and growing share of detected migrants say they paid smugglers for assistance. 20 Enforcement has also pushed migrant flows into increasingly harsh terrains, such as eastern California and the Sonoran desert of Arizona, which may be the reason behind a growing number of detected migrant deaths. 21 Although migrants have been detected travelling by rail, on foot, and even using dedicated tunnels, most migrants are smuggled in trucks. 22 The smuggling generally takes the migrants some distance from the border. Smuggled migrants may be collected in stash houses, either before the crossing or once inside the USA. 23 The smugglers group the migrants in these houses in order to receive the rest of the smuggling fee. This is normally paid by migrants relatives in the country of origin or in the USA. 24 While delaying payment until the crossing is complete provides some security that migrants will not simply be dumped in the desert, it also transforms the migrants into hostages, the collateral on which the transaction is secured. In 2004, among 275 people arrested for migrant smuggling in the USA, 36 (25%) were also charged with hostage taking, and 15% of the smuggled aliens concerned had been held against their will in attempts to extort additional payments. 25 It appears that this practice is expanding within Mexico as well, as non-mexican migrants are being held for ransom in Tabasco and other states. 72 TRANSNATIONAL ORGANIZED CRIME THREAT ASSESSMENT
79 3 FIG. 62: TRENDS IN APPREHEN- SIONS AT THE US SOUTH- WEST BORDER, FIG. 64: NATIONALITIES (SHARE) OF THOSE APPREHENDED AT US BORDERS, FY 2008 Share of apprehensions at the US South-West border (%), Honduras 3% Guatemala 3% 52% 29% Mexico 88% El Salvador 2% Other countries 4% California 39% 26% Texas Source: US Department of Homeland Security 45% UNODC / SCIENCES PO 9% Arizona FIG. 65: 100% 95% SHARE OF MEXICAN ILLEGAL IMMIGRANTS MAKING USE OF SMUGGLERS, Source: CRS Presentation of CIR and CBP Data 90% 85% 80% 75% 70% 65% FIG. 63: Rio Grande Valley (Texas) 11% San Diego (California) 23% SHARE OF BORDER SEC- TORS IN TOTAL APPREHEN- SIONS, FY 2008 El Centro (California) 6% El Paso (Texas) 4% Laredo (Texas) 6% Tucson (Arizona) 45% Source: US Department of Homeland Security Others 5% 60% 55% 50% Source: Mexican Migration Project The smuggling of Mexicans is somewhat different from the irregular migration of other nationals. In contrast to Mexicans illegal border crossing, other Latin Americans cross the border mainly at the eastern sectors of Texas (80% of other than Mexican apprehensions in 2005). 26 This may be related to the repatriation agreements between the USA and origin countries. Once apprehended at the border, a Mexican migrant is repatriated immediately on the legal base of bilateral agreements. Because of a lack of such agreements with the Central American countries, when irregular non-mexican migrants are apprehended, they are detained Case studies of transnational threats 73
80 SMUGGLING OF MIGRANTS FIG. 66: MIGRANT DEATHS AT THE US SOUTH-WEST BORDER, Source: CRS presentation of CIR and CBP Data until the country of origin accepts repatriation. In this context, the migrant may be released on their own recognizance with an order to leave the country. 27 Release of irregular migrants is more likely to occur in areas where centres have less bed space, such as the Texas sectors of McAllen and Del Rio, where more than 90% of the other than Mexicans apprehended are released. 28 Thus, when entering illegally through the eastern sectors of the border, Mexican nationals hide and run, while other nationals may wait to be detected. 29 Who are the smugglers? It appears that smugglers face little risk of arrest, since they normally pretend to be irregular migrants, and are immediately repatriated. 30 With low risks and high demand, it should come as no surprise that a wide range of smuggling groups is currently plying the trade. Some have argued that migrant smuggling from Mexico is mainly a mom-and-pop type of activity, primarily conducted by part-time smugglers. 31 Others have claimed that drug smuggling gangs are implicated. 32 Both might be true. As mentioned above, the crossing points of Mexican and other migrants are different. It may be easier for Mexican migrants to acquire the name of a local small-scale smuggler through family or social connections than it would be for nationals of countries further south. Also, non-mexicans may need assistance travelling the entire length of Mexico illegally. As a result, it is possible that trans-mexican smuggling of other nationals has become the domain of Mexico s premier national organized crime groups: the drug cartels. Most of the cocaine entering the USA crosses the Texas border, just like the other than Mexican migrants, particularly along the plazas (crossing spots) controlled by the Gulf Cartel. The Gulf Cartel has operations and allies (including their former enforcement wing, the now autonomous Zetas), down the east coast of Mexico to the Central American border, and may have links with Central American organized crime FIG. 67: APPREHENSIONS OF OTHER THAN MEXICANS, BY RESPONSIBLE BORDER OFFICE, FY ,000 50,000 40,000 FY2002 FY2003 FY2004 FY ,000 20,000 10,000 0 San Diego (CA) El Centro (CA) Yuma (AZ) Tucson (AZ) El Paso (TX) Marfa (TX) Del Rio (TX) Laredo (TX) McAllen(TX) Source: CRS analysis of CBP Data 74 TRANSNATIONAL ORGANIZED CRIME THREAT ASSESSMENT
81 3 FIG. 68: PERCENTAGE OF IRREGULAR MIGRANTS (NON-MEXICANS) RELEASED ON THEIR OWN RECOGNIZANCE BY US AUTHORITIES BY RESPONSIBLE BORDER OFFICE, FY % 90% 80% FY-2004 FY % 60% 50% 40% 30% 20% 10% 0% Livermore (California) Yuma (Arizona) Tucson (Arizona) San Diego (California) El Centro (California) Laredo (Texas) Marfa (Texas) El Paso (Texas) McAllen (Texas) Del Rio (Texas) Source: CRS analysis of CBP Data groups. There have been anecdotal reports of their involvement in migrant smuggling. 33 In addition to the drug trafficking organisations, police have disrupted sophisticated organizations dedicated to migrant smuggling along the borders with California 34 and Arizona. 35 For example, Manuel Valdez-Gomez led a migrant smuggling group based in Arizona from 1997 until his arrest in The group, which began as a family-run illegal enterprise with 20 members, evolved into a large network active in documents falsification, mail and wire fraud and social security fraud. They used a large network of truck drivers and stash houses for illegal transportation of aliens to Ohio, California, Florida, Nevada, Michigan, Illinois, Indiana and other states. The conviction of Valdez-Gomez was hailed as the elimination of one of the largest and most lucrative human smuggling organizations on the Southern border, 36 yet authorities report that they may have smuggled only 100 migrants. 37 Even if the true figure were ten times higher, this would be a drop in the bucket compared to the hundreds of thousands of illegal migrants who enter the country each year, some 90% of whom are believed to have been assisted. This suggests that most illegal immigration from Mexico is in the hands of a large number of small operators. How big is the flow? For this calculation it is necessary to distinguish between migration by Mexicans and other than Mexicans. The Mexican Migration Project has been surveying Mexicans who have migrated to the USA about their migratory experiences since Based on this extensive experience, they estimate that the probability of being apprehended at the border is about 20% for Mexicans (one in five attempts). Some 661,000 Mexicans were apprehended at the border in Some of these may be the same people caught multiple times, 39 so it is more accurate to refer to these as entries. Five times 661,000 is 3.3 million entries. The amount paid per migrant has varied substantially over time, but is currently in the neighbourhood of US$500 to US$2,500. This would suggest that migrant smugglers earn about US$3 billion annually off the Mexican market alone. In contrast, as discussed above, other nationals have less to fear from being apprehended, and being taken into custody may actually facilitate their migration. Assuming that most are, in fact, caught, then some 65, ,000 entries of other than Mexicans occur each year. These people come from a wide range of origin countries, including in Asia and Africa, but most are from Latin America. Case studies of transnational threats 75
82 SMUGGLING OF MIGRANTS FIG. 69: 30% PROBABILITY OF APPREHENSION DURING AN UN- DOCUMENTED BORDER CROSSING, FIG. 71: APPREHENSIONS OF MEXICANS AND OTHER NATIONALS AT THE BORDER (BY YEAR), % 1,400,000 Other Nationals 20% 1,200,000 Mexicans 15% 1,000,000 10% 800,000 5% 600,000 0% , ,000 Source: Mexican Migration Project FIG. 70: AVERAGE PRICE PAID BY MEXICANS TO BE SMUGGLED IN THE USA (AVERAGE ALL CROSS- INGS), Source: US Border Patrol 3,000 2,750 2,500 2,250 2,000 1,750 1,500 1,250 1, This market appears to have been in sharp decline since Between 2005 and 2008, the number of Mexican apprehensions decreased by 35% and apprehensions of other nationals decreased by 62%. 41 Source: Mexican Migration Project Different source countries and routes may result in different pricing, and migrants outside Mexico have less basis for comparison, but one source suggests a price as much as US$10,000 for the trip from the south-eastern coast of Mexico across the border. 40 But as the numbers involved are much smaller, so is the value of this market, realizing at most 1 billion dollars per year. Overall, it appears that about three million Latin Americans are smuggled illegally across the southern border of the USA every year. Since 90% of them are assisted by smugglers, the total income for the smugglers is likely to be around 6.6 billion dollars per year. 76 TRANSNATIONAL ORGANIZED CRIME THREAT ASSESSMENT
83
84 SMUGGLING OF MIGRANTS What is the nature of the market? The dynamics behind African migration to Europe are similar to those behind Latin American migration to the USA, except that the push and pull factors are even stronger. Poverty in Africa is much more severe than in Latin America, and European welfare and labour standards promise a more comfortable life for low-skill workers who manage to immigrate. It is surprising, then, that illegal immigration from Africa to Europe is a fraction the size of that from Latin America to the USA. One explanation for this difference is the relative difficulty of making the crossing and a smaller diaspora. As on the other side of the Atlantic, some migrants secure visas and overstay, but this form of travel is beyond the means of many Africans. For most, there is a simpler, but more hazardous, way of reaching their destination. If they can make it by sea to one of the European islands close to the African coast, they know they will be transported to the mainland for processing. Like the other than Mexican migrants, chances are they will eventually be released with a written order to depart the country, because many European countries lack repatriation agreements with the relevant African countries. If no identity documents are carried, it can be difficult to determine the national origin of the migrant at all. Once released, most ignore the order to depart. FIG. 72: MAIN ROUTES FOR AFRICAN IRREGULAR MIGRANTS TO EUROPE, Atlantic Ocean Schengen Canary Islands (Spain) PORTUGAL MOROCCO SPAIN FRANCE ITALY Mediterranean Strait of Sardinia Sea Gibraltar Gibraltar** Ceuta* Sicily Melila* Oujda Maghnia MALTA TUNISIA GREECE TURKEY CYPRUS Main known hubs Other known hubs Predominant routes (2008) Other routes * Ceuta and Melila are Spanish territories inside Schengen's space, but controls are operated at the border. ** Gibraltar is a British territory. ALGERIA Western Sahara LIBYAN ARAB JAMAHIRIYA EGYPT MAURITANIA Tamanrasset Al Jawf / Kufra Selima Red Sea MALI NIGER SENEGAL Gao Agadez CHAD Kassala El Gedaref ERITREA SIERRA LEONE GUINEA LIBERIA Source: UNODC NIGERIA km SUDAN ETHIOPIA Addis Ababa UNODC / SCIENCES PO EVOLUTION OF APPREHENSIONS AT SEVERAL EUROPEAN COUNTRIES BORDERS, (VERTICAL SCALES ARE DIFFERENT) Migrants apprehended in Spain at sea border (thousands) Strait of Gibraltar/ Alborean Sea Canary Islands Migrants apprehended in Italy (thousands) Rest of Italy Sicily* Sardinia Migrants apprehended in Malta and Africans apprehended in Greece (thousands) Somali in Greece Egyptians in Greece Malta *including Lampedusa TRANSNATIONAL ORGANIZED CRIME THREAT ASSESSMENT
85 3 Although the numbers are not comparable to the Latin American presence in the USA, Europe does host the largest African-born population outside Africa, and Africans comprise, together with non-eu Europeans, the largest group of foreignborn citizens in the European Union. African migrants remittances from Europe account for a sizeable portion of the gross domestic product in a number of countries, particularly in West and North Africa. FIG. 74: 12% 10% 8% 6% REMITTANCES AS PERCENTAGE OF GDP; TOP 20 AFRICAN COUNTRIES, 2007 FIG. 73: CONTINENT OF RESIDENCE OF AFRICAN MIGRANTS OUTSIDE AFRICA (% OF TOTAL AFRICAN EMIGRANT STOCK), Asia 26% North America 10% 4% 2% 0% Senegal Cape Verde Morocco Sierra Leone Liberia Guinea-Bissau Gambia, The Kenya Egypt, Arab Rep. Nigeria Mali Tunisia Benin Uganda Sudan Djibouti Guinea Mauritius Comoros Niger Source: World Bank Europe 62% FIG. 75: Oceania, 1% America, 12% Oceania 2% Latin America and the Caribbean 0% Source: UNDP, 2009 Human Development Report EU-Member States, 8% SHARE OF NEW EU CITIZENS BY CONTINENT OF ORIGIN, 2006 Other, 3% Africa, 27% The motivation to emigrate from Africa to Europe is strong, but so is Europe s need for these migrants. What little population growth there is in Europe is attributable to migration. In 2005, the net gain from immigration (1.8 million people) accounted for almost 85% of Europe s total population growth. 42 The European population is also ageing. With rapid population growth, Africa has young workers to spare. Partly for language reasons, African regular migrants tend to move to the countries that formerly colonized their region. For example, the main destination for legal East African migrants is the United Kingdom, almost 60% of legal migrants from the Maghreb go to France, and most migrants from Southern Africa go to the United Kingdom and Portugal. Germany, however, is relatively popular across the continent, despite not having much of a colonial past, and France is popular among Southern Africans, despite the lack of Francophone countries in that region. Some of these anomalies may be explained in terms of immigration policy, social welfare policies or proximity to Africa. Eight to ten countries of the 27 in the EU receive the vast majority of African migrants. Asia, 22% Source: Eurostat Non-EU Europe, 27% Globally, West Africans are more likely to emigrate than Africans from other regions, but in the EU, North Africans are the most prominent regional group. In 2006, Moroccans were the largest national group to have acquired nationality in an EU state, and the largest group of immigrants in the EU-27. Case studies of transnational threats 79
86 SMUGGLING OF MIGRANTS FIG. 76: DESTINATION OF LEGAL MIGRATION FLOWS FROM AFRICA TO THE EUROPEAN UNION, BY SUBREGION OF ORIGIN, 2000 from East Africa from North Africa Germany, 17% Sweden, 7% Germany, 15% Spain, 8% United Kingdom, 53% Netherlands, 7% Italy, 4% Denmark, 3% France, 3% Others, 6% France, 58% Italy, 6% Netherlands, 4% Belgium, 3% Others, 6% France, 15% Portugal, 27% from Southern Africa Germany, 15% Belgium, 6% United Kingdom, 28% Netherlands, 2% Others, 7% United Kingdom, 17% Germany, 19% France, 33% from West Africa Italy, 8% Portugal, 7% Spain, 6% Netherlands, 3% Belgium, 3% Others, 5% Source: Global migration origin database UNODC elaboration FIG. 77: SHARE OF AFRICAN EMIGRATION, BY AFRICAN SUBREGION, 2000 Global European Union Southern Africa 18% North Africa 33% Southern Africa 14% North Africa 61% West Africa 17% West Africa 39% East Africa 10% East Africa 8% Source: Global migration origin database UNODC elaboration 80 TRANSNATIONAL ORGANIZED CRIME THREAT ASSESSMENT
87 3 FIG. 78: 150, ,000 50,000 0 Morocco Ukraine TOP TEN NATIONAL GROUPS RECEIVING CITIZENSHIP IN THE EU-27, 2006 China India Bolivia Albania Source: Eurostat estimate USA Turkey How is the smuggling conducted? Brazil Russian Federation Illegal migration from Africa proceeds along a number of well-established paths, although the exact route any particular migrant may take is rarely predetermined. Aside from those who can afford to purchase full-packet solutions, which frequently involve air travel and visa overstays, most migrants purchase services piecemeal at one of several wellknown hubs along the way. 43 The journey from sub-saharan Africa to Europe may take several years, and migrants may stop for longer periods along the way to collect resources for the journey onward. 44 Two significant hubs from West Africa on the way north are Gao (Mali) and Agadez (Niger). From here, migrants are collected in trucks departing to Algeria and the Libyan Arab Jamahiriya. On the Algerian side of the border, the city of Tamanrasset is another centre where many sub-saharan migrants work in order to finance the rest of the journey. 45 In Algeria, migrants head north by road and cross the border with Morocco at the Oujda (Morocco) - Maghnia (Algeria) border for the Moroccan departure points. 46 On the other side of the continent, East African migrants gather in Addis Ababa (Ethiopia). Somalis reach Addis Ababa either from the eastern border crossing with Ethiopia near Hargeisa (Somalia), or from the southern border crossing in Dolo (Ethiopia). From Addis Ababa, Somalis and Ethiopians travel across the Sudan, passing by El Gedaref and then north to Selima (Sudan) and Al Jawf / Kufra (Libyan Arab Jamahiriya). Recently, Somalis have started travelling to Sudan via Kenya and Uganda, as the Ethiopian southern border is more strictly controlled. Kassala, on the border between the Sudan and Eritrea, is another transit point for Eritreans and Ethiopians. From here, migrants travel directly to the Libyan Arab Jamahiriya or to the Egyptian coasts. Once migrants have reached the African coast, the journey to Europe can be completed via four routes: by sea from West Africa to the Canary Islands (Spain); by sea/land through Morocco and to southern Spain, Ceuta and Melilla; by sea from the Libyan Arab Jamahiriya/ Algeria/Egypt to southern Italy and Malta; and by sea/land from Turkey to Greece. Canary Islands The overall share of migrants using this route has decreased markedly since 2006, but the Canary Islands remain popular for North and West Africans trying to reach the EU. Moroccan, Algerian, Senegalese, Gambian and Guinean migrants are the most frequently encountered national groups along this route. Departure points are on the western African coasts, including in the territories of Morocco, Mauritania and Senegal, with most embarking in small wooden boats (cayucos from Mauritania and Senegal, pateras from the Maghreb) and, more recently, inflatable rubber boats. These boats are able to carry about 70 people at a time. Crews may be equipped with GPS and satellite telephones. The passage from the African coast to the Canary Islands may cost some 1,000-1,500. West Africans may initially go to Gao (Mali) by land, and from there, westward to the coast. Alternatively, sub-saharan migrants depart from the Gulf of Guinea with larger boats. In this case, the boats follow the coast to the Canary Islands. The shores on the western coasts of the Sahara, between Laayoune and Tarfaya are departure points for the Canary Islands, as the distance to the islands is no more than 115 km from there. Other points are Cape Bojador, El-Aaiun, Dakhla and Lagouira in Morocco, Fann, Ngor, Zinguichor, Casamance and St-Louis in Senegal, and Nouadhibou in Mauritania. Cape Verde has also been a point of departure in the last few years. Migrants may arrive at the islands of Fuerteventura, Lanzarote, Gran Canaria (in the area of Las Palmas), Tenerife or, more recently, La Gomera. Case studies of transnational threats 81
88 SMUGGLING OF MIGRANTS FIG. 79: SHARE OF MIGRANTS ARRIVING AT THE CANARY ISLANDS, BY ISLAND, Lanzarote 25% Tenerife Gran Canaria 2% 6% Lanzarote 6% Gran Canaria 12% Tenerife 1% Tenerife 8% Fuerteventura 32% Fuerteventura 67% Fuerteventura 81% Gran Canaria 48% Lanzarote 12% Source: Ministerio de educacion, politica y deporte, Spain The passage is extremely risky due to the rough sea, the long distance and the fragile boats used by migrants. The survivors landing in the Canary Islands wait to be detected by the Spanish authorities and then to be transported and sheltered on the mainland. In the absence of bilateral agreements with the countries of origin or when the nationality cannot be ascertained, migrants receive an order compelling them to leave the country and are then released. Southern Spain, including Ceuta and Melilla These routes are used mainly by North and West Africans. The latter cross the Sahara en route to Morocco. The risks and number of deaths during this leg of the journey are commensurate to the size and harshness of the desert. The Spanish land and sea borders to Ceuta, Melilla and Andalusia are strictly controlled by the authorities. A 6-foot fence has been installed around Ceuta and Melilla - two Spanish enclaves in Morocco - and a radar system that covers the Strait of Gibraltar easily detects boats leaving the Moroccan coast. Algerians manage to enter Ceuta and Melilla by making use of forged Moroccan documents. 47 Sub- Saharan Africans try to clandestinely cross the fence, but few people succeed and it appears these attempts occur in a rather disorganized manner. 48 Migrants camp in the areas beside the fence, waiting for a chance to take the final step into Europe. These spontaneous camps are in Mount Gourougou outside Melilla 49 and Mount Hacho and Mount Jebel Musa outside Ceuta. 50 Mass border crossing attempts have taken place in the last few years. 51 While smugglers play no role in the clandestine crossing of the fence, some Asian migrants have reported having paid smugglers to get into the EU, only to then be abandoned outside the fence. 52 In 2007, about 7,000 migrants reached Spain by crossing the Mediterranean sea from Morocco. Boats depart in the direction of Grenada and Almería or the Balearic islands. Small boats are used from the coast between Tangier and Rabat (Morocco) on the Atlantic coast to reach Cádiz (Spain). On the Mediterranean side of the Strait, the departure areas are Tétouan and Oued Laou (Morocco). Across the Alboran Sea, boats leave Morocco close to Melilla, and land in Grenada and Almería (Spain). 53 Migrants may camp near the departure points while the trip is being prepared. Smugglers drop the migrants off 100 meters or more from the Spanish shores to minimize the risk of interception. While the sea smugglers return to Morocco, migrants may either meet the smuggling receiving team in Spain or simply be left on their own to continue inland. 54 Southern Italy and Malta Although drastically reduced in the second half of 2009, the most prominent migrant smuggling routes from Africa to Europe in recent years have been those destined for the Italian islands of Lampedusa, Sicily and Sardinia. Many of these migrants inadvertently find themselves, however, arriving in Malta. In 2008, some 37,000 migrants arrived in 82 TRANSNATIONAL ORGANIZED CRIME THREAT ASSESSMENT
89 3 FIG. 80: ORIGIN OF IRREGULAR MI- GRANTS ARRIVING IN ITALY BY SEA, BY SUBREGION, 2008 FIG. 81: SHARE OF IRREGULAR MIGRANTS ARRIVING IN ITALY BY SEA, BY AREA OF LANDING, 2008 East Africa 27% Others 3% North Africa 40% Lampedusa 83% Sicily (excluding Lampedusa) 11% Sardinia 4% Calabria 2% Puglia 0% West Africa 30% Source: Ministero Interni, Italy Source: Ministero Interni - Italy Italy by sea. Africans from the Maghreb, Egypt, the Horn of Africa and West Africa are crossing this part of the Mediterranean, embarking mainly from the Libyan coasts. As a result of greater enforcement efforts at departure points, the sea route from Alexandria (Egypt) to Italy almost disappeared in 2008/2009. This route used to involve large fishing boats carrying more than a hundred migrants. The migrants were embarked and disembarked in open sea, using small boats. 55 In the Libyan Arab Jamahiriya, departure points are mainly Zuwara, Zliten, Misratah and Tripoli. Smugglers embark migrants in fibreglass boats and give them instructions on how to reach Lampedusa. They do not board with the migrants. Keeping the compass on 0:0, it should take some six to seven hours to cover the 260 kilometres between the Libyan Arab Jamahiriya and Lampedusa. If the migrants miss Lampedusa, they should reach Sicily in 12 hours or more. Although the sea journey is relatively short, the fragile boats and the weather conditions result in the death of many of these migrants. 56 While departures from Tunisia have nowadays virtually disappeared, the number of migrants starting from Algeria and landing in Sardinia has increased in the last few years (800% growth from 2005), totalling 1,621 migrants in Algerian boats depart from the harbour and shores of Annaba. 58 The boats used are fishing boats containing people. 59 While some have hypothesized that mother ships are used on this route, this has never been proven. 60 On the contrary, according to Algerian accounts, 61 most of the attempts are carried out in a rather disorganized manner, with little or no involvement of smugglers or smuggling organizations. Migrants using this route are mainly young Algerian males, 62 and the distance separating Annaba from the southern coast of Sardinia is no more than 355 kilometres. Eastern Greece Most of the migrants who use the Greece-Turkey route are Asians. However, Somali migrants have been increasingly entering the EU from Turkey, and in 2007, they were the second largest national group among the migrants apprehended at the Greek sea border. Migrants depart from Turkey to land on the Greek islands of Samos, Chios and Lesbos, just 1.5 kilometres from the Turkish coast. The land route used by Somalis to reach Turkey has not been documented. Some have hypothesized that the passage to the Greek islands is the final leg of a journey that started by crossing the Gulf of Aden to Yemen, across the Arabian Peninsula, to the Syrian Arab Republic and then to Turkey. 63 It is known that a large number of Somalis enter Yemen irregularly by sea. On the other hand, it is possible that Somalis follow the above-mentioned East African route across Ethiopia and the Sudan to Egypt. Palestinians and Egyptians are among the largest communities of Case studies of transnational threats 83
90 SMUGGLING OF MIGRANTS FIG. 82: 3,500 3,000 2,500 2,000 1,500 1, migrants arriving on the Greek islands, and it appears that Somalis are starting to follow. Once in Greece, Somalis would be assisted and granted asylum or expelled. If expelled, in the absence of repatriation agreements, they would be released with an order to leave the country. TOP FIVE ORIGINS OF IRREGULAR MIGRANTS ARRIVING AT THE GREEK SEA BORDER, Source: Greek Ministry of the Merchant Marine Who are the smugglers? Afghanistan Iraq Palestine Somalia Egypt Migrants receive various kinds of assistance from diverse groups of people along their journey, although it would be difficult to describe many of the helpers as organized crime figures. Some attempts appear to be entirely self-directed, including the efforts of Algerian young men to reach Italy by sea, 64 although Algerian migrants may also pay professional criminals for forged papers to enter Ceuta and Melilla. To cross the Sahara desert clandestinely requires professional assistance, 65 and others who manage and broker services to migrants at the hubs may be full-time criminals. For example, in Saguia El Hamra, about 20 wellorganized smuggling groups were providing passage to the Canary Islands in These groups purchased pateras from central Morocco for the sole purpose of carrying migrants for around 3,000. For each vessel that arrived, they earned about 7,000. Each group was provided protection by its own law enforcement connections, and maintained recruitment operations in Rabat and Casablanca. Similarly structured groups have been found to operate in Mali, Mauritania and Senegal. 66 Moroccan organizations have a monopoly on the passage across the Alboran Sea and the Strait of Gibraltar into the south of Spain, as well as the document forgery operations aimed at gaining admission to Ceuta and Melilla. 67 These groups employ a wide range of actors out of necessity. They may have links to receiving groups on the Spanish mainland, and even with Spanish employers in need of cheap labour. 68 The situation is quite similar in the Libyan Arab Jamahiriya. The large number of migrants departing from that country is transported by organized smuggling rings located in the main points of departure, such as Zuwara, Zliten and others. Italian authorities indicate that at least five Libyan groups are active in Zuwara alone. 69 Libyan groups may use Egyptian or Tunisian sailors, if sailors are used at all. 70 At Laayoune, the boats used are bought for the purpose of migrant smuggling. They are quite cheap ( 5,000) and can carry some migrants. The sea leg costs about 2,000 per migrant, making the passage extremely profitable for the smugglers. 71 Libyan groups may be connected with other smuggling rings operating along routes from West and East Africa. There are indications of small regional networks, such as those connecting groups based in the main points of departure with those operating along the desert routes of the Sudan and Chad and in the hub of Kufra (Libyan Arab Jamahiriya). 72 Gao and Agadez are two important hubs for all of West Africa. Smugglers here work differently than those on the coasts. They act as brokers, providing all types of migration services, from forged documents to desert transportation. Truck drivers or passeur are traditionally Tuareg who know the desert and its harsh conditions. The brokers may be Tuareg, but the Tuareg mainly seem to be used as service providers, navigating the sands as far as Morocco or the Libyan Arab Jamahiriya. Addis Ababa plays a similar role for the East African route. Agents or brokers work with different types of migrants, according to ethno-linguistic or tribal ties. The broker is known by reputation among the community of reference, and is the best guarantee for the longevity of the business. 73 Again, documents or merely passage can be purchased. 74 As Tuareg are used in West Africa, other nomadic groups are used in the East. As is true everywhere, the migration business sees a lot of individuals at the disposal of the brokers on a part-time basis. While these people are not truly members of a smuggling group, the broker can rely on them when needed. 75 Smuggler networks on the Turkish coasts (en route to Samos and Lesbos) are also structured organiza- 84 TRANSNATIONAL ORGANIZED CRIME THREAT ASSESSMENT
91 3 tions. 76 Based at departure points, these groups are in contact with intermediaries at transit stations. The smugglers operating in the Middle Eastern transit points to Turkey are local agents or brokers. These agents take responsibility for different legs of the immigrants journey. As seen for the other routes, these networks are characterized by national, ethnic, kinship or friendship connections. 77 How big is the flow? Almost all irregular migrants arriving in Spain, Italy and Malta by sea are Africans. Arrivals in Spain by sea are mainly concentrated in the Canary Islands, the Strait of Gibraltar and the Alboran Sea. When migrants arrive on the Canary Islands, almost all are apprehended since they rely on the lack of repatriation facilities to be released on the Spanish mainland. When migrants arrive on the Spanish mainland, some prefer to escape rather than face processing. Apprehensions at the Spanish sea border peaked in 2006 with about 40,000 detected migrants, mostly in the Canaries. In 2008, only 14,000 apprehensions were recorded. African migrants arriving in Lampedusa do not want to remain there. Therefore, they ensure that they are detected in order to be transported to mainland Italy. Border apprehensions along the Italian coasts peaked in 2008 with about 36,000 migrants intercepted, mostly in Lampedusa and Sicily. In addition, arrivals on the coasts of Malta totalled about 1,200 in 2007 and 2,500 in It is likely that all irregular migrants here are apprehended. Additionally, a few hundred East Africans and Egyptians (about 1,000 in total) land in Greece. Thus, the total number of African migrants apprehended at sea borders with the European Union in 2008 was likely between 52,000 and 54, Since most of these migrants wish to be detected, these numbers are close to the number of migrants that paid to be smuggled. But not all the migrants who pay smugglers survive the trip. An estimated 1,000 migrants died or disappeared in Also, a number of migrants arriving in mainland Spain may wish to avoid detection. The Spanish authorities intercept at least 86% of the boats detected through their Electronic Surveillance System, so perhaps some 750 migrants entered Spain undetected in Finally, an unknown number of migrants may enter Ceuta and Melilla by making use of forged documents. All told, it can be estimated that about 55,000 migrants paid to be smuggled to Europe in FIG. 83: 40,000 35,000 30,000 25,000 20,000 15,000 10,000 5,000 0 FIG. 84: 40,000 35,000 30,000 25,000 20,000 15,000 10,000 5,000 0 INTERCEPTION POINTS FOR MIGRANTS APPREHENDED AT THE SPANISH SEA BORDER, Strait of Gibraltar/Alborean Sea Source: Ministerio asunto sociales, Spain Canary Islands INTERCEPTION POINTS FOR MIGRANTS APPREHENDED AT THE ITALIAN SEA BORDER, Sicily (including Lampedusa) Sardinia Rest of Italy Source: Ministero degl Interni, Italy The amount they paid varies depending on the services required. The cost of the sea journey to either the Canary Islands or Lampedusa is in the range of 1,500 to 2,000. Since most migrants purchase this service, coastal smugglers may earn in the region of US$ million per year. For sub-saharan migrants, it is often necessary to purchase passage across the desert as well. Although the prices cited for this service vary widely, it is unlikely that total revenues exceed US$10 million annually. In sum, smugglers moving migrants from Africa to Europe probably grossed about US$150 million in Case studies of transnational threats 85
92 SMUGGLING OF MIGRANTS 70,000 60,000 50,000 FIG. 85: NUMBER OF AFRICAN MIGRANTS AP- PREHENDED IN SPAIN, ITALY, MALTA AND GREECE AT SEA BORDERS, declined 74% between 2008 and 2009, with not a single landing recorded in Lampedusa in the last three months of the year. This sharp decline appears to have displaced some of the flow to the eastern coasts of Italy (Apulia and East Sicily) and possibly to Greece. The overall effect will only be determined as 2009 data become available for all affected regions. 40,000 30,000 20,000 10, Source: UNODC elaboration of official figures FIG. 86: MIGRANTS APPREHENDED IN SPAIN AND ITALY AT SEA BORDERS, ,000 50,000 40,000 Strait of Gibraltar/Alborean Sea Canary Islands Sicily (including Lampedusa) Sardinia Rest of Italy 30,000 20,000 10, Source: UNODC elaboration of official figures The trend for this market has been generally upward since In terms of specific routes, the trends have been mixed. Many former routes, such as the use of Gibraltar and Tunisia, have all but disappeared. Arrivals in Spain increased steadily, with a peak in 2006, then sharply decreased in 2007 and Compensating for these decreases, arrivals in Italy increased in 2008 and the first half of Cooperative agreements between Italy and the Libyan Arab Jamahiriya signed in May 2009 appear to have had an impact. The number of migrants detected in Italy was steadily rising until May, at which point they abruptly declined. Overall, the number of detections along Italian sea borders 86 TRANSNATIONAL ORGANIZED CRIME THREAT ASSESSMENT
93 3 IMPLICATIONS FOR RESPONSE Smuggling of migrants is largely an opportunistic crime. This is best seen in Africa, where the routes have shifted so much over time that it is difficult for any smuggling organization to have much longevity. This means efforts directed at the smuggling groups are unlikely to have much effect, aside from perhaps diverting the flow once again. The hopes and dreams of the migrants themselves are driving this market. The smugglers are merely a parasitic infection, but one that is difficult to avoid. What does seem to have had impact in stemming the tide on both sides of the Atlantic is the perception of declining opportunity. People will not pay to be smuggled unless there are good prospects of making this money back. The key to preventing smuggling, then, is to send the signal to migrants that it is not worth the expense and risk. The same signal must be sent to the other end of the trafficking chain. Migrants who are willing to be packed shoulder to shoulder on a leaking wreck and launched onto the open sea are not likely to be deterred by a stern official and a written order to depart. Their employers, on the other hand, have considerably more to lose if they are caught in breach of the law, but only if that law is enforced. They could be deemed complicit in migrant smuggling, or in operating a criminal enterprise, if prosecutors were so inclined. It would not take more than a few forfeitures to erode the competitive advantage of exploiting foreign labour. Case studies of transnational threats 87
94
95 4 COCAINE
96
97 4 COCAINE Cocaine comprises at least two distinct drug products: powder cocaine on the one hand, and a range of cocaine base products, mostly falling under the heading of crack, on the other. Powder cocaine is a milder drug generally snorted by the wealthy, 1 while crack and other base products present an intense high favoured by the poorer users. Chemically, the substance consumed is the same, but the addition of baking soda and heat allows powder cocaine to be smoked, a far more direct method of ingestion. Both products are derived from a plant cultivated on some 170,000 hectares in remote areas of Colombia, Peru and the Plurinational State of Bolivia. From there, cocaine is distributed to at least 174 countries around the world. This chapter is about how this is done, focusing on the two largest destination markets: North America and Europe. The coca plant is indigenous to Peru and the Plurinational State of Bolivia, and these two countries produced most of the world s coca leaf from the 1960s until the mid-1990s. In the 1970s, Colombian traffickers were still exporting cannabis, at one point supplying 70% of the US market. 2 But just as they began to lose market shares to cannabis produced closer to the consumers, the cocaine market began to boom, and they were well-positioned to make the transition. Colombia emerged as the world s largest producer of cocaine as of the late 1970s. Initially, Colombian traffickers limited their role to cocaine processing and transportation, leaving the cultivation to farmers in the Plurinational State of Bolivia and Peru. This required large-scale transnational trafficking of coca paste. After the demise of the large Colombian drug cartels and the successful interruption of flights from Peru in the first half of the 1990s, Colombian traffickers began to organize coca cultivation in their own country, and Colombia emerged as the world s largest coca leaf producer as of Following large-scale eradication efforts, the Colombian authorities succeeded in reducing the area under coca cultivation by 50% between 2000 and Despite such decreases, Colombia remains, however, the single largest cultivator. In 2008, global cocaine supply declined to 845 metric tons, down from 994 tons a year earlier, equivalent to a fall of 15%. This was primarily a reflection of a strong decline in cocaine production in Colombia, more than offsetting the increases reported from Peru and the Plurinational State of Bolivia. Colombia accounted for about half of global cocaine production in 2008 (430 tons), followed by Peru (302 tons) and the Plurinational State of Bolivia (113 tons). 3 The value of the global cocaine market peaked during the US epidemic of the 1990s, and it has declined considerably since that time. But use of the drug has spread to many more countries, and over the last decade, use has doubled in the high-value European market. In 1980, cocaine seizures were reported by 44 countries and territories worldwide. FIG. 87: GLOBAL COCA BUSH CULTIVATION, Hectares 250, , , , , , , , , , , , ,600 81,000 50,000 50,300 43,400 38,700 56, ,100 38,000 14,600 30, Colombia Peru Bolivia Total Source: UNODC, World Drug Report 2009 Case studies of transnational threats 91
98 COCAINE This number almost tripled to 130 countries and territories in 2007/2008. In 2007/2008, cocaine was used by 16 to 17 million people worldwide (broad range:15-22 million), which is similar to the number of global opiate users. Most of the cocaine users are in North America (about 6.2 million users in 2008) and in Europe (about 4.5 million users in 2007/2008) 4 most of whom are concentrated in the EU and EFTA countries (4.1 million). North America accounts for more than 40% of global cocaine consumption (the total is estimated at around 470 tons); whereas the 27 EU and four EFTA countries were responsible for more than a quarter of global cocaine consumption. These two regions comprise more than 80% of the value of the global cocaine market, estimated at US$88 billion in Despite declines in cultivation area, cocaine production has been largely stable since the mid-1990s (between 800 and 1,000 tons). Improved coca leaf yields and improvements in the techniques used to extract the drug are believed to have offset declines in the area under coca cultivation. In the face of a declining US market, the need to find buyers for this constant supply may have been a factor in its proliferation. Though the days of the big Colombian drug cartels are gone, international cocaine trafficking is still far more organized and large-scale in nature than trafficking of most other drugs, as reflected in the size of cocaine shipments. The average cocaine seizure is 10 to 20 times larger than the average heroin seizure. 5 Several multi-ton cocaine seizures are made every year, a quantity unheard of in heroin markets. This suggests either very well-resourced organizations or cooperation between smaller organizations which reflects a high level of organizational maturity. After more than 40 years of trafficking drugs, this is not surprising. Trafficking to developing countries the case of the Southern Cone The third largest consumer market for cocaine is South America, home to some 2.4 million users. Most of this market is concentrated in the Southern Cone, and most of it emerged only recently. Due to its population size, the greatest number of users (nearly 1 million) is found in Brazil, but the problem is most intense in Argentina, where an estimated 2.6% of the adult population used the drug in 2006, about the same as the United States. This figure has increased markedly since 1999, when it was just 1.9%. School surveys conducted in Argentina, Chile, Ecuador, Peru, the Plurinational State of Bolivia and Uruguay found the share of students who had used cocaine in their lifetime increased from 1% in 2001 to 2.2% in 2005 and 2.7% in i The growth of cocaine consumption in the Southern Cone appears to be linked to production increases in both the Plurinational State of Bolivia and Peru. In particular, the Plurinational State of Bolivia used to be a supplier of coca paste to Colombian refiners, but enhanced control over air traffic and growing production within Colombia seem to have broken this link. This left Bolivian cultivators - who had little experience in refining or trafficking cocaine and poor access to precursor chemicals - in search of a new market for their products. Brazilian traffickers were quick to take advantage of this directionless supply. It may be that coca paste was first moved into the Southern Cone solely for further refinement, but there soon emerged a market, often in startlingly poor communities, for cocaine base itself, consumed as merla in Brazil and paco in Argentina. These products are similar to crack, but with greater impurities, as they emerge earlier in the refining process. At the same time, cocaine hydrochloride, which was increasingly transiting the region on its way to growing markets in Europe, also found buyers among the most affluent. Cocaine demand is declining in North America and appears to be peaking in Europe, while supply remains essentially unchanged. The targeting of markets in the developing economies of South America represents a disturbing trend, as these countries have fewer resources to combat the negative effects cocaine can have on health and violent crime. i UNODC and CICAD, Informe subregional sobre uso de drogas en población escolarizada. Lima, TRANSNATIONAL ORGANIZED CRIME THREAT ASSESSMENT

99 4 FIG. 88: GLOBAL OVERVIEW OF THE PROBLEM: GLOBAL COCAINE FLOWS, 1998 AND Canada 63 Europe 267 USA Mexico 9 Caribbean Atlantic and Western Caribbean Pacific Main cocaine producers ANDEAN REGION Cocaine trafficking* (in metric tons) *main routes Cocaine consumption (in metric tons) Canada 124 Europe 165 USA Mexico 17 Caribbean Pacific B.R. of Venezuela West Africa ANDEAN REGION Brazil UNODC / SCIENCES PO Southern Africa Source: UNODC World Drug Report, 2009 and UNODC calculations, informed by US ONDCP, Cocaine Consumption Estimates Methodology, September 2008 (internal paper). Case studies of transnational threats 93
100
101
102 COCAINE FIG. 89: What is the nature of this market? The largest regional cocaine market worldwide is North America. With close to 6.2 million annual users, it accounts for 36% of the global user population, most of whom are found in the USA. The USA remains the single largest national cocaine market in the world, but this market has been in decline over the last three decades. In 1982, an estimated 10.5 million people in the US had used cocaine in the previous year. 6 By 2008, this number had fallen to 5.3 million. In other words, over a 25-year period, the cocaine trade has had to adjust to a loss of 50% of users in its largest market. This decline in demand has been particularly strong since In that year 2.5% of the US population aged 12 and above was estimated to have used cocaine in the previous year. This figure dropped to 2.3% in 2007 and 2.1% in Similar trends can be seen in school survey data, where a declining share of young people is using the drug (down 40% from 2006 to 2009), and a growing share is saying it is difficult to find cocaine. Still, the 2009 US Drug Threat Assessment states that Cocaine trafficking is the leading drug threat to the United States. 8 A recent decline has also been seen in Canada, from 1.9% in 2004 to 1.5% of the population aged 15 and above in In Mexico, household surveys showed an increase in cocaine use from 0.35% in 2002 of the population aged to close to 0.6% in However, results from a survey in Mexico City in 2006 suggest that this net increase may have POSITIVE TESTS FOR COCAINE USE AMONG THE US WORKFORCE, been due to a rapid rise between 2002 and 2006, with a decline since that time. This sudden drop in overall cocaine popularity in North America can also be demonstrated by US forensic data. The share of the US workforce that tests positive for cocaine use, as detected by urine analysis, shows a 58% decline between 2006 and the first two quarters of Some 6 million people undergo these tests; a much larger sample than in the household surveys. The long-term decline of cocaine use in the USA over the period has been attributed to a number of causes, including social learning leading to a decline in demand. Crack cocaine became a highly stigmatized drug in the second half of the 1980s, and powder cocaine use also became less fashionable. The more recent decline since 2006 appears to have been supply-driven. An analysis of prices and use rates suggests that it was caused by a severe cocaine shortage, reflected in rapidly falling purity levels and a consequent rise in the cost per unit of pure cocaine, doubling over the period. Past shortages have been linked to interdiction efforts, but the market has generally recovered, typically after about six months. This time, recovery seems to have taken much longer, and price declines in 2009 were not enough to recover lost demand. 10 One reason may be the sheer scale of the disruption: in 2007, five of the 20 largest individual cocaine seizures ever made were recorded, including the very largest (24 tons in Mexico). 11 Inter-cartel violence in Mexico also seems to have seriously undermined the market. Finally, recent declines in cocaine production in Colombia, the main supplier to the US market, also seem to have played a role. General US w orkforce Federally mandated, safety-sensitive w orkforce % % * *Positive tests for cocaine use among the general US workforce (5.7 million tests in 2008) and among the federally mandated, safety-sensitive workforce (1.6 million tests in 2008). Data for 2009 refer to the first two quarters only. Source: Quest Diagnostics, Drug Testing Index How is the trafficking conducted? The bulk of the cocaine that enters the United States comes from Colombia. Forensic analyses of cocaine seized or purchased in the USA have repeatedly shown that nearly 90% of the samples originated in Colombia. 12 Peru is a lesser supplier, and the Plurinational State of Bolivia appears to have basically lost contact with the North American market. The routes and means of conveyance by which cocaine is moved from South America to North America have varied over time, partly in response to enforcement efforts and partly due to changes in the groups doing the trafficking. In the 1970s, Colombian traffickers, often employing US veter- 96 TRANSNATIONAL ORGANIZED CRIME THREAT ASSESSMENT
103 4 FIG. 90: AVERAGE OF ALL COCAINE PURCHASE PRICES IN THE USA, JANUARY 2006-JUNE Prices in US$ per gram Purity in % Qtr 2 Qtr 3 Qtr 4 Qtr 1 Qtr 2 Qtr 3 Qtr 4 Qtr 1 Qtr 2 Qtr 3 Qtr 4 Qtr 1 Qtr 2 Qtr Purity adjusted prices Unadjusted prices Purity (in %) Purity adjusted prices Unadjusted prices Purity (in %) Source: US Drug Enforcement Agency, based on STRIDE data, quoted in DEA Intelligence Division, Cocaine Shortages in U.S. Markets, November 2009 ans as pilots, flew cocaine to the US, initially directly and later via the Caribbean. Once strict radar surveillance made flights more difficult, a combination of air drops and maritime smuggling became popular, with the Caribbean still favoured. The Colombians formed relationships with Cubans in the USA and later with Dominicans, paying them in kind rather than in cash, establishing in the process a Cuban and a Dominican wholesaling and retailing network that persists in Florida (Cubans) and in the north-east of the country (Dominicans) to this day. Increased enforcement in the Caribbean in the 1980s and the 1990s pushed the drug flow further westward, and Mexican traffickers became involved. A combination of maritime routes to Mexico with a land border crossing in the USA came into fashion. The Mexican groups were paid to transport the drug across Mexico and the US border, turning it over to Colombian groups in the USA. Also paid in kind, the Mexicans had several advantages over other groups. While radar and other surveillance measures made it difficult to traffic drugs directly into the United States via air or sea, the Mexicans controlled the land border, which is much more difficult to police, given the massive licit trade between the two countries. The Mexican groups were very experienced in smuggling drugs into the US, having moved Mexican heroin and cannabis across the border since the 1930s, and in huge quantities since the 1970s. The size of their expatriate network in the US was also much larger. As the Mexicans strengthened their hold in the main destination country, the Colombian groups were under pressure at home. The dismantling of the large Colombian drug cartels in the first half of the 1990s and the extradition of major players to the US after further tilted the balance of power in favour of the Mexicans, since the Mexican Government was more reluctant to extradite at that time. 14 To avoid extradition, many Colombian groups moved out of direct trafficking to the USA. As a result, they were largely reduced to being suppliers to the emerging Mexican cartels. Today, cocaine is typically transported from Colombia to Mexico or Central America by sea (usually by Colombians) and then onwards by land to the United States and Canada (usually by Mexicans). The US authorities estimate that close to 90% of the cocaine entering the country crosses the US/ Mexico land border, most of it entering the state of Texas and, to a lesser extent, California and Arizona. According to US estimates, some 70% of the cocaine leaves Colombia via the Pacific, 20% via Case studies of transnational threats 97
104 COCAINE the Atlantic, and 10% via the Bolivarian Republic of Venezuela and the Caribbean. 15 Direct cocaine shipments from Colombia to Mexico have been moved by a wide variety of marine craft over years, recently including self-propelled semisubmersibles often transporting several tons of cocaine (typically between 2 and 9 tons). In 2008, 29.5 tons of cocaine were seized by the Colombian navy on board semi-submersibles in the Pacific Ocean, equivalent to 46% of all seizures made at sea by the Colombian authorities in the Pacific (64.5 tons). A few of these vessels have been detected on the Atlantic side as well. The Colombian Government reported seizing 198 tons of cocaine in 2008, of which 58% took place in the Pacific Region (departments of Choco, Valle and Nariño) and 31% took place in the Atlantic Region (departments of Guajira, Cordoba, Bolivar and Antioquia). 16 A large and growing share of the Colombian maritime seizures are made in the Pacific. The share of Colombian seizures made on land increased dramatically in 2008, largely due to overland shipments to the Bolivarian Republic of Venezuela. According to Colombian, US and European sources, that country has become a more prominent trans-shipment location for cocaine destined for Europe and the USA in recent years. The cocaine transiting the Bolivarian Republic of Venezuela frequently departs from locations close to the Colombian border, and makes landfall in the Dominican Republic or Honduras en route to the USA. The importance of the Central American countries as trans-shipment locations has increased in recent years. In 1985, negligible amounts of cocaine were seized in Central America, but in recent years the region has outpaced even Mexico. Most of this cocaine is destined for Mexico and the USA, but some heads for Europe or is consumed locally. Who are the traffickers? One study, analysing data from the late 1990s, suggested that there are at least seven layers of actors between a coca farmer in the Andean countries and the final consumer in the USA: 17 Step 1: The farmer sells the coca leaf (or his self-produced coca paste) to a cocaine base laboratory, operated by the farmers themselves or by various criminal trafficking groups. Sometimes these labs have the capacity to refine the drug further into cocaine hydrochloride. Step 2: The cocaine base (or the cocaine hydrochloride) is sold to a local trafficking organization, which transports and sells the cocaine to a transnational drug trafficking organization. Step 3: The drug trafficking organization contracts yet another group to do the actual shipping. Step 4: The cocaine is shipped to Mexican traffickers. Step 5: The Mexican traffickers transport the drug across the US border to wholesalers. Step 6: The wholesalers sell the cocaine to local mid-level dealers or street dealers across the USA. Step 7: The street dealers sell the cocaine to the consumer. Following the dismantling of the Medellin and Cali cartels in the early 1990s, the Colombian organized FIG. 91: DISTRIBUTION OF COCAINE SEIZURES MADE IN CENTRAL AMERICA, THE CARIBBEAN AND MEXICO, % 75% Mexico Central America Caribbean 50% 25% 0% Source: UNODC, Annual Reports Questionnaire Data / DELTA 98 TRANSNATIONAL ORGANIZED CRIME THREAT ASSESSMENT
105 FIG. 92: Source: Ministerio del Interior y de Justicia, República de Colombia, La Extradición Naturaleza y Procedimiento, presentation given to the UNODC expert group meeting: The evidence base for drug control in Colombia: lessons learned, Bogota, 9-10 November crime groups got smaller, and market competition increased, pushing prices down. After the Colombian Congress amended the Constitution in 1997 to allow the extradition of citizens, 18 Colombian groups were largely relegated to the front end of the market chain (steps 1 to 4). Despite these precautions, the number of extraditions continues to grow. Better controls, first for direct flights from Colombia to the USA (starting in the 1980s), and later improved control over shipping in the Caribbean (in the 1990s) also reduced the ability of the Colombian organized crime groups to traffic cocaine directly to the United States. FIG. 93: Hondurians 1% Colombians 2% Dominican Rep. 3% Mexicans 13% Cubans 1% NUMBER OF EXTRADITIONS OF PERSONS FROM COLOM- BIA, CITIZENSHIP OF FEDERAL COCAINE ARRESTEES IN THE USA, 2008 Jamaicans 0% Canadians 0% Other 5% Source: UNODC, Annual Reports Questionnaire Data US citizens 75% The displacement of non-mexican groups continues in the US market. By 2008, Mexican organized crime groups were found in 230 US cities (up from 100 cities three years earlier) while Colombian groups controlled illicit cocaine and heroin distribution channels in only 40 cities, mostly in the north-east. In addition, criminal groups from Caribbean countries are also involved in cocaine trafficking, notably groups with links to the Dominican Republic. Dominican organized crime groups have been identified in at least 54 cities. They operate mainly in locations along the east coast, including in New York/New Jersey, the New England and Mid-Atlantic regions, as well as in Florida. In addition, USbased Cuban organized crime groups pose a threat, because of their affiliations to drug traffickers in Peru, the Bolivarian Republic of Venezuela and Colombia. They were identified to operate distribution networks in at least 25 US cities. 19 How big is the flow? One comprehensive attempt to gauge the size the US cocaine market was produced by the Office of National Drug Control Policy (ONDCP) in Entitled What America s Users Spend on Illegal Drugs, the report estimated the number of chronic and occasional cocaine users, and multiplied these numbers with a per capita expenditure estimate, derived from interviews with arrested persons who had used drugs. Based on these dollar amounts, the actual amounts consumed could be calculated. Simply extending these trends, using the annual prevalence level from the national drug use survey data, would produce a total cocaine demand of 231 tons for But this simple extension may not sufficiently capture the recent dramatic declines in cocaine use. Revisiting these calculations and making use of new data, 20 it is possible to generate an estimate of 2.3 million chronic users and just under 3 million casual users in the USA 21 in It is also possible to derive a new consumption estimate of 31 grams of pure cocaine per average user per year, 22 resulting in an estimate of 165 tons total consumption for the year A simplified new model, proposed by ONDCP, applies different use rates to annual consumers who used cocaine in the month of the survey and those who did not. 23 Applying this technique delivers a consumption range of between 140 and 164 tons or Case studies of transnational threats 99
106 COCAINE FIG. 94: ESTIMATES OF COCAINE CONSUMPTION IN THE USA, cocaine consumed update, based on chronic use, annual prevalence and trend estimates on per capita use update, based on annual prevalence and 1998 per capita use update, based on annual and past month prevalence and ONDCP model update, based on annual and past month prevalence, ONDCP model and either crack or cocaine HCL use metric tons Sources: Multiple sources 25 Based on these estimates, ranging from 140 to 231 tons, UNODC s best estimate is 165 tons in This total is very similar to that produced by another study using a different methodology, which estimated 2008 cocaine demand in the USA at less than 175 tons. 26 Using the simplified ONDCP model, a consumption estimate of 17 tons for Mexico and 14 tons for Canada can be calculated for the year Thus the best estimate of the demand for cocaine in North America is 196 tons for the year 2008, with a range from 171 to 262 tons. How much cocaine must leave South America to satisfy this demand? Factoring in purity-adjusted seizures along the route, it appears that some 309 tons of cocaine left South America for the North American market in This represents 51% of total production after purity-adjusted seizures in FIG. 95: COCAINE DEMAND (CONSUMPTION AND SEIZURES), NORTH AMERICA, Purity adjusted seizures in the Caribbean Purity adjusted cocaine seizures in Central America Purity adjusted seizures in North America Cocaine consumption in North America Supply requirements for meeting total demand for cocaine in North America metric tons Sources: Multiple sources TRANSNATIONAL ORGANIZED CRIME THREAT ASSESSMENT
107 4 FIG. 96: COCAINE PRODUCTION AND DEMAND FOR COCAINE, NORTH AMERICA, metric tons 1, , Andean cocaine production Cocaine for consumption in the Andeans and exports Consumption North America Seizures North America Cocaine seizures in Central America and Carribean North American demand Sources: Multiple sources 28 the three Andean countries. The share of all cocaine production destined for North America is down from around 60% in Some of the decline in 2008 can be explained in terms of declining production in Colombia, the dominant supplier of the drug to North America. However, the decline of consumption in North America was even more pronounced than the decline in total cocaine availability in the Andean region. Interdiction in Mexico and Central America appears to have played an important role. Based on this flow model, it is possible to estimate the value of the market at each point in the trafficking chain. Returning again to the original ONDCP calculations, an extension of this series using updated price data suggests a drastic reduction in value for the US market, from almost US$134 billion in 1988 (expressed in constant 2008 US dollars) to FIG. 97: VALUE OF THE US COCAINE MARKET (IN CONSTANT 2008 US DOLLARS), billion US$ constant US$ (based on ONDCP price data until 2007 and DEA data for 2008) 2000 constant US$ (original data-set) 2008 constant US$ (based on ONDCP prices until 2006 and DEA price trends ) Sources: Multiple sources 29 Case studies of transnational threats 101
108 COCAINE FIG. 98: VALUE OF COCAINE MARKET IN NORTH AMERICA (IN BILLIONS OF CONSTANT 2008 US$), billion US$ (constant 2008) Mexico Canada USA North America Sources: Multiple sources 30 US$ 44 billion in 1998 and US$35 billion in This decline is a result of the long-term trend; the recent sharp decline of cocaine supply to the USA has not resulted in a corresponding decline in value because the falling supply of cocaine went hand in hand with rising (purity-adjusted) cocaine prices. Using similar methods, the value of the Canadian cocaine market can be estimated at around US$2.4 billion and the Mexican market at around US$300 million for the year The analysis suggests that the total North American cocaine market declined from some US$47 billion in 1998 to US$38 billion in 2008, reflecting lower quantities and lower prices. Between 2006 and 2008, the market, in dollar terms, remained basically stable. Who benefits most from this flow? Using price data and volumes for each point in the trafficking chain, the value accruing to each market player can be estimated. Based on the volume and price data collected by UNODC in the Andean countries during the annual illicit crop surveys, the coca farmers in the three Andean countries earned about US$1.1 billion in 2008, down from US$1.5 billion in About 50% of the farmers income came from coca production for the North American market. In other words, the share of the Andean farmers in total North American cocaine sales amounted to just 1.5% in The amounts generated from processing and trafficking activities within the Andean countries for cocaine destined to be shipped towards North America amounted to around US$400 million, or around 1% of the total cocaine business. Some 309 tons of cocaine left the Andean region for destinations in North America in Deducting seizures, some 208 tons arrived in the hands of the Mexican cartels. Most of the trafficking from Colombia to Mexico remained, however, in the hands of Colombian groups. At a wholesale price of US$12,500 per kilogram (US$ 15,625 per kilogram if purity adjusted), the value of the cocaine in Mexico amounted to US$3.3 billion. With a purchase price of just under one billion dollars in Colombia, the total gross profits 32 accruing to those importing cocaine to Mexico can be estimated at around US$2.4 billion (excluding costs of shipping). Given the current price structure, the seizures made by the Colombian and Peruvian navies, the Central American and Caribbean countries and the Mexican authorities would have to increase by more than 150% to eliminate the profitability of importing cocaine to Mexico. The next key step is to ship the cocaine from Mexico into the USA. This operation is primarily undertaken by the Mexican drug cartels. Taking seizures, 102 TRANSNATIONAL ORGANIZED CRIME THREAT ASSESSMENT
109 4 domestic Mexican consumption, and purity into account, Mexican cartels moved some 191 tons of pure cocaine across the border to the United States in 2008, valued at US$3 billion. If all of this were sold to wholesalers in the USA, this would be worth US$6.4 billion. But border seizures reduced the amount available for sale to 178 tons in 2008, or US$5.8 billion. Deducting purchase costs, a gross profit of US$2.9 billion was generated that year moving the cocaine across the border into the USA. Most of these profits are reaped by the Mexican drug cartels. The largest profits, however, are generated within the USA: US$29.5 billion between the US wholesale level and US consumers. Out of these gross profits, the bulk is made between the mid-level dealers and the consumers, accounting for more than US$24 billion or 70% of the total size of the US cocaine market. Some Mexican cartel groups such as La Familia Michoacan are tapping into this highly lucrative market, but most appears to go to a large number of small domestic US groups, operating across the USA. FIG. 99: US-mid-level dealers to US-consumers, 70% (US$24.2 bn) DISTRIBUTION OF GROSS PROFITS (IN %) OF THE US$ 35 BILLION US COCAINE MARKET, 2008 Farmers in the Andean countries,1.5% (US$0.5 bn) Traffickers in the Andean countries,1% (US$0.4 bn) Source: Original calculations International traffickers, Colombia to US,13% (US$4.6 bn) US-wholesalers to USmid-level dealers,15% (US$5.3 bn) While retail sales were responsible for the largest share of the profits, they were also spread among a much larger number of actors. Estimates by the Institute for Defense Analyses on the number of persons involved in cocaine trafficking in the 1990s suggested that there were some 200 cocaine wholesalers in the USA and some 6,000 mid-level cocaine dealers. 33 This would give a ratio of 1:30, suggesting that the per capita gains in the last trafficking phase, from the mid-level dealers to the consumers, are actually much smaller than the per capita gains generated at the earlier phases of the trafficking chain. Case studies of transnational threats 103
110
111
112 COCAINE FIG. 100: What is the nature of this market? The 27 countries of the European Union 34 (EU) and the four countries of the European Free Trade Association 35 (EFTA) host the world s second largest cocaine market after North America. Nine out of ten of Europe s 4.1 million cocaine users are found in the EU/EFTA countries. The single largest cocaine market within Europe is the United Kingdom (1 million users in 2007/08), followed by Spain, Italy, Germany and France. The number of cocaine users in the EU/EFTA countries has doubled over the last decade, from 2 NATIONAL SHARES OF THE COCAINE USER POPULATION IN EUROPE, 2007/2008 EFTA countries, 2% Other EU countries, 13% France, 5% Germany, 9% Other European countries, 8% Italy, 19% Sources: Multiple sources 36 UK, 23% Spain, 21% million in 1998 to 4.1 million in 2007/08. Despite this increase, the cocaine prevalence rate in the EU-27 as well as in the EU-15 countries is still lower than in North America. Individual European countries, notably Spain (3.1% in 2007/08) and the UK (3.0% in 2008/09), have higher annual prevalence rates than the USA, however. But preliminary data suggest the rapid growth of the European cocaine market is beginning to level off. How is the trafficking conducted? Most of the trafficking of cocaine to Europe is by sea, often in container shipments, though deliveries by air and by postal services also occur. According to data from the World Customs Organization, 69% of the total volume of cocaine seized en route to Western Europe was detected on board boats or vessels, concealed in freight or in the vessels structure. While bulk shipments come by sea, a large number of smaller shipments are detected at airports and in the post. Most cocaine shipments to Europe are destined for one of two regional hubs: Spain and Portugal in the south and the Netherlands and Belgium in the north. The Iberian peninsula has cultural, linguistic and colonial ties to Latin America as well as a long and proximate sea coast. Parts of the Netherlands lie in the Caribbean (Aruba and the Netherlands Antilles) and Suriname in South America was a former Dutch colony. Rotterdam (Netherlands) and Antwerp (Belgium) are Europe s largest seaports. From these hubs, cocaine is distributed to the rest of FIG. 101: ANNUAL PREVALENCE OF COCAINE USE IN THE EU AND EFTA COUNTRIES, EU and EFTA 1.6% EU % EU % annual prevalence in % of popuation age % 0.8% 0.6% 0.4% 0.2% 0.0% 0.6% 0.7% 0.8% 0.9% 0.9% 1.0% 1.1% 1.1% 1.2% 1.2% 1.2% EU and EFTA 0.6% 0.7% 0.8% 0.9% 0.9% 1.0% 1.1% 1.1% 1.2% 1.2% 1.2% EU % 0.7% 0.8% 0.9% 0.9% 1.0% 1.1% 1.1% 1.2% 1.2% 1.2% EU % 0.8% 1.0% 1.1% 1.1% 1.2% 1.3% 1.4% 1.5% 1.5% 1.5% Sources: Multiple sources TRANSNATIONAL ORGANIZED CRIME THREAT ASSESSMENT
113 4 Europe. Between them, Spain, Portugal, the Netherlands and Belgium accounted for close to 70% of all cocaine seized in Europe in 2008, but less than one quarter of the cocaine use. Colombia remains the main source of the cocaine found in Europe, but direct shipments from Peru and the Plurinational State of Bolivia are far more common than in the US market. The relative importance of Colombia seems to be in decline. For example, in 2002, the UK authorities reported that 90% of the cocaine seized originated in Colombia, but by 2008, the figure fell to 65%. In a number of other European countries, Peru and the Plurinational State of Bolivia seem to be the primary source of cocaine. The routes taken to arrive in Europe have changed in recent years. Between 2004 and 2007, at least two distinct trans-shipment hubs emerged in West Africa: one centred on Guinea-Bissau and Guinea, and one centred in the Bight of Benin which spans from Ghana to Nigeria. Colombian traffickers transported cocaine by mother ship to the West African coast before offloading to smaller vessels. Some of this cocaine proceeded onward by sea to Spain and Portugal, but some was left as payment to West Africans for their assistance as much as 30% of the shipment. 39 The West Africans then trafficked this cocaine on their own behalf, largely by commercial air couriers. Shipments were also sent in modified small aircraft from the Bolivarian Republic of Venezuela to various West African destinations. Political turmoil in the northern hub and successful interdiction elsewhere appears to have dampened this transit route for the time being, although it could quickly re-emerge. The decline in trafficking, affecting in particular Lusophone Africa, may also be a reason why Portugal has seen a sharp decline in cocaine seizures between 2006 and 2008, following strong increases over the period. The Bolivarian Republic of Venezuela has also emerged as a key transit country for shipments to Europe, particularly for large maritime shipments. The single largest cocaine seizure in 2008 was 4.1 tons of cocaine seized from a commercial vessel coming from the Bolivarian Republic of Venezuela, and 2.5 tons were also seized on a fishing boat coming from that country. 40 According to the new Maritime Analysis Operation Centre (MAOC-N), more than half (51%) of all intercepted shipments in the Atlantic started their journey in the Bolivarian Republic of Venezuela. Direct shipments from Colombia, in contrast, accounted for just 5%. 41 FIG. 102: West Africa 11% Colombia 5% C aribbean 11% DEPARTURE LOCATIONS OF IDENTIFIED DRUG TRAF- FICKING SHIPMENTS BY SEA FROM SOUTH AMERICA TO EUROPE, Other 12% Brazil 10% Source: Maritime Analysis Operation Centre Venezuela 51% MAOC-N also reports that sailing vessels travelling from the Caribbean to Europe are the most common source of seizures, followed by freight vessels, and other motor vessels. 42 In contrast, semi-submersibles, which have gained strongly in importance in trafficking cocaine from Colombia to Mexico in recent years, do not as yet play any significant role in Europe only one has been sighted, in Galicia, northern Spain in Overall seizure data for Europe showed a strong increase of cocaine interceptions over the period, from 32 to 121 tons, followed by a significant decline over the period. Nonetheless, overall cocaine seizures in 2008 were almost twice as high as in By far the largest national seizures were reported by Spain, accounting for 45% of all European cocaine seizures made over the period. Not surprisingly, the Spanish figures reflect both the strong increase and the recent decline of cocaine seizures in Europe. These trends are also seen in Spanish survey data about the ease of obtaining cocaine in the country. 44 Two thirds of the seizures made by Spain in 2007 took place in international waters and a further 11% were made in containers. A much smaller share (2%) were made close to the country s beaches, whereas seizures at airports accounted for just 6% of all the cocaine seized. 45 Seizures made by the Portuguese authorities reflect the patterns seen in Spain. The increases until 2006 and the declines thereafter (from 34 tons in 2006 to 5 tons in 2008) were, however, even more pronounced. This seems to reflect the strong increases Case studies of transnational threats 107
114 COCAINE FIG. 103: COCAINE SEIZURES REPORTED FROM COUNTRIES IN EUROPE (IN METRIC TONS, NOT ADJUSTED FOR PURITY), metric tons Other Germany UK Ireland Belgium Italy France Netherlands Portugal Spain * *preliminary Source: UNODC, Annual Reports Questionnaire Data / DELTA and declines of West Africa, notably of the Lusophone countries (Guinea-Bissau and Cape Verde) as major cocaine transit zones in recent years. Seizures in the Netherlands have also declined sharply in recent years, partly due to growing efforts to stop shipments before they leave their origins For example, the National Crime Squad arrested several men in 2008, suspected of planning to transport 2.6 tons of cocaine from a warehouse in Sao Paulo, Brazil, to the Netherlands. The arrests occurred before the cocaine was actually shipped to the Netherlands. In addition, the 100% control policy in the Antilles and Schiphol airports appears to have deterred the use of air couriers. Large amounts of cocaine, however, continue to be seized by the coastguards of the Dutch Antilles and Aruba. Out of 6.8 tons seized in 2008, 4.2 tons were taken by the Dutch navy from a cargo vessel sailing under a Panamanian flag from the Bolivarian Republic of Venezuela to Europe. Another factor may be diversions to Belgium, notably the port of Antwerp. In 2008, the second largest annual cocaine seizure total in Europe was reported, for the first time, by France. The bulk of the French cocaine seizures were made at sea, mostly close to West Africa or close to the French overseas territories in the Caribbean. The main identified transit country in 2008 was Brazil, reflecting the growing importance of cocaine production in Peru and the Plurinational State of Bolivia. The next largest transit country was the Bolivarian Republic of Venezuela. Over the period, 34% of the cocaine seized by the French authorities left South America via the Bolivarian Republic of Venezuela, 14% via Brazil, 5% came directly from Colombia, 6% via other South American countries, 14% left the Americas via the Caribbean and 1% via Central America. 47 The Iberian Peninsula is still the main transit zone within Europe, followed by the Netherlands, 48 but more direct shipments from the French Caribbean to France are gaining in importance. 49 Who are the traffickers? Trafficking of cocaine to Europe is largely organized by Colombian organized crime groups. These groups may be motivated in part by a desire to make up for their losses in the Western Hemisphere. Colombian groups act as importers and wholesalers; their involvement in retail markets is limited to Spain. But the European markets are more complex and diverse than the North American ones, and a variety of groups are involved. Caribbean groups are important in a number of countries, including Dominicans in Spain, Jamaicans in the United Kingdom and Antilleans in the Netherlands. Other South Americans are also prominent, especially on the Iberian peninsula. West Africans are active retailers (as well as smallscale importers) in a number of countries in continental Europe, including France, Switzerland, Austria, Italy and Germany. North Africans are prominent in countries with a Mediterranean coastline or a large North African diaspora, including Spain, Italy, France and the Netherlands. In addi- 108 TRANSNATIONAL ORGANIZED CRIME THREAT ASSESSMENT
115 4 FIG. 104: COUNTRY OF NATIONALITY OF PERSONS ARRESTED IN SPAIN FOR TRAFFICKING COCAINE INTO OR WITHIN THE COUNTRY, 2008 Spain, 5,259, 61% Foreigners, 3,324, 39% Colombia, 970, 11% Morocco, 288, 3% Dominican Rep., 249, 3% Nigeria, 151, 2% Ecuador, 113, 1% Romania, 110, 1% Portugal, 72, 1% France, 26, 0.3% Other, 1,308, 16% UK, 37, 0.4% Source: UNODC, Annual Reports Questionnaire Data tion, a few groups from the Balkan region (notably from Romania, the countries of the former Yugoslavia, Albania and Turkey) have emerged as players in recent years. While there have been rumours of Mexican interest in the European market, there is little concrete evidence to suggest an active role by these groups so far. The bulk of the trafficking towards Europe still seems to be in the hands of Colombian organized crime groups, forging alliances with various criminal groups operating in Europe. Data for Spain, Europe s main entry point of cocaine, show that over the period, between 21% and 26% of all foreigners arrested in Spain for cocaine trafficking were Colombian nationals. In 2008, the proportion rose to 29% (970 individuals, 11% of the total). The Colombian groups have traditionally cooperated closely with local organized crime groups in Galicia (northern Spain). Cocaine-related arrest data for neighbouring Portugal show a somewhat different picture, though also reflecting the historical and cultural ties with the former colonies. Colombian traffickers do not seem to play any significant role there. The largest pro- FIG. 105: COUNTRY OF NATIONALITY OF PERSONS ARRESTED IN PORTUGAL FOR TRAFFICKING COCAINE INTO OR WITHIN THE COUNTRY, 2008 Cape Verde, 79, 14% Guinea-Bis s au, 54, 9% Portugal, 287, 50% Foreigners, S pain, 40, 7% 290, 50% Brazil, 27, 5% Germany, 6, 1% Angola, 4, 1% Other, 80, 14% Source: UNODC, Annual Reports Questionnaire Data Case studies of transnational threats 109
116 COCAINE FIG. 106: COUNTRY OF NATIONALITY OF TRAFFICKERS ARRESTED IN ITALY FOR TRAFFICKING COCAINE INTO OR WITHIN THE COUNTRY, 2008 Morocco, 1,532, 11% Italy, 8,109, 62% Foreigners 5,034, 38% Other, 1,133, 9% Albania, 1,137, 9% Tunis ia, 399, 3% Nigeria, 380, 3% Gambia, 134, 1% Romania, 98, 1% Egypt, 89, 1% Algeria, 88, 1% S pain, 44, 0.3% Source: UNODC, Annual Reports Questionnaire Data portion of non-portuguese cocaine traffickers arrested in 2008 were from Cape Verde (27%) and Guinea-Bissau (19%) 14% and 9% of the total number or arrestees, respectively. The recent sharp decline in seizures in Portugal may be reflective of the decline in the use of these West African countries as transit areas. In the Netherlands, people from the Dutch Caribbean (Aruba, Netherlands Antilles and Suriname) have long been active alongside Colombian groups. The Colombian expatriate community in the Netherlands is largely from the areas around Cali and from the Antioquia region around Medellin, and in the late 1990s, was incarcerated at a rate 20 times higher than Dutch citizens. 50 More recently, Nigerian groups have expanded in Amsterdam, largely working through air couriers flying from the Netherlands Antilles and Suriname. With improved controls on direct flights, they are increasingly using other transit countries such as the Dominican Republic, Peru and Mexico. 51 Improved controls in the port of Rotterdam (Netherlands) have also displaced some of the traffic to the neighbouring port of Antwerp (Belgium), still controlled by Colombian groups, 52 though Albanian groups, working at the port facilities, also seem to play a role. In contrast to cocaine trafficking to Spain, where the mother ship approach is used to unload shipments onto smaller local craft at sea, the cocaine destined for the Netherlands is typically transported alongside legal merchandise. Cocaine trafficking operations in the UK are dominated by local British criminals, importing from the Iberian peninsula and, to a lesser extent, from the Netherlands. UK authorities estimate that some 75% of the cocaine transited continental Europe before reaching the UK 53. Attempts to organize direct shipments from South America to the UK or Ireland are being made as well, as British traffickers increasingly attempt to source cocaine further upstream. 54 Direct shipments of cocaine by organized Colombian groups, in contrast, are rather the exception. The UK is one of the few EU countries that has a problem with crack cocaine, mostly dealt by British nationals of West Indian descent. 55 Most of the cocaine from the Caribbean (notably from Jamaica) is trafficked by air into the UK, often by using female mules, though this has declined in recent years. West African groups (mainly Nigerians, Ghanaians and British nationals of West African descent) are increasingly involved in shipping cocaine via West Africa to the UK. 56 The Italian drug scene involves Colombian, Dominican and other Latin American trafficking groups working with domestic Italian organized crime groups, in particular the Calabrian N drangheta, largely using containerized shipments. 57 As of 2007, the Camorra, located in Naples, was reported to have begun trafficking cocaine to Italy from Spain, as well as directly from South America. And more recently still, the Sicilian Mafia has got involved, getting support from the Ndrangheta and the Camorra to bring cocaine into the areas it controls. 58 West African and North African groups are also active in retailing and small-scale import, as well as groups from the Balkans, in particular Albanians and Serbs. 110 TRANSNATIONAL ORGANIZED CRIME THREAT ASSESSMENT
117 4 FIG. 107: COUNTRY OF NATIONALITY OF TRAFFICKERS ARRESTED IN FRANCE FOR TRAFFICKING COCAINE INTO OR WITHIN THE COUNTRY, Nigeria, 70, 16% France, 234, 53% Foreigners, 208, 47% Netherlands, 55, 12% Italy, 31, 7% S pain, 21, 5% Morocco, 18, 4% Portugal, 5, 1% Algeria, 4, 1% Tunis ia, 2, 0% DR Congo, 2, 0% Source: UNODC, Annual Reports Questionnaire Data France has not had a large cocaine problem in the past, though this has started to change in recent years, partly due to the growing importance of West Africa as a cocaine transit location. When West Africa became a more prominent transit area after 2004, West African traffickers also became more prominent in France. Nigerian nationals became the top nationality among foreign cocaine traffickers, comprising a third of all arrests among foreign traffickers in Other important players come from Europe and North Africa. 60 The German authorities divide trafficking into sales and import offences. In 2008, the German authorities arrested 4,325 persons for cocaine sales and 605 persons for cocaine import. 61 The proportion of non-german citizens in cocaine sales was 48%, but 63% for cocaine import offences. Analysis of participants in organized crime groups revealed that more than one fifth (22% in 2008) of German passport holders in organized crime groups were not born in Germany. Thus data suggest that trafficking of cocaine in Germany is primarily conducted by persons not born in Germany. The single largest group of foreigners arrested for cocaine sales were Turkish (450 persons or 22% of all foreign cocaine traffickers). The proportion was smaller than for heroin, but surprising given the fact that dealing in cocaine is a relatively new activ- FIG. 108: COUNTRY OF NATIONALITY OF THOSE ARRESTED FOR SALE OF COCAINE IN GERMANY, 2008 Germany, 2,269, 52% Foreigners, 2,056, 48% Turkey, 450, 10% Italy, 142, 3% Lebanon, 113, 3% Morocco, 76, 2% Sierra Leone, 76, 2% Albania, 74, 2% Nigeria, 62, 1% Guinea, 62, 1% Serbia, 56, 1% Netherlands, 40, 1% Poland, 30, 1% Other, 875, 20% Source: UNODC, Annual Reports Questionnaire Data and Bundeskriminalamt, Polizeiliche Kriminalstatistik 2008, Wiesbaden 2009 Case studies of transnational threats 111
118 COCAINE FIG. 109: COUNTRY OF NATIONALITY OF COCAINE IMPORTERS ARRESTED IN GERMANY, 2008 Germany, 225, 37% Foreigners 380, 63% Netherlands, 48, 8% Turkey, 37, 6% Nigeria, 30, 5% Italy, 26, 4% Morocco, 12, 2% Poland, 11, 2% Jamaica, 11, 2% Albania, 10, 2% Other, 195, 32% Sources: UNODC, Annual Reports Questionnaire Data and Bundestriminalamt, Polizeiliche Kriminalstatistik 2008, Wiesbaden 2009 ity for these groups. The second largest nationality was Italian (142 persons or 7% of all foreign cocaine traffickers) many of whom were associated with the Ndrangheta and other Italian mafia groups. 62 Those arrested for cocaine import comprise a smaller and more varied group, with the top foreign nationalities being Dutch (48 persons or 13% of all foreign importers) and Turkish (10%, typically acquiring the cocaine from the Netherlands). 63 Nigerian and Italian individuals also feature prominently. How big is the flow? While there are good data on the number of cocaine users in Europe, much less is known about how much they consume annually. Using four different estimation methods, 64 average per user consumption rates of between 25 and 35 grams can be derived. Multiplying these averages by the number of users yields a cocaine consumption level between 101 and 144 tons per annum for the EU and EFTA countries. The average of the four results was calculated as UNODC s best estimate, showing an increase in the amounts of cocaine used from 63 tons in 1998 to 124 tons in The European cocaine market thus doubled in volume over the FIG. 110: AMOUNTS OF (PURE) COCAINE CONSUMED IN THE EU/EFTA COUNTRIES, metric tons Average of all estimates Estimate based on annual and monthly prevalence and multicity study per capita estimates Estimate based on annual prevalence and UK per capita estimates Estimate based on annual prevalence and 2005 WDR per capita estimates Estimate based on annual and past month prevalence (ONDCP model) Sources: Multiple sources TRANSNATIONAL ORGANIZED CRIME THREAT ASSESSMENT
119 4 FIG. 111: COCAINE PRICES (NOT ADJUSTED FOR PURITY) IN WESTERN EUROPE* IN CONSTANT CURRENCY UNITS PER GRAM, price per gram in constant 2008 US$ price per gram in constant 2008 Inflation adjusted retail price in 2008 US$ Inflation adjusted wholesale price in 2008 Euro Inflation adjusted retail price in 2008 Euro Inflation adjusted wholesale price in 2008 US$ *Average price of 18 western European countries (accounting for the bulk of cocaine consumption in Europe), weighted by population size. Sources: UNODC, World Drug Report 2009 (and previous years) and UNODC, Annual Reports Questionnaire Data period, before stabilizing over the period. As volumes have rapidly increased, prices have declined. Retail cocaine prices, at street purity, expressed in constant 2008 euros, 66 declined from, on average, 143 in 1990 to 91 per gram in 2000 and to 69 per gram in Expressed in constant 2008 US dollars, 67 cocaine prices declined over the period but increased over the period, from $88 to $101 (as the US dollar depreciated against the euro). Most of this increase took place over the period. Wholesale prices followed a similar trend. Cocaine prices fell in parallel with falling purity levels. 68 Taking purity into account, retail cocaine prices, expressed in constant 2008 euros, appear to have remained basically stable over the period ( 183 per pure gram in 1998, 185 per pure gram in 2008). 69 Purity-adjusted wholesale prices, expressed in constant euros, remained stable over the period and increased by 12% over the period to 76,300 per kilogram in Both retail and wholesale prices, expressed in constant US dollars, showed a marked upward trend over the period. Given the significant changes in exchange rates in FIG. 112: PURITY ADJUSTED COCAINE PRICES IN WESTERN EUROPE, IN CONSTANT CURRENCY UNITS, PER GRAM, Inflation and purity adjusted retail price in 2008 US$ Inflation and purity adjusted wholesale price in 2008 US$ Inflation and purity adjusted wholesale price in 2008 Euro Inflation and purity adjusted retail price in 2008 Euro price per gram in constant 2008 US$ price per gram in constant 2008 Euro Sources: UNODC, World Drug Report 2009 (and previous years) and UNODC, Annual Reports Questionnaire Data Case studies of transnational threats 113
120 COCAINE recent years, Colombian drug traffickers were reported to increasingly favour transactions in euros rather than in US dollars, the main transaction currency in the past. The large euro notes ( 500) also seem to have been contributing to its rising popularity. Transactions of Colombian drug trafficking groups with counterparts in Mexico and the USA, however, continue to take place in US dollars. Multiplying the amounts of cocaine consumed with the purity-adjusted retail prices show an increase of the EU/EFTA cocaine market from US$14 billion in 1998 to US$34 billion in 2008, about the same size as the cocaine market in the USA (US$35 billion). How much cocaine must leave South America to meet this demand? After deducting purity-adjusted seizures, 71 the shipments of cocaine from the Andean region appear to have risen from 110 tons in to almost 250 tons in 2006 (range: tons) before falling to 212 tons in Expressed as a percentage of global cocaine production, the shipments from the Andean region towards the EU/ EFTA countries increased from 13% of Andean cocaine production in 1998 to 25% in Using a similar analysis as was applied in the US example, it appears that less than 1% of the cocaine sales in Europe goes to the Andean coca farmers. Another 1% goes to the traffickers within the Andean region. The international traffickers who ship the cocaine from the Andean region to the main entry points (notably Spain) obtain 25% of FIG. 114: Wholesale to end-users in EU-EFTA,US$19.2 bn, 56% VALUE-ADDED OF COCAINE SALES AMONG THE EU/EFTA COUNTRIES, BILLION US$, 2008 Andean farmers, US$0.3 bn,1% Sources: Multiple sources 75 Traffickers in Andean countries, US$0.2 bn,1% International traffickers: from Andean countries to point of entry in Europe, US$8.3 bn, 25% Traffickers from point of entry into Europe to rest of EU/EFTA,US$5.8 bn, 17% the final sales value. A further 17% is generated in shipping the cocaine from the entry points to the wholesalers in the final destination countries across Europe. The largest income is generated in the destination countries, between the wholesaler and the consumer, generating more than 56% of the total. As there are far more dealers at the national level, the per capita income of the dealers at the national level is in Europe (like in North America) lower than among the smaller group of internationally operating cocaine dealers. FIG. 113: SIZE OF THE EU/EFTA COCAINE MARKET IN BILLIONS OF CONSTANT 2008 US$ Cocaine sales in bn US$ ('best estimate') Cocaine sales in bn US$ based on ONDCP model Cocaine sales in bn US$ based on multicity study results billion constant 2008 US$ Sources: Multiple sources TRANSNATIONAL ORGANIZED CRIME THREAT ASSESSMENT
121 4 IMPLICATIONS FOR RESPONSE The cocaine market, particularly the flow to the United States, is one of the best documented organized crime problems. It also appears to be a market in decline. What can be learned from this example? First, organized crime markets do not necessarily expand indefinitely. At its peak in the mid-1980s, about one in seven 12th grade students in the United States had used cocaine in the previous year; the figure is about one in 20 today. There may be many reasons for this decline, but prevention and treatment programmes surely played a role. Not all prevention programmes are equal, of course, and some of those evaluated in the United States were found to be worse than useless, but drugs move in and out of fashion, and intelligent interventions can promote declines in demand. Treatment is expensive and rarely works the first time around, but it remains cheaper and more effective than incarceration. All this underscores the need for a global strategy to deal with the cocaine problem, one that coordinates supply- and demand-side measures (as well as more innovative approaches) across a range of countries and monitors for any side effects. Member States clearly recognized this fact in their Political Declaration of March 2009, stressing that the world drug problem remains a common and shared responsibility that requires effective and increased international cooperation and demands an integrated, multidisciplinary, mutually reinforcing and balanced approach to supply and demand reduction strategies. What is still needed, however, is to translate this widely accepted declaration of intent into practical action that can lead to tangible results. Second, law enforcement can have a big impact on criminal markets, but needs to be applied strategically or it can have perverse effects. For example, breaking the big cocaine cartels led to the emergence of a number of smaller criminal groups. Competition between these groups pushed down the price, encouraging higher levels of use. Of course, the big cartels had become a serious threat to the stability of Colombia, and they had to go, but intervention at any point in an international criminal market will have repercussions throughout the chain, and these need to be monitored and addressed. It is also true that interdiction efforts can push cocaine trafficking routes into areas even more vulnerable to disruption than the original transit zone. This is the story of West Africa between 2004 and International attention was brought to this detour quickly enough, however, that potential disaster appears to have been averted. Similarly, in the mid-1990s, law enforcement efforts to end the large-scale air trafficking of coca paste or cocaine base between Peru and Colombia caused coca leaf prices to fall in Peru, and farmers turned to other crops. Over time, unfortunately, this appears to have encouraged both coca cultivation in Colombia and cocaine processing in Peru, with a subsequent resurgence in Peruvian cultivation. More broadly, declines in the US market may have prompted the growth of the European and South American markets. Case studies of transnational threats 115
122
123 5 HEROIN
124
125 5 HEROIN Heroin is arguably the world s most problematic drug. More users die each year from problems related to heroin use, and more are forced to seek treatment for addiction, than for any other illicit drug. Users develop both tolerance and physical dependence, meaning that their brains adjust to the presence of heroin over time, requiring more to produce the same effect and inducing severe withdrawal symptoms if the drug is not taken in sufficient quantities. The difference between a recreational dose and a fatal one is small, and variations in street drug purity result in many overdoses. In addition, heroin is the drug most associated with injection, which brings about a host of acute and chronic heath problems including the transmission of bloodborne diseases such as HIV/AIDS and Hepatitis C. Heroin is also the illicit drug most highly associated with a single source: more than 90% of the world s heroin comes from opium grown in just a few provinces in Afghanistan. Some 380 tons of heroin are produced from Afghan poppies and exported all over the world. This has not always been the case: while opium has been used in the northern areas of Afghanistan since the eighteenth century, it was only in the 1980s that the country began to emerge as a key source of global supply. Myanmar, the world s leading opium producer in the 1970s and 1980s, saw a reduction in cultivation after Today, Afghanistan has a virtual monopoly on the illicit production of the drug, 1 producing 6,900 tons in 2009 or 95% of global supply. Due to dramatic production increases after 2005, as much as 12,000 tons of opium may have been overproduced since 2006, enough to meet global demand for two years. The Taliban was able to halt virtually all cultivation in 2001, though at that point substantial stocks had been accumulated, and the trade in opium, which itself was not prohibited, continued. Today, poppy farming has been mostly confined to the south of the country, particularly the province of Hilmand, where the Taliban insurgency is strong. This is also the region where the vast majority of heroin processing takes place. This geographic concentration is unique. It is tempting to think that if control could be maintained over a single province in one of the poorest countries on earth, one of the world s most intractable drug problems could be solved overnight. Experience has shown, though, that it is rarely as simple as that, and this perspective may have led to a disproportionate focus on reducing production, at the cost of efforts in other parts of the market chain. With heroin, as with every other issue discussed in this report, it is vital to maintain an international perspective on what is truly an international problem. At current levels, world heroin consumption (340 tons) and seizures represent an annual flow of tons of heroin into the global heroin market. Opium from Myanmar and the Lao People s Democratic Republic yields some 50 tons of heroin and the rest, some 380 tons of heroin/morphine, is produced exclusively from Afghan opium. About 5 FIG. 115: TONS OF OPIUM PRODUCED, AFGHANISTAN AND THE REST OF THE WORLD, ,000 9,000 8,000 Other countries Afghanistan metric tons 7,000 6,000 5,000 4,000 3,000 2,000 1, Source: UNODC, Addiction, Crime and Insurgency: The transnational threat of Afghan opium Case studies of transnational threats 119
126 HEROIN tons are consumed and seized in Afghanistan. The country seized less than three tons of heroin in 2008, a seizure rate of less than 1 %. The remaining 375 tons of heroin are then trafficked worldwide via routes flowing into and through the neighbouring countries of Pakistan (150 tons), the Islamic Republic of Iran (105 tons) and the Central Asian countries of Tajikistan, Uzbekistan and Turkmenistan (95 tons) towards their destinations in Europe, the Russian Federation and Asia. The Balkan and Northern routes are the main heroin trafficking corridors linking Afghanistan to the huge markets of the Russian Federation (US$13 billion) and western Europe (US$20 billion). Organized crime groups controlling the trade along these routes accrue the lion s share of this value per annum but some insurgent groups also partially fund their operations by tapping into this pipeline. While organized crime groups are reaping huge profits, their host societies are paying a heavy price. On the Northern Route, official statistics indicate that in the past ten years, Central Asia has experienced the highest increase in prevalence of drug abuse worldwide. On the Balkan route, the ravages of opiate consumption in the Islamic Republic of Iran have been well documented, with one of the largest opiate user populations in the world. Because of their proximity to the source of the trade, organized crime groups in Pakistan, the Islamic Republic of Iran and Central Asia have developed strong and well-established connections to Afghanistan and are directly dependent on Afghanistan s opium trade to sustain their livelihoods. Afghan heroin has also penetrated other markets, including those traditionally supplied by Myanmar opium. Among these is China, where it is now estimated that 25% of the heroin market is supplied by Afghan heroin. Afghan heroin is also trafficked to other south and southeast Asian countries such as India, Thailand and Malaysia. At least 50% of the heroin market in Australia is supplied by Afghan production. Finally, current opium production figures in Latin America and Mexico suggest that a significant percentage of the US heroin market may be supplied from Afghanistan. FIG. 116: OPIUM PRODUCTION AND GLOBAL HEROIN FLOWS, AVERAGE Flows of heroin (in metric tons) (not actual trafficking routes) 38 Opium 5, Transformed into heroin 2,700 Opium production (in metric tons) USA, Canada West, Central, East Europe 88 South-East Europe Russian Federation Caucasus 77 Central Asia Afghanistan Myanmar 82 Turkey 95 Islamic Republic of Iran Afghanistan China Gulf area, Middle East Pakistan India Myanmar Africa South-East Asia UNODC / SCIENCES PO Source: UNODC, Addiction, crime and insurgency: The transnational threat of Afghan opium, Oceania 120 TRANSNATIONAL ORGANIZED CRIME THREAT ASSESSMENT
127 5 Europe is the most important market for Afghan heroin with around 250 kg of heroin consumed on a daily basis. Most of the profits in this market go to the international drug traffickers. Out of a global market of perhaps US$55 billion for Afghan heroin, only about US$2.3 billion accrues to the famers and traders in Afghanistan. A larger share goes to the retailers in destination countries, but the bulk of the profits go to traffickers plying two main routes: Poppy, opium, morphine, heroin The discussion of opiates markets is somewhat confused by the fact that more than one product is involved. Heroin comes from the opium poppy, which is lanced to produce opium gum, better known simply as opium. Opium is a drug in its own right, some 450 tons is consumed each year in the Islamic Republic of Iran alone. Not all of the opium destined to become heroin is processed in Afghanistan, and it may be easier to access the necessary precursor chemicals in other countries. As a result, opium or morphine (an intermediate stage between opium and heroin) may be exported for processing in other countries. In 2008, Pakistan and the Islamic Republic of Iran seized a combined 16.3 tons of morphine, most of it close to the Afghan border. This represents 95% of global morphine seizures that year, suggesting that much of this processing is taking place close to Afghanistan. It is also possible to make a concoction from the leftovers of opium harvesting (known as poppy straw ), referred to as kompot in the Russian Federation and other CIS countries. Collectively, the markets for opium, morphine, heroin and related products are known as opiates markets. Since opiates other than heroin have distinct markets with their own characteristics, for the purposes of precision and clarity, this chapter focuses on the dominant substance: heroin. The so-called Balkan route, which traverses the Islamic Republic of Iran (often by way of Pakistan), Turkey, Greece and Bulgaria across South East-Europe to the western European market which commands by itself an annual market value of about US$20 billion; and The northern route, which mainly runs through Tajikistan and Kyrgyzstan (or Uzbekistan or Turkmenistan) to Kazakhstan and the Russian Federation where the size of the market is estimated to total US$13 billion per year. There is also a relatively recent variant on the Balkan route, which traverses the Caucasus to both European and Russian markets. In all instances, primarily land transport is used to move the opiates through regions which, at least in part, have stability problems. FIG. 117: Others, 7% (24 tons) Africa, 7% (24 tons) USA& Canada, 6% (22 tons) Pakistan, 6% (19 tons) Europe (except Russia&Turkey), 26% (87 tons) FIG. 118: Production of opium (in metric tons) GLOBAL HEROIN CONSUMPTION (340 TONS), Islamic Republic of Iran, 5% (17 tons) Source: UNODC OPIUM PRODUCTION IN AFGHANISTAN AND MYANMAR, Source: UNODC World Drug Report, 2009 Myanmar Afghanistan China, 13% (45 tons) There is some maritime transport, especially through the Black Sea, and air couriering is an issue, particularly involving West Africans based in Pakistan and, to a lesser extent, couriers from Tajikistan. This chapter focuses on the land routes, however, since this is the primary way used for moving the drugs to main consumer markets. UNODC / SCIENCES PO India, 5% (17 tons) S&SE Asia, 5% (17 tons) Russian Federation, 21% (70 tons) Case studies of transnational threats 121
128 HEROIN Not all of the heroin that leaves Afghanistan on these routes makes it to its destination. Some is seized, some is consumed in transit countries. In recent years, UNODC estimates that 95 tons have been exiting Afghanistan toward the Russian Federation, of which 70 tons is eventually consumed in Russia. About 140 tons leaves Afghanistan along the Balkan route, of which only about 87 reach the highest-value consumers in Europe. FIG. 119: GLOBAL OPIATES CONSUMPTION, 2008 Consumption (in tons, heroin equivalent) HEROIN OPIUM Americas Americas TOTAL OPIATES Americas Europe Europe Europe 1 5 Turkey Middle East IR of Iran Africa Turkey Middle East IR of Iran Africa Turkey Middle East IR of Iran Africa Russian Federation Central Asia India Pakistan Afghanistan Russian Federation Central Asia India Pakistan Afghanistan Russian Federation Central Asia India Pakistan Afghanistan (Common scale) China Myanmar Other Asian countries Oceania China Myanmar Other Asian countries Oceania China Myanmar Other Asian countries Oceania Using the same corridors in reverse and relying on the same networks of crime and corruption, precursor chemicals are trafficked into Afghanistan to process its opium into heroin. This necessitates thousands of tons of precursor chemicals, including acetic anhydride, crucial for the conversion of morphine into heroin. Over the past decade, the price of acetic anhydride has shot up from US$24 per litre to US$350 per litre, either due to more effective interdiction or increased demand. As with heroin, most profit is realised outside of Afghanistan. Although profit remains the main variable, kinship ties across the border facilitate illicit activity all along the trafficking routes, from Balochi and Pashtun networks straddling the Pakistan-Iran-Afghanistan borders to drug networks in southeast Europe. Ethno-linguistic links between groups in northern Afghanistan and Central Asia such as ethnic Tajiks also facilitate illicit transnational activity. These routes are subject to change, of course, and are the elements of the market quickest to adapt when encountering resistance. Cultivation can also shift, as history has shown, although the process is slower. While opium poppy can be grown across a wide range of countries, climatic conditions can make a big difference in yield: the productivity of crops in Afghanistan s primary market rival Myanmar is far less, but production in Afghanistan is reliant on irrigation. Afghan opium also generally has higher morphine content than the opium produced in Myanmar; Afghan laboratory owners therefore face somewhat lower processing costs in the initial phases of heroin production. The most inflexible part of the market is demand. While new user communities can be developed, there are a limited number of traffickers with sufficient time horizons to intentionally undertake this task. However intractable the problem may seem eight years after the international coalition s intervention in Afghanistan, it is worth bearing in mind that the Afghan opium trade benefits from a nearly-ideal conjuncture of factors around which it has thrived. The phenomenon is rooted in the large and stable global demand for opiates; the continuing conflict in Afghanistan, and the country s enormous production capacity. A number of factors within Afghanistan and the greater region compound these such as poverty and corruption. 2 Simultaneously, smuggling feasibility has increased in line with the multiplication of transport links and the groth of international trade. Source: UNODC Addiction, Crime and Insurgency: the transnational threat of Afghan opium, TRANSNATIONAL ORGANIZED CRIME THREAT ASSESSMENT
129
130 HEROIN What is the nature of this market? Opiate addiction has long been a problem in the former Soviet Union, but was largely associated with the consumption of kompot, a poppy-straw derivative. Since the fall of the Soviet Union and the global integration of the Russian economy, use of heroin appears to have rapidly grown, with indications of stabilization since around Today, there are an estimated 1.5 million heroin users in the Russian Federation, making it the single largest national heroin consumer in the world. To get to Russian markets from Afghanistan, land transport appears to be the most popular route. Twenty years ago, all the countries north of Afghanistan were part of the USSR, so cross-border linkages are common. These new states are mostly poor and some have had problems with political insurgencies. Under-resourced and struggling to find their feet, addressing trans-shipments of heroin was not an early priority. Today, efforts are being made, and several tons of heroin are seized each year. The regional seizure trend declined after 2003, however, largely due to the withdrawal of Russian troops from the Tajik-Afghan border. It is unlikely that the flow similarly declined during that period. 4 Institutions are not only weak they may also be mistrusted. The people of this region have a long tradition of survival independent of, and some times in spite of, the state. Shortages under the centrally planned economy were commonplace, and people did what they could to make ends meet. The thriving black market was a lifeline, and people in the border regions were well positioned to participate in this early capitalism. As national governments continue to gather popular support, the tradition continues, often making use of ethnic and familial ties that do not acknowledge the new borders. Heroin is not the only commodity to illicitly cross Central Asian borders, and price differentials between food and oil, for example, have led to extensive smuggling. According to 2009 UNODC estimates, 95 tons or 25% of all Afghan heroin exports pass through the porous borders of Central Asia, in particular Tajikistan which handles most of this flow. Acting as transit zone has had a profound effect on Central Asian societies, particularly given the nature of the smuggling, which appears to involve a large number of small couriers. An estimated 11 tons remain in the region for local consumers, which means that Central Asian users consume about one third as much heroin per capita as Russian users, but this use appears to be highly concentrated along major transit routes. This is reflected in high levels of HIV infections in these areas. There are an estimated 280,000 heroin users in Central Asia. On a national basis, however, Tajikistan, the country most utilized by traffickers, has relatively low use rates. This may be due in part to the fact that Tajikistan is the least developed country in Central Asia. It may also suggest that heroin through this country is particularly well organized, with little spilling over into local markets. Tajik opiates use rates are estimated to be about the same as those found in the European Union (0.6% annual prevalence), whereas Kazakhstan has rather high rates (1%), similar to England, Wales and Italy. Aside from local use and seizures, most of the heroin trafficked into the region is headed for the Russian Federation, and most of it is consumed there. There has been talk for years of the Russian Federation becoming a transit area for heroin destined to West Europe, but there has been very little evidence to suggest this potential has been realised. Instead, the country has evolved into a preferred destination. On average, 200 kilograms of heroin per day need to be trafficked into the Russian Federation to meet the annual 70 tons worth of domestic demand. How is the trafficking conducted? To get to the Russian Federation, most of the heroin must first make the journey to the northern border. The northern provinces of Afghanistan used to be a significant opium growing area, and the only area to continue cultivation under the short-lived Taliban prohibition; but these provinces have been largely poppy-free since Today, most of the opiates trafficked north come from crops in the south, and so the drugs first must transit the country before crossing the border. This is no small matter: nearly 100 tons of contraband must cross up to 800 kilometres of territory along a limited number of roads, evading the detection of both local and foreign security forces. The Government of Afghanistan seizes on average 1% of Afghan opium production. Once it reaches the border, the value of the heroin headed north is estimated at US$ million annually. The portion that eventually reaches the Russian Federation will be worth thirty times this amount. From Afghanistan to the north, traffickers are offered a choice of three countries: Tajikistan, Uzbekistan and Turkmenistan. These northern borders span a length of some 2,600 kilometres. The Uzbek and Tajik borders are marked by the Amu 124 TRANSNATIONAL ORGANIZED CRIME THREAT ASSESSMENT
131 5 FIG. 120: HEROIN TRAFFICKING FROM AFGHANISTAN TO THE RUSSIAN FEDERATION AND TO EUROPE Scandinavian countries Baltic countries Russian Federation 70 tons per year UNODC / SCIENCES PO United Kingdom Netherlands Belgium Germany Czech Republic Poland Belarus Ukraine Russian Federation Kazakhstan Western Europe 80 tons per year Spain France Switzerland Italy Austria Slovenia Croatia Hungary Romania Bosnia and H. Serbia Bulgaria Black Sea Caspian Sea FYROM Georgia Albania Azerbaijan Turkey Turkmenistan Uzbekistan Kyrgyzstan Greece Tajikistan Main regions of heroin consumption Magnitude of the flows Mediterranean Sea Syrian Arab Republic Iraq Islamic Republic of Iran AFGHANISTAN Heroin trafficking routes Source: UNODC Abbreviation: FYROM: Former Yugoslav Republic of Macedonia Pakistan Darya River, while the Turkmen border is mostly desert. Although there is no shortage of possibilities for clandestine crossings, it appears that most of the trafficking occurs along established trade and transit routes. There are nine official crossings between Afghanistan and Central Asia, including two river ports, one on the Uzbek border and one on the Tajik border. These river ports are the primary conduit for legitimate trade, and also, it appears, for trafficking. Hayraton (Afghanistan s Balkh province-sukhandaraya province of Uzbekistan) Ninji Pianj (Afghanistan s Kunduz province- Khatlon Province Tajikistan). Once in Central Asia, heroin can be moved northward by several means, including rail, air, across the Caspian Sea, and post. Based on the seizure figures, most of the heroin appears to be conducted in private and commercial vehicles, often in relatively small amounts. Of 45 heroin seizures above 500 grams (a commercial quantity) in Tajikistan between 2005 and 2007, 80% amounted to 10 kilograms or less, and of these, the average size was 2.6 kilograms. The largest seizure, made in 2005, was 119 kilograms. This is a large seizure, but it would take hundreds of similar shipments to accommodate a 70 ton consumption level. In contrast, large cocaine seizures are typically multiple tons, and the wholesale value of these drugs is about the same in their primary destination markets. 5 However, there does appear to be a recent trend toward larger seizures, suggesting increasingly wellresourced organizations. As noted above, it was rare to find a seizure of over 100 kilograms in Central Asia prior to 2008, but since that time, at least 14 such seizures have been made, including two of a half ton or more. Of course, it remains unclear whether these trends reflect changes in the nature of the trafficking or in the nature of enforcement. Tajikistan seems to be particularly favoured by heroin traffickers, as does Kyrgyzstan beyond it, although Uzbekistan and Turkmenistan see their share, as evidenced by recent seizures. Wherever it comes from in Central Asia, the heroin must cross the vast expanse of Kazakhstan to enter the Russian Federation by land. Although Kazakhstan is the inescapable gateway to the Russian Federation if travelling by land, only about 1% of the heroin passing through its territory is seized by authorities. This is about the same share as Afghanistan. Border control is difficult in Kazakhstan: it must police some 12,000 km of land borders and 1,900 km of Caspian Sea coastline. A 2008 report from the Central Asian Regional Information and Coordination Center (CARICC) starkly concluded: If drugs reach the territory of Kazakhstan then the probability of safe shipping to the Russian Federation can be around 95%. 6 Once the heroin reaches Kazakhstan, most passes through the north-western borders into the Russian Federation. Some 95% of the heroin entering the Russian Federation stays in the country with the remainder exiting into Ukraine, the Baltic countries, Belarus and the Nordic countries. Case studies of transnational threats 125
132 HEROIN Who are the traffickers? On the Afghan side of the border, trafficking to Central Asia appears to be dominated by five major Afghan narcotics networks, comprised of officials, warlords, organized crime groups and possibly one insurgent group (Hizb-I-Islami). These groups work alongside much smaller, often family-based, networks. Ethnic Tajiks living on both sides of the border are important in this respect. Officials in most Central Asian countries also claim that a limited number of groups control the trade, but it is hard to reconcile this with the small size of most detected seizures. It would be difficult for a small number of groups to coordinate the hundreds of micro-shipments required to satisfy a 70-ton Russian demand a few kilograms at a time. In contrast, the incentives are all in place for a large number of entrepreneurs to try their hand at small shipments. On arrival in the Russian Federation, a 2.5 kilogram consignment would be worth well over US$50,000. This is about 100 times the annual GDP per capita in this region. At the very least, the situation is likely to be similar to that seen on the Afghan border, with large and small groups working in parallel. The small groups tend to trade across borders with members of their family, clan or ethnic group. 7 They may also deal in opium or hashish, alongside heroin. 8 Of course, it is possible that a well-organized parallel stream of large consignments is flowing undetected, protected by high level corruption. There do appear to be some larger groups operating in Tajikistan 9 and parts of Uzbekistan, and these groups specialize in heroin, in contrast to more opportunistic smaller groups. 10 For example, Western law enforcement sources in Uzbekistan estimated at ten the number of large networks (16 or more individuals) who share the market with hundreds of small independent trafficking organizations. According to the head of the Tajik Drug Control Agency, approximately 20 large networks control the drug trade in Tajikistan, with many smaller groups in the border areas. These less numerous, larger groupings, are well-established highly hierarchical groups, often based around a specific clan and sometimes (such as in the case of Uzbekistan s Fergana valley region or Kyrgyzstan s Batkent region) with trafficking operations built around specific ethnic enclaves. Further downstream, the Russian Ministry of Internal Affairs estimates that there are 450 criminal organizations with some 12,000 members in the Russian Federation, suggesting a proportionately smaller number of larger organizations. Based on customs seizures, there is plenty of evidence of transnational activity, but no national groups appear to dominate regional trafficking. Russian nationals comprise a large share of arrestees in Kazakhstan and Kyrgyzstan, but a much smaller share among countries that span the Afghan border. Conversely, a small number of Afghans are arrested in Tajikistan but usually not further afield. Tajiks appear to be major players in a number of countries, including the Russian Federation, but are detected in much smaller numbers in Kazakhstan. It is possible that Tajik groups source the drug and FIG. 121: DISTRIBUTION OF NATIONALITY OF ARRESTED HEROIN TRAFFICKERS AT CUSTOMS, Other Afghan Turkmen Kyrgyz Uzbek Tajik Kazakh Russian 100% 80% 60% 40% 20% 0% Russia Kazakhstan Tajikistan Uzbekistan Kyrgyzstan Source: World Customs Office database 126 TRANSNATIONAL ORGANIZED CRIME THREAT ASSESSMENT
133 5 pass it on to Russian groups in Kazakhstan but it seems more likely that the drugs change hands several times before reaching the consumer. Outside these regional nationalities, West African, especially Nigerians, have also been reported, particularly in Tajikistan. These may act as simple couriers, as demonstrated with the 2006 attempt by a Nigerian group to have one of their own cross the Kazakh-Chinese border with heroin. Given the permeability of the border and ethnic linkages, the Tajik groups have direct access to Afghan production, and some of them appear to be led by former warlords still armed with weapons from the Tajik civil war ( ). There may also be trade in drugs for surplus arms. The integration of Afghan-Tajik networks becomes more obvious when groups based in Tajikistan are active in supplying weapons to traffickers in Afghanistan. This trade has been active for decades and features an efficient barter system developed since the Soviet invasion. There are similar reports from the Kazakh-Chinese border where Kazakh smugglers reportedly exchange weapons for Chinese drugs. The drugs-for-arms trade is also of importance because of its intersection with political insurgents in both Afghanistan and Central Asia. In Central Asia, this nexus is particularly obvious in the Fergana Valley and in Tajikistan where the porous border with Afghanistan is crossed by militants linked to the Islamic Movement of Uzbekistan and other Al-Qaida linked groups. But, on the whole, the evidence seems to point to a good deal of ant trafficking, with the heroin changing ownership several times between the farmer and the consumer. For cross-border transactions, ethnic and familial ties are important. In some cases, this traffic may be coordinated by higher level brokers, who, it has been argued, profit most from the trade. 11 How big is the flow? FIG. 122: DISTRIBUTION OF HEROIN MARKET ON THE NORTHERN ROUTE, Opiate consumption, seizures and trafficking (tons) Annual heroin consumption in Central Asia, 11 tons Heroin trafficking from R ussia to E urope per year, 4 tons Average annual heroin seizure in Russia, 3 tons Average annual heroin seizure in Central Asia, 5 tons Source: UNODC Heroin trafficking from Central Asia to Caucasus&China per year, 3 tons Annual heroin consumption in Russia, 70 tons Based on studies of drug demand in the Russian Federation, UNODC estimates that 70 tons of pure heroin are required to meet the requirement of the Russian market. 12 To get this amount to the Russian users, considerably more has to leave Afghanistan into Central Asia. First, heroin use in Central Asia must be deducted. The most recent UNODC estimate of the heroin using population is Central Asia is 280,000. Based on 2008 surveys of drug treatment centres conducted by UNODC in Central Asia, an estimate of 40 grams of pure heroin per user/year was used as a regional average. 13 Central Asia s heroin users are thus estimated to consume approximately 11 tons of heroin per annum. Also to be deducted are seizures in Central Asia, which have been in the region of 5 tons per year. Some heroin is also diverted from Central Asia to the Caucasus and China (about 3 tons). Heroin is also seized in the Russian Federation (about 3 tons) and some transits the country for Eastern or Northern European countries (about 4 tons). As a result, some 95 tons of heroin must leave Afghanistan in order for 70 to arrive and stay in the Russian Federation. Price figures for heroin in the Russian Federation were provided by the Russian Government. At US$15,000 per kilogram, these 70 tons wholesale for just over one billion dollars and retail (adjusted for purity) for some 13 billion US dollars. These figures are necessarily imprecise, particularly due to the lack of data on heroin purity levels in Central Asia and lack of certainty regarding the size of the Russian heroin using population. Case studies of transnational threats 127
134
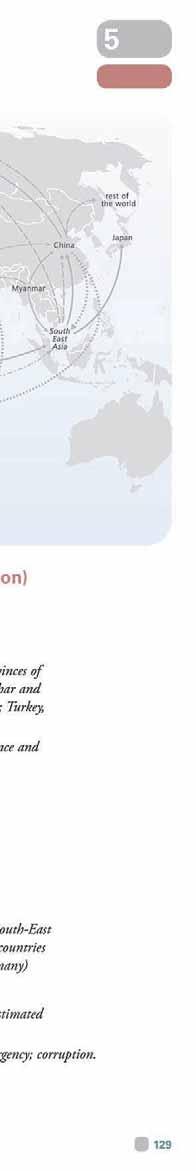
135
136 HEROIN FIG. 123: What is the nature of this market? Western Europe has had a longstanding problem with heroin, and since the end of the Cold War, many other countries have been affected. Since 2000, though, demand in Western and Central Europe has been stable or declining, as have prices. Today, an estimated 87 tons of heroin are consumed in Europe (excluding the Russian Federation) per annum, the bulk of which (92%) is consumed in Western and Central European countries. Most of this consumption (about 60%) takes place in just four countries: the United Kingdom, Italy, France and Germany. The vast majority of this demand is satisfied by heroin trafficked along the Balkan route. INFLATION-ADJUSTED HEROIN RETAIL PRICES PER GRAM IN EUROPE (IN CON- STANT 2007 US$), Source: UNODC, 2009 World Drug Report, Vienna 2009 FIG. 124: Rest of Europe 40% Germany 8% ESTIMATED HEROIN CON- SUMPTION DISTRIBUTION IN EUROPE (TOTAL 87 TONS) France 11% Source: UNODC UK 21% Italy 20% The Balkan route consists of much more than the Balkans, of course, and the routes through the Balkans have varied over time. Far more consistent is the use of the first part of the route, through the Islamic Republic of Iran and Turkey. From there, the flow fragments, traversing a wide variety of routes to the final destinations. In Europe, the Netherlands appears to serve as a clearing house; drugs pass through other consumer countries on their way to the Netherlands, only to return again. This is particularly the case for Germany. Traffickers through Central Asia have, at least, a lingua franca in Russian, but Balkan route traffickers cross a much more diverse region. They do have the advantage of a better transportation infrastructure and massive commercial flows for cover, however. They have also been plying this route for decades, longer than their Central Asian counterparts. Over this time, Balkan route trafficking has become very well-organized and professional. How is the trafficking conducted? Considerable quantities of heroin are trafficked to Europe by sea and air, but the Balkan route resembles the Central Asian one in that the bulk of the flow proceeds by land. Most of the heroin headed for Western European markets leaves Afghanistan into the Islamic Republic of Iran, Pakistan and Turkey, which collectively seize most of the heroin interdicted in the world (40% of the estimated flow intercepted between ). Despite these remarkable enforcement efforts, traffickers nevertheless succeed in getting sufficient volumes through so that most of the heroin consumed in Europe in recent decades has passed through these countries. Today, around 30% (110 tons) of Afghanistan s heroin continues to move west/south-west into the Islamic Republic of Iran toward Europe. Out of this amount, an estimated 10 tons arrives by air or sea from various points of departure. Another 7 tons are trafficked via what has been called the Northern Balkan route, transiting the Caucasus rather than Turkey. As discussed above, a small amount (4%) passes through the Russian Federation to Northern Europe, but the bulk of the supply (at least 80%) travels the traditional Balkan route, mainly via road transportation. The core Balkan route crosses directly into the Islamic Republic of Iran along its rough 949 kilometre border with the Afghan provinces of Hirat, Farah and Nimroz, and at least 90 crossing points have been identified. 14 In contrast to Central Asia, smugglers rarely use official crossing points. 15 Traf- 130 TRANSNATIONAL ORGANIZED CRIME THREAT ASSESSMENT
137 5 FIG. 125: HEROIN TRAFFICKING FROM AFGHANISTAN TO THE RUSSIAN FEDERATION AND TO EUROPE Scandinavian countries Baltic countries Russian Federation 70 tons per year UNODC / SCIENCES PO United Kingdom Netherlands Belgium Germany Czech Republic Poland Belarus Ukraine Russian Federation Kazakhstan Western Europe 80 tons per year Spain France Switzerland Italy Austria Slovenia Croatia Hungary Romania Bosnia and H. Serbia Bulgaria Black Sea Caspian Sea FYROM Georgia Albania Azerbaijan Turkey Turkmenistan Uzbekistan Kyrgyzstan Greece Tajikistan Main regions of heroin consumption Magnitude of the flows Mediterranean Sea Syrian Arab Republic Iraq Islamic Republic of Iran AFGHANISTAN Heroin trafficking routes Source: UNODC Abbreviation: FYROM: Former Yugoslav Republic of Macedonia Pakistan fickers along the Iran-Afghan borders are generally well-organized and well-armed; deadly clashes between Iranian troops and traffickers are commonplace, as demonstrated by the more than 3,500 casualties sustained by the Iranian border guards in the past three decades. Violence is most often associated with smuggling from south-western Afghanistan, such as from Nimroz province, where heavily armed convoys of five or six trucks take the contraband to the Islamic Republic of Iran either through Pakistan or directly. Across the Afghanistan/Iran borders and through multiple methods of transportation - including the wide usage of camels and pack animals- upwards of 105 tons of heroin are transferred to the Islamic Republic of Iran for further shipment to Turkey. An additional 35 tons of Afghan heroin are trafficked across the 976 km Pakistan-Iran border, from Pakistan s Balochistan province into south-eastern Iran s Sistani-Baluchistan province. One kilogram of heroin is worth around US$2,000-2,500 in Afghanistan. The price rises to US$3,000 on the Afghanistan-Pakistan border and is worth around US$5,000 on the Iran/Afghanistan border. When the same heroin reaches the Iran/Turkey border, its price per kilogram increases to approximately US$8,000, a 60% increase. 16 Based on the estimated flows through this route, Iranian crime groups organizing heroin trafficking from the Afghanistan/Iran border to the Turkey/Iran border stand to pocket some US$ million per year. 17 Trafficking patterns indicate that heroin crosses from the Azarbaycan-e-Khavari province of the Islamic Republic of Iran into Turkey and traverses Turkey s Hakkari and/or Van districts. In all, an estimated 95 tons of heroin are shipped across Turkey s borders every year along the following routes: Hakkari/Van - south-eastern cities - central Anatolia cities - Istanbul - Edirne to Bulgaria/ Greece. Hakkari/Van - south-eastern cities - southern/ western Anatolia cities to Greece/Cyprus with sea transportation. Hakkari/Van - south-eastern cities - central Anatolia cities - northern Anatolia cities - Ukraine (with smaller amounts to Georgia). From Turkey, around 82 tons of heroin then flow towards Western Europe (particularly Germany/ Netherlands and Italy) along several routes: Approximately 20 to 25 tons of heroin travel across the Former Yugoslav Republic of Macedonia (FYROM) to Albania for further shipments towards Italy (by sea) and Switzerland. A smaller route proceeds directly from Greece by sea towards Italy while a larger portion also flows via FYROM to Serbia to Bosnia and Herzegovina to Croatia and Slovenia and further north. The bulk of the heroin (approximately 55 to 60 tons) travels to Germany and the Netherlands, travelling from Bulgaria to Serbia to Hungary to Austria to Germany and the Netherlands or from Bulgaria to Romania to Hungary to Slovakia to Austria to Germany and the Netherlands. Case studies of transnational threats 131
138 HEROIN DISTRIBUTION OF HEROIN FLOWS TO EUROPE Route Size of flows (tons) Per cent Balkan route (Afghanistan - I.R of Iran - Turkey - South-Eastern Europe) 85 80% Northern route (Afghanistan - C. Asia - Russian Fed. - Eastern Europe) 4 4% Northern Balkan route (Afghanistan - I.R. of Iran - Caucasus - S. Europe) 7 7% Directly from Pakistan to Western and Central Europe 5 5% Through Africa to Western and Central Europe 2 2% Directly from South and SE Asia (except India) to W&C Europe 1 1% Through Middle East and Gulf area to W&C Europe 1 1% Directly from India to W&C Europe 1 1% kilograms of heroin seized From Germany and the Netherlands, heroin shipments are further trafficked to France, the UK and Spain. Smaller routes include directly through the Black Sea into the Ukraine. This flow is estimated at 2-3 tons annually. In addition, trucks carrying heroin are reportedly transported on ferries from Turkey to Italy (notably Trieste). The estimated average annual net profit of organized crime groups managing heroin trafficking between the Islamic Republic of Iran and Turkey and further to the Turkey/Bulgaria and/or Turkey/ Greece borders is around US$8,000 per kilogram, totalling US$ million. In the Balkans, very little heroin is seized, suggesting the route is very well organized and lubricated with corruption. Most passes through Bulgaria, a country which has reported some fairly large heroin FIG. 126: HEROIN SEIZURES IN BULGARIA, ,500 2,000 1,500 1, Source: UNODC seizures in the past, but where figures have been erratic, despite little evidence of fluctuation in the flows. Looking at the Balkan route, it becomes obvious that shipments need to cross 5-10 borders before reaching their final destination, while on the northern route, traffickers generally cross an average of four borders from Afghanistan to the Russian Federation. Drug smuggling along the Balkan route is systematic and seems to involve well-resourced groups, with much larger consignments than found in Central Asia. Seizures are especially large up to Turkey, at which point loads appear to be broken down into smaller parcels. On the Balkan route, the average heroin seizure amounts to approximately 10 kg which is twice the average of the northern route. However, the average seizure per case climbs to around 25 kg in south-eastern (including Turkey) and eastern European countries. Multi-hundred kilogram shipments have been seized in Istanbul on many occasions, a distinction no Central Asian city can claim, despite being much closer to the source. This suggests the country is being used as a wholesale market. The Netherlands seems to serve a similar function, with heroin destined for Germany being first trafficked to the Netherlands. Overall, European countries seize a relatively small share of the heroin entering their borders, and most of the seizures are quite small. Who are the traffickers? Organized crime groups involved in international trafficking on the Balkan route are often composed of nationals from the source or transit countries. But, at various stages, many of the traffickers may be transportation professionals contracted to do the job, not necessarily members of the group that owns 132 TRANSNATIONAL ORGANIZED CRIME THREAT ASSESSMENT
139 5 the drugs. This is particularly true along the Iran/ Turkey border, but even crossing into the Islamic Republic of Iran, traffickers may make use of experienced traffickers from local border tribes. 20 Opiates destined for Western Europe are trafficked out of Afghanistan by Balochi and Pashtun networks operating in the border regions of Afghanistan, Pakistan and the Islamic Republic of Iran. Some of these networks have been active since the time of the Soviet invasion and have long-established links with the political and security apparatus on both sides of the border. Analysts from the United Nations Assistance Mission to Afghanistan (UNAMA) estimate at the number of large Afghan networks with links to the Islamic Republic of Iran. Additionally, many Afghan traffickers are reported to operate out of Pakistan. The Afghan- Iran trafficking channels support a variety of other smuggled goods, including human beings, cigarettes, fuel, precursor chemicals and weapons. Balochi groups are believed to offload their shipments in the Islamic Republic of Iran to groups with greater regional and international ties, such as Azeri, Arab, Persian and Kurdish groups. Once opiates have changed hands, these groups are then mainly responsible for shipping the drugs from the eastern to the western borders of the country. Inside the Islamic Republic of Iran, organized crime networks also supply opiates to the large domestic market. FIG. 127: FIG. 128: DISTRIBUTION OF ARRESTED HEROIN TRAFFICKERS BY NATIONALITY IN BULGARIA, Albanian 2% Romanian 5% Other Balkan nationalities 18% Pakistani 8% Nigerian 6% Other African nationalities 6% Dutch 2% Turkish 27% Others 5% Source: World Customs Organization Bulgarian 41% DISTRIBUTION OF ARRESTED HEROIN TRAFFICKERS BY NATIONALITY IN ITALY, Other 12% Albanian 32% On some part of the Balkan route, organized crime and insurgency overlap, such as elements of the Kurdistan Workers` Party (PKK) who are reported to tax drug shipments crossing into Turkey from the Islamic Republic of Iran and, it is speculated, from Iraq. The PKK also reportedly collect taxes (or receive donations) from Kurdish heroin traffickers based in Europe. 21 According to NATO intelligence analysts, the PKK pockets upwards of US$50 million to US$100 million annually from heroin trafficking alone. PKK involvement in the trade is further demonstrated by the 2008 arrest of several of its members in Europe on heroin trafficking charges. 22 Ethnic Kurdish groups, with large border populations in the Islamic Republic of Iran, Iraq and Turkey, may be responsible for border crossings in those regions. These groups may sell on these drugs in Turkey or traffic them to Europe through their own networks. The UK s Serious Organised Crime Agency (SOCA) argues that in 2009, Turkish networks continued to control the heroin supply to Italian 10% Other Balkan nationalities 13% Europe. 23 According to WCO seizure statistics between 2000 and 2008, the majority of drug traffickers arrested in Turkey were Turkish nationals. This might suggest that Turkish groups are organizing the heroin trafficking all through Turkey up to the borders with Bulgaria and Greece where Balkanbased groups take over. Organized crime in the Balkans involves a large variety of criminal activities and as such, heroin is but one, albeit the most lucrative, commodity illicitly trafficked through this region. The routes through this region also operate in the reverse direction with cocaine, precursors and ATS moving eastward into Turkey and beyond. Organized crime Turkish 13% Source: World Customs Organisation Case studies of transnational threats 133
140 HEROIN groups controlling these corridors have thus comparatively better access to more numerous and diversified crime markets than their Northern Route counterparts. Thus, many tend to be poly drug (heroin, cannabis etc.) and poly crime, trafficking in human beings, weapons and stolen vehicles to name but a few. Another notable feature is that some important networks have clan-based - and hierarchically organized - structures such as Albanian and Kurdish groups, making them particularly hard to infiltrate. Heroin interception rates in the Balkan region are very low (2%), especially when compared with Turkey (10%) and the Islamic Republic of Iran (18%). This suggests inadequate border controls and high fragmentation/inefficiency of law enforcement bodies in a region where high levels of unemployment and low salaries also create conditions for corruption-related behaviour. As seen below, Balkan groups are important through the Balkans, but do not appear to control the drugs in destination markets. In most European countries, nationals control the local drug markets. There are notable exceptions, however. Dutch groups are frequently encountered in the UK, and West Africans act as important small-scale importers and retailers in many countries. Albanian nationals are very important in destination markets such as Switzerland and Italy. Turkish groups play a key role in Germany, as do German groups. NUMBER OF ARRESTED HEROIN TRAFFICK- ERS BY NATIONALITY, NETHERLANDS, Number of Nationality heroin traffickers arrested Netherlands 17 Nigeria 16 Turkey 13 Other African nations 7 United States 4 United Kingdom 4 Brazil 4 Cape Verde 3 Spain 3 Portugal 3 Others 25 Source: World Customs Organization In Bulgaria, most of the arrested heroin traffickers are nationals of that country. However, the proportion of Turkish nationals also stands out. The other main nationalities are Balkans such as Serbs and Macedonians. Albanians are notably, nearly absent. Ethnic Albanians appear to be especially active in Greece, Switzerland and Italy. In Italy, one of the most important heroin markets in Europe and frequently identified as a base of operation for Balkan groups, Albanians make up the single largest group, constituting 32% of all arrestees between The next active group was Turks followed by Italians and citizens of Balkan countries. There were a number of Pakistani and Nigerian traffickers arrested in Italy as well. FIG. 129: DISTRIBUTION OF ARRESTED HEROIN TRAFFICKERS BY NATIONALITY IN GERMANY, FIG. 130: DISTRIBUTION OF ARREST- ED HEROIN TRAFFICKERS BY NATIONALITY IN THE UK, Nigerian 3% Albanian 3% Other 17% Serbian 4% Other African nations 5% Dutch 5% Other Balkan nationalities 5% Turkish 19% German 39% Nigerian 3% Pakistani 4% German 4% Belgian 5% Others 21% Turkish 5% Dutch 14% British 44% Source: World Customs Organisation Source: World Customs Organization 134 TRANSNATIONAL ORGANIZED CRIME THREAT ASSESSMENT
141 5 In Germany, the number of Turks arrested for heroin trafficking outnumbers all other nationalities but remains lower than the number of German citizens arrested. Dutch citizens represent 5% of all heroin trafficking arrests and generally, enter the trafficking chain only after heroin arrives in Germany. Balkan nationalities make up a minority of arrestees in Germany, followed by Nigerian nationals. In the Netherlands, a regional hub for heroin distribution, the absolute number of arrests made by customs is limited. Dutch, Nigerian and Turkish nationalities are nearly equally represented, while Balkan nationals are conspicuously absent. In the UK, British citizens predominate but a considerable number of Dutch citizens also show up in arrest statistics. The proportion of arrested Turkish, German, Pakistani and Belgian nationals is considerably smaller than Dutch or British nationals between 2000 and Here too, Balkan nationalities comprised a negligible percentage of all heroin trafficking arrests. How big is the flow? As discussed above with regard to the Russian Federation, the estimates on the Balkan route are based on both supply and demand side data. Based on UNODC annual assessments, approximately 105 tons (around 30%) of Afghan heroin is trafficked directly into the Islamic Republic of Iran from Afghanistan. An additional 35 tons of heroin flow from Pakistan to the Islamic Republic of Iran every year, so an estimated total of 140 tons of Afghan heroin enter Iran each year. The estimated heroin user population in the Islamic HEROIN CONSUMPTION IN EUROPE (EXCLUDING THE RUSSIAN FEDERATION) Region Heroin consumption (tons) Eastern Europe 4.4 Southern Europe 2.4 Western Central Europe 80 Total 87 Source: UNODC, Addiction, Crime and Insurgency - The transnational threat of Afghan opium, Vienna 2009 Republic of Iran is around 400,000 individuals, consuming, at a rate of about 35 grams per year, almost 14 tons of heroin annually. A sizeable portion of this flow - an average of 16 tons of heroin or 11 per cent of the total heroin flow to the country is seized by Iranian law enforcement annually. This leaves approximately 110 tons available for export. Based on seizure data, most of this (95 tons) flows towards Turkey to meet European demand. Turkish counter-narcotics officials seize around 10 tons of heroin per annum while domestic heroin consumption is estimated at 1 ton. The remainder, tons, is trafficked to Western and Central Europe via Bulgaria/Greece and through the Balkan countries. This quantity is almost sufficient to meet European demand, as a total of 87 tons of heroin are estimated to be consumed in Europe per annum. The bulk (92% or 80 tons) is consumed in Western and Central European countries. Four countries (United Kingdom, Italy, France and Germany), account for 60% of the total heroin consumption in Europe. HEROIN CONSUMPTION DISTRIBUTION BY COUNTRY 24 Country Annual heroin consumption (kg) Cumulative percentage in total Estimated number of heroin users Cumulative percentage in total United Kingdom 18,610 21% 321,440 20% Italy 17,680 42% 305,360 39% France 9,570 53% 165,290 49% Germany 6,830 60% 117,940 56% Rest of Europe 34, % 703, % Total 87,160 1,613,500 Case studies of transnational threats 135
142 HEROIN IMPLICATIONS FOR RESPONSE A global market has developed around the trade in Afghan opiates, involving millions of people in many countries and regions. In one way or another, wittingly or not, they act as agents of that market. Opium farmers, traders in chemical precursors, heroin manufacturers, organized criminal groups, insurgents, corrupt law enforcement officials, transporters, money launderers and drug users all play a part in the operation of what has become a huge transnational illicit economy, with a yearly turnover in the tens of billions of dollars. Yet, our understanding of that economy remains surprisingly fragmented, as does the response to the problem. Historically, efforts have tended to focus on the elimination of illicit opium production. National supply-side efforts have been successful, in some cases spectacularly so. Illicit opium production has been virtually eliminated in Turkey, the Islamic Republic of Iran, Pakistan, Thailand, the Lao People s Democratic Republic, China and Lebanon. Other states including Mexico, Colombia and Myanmar have not yet managed to completely halt production, but have certainly significantly curtailed it, periodic resurgences notwithstanding. Nevertheless, while illicit opium production was moving from one area to another and becoming increasingly concentrated in Afghanistan, global illicit opium production increased by a factor of eight during the last three decades. Given the very strong concentration of today s global illicit opium production in one place, one could legitimately hope that eliminating poppy cultivation there could be a most effective way of dismantling the transnational opiate market. Unfortunately, the insurgency in Afghanistan has created a formidable obstacle to law enforcement and alternative development measures, and national and international efforts could not stop the expansion of opium production after its resumption in that country in Significant declines in 2008 and 2009 were good news, but the security situation remains a serious problem and it is very uncertain if this positive trend will continue. The solution to the transnational trade in Afghan opiates requires a response that reaches well beyond the opium producing provinces of Afghanistan. Clear steps in that direction have been made by the international community, particularly through what has come to be known as the Paris Pact. In 2003, representatives of 55 nations and 13 international organizations met in Paris with the aim of developing a comprehensive, balanced and coordinated national and international response to the Afghan opium problem. The Paris Pact members, with the support of UNODC, created a consultative framework for the exchange of information on drug trafficking trends, piloted an automated donor assistance mechanism and helped to develop the Rainbow Strategy. The strategy is made of a set of distinct components that address various issues, such as border control between Afghanistan and its neighbors, the illicit trade in precursors, opiate-related financial flows to and from Afghanistan and preventing and treating opiates addiction and HIV/ AIDS in the region. While progress in international collaboration has been made, more needs to be done. The history of drug control has shown that disjointed efforts could turn local successes into global failures. Opiate production and trafficking have been displaced from one area to another, and often to places where geography, instability and other obstacles to governance made it particularly intractable. When reduced in one country, heroin has increased in another and unabated world demand has continued to stimulate global supply. National and international drug control agencies have long been familiar with the heroin problem. Despite that experience,f they could not stop its growth during the last three decades. Eliminating or significantly reducing the world heroin market would thus require developing a more effective approach than in the past. What can be done? The first thing is to identify and remedy the biggest shortcomings of past approaches. Governments have recognized an essential one: the lack of integrated approaches. In a 2009 Political Declaration, United Nations Member States decided to make decisive progress by 2019 and acknowledged the importance of promoting, in order to enhance the effectiveness of drug control measures, an integrated approach in drug policies. 31 The associated Plan of Action stressed the need to address supply and demand reduction together : While drug trafficking is a multifaceted issue than can be effectively tackled only by reducing both supply and demand, this interlinkage is often not taken into account. 32 The international community needs to strengthen the link between supply and demand reduction measures and to better integrate national efforts in the framework of an international strategy on the scale of the market. To do both, getting a better understanding of the transnational heroin economy is a matter of urgency. 136 TRANSNATIONAL ORGANIZED CRIME THREAT ASSESSMENT
143 6 FIREARMS
144
145 6 FIREARMS The trafficking of firearms is unlike many of the other forms of trafficking discussed in this report because firearms are durable goods. 1 Unlike drugs, rhino horn, or counterfeit pharmaceuticals, a wellmaintained AK-47 will last indefinitely. As a result, there is little need for a continuous contraband flow. Trafficking tends to be episodic, often from an established stockpile to a region descending into crisis. In addition, the modern pistol or assault rifle represents a mature technology, so current weapons holders do not need to regularly update their stock to remain competitive. There has been very little innovation in small arms design in the last 50 years it appears there are few ways to make small arms more accurate or more deadly than they are today. Consequently, the number of new small arms purchased each year is only about 1% of those already in circulation. Even the world s most innovative militaries only update their small arms every second decade or so. As the global turnover in the licit arms industry is limited, the same is likely true for the illicit arms industry. Many still-functional weapons were distributed in developing countries during the Cold War and thereafter, and since weapons destruction has been limited in many parts of the world, there is little need to import new weapons into these regions today. The value of the documented global authorized trade in firearms has been estimated at approximately US$1.58 billion in 2006, with unrecorded but licit transactions making up another US$100 million or so. 2 The most commonly cited estimate for the size of the illicit market is 10%- 20% of the licit market, which would be about US$170 million to US$320 million per annum. 3 There are two primary markets for illicit arms those who need weapons for criminal purposes, and those who need them for political ones. Firearms for crime For criminals, there are often more immediate sources of firearms than those trafficked internationally. In most cities in the developed world, there is limited use for military-type weapons (see Box), and so the demand is for concealable handguns. For example, despite availability of a wide range of small arms in the United States, including semi-automatic assault rifles, 88% of firearm murders in 2008 were committed with handguns, 4 and earlier studies have found the same for 87% of all violent firearms offences. 5 Firearms used in crime are often diverted from the legal handgun market that exists in many countries. If handgun controls are tight in a country, they may be looser in a neighbouring one, and while the trans-border movement of these weapons could be considered trafficking, the volumes are rarely big or concentrated enough to be deemed an organized trafficking flow. To get a sense of the relative value of the market for firearms compared to other forms of contraband, it helps to look at some concrete examples. On 16 November 2009, the Nicaraguan Government made what was hailed as one of the largest seizures of weaponry ever made by the Nicaraguan authorities 6 a consignment of arms for the local representatives of the Mexican Sinaloa cartel. The shipment comprised 59 assault rifles, two grenade launchers and 10 grenades, eight kilos of TNT and nearly 20,000 rounds of ammunition. While this sounds impressive, the total value of this shipment was likely less than US$200,000 at point-of-sale. Three days later, the Nicaraguan navy seized 2.4 tons of cocaine off the Caribbean coast. The value of this shipment was at least 400 times as much, around US$80 million in US wholesale markets. One area where criminal weapons flows could conceivably provide attractive long-term profits for organized groups is the movement of weapons from the USA to Mexico, one of the two trafficking flows discussed further below. Due to a constitutional provision that asserts that the right to bear arms must be protected in a free state, the United States has the most heavily armed civilian population in the world, and so opportunities for diversion by theft are plentiful. But, as will be discussed, it appears that most of the guns trafficked into Mexico are actually purchased legally and then transported clandestinely across the border. Firearms for conflict The second source of demand for illicit weapons demand from groups whose objectives are political rather than criminal emerges when a set of militants finds the resources to equip an unauthorized force, or when a state subject to international embargoes attempts to circumvent these controls. Similar to criminals, insurgents may be able to access the weaponry desired from local sources, either stealing, renting or purchasing weapons from the police and military. In particular, poorly resourced insurgents may have to fall back on whatever is available locally. State actors and some insurgent groups may have state allies willing to shuttle Case studies of transnational threats 139
146 FIREARMS FIG. 131: CIVILIAN FIREARMS OWNERSHIP, 2006 OR LATEST YEAR AVAILABLE Top ten USA 88,8 Yemen 54,8 Switzerland 45,7 Finland 45,3 Serbia 37,8 Cyprus 36,4 Iraq 34,2 Uruguay 31,8 Sweden 31,6 Norway 31,3 Source: UNODC International Homicide Statistics; Small Arms Survey 2007: Guns and the city. Civilian firearms ownership rate (per 100 inhabitants), 2006 or latest year available Lack of data UNODC / SCIENCES PO FIG. 132: milions TOTAL CIVILIAN FIREARMS HOLDINGS, SELECTED COUNTRIES Although clandestine cross-border movement does occur, it is often easier to ship the weapons through regular commercial channels, relying on false or fraudulently acquired paperwork and/or corrupt officials to ensure passage. To get to their final users, a combination of licit shipping and clandestine movement may be required. But, in theory, the organized crime group responsible for the trafficking could be as small as one well-placed broker and his conspirators on the receiving end. The rest of the people in the trafficking chain may be comporting themselves entirely within the ambit of the law. 0 United States India China Germany France Brazil Mexico Russian Federation Yemen South Africa England and Wales Source: Elaborated from estimates in Small Arms Survey 2007 Ukraine Colombia weaponry around the international agreements in what is often referred to as the grey market. It remains unclear what share of transnational arms trafficking could be considered organized crime, and what share can be attributed to those with political, rather than economic, motivations. In practice, firearms trafficking is similar in nature to the trafficking of any other ostensibly licit good. Firearms flows should be relatively easy to document compared to consumables, since each weapon should contain unique serial numbers that could be traced back to the manufacturer and original owner. At the very least, the make and model of the weapon should give some clues as to its origin when a criminal seizure is made. But, remarkably, no international database of firearms seizures exists. To document contraband flows, analysts rely on other sources of information. Some information on firearms stocks is available, for example, and these data give an indication as to the most likely sources of military arms. A key source historically has been the armouries of the 140 TRANSNATIONAL ORGANIZED CRIME THREAT ASSESSMENT
147 6 former Soviet Union and Eastern Bloc countries. After the end of the Cold War, many of these states were left with considerable stockpiles in an environment of declining military spending, low regulation, and high economic insecurity. These resources were quickly exploited by those with the logistic capabilities to transport them to combat zones, such as the civil wars that afflicted Africa in the 1990s. But many of these stockpiles remain, and grow as countries in transition continue to downsize their militaries. To get a sense of where the stockpiles are most acute, estimates of the size of the largest firearms arsenals in the world can be compared to the size of the active military in each country. Where there are many more weapons than there are soldiers to use them, this could be seen as a point of vulnerability to firearms trafficking FIG. 133: 54 Ukraine 29 Russian Federation 22 Viet Nam FIREARMS PER ACTIVE DUTY SOLDIER, TOP 10 NATIONAL ARSENALS 19 China (including Taiwan) Germany DPR of Korea 10 9 Rep. of Korea Turkey Source: Elaborated from data from Small Arms Survey and International Institute for Strategic Studies In this analysis, Ukraine emerges as the country with the most spare firearms per active duty soldier. 7 It is likely that the absolute size of the surpluses in China and the Russian Federation are larger, but, given the size of their militaries and their role in geopolitics, it is more likely that these surpluses might be reabsorbed in the future. In contrast, it is difficult to imagine a situation in which the Ukrainian military would grow to the point where it would need the estimated seven million small arms available. There are many documented cases where arms from the Ukraine have been illegally diverted. For these reasons, it is the subject of the second flow study below. 7 I.R of Iran 5 India Are military weapons used in street crime? Handguns have obvious advantages over long arms for use in street crime. They can be concealed and carried constantly; they are easier to use at close quarters; and they are every bit as deadly. But they can be difficult to find in many developing countries, since few can afford them. Criminals wishing to use firearms in poorer countries would have to make use of military arms left over from past conflicts, or somehow access (buy, rent, steal) handguns from the police. Given that most people are unarmed and bullets are expensive, bladed weapons, which may also have agricultural uses, may be more commonly used in crime. For example, in South Africa, a country with very high murder rates and widespread availability of both military and civilian firearms, the majority of murders are still committed with sharp instruments, and less than 30% are committed with a gun. 8 In 2007/2008, for the first time, docket research indicated that guns had outpaced knives as the most common weapon used in robberies in South Africa. 9 In states where handguns are accessible, most criminals prefer to use them. Military weapons may be used, however, when criminal conflict becomes tantamount to a low intensity military conflict. Some of the best known examples include conflicts in the favelas of Brazil and some states in Mexico. The Mexican example is discussed in the flow study below. In Brazil, an analysis of over 200,000 firearms seized between 1974 and 2004 in the state of Rio de Janeiro found that just under 92% were civilian-type arms (68% were revolvers, 16% pistols, and 8% shotguns). Less than 2% were assault rifles or submachine guns, and 82% were manufactured in Brazil. Some 70% of the weapons seized chambered either 38 short or 32 short rounds. In other words, in one of the areas best known for the use of military arms, smaller weapons were far more commonly seized by the police. 10 An updated study found that assault rifles had indeed increased their share of the weapons seized in crime in the city of Rio de Janeiro after 1992, but only to 4%. The share of pistols also increased while the share of revolvers decreased. BREAKDOWN OF FIREARMS SEIZURES IN RIO DE JANEIRO OVER TIME 40,000 35,000 30,000 25,000 20,000 15,000 10,000 5, Revolvers Garruchas (deringers) Assault rifles Pistols Single-shot shotguns Other Source: Small Arms Survey, Viva Rio, ISER 11 In short, even in those few countries where military weapons are used by criminals, handguns still seem to be preferred for most forms of street crime. Case studies of transnational threats 141
148
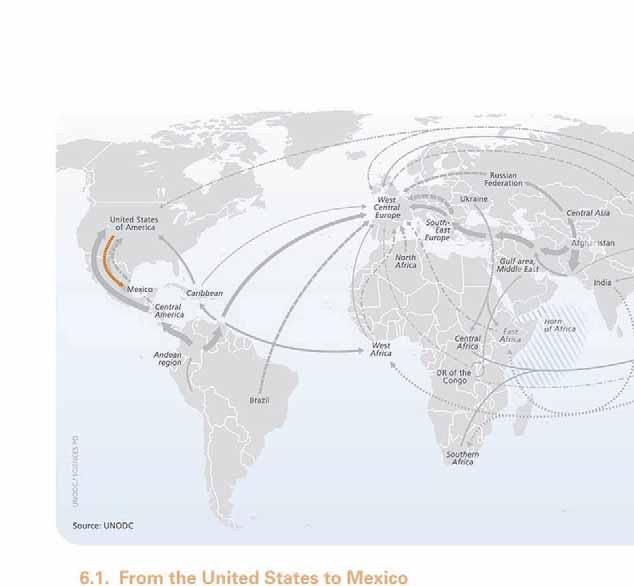
149
150 FIREARMS FIG. 134: 10 CALIFORNIA Los Angeles 20 Tijuana Mexicali Nogales Main routes of firearms trafficking Origin of weapons seized in Mexico, in % Sources: UNODC What is the nature of this market? Addressing the United Nations Security Council, Mexican President Felipe Calderón recently said: Trafficking of small arms and light weapons causes around three thousand deaths every day globally. Mexico exhorts to the members of the Security Council to look for formulas to restrain this illicit trade, notwithstanding the right of each State to buy the armaments necessary for its legitimate defense, to maintain public order, and protect the rights of the citizens. 12 He was clearly thinking of his own country, where, despite tough firearms laws, armed violence related to the drug cartels is said to have dramatically reversed a long-term decline in homicide and resulted in over 10,000 deaths in recent years. The United States is a convenient source of weapons for criminals in Mexico. The United States is the world s largest exporter of small caliber ammunition and military small arms and light weapons. It is also the world s largest importer of small caliber ammunition, sporting shotguns, and pistols and revolvers. 13 As noted above, it has the most heavily armed civilian population in the world, with about one quarter of all adults having at least one firearm. The gun trade in the United States is subject to competitive pressures, so weapons are also inexpensive in comparison to countries where firearms sales are highly regulated, like Mexico. Firearms are relatively easily acquired in the United States. Firearms ownership is restricted for those convicted of serious crimes, but every other adult FIREARMS TRAFFICKING FROM THE USA TO MEXICO Phoenix UNITED STATES OF AMERICA ARIZONA 10 Note: 31% of seizures are of unspecified origin 39 Ciudad Juárez Chihuahua TEXAS Monterrey Culiacán Durango Ciudad Victoria Tepic MEXICO Guadalajara Mexico City Morelia Veracruz Oaxaca Dallas Houston UNODC / SCIENCES PO Number of homicides FIG. 135: 18,000 16,000 14,000 12,000 10,000 8,000 6,000 4,000 2, NUMBER OF HOMICIDES IN MEXICO, Source: Instituto Nacional de Estadística y Geografía American has the right to own as many firearms as desired. Although the operation of licensed gun shops is regulated by the national government, firearms can also be legally acquired from private individuals at gun shows. For these sales, no background check is conducted and the sale is not recorded or registered. In contrast, there are no retail gun shops in Mexico. The military has the monopoly on legal sales and private handgun ownership is restricted to the lower caliber weapons (.38 or below). For obvious reasons, criminals in the United States avoid using weapons registered in their names. Research among convicts in the United States shows that some purchased their weapon directly from a licensed dealer, but most acquired it through social networks or from criminal sources. 15 There is a large market in stolen firearms in the US: the FBI received an average of over 274,000 reports of stolen firearms per year between 1985 and 1994, most of which were handguns. 16 Although US criminals may favour stolen firearms, those involved in trafficking US firearms internationally seem to prefer to purchase from licit sources, perhaps because ownership tracing is less of a concern. Large numbers of weapons can be safely and predictably acquired this way. Federally licensed firearms dealers are required to report the sale of two or more handguns to the same individual in a five-day period, but the large number of retailers makes it possible to employ people to make a series of purchases from different establishments. In addition, an unlimited number of long guns, including semi-automatic assault weapons, can be purchased without a reporting requirement. In 2000, the United States Department of Alcohol, Tobacco, and Firearms (ATF) conducted a study of 144 TRANSNATIONAL ORGANIZED CRIME THREAT ASSESSMENT
151 6 FIG. 136: Drug dealer/street vendor 21% Fence/black market 8% Theft/burglary 10% STATE PRISONERS REPORTS ON THE SOURCE OF THE WEAPON USED IN THE OFFENCE FOR WHICH THEY WERE CURRENTLY INCARCERATED (USA) Other 7% Licensed dealer 14% Firearms trafficked by licensed dealer, including pawnbroker 31% Bought from family or friend 13% Otherwise sourced from family or friend 27% FIG. 137: Trafficking in firearms stolen from residence 3% Trafficking in firearms stolen from FFLs 5% TYPE OF TRAFFICKING BY NUMBER OF WEAPONS INVOLVED IN ATF INVESTIGA- TIONS (USA) Trafficking in firearms stolen from common carrier 2% Firearms trafficked by straw purchaser or straw purchasing ring 20% Trafficking in firearms at gun shows and flea markets 21% Source: United States Bureau of Justice Statistics Source: ATF Trafficking in firearms by unlicensed sellers 18% federal gun trafficking investigations in the United States, and found that licensed dealers were involved in trafficking the largest share of the firearms investigated. Also common were straw purchasers citizens with clean records sent to buy weapons for those who could not purchase them on their own behalf and purchases made at gun shows. Research has repeatedly shown that a large number of the licensed weapons used in crime were purchased from a small number of distributors, suggesting that some retail owners may be complicit in straw purchases. Theft was implicated in only 10% of the firearms investigated. 18 As discussed below, it appears that the flow of firearms from the United States to Mexico is largely conducted by straw purchasers, who pass the weapons on to cross border smugglers. How is the trafficking conducted? Subcomandante Marcos, the Zapatista spokesman, has said that the most common way of importing firearms for the rebel cause was through hormiga (ant) trafficking from the United States. 19 This technique also appears to be popular with criminal traffickers. 20 A large number of legal buyers pass on the weapons to a large number of cross border smugglers, who drive very small batches of weapons across the border concealed in private vehicles. It appears that most of the weapons are acquired near the border. There are 6,700 gun dealers along the border with Mexico, accounting for 12% of the 55,000 registered dealers in the United States. 21 Some 70% of the firearms seized in Mexico and traced to the United States between 2004 and 2008 came from just three border states: Texas (39%), California (20%) and Arizona (10%). 23 While thousands of illegal migrants make their way into the United States at unauthorized crossing points each year, it appears that most of the weapons entering Mexico do so at the official points of entry. Most of the firearms recovered at the border have been seized in small amounts during inspections of private vehicles entering Mexico. 24 Traffickers move the weapons in consignments as small as two guns per car, since these shipments are less likely to attract attention if detected. 25 About 88 million passenger cars cross the border each year, 26 and most of those crossing the border do so every day, because many work on one side of the border and live on the other. A single smuggler following this ebb and flow can transport more than 500 weapons per year in loads too small to be suspected as organized trafficking. On entering Mexico, it seems that many of the weapons remain close to the border: Tamaulipas has been the source of some of the largest seizures of firearms and ammunition. The rest are trafficked by road to points further south along well established routes. According to one US government agency: Once in Mexico, the firearms are generally deposited in border towns or trafficked along major highways to their destinations. The transporter drops off the firearm or firearms at a set location for pick up and use by members of a drug cartel. 27 Case studies of transnational threats 145
152 FIREARMS Who are the traffickers? There is some dispute concerning the extent to which the cartels coordinate the importation of firearms to Mexico. According to the United States Bureau of Alcohol, Tobacco, and Firearms: [Drug trafficking organizations (DTOs)] operating in Mexico rely on firearms suppliers to enforce and maintain their illicit narcotics operations. Intelligence indicates these criminal organizations have tasked their money laundering, distribution and transportation infrastructures reaching into the United States to acquire firearms and ammunition. These Mexican DTO infrastructures have become the leading gun trafficking organizations operating in the southwest United States. 28 But according to the Attorney General of Mexico: At the present time, we have not detected in Mexico a criminal organization, domestic or foreign, dedicated to arms trafficking Drug trafficking organizations do not control firearm trafficking; their distribution networks contact people who buy weapons. These people are necessarily linked to the organization, but they work semi-independently. 29 Given the agreement that hormiga trafficking is the order of the day, it seems unlikely that the carteles orchestrate the purchasing and smuggling of weapons. Coordinating the actions of hundreds of buyers and smugglers would be a logistical nightmare. On the other hand, if it were well-known in the border underworld that a firearm bought in the US could be sold for much more on the other side of the border, then a large number of players could be coordinated by nothing more than the invisible hand of the market. A 2009 review of 21 cases of firearms trafficking from the United States to Mexico concluded, The vast majority of the firearms listed in the court documents were acquired from Federal Firearms License holders, mainly through the use of straw buyers 30 Straw buying is illegal in the United States, and it is greatly facilitated by willing blindness on the part of complicit retailers. Research has repeatedly shown that a very small number of retailers are responsible for a very large share of the traceable weapons that are used in crime. So the first element in the organization would be a wellknown network of licensed vendors who do not ask questions when clients buy from a shopping list. But even with a cooperative source, there is value in novelty when conducting straw purchases, especially if handguns are the target. So there is probably substantial turnover in the small army of people making straw purchases. The same pertains to the smugglers, moving arsenals across the border a gun or two at a time. It is likely these people play a role similar to drug mules. They are disposable tools, rather than decision makers, in the gun trade. The consistent players in this market are independent brokers, who communicate with the carteles, arrange financing, coordinate the lesser players and conduct the final sale. As in most industries, there are probably more and less successful brokers operating in parallel, coordinating both large and small operations, although the hormiga method likely constrains growth. This is undoubtedly organized crime, but organized crime of a type frustrating for law enforcement, since there are too many loosely connected players to make much headway through arrests and seizures. In the end, the cross-border trade in arms is best seen as a market, rather than a single criminal enterprise or a series of enterprises. The barriers to entry in this market are low: any US citizen with a clean record can buy an unlimited number of firearms, and anyone with a car can drive them across the border. Brokers only need a connection to a single buyer in Mexico. If any element of this chain were to be removed, they are very easily replaced. How big is the flow? There are two sources of data from which a firearms trafficking flow could be estimated: data on demand and data on seizures. Starting with demand, there is a limit to the amount of new firearms the Mexican criminal market can absorb. As discussed in the opening section of this chapter, there is little need to import firearms into areas where substantial quantities of weapons already reside. According to expert estimates, despite having restrictive firearms ownership laws, Mexico has the seventh largest civilian firearms holdings in the world, some 15,500,000 firearms, about one third of which are registered. 31 This suggests around 10 million unregistered weapons, or enough to arm one in three of the adult males in the country. Mexico s underworld appears to be well armed, and further import would be necessary only to replace lost or stolen firearms or to access specialty weapons. The consensus among both US and Mexican authorities is that the primary client of the gun traffickers are the major drug cartels. Calculating the number of cartel members should give a rough 146 TRANSNATIONAL ORGANIZED CRIME THREAT ASSESSMENT
153 6 understanding of the number of firearms needed to arm them. Depending on how they are counted, there are between four and ten large cartels, which periodically incorporate, fragment into, or eliminate smaller groups. The Mexican federal authorities use a simplified classification in which the cartels are reduced to four major groups: the Arellano Felix Organization (also known as the Tijuana Cartel) the Pacific Cartel (including the Beltran Levya Organization, also known as the Sinaloa Federation) the Gulf Cartel (including the Zetas and La Familia Michoacana) the Carrillo Fuentes Organization (also known as the Juarez Cartel) Between 1 December 2006 (when President Calderon took office) and 15 February 2009, over 40,000 members of these four organizations have been arrested. This represents just under 20,000 arrests per year. The number of drug trafficking arrests has doubled since 1993, and for the past two years has also been around 20,000 per annum. The question is: what share of total members do these arrests represent? To understand the interdiction capacity of the Mexican government, it is useful to look at the amount of drugs entering and exiting the country. According to United States estimates, in 2007 between 545 and 707 tons of cocaine left South America for the US, of which 90% transited the Central America/ Mexico corridor. 32 That same year, the Mexican FIG. 138: 20,000 18,000 16,000 14,000 12,000 10,000 8,000 6,000 4,000 2, ,633 CARTEL MEMBERS AND OTHERS ARRESTED FOR OFFENCES AGAINST PUBLIC SAFETY (DRUG CHARGES), 1 DECEMBER FEBRUARY ,895 10,417 Source: Attorney General of Mexico 14,410 government seized 48 tons of cocaine. 33 This represents some 8-10% of the cocaine entering the country. If the share of cocaine seized corresponds to the share of cartel members arrested, then one in ten cartel members would be arrested each year. This suggests a total cartel membership of about 200,000 members, larger than most estimates. To equip each with a firearm would require 200,000 weapons, or about 2% of the unregistered weapons in the country. This represents the minimum cartel demand for illicit weapons. With regard to firearms seizures, there has been a dramatic increase in recent years. According to Mexican federal law enforcement, between 1 December 2006 and 1 April 2009, they seized 38,404 small 18,827 Tijuana Juarez Gulf Sinaloa Others FIG. 139: DRUG TRAFFICKING ARRESTS IN MEXICO, ,000 Others 20,000 15,000 10,000 1, ,347 3,056 1,304 2,113 5,836 9, ,143 8,881 1,045 1,008 1,148 2,380 13,482 11,350 Amphetamine-type stimulants Cannabis Cocaine 5, ,730 8,248 6,858 6,212 6,215 7,049 3, Source: UNODC ARQ Case studies of transnational threats 147
154 FIREARMS FIG. 141: 25,000 20,000 15,000 10,000 5,000 0 FIG. 140: DISTRIBUTION OF FIREARMS SEIZURES IN MEXICO BY STATE, DECEMBER 2006 TO MARCH 2010 Other 45% arms from organized crime groups. Of these, over half (21,308) were long arms, of which the majority were assault rifles. 34 These are weapons seized by federal law enforcement, which focuses on organized crime, particularly drug trafficking. Most of these weapons are therefore likely to have been seized from drug traffickers and cartel members. The Mexican government placed national seizure total during the Calderon administration at 78,961 in March 2010, which would amount to about 25,000 per year, of which about half were handguns. Most of these weapons were seized in small quantities. By far the single largest seizure, made in November 2008 in Reynosa, was only 424 firearms, less than 1% of the national seizure total. Hand guns Long arms Firearms traced to US 3,520 3,156 2,487 2,057 1,959 1,733 Jalisco 7% 4,978 4,549 Source: Attorney General of Mexico Tamaulipas 7% Source: Attorney General of Mexico Michoacán 23% NUMBER OF FIREARMS SEIZED IN MEXICO BY THE FEDERAL AUTHORITIES VERSUS FIREARMS TRACED TO THE UNITED STATES FROM ALL SOURCES, ,105 11, Sinaloa 9% Chihuahua 9% But not all of these weapons were imported from the United States. A frequently cited statistic is that 90% of the firearms submitted by the Mexican government and successfully traced by US authorities were found to have originated in the United States. But, as has been discussed extensively elsewhere, this does not mean that 90% of the weapons in Mexico came from the United States. Since the US tracing process involves searching the federal firearms databases, which are largely comprised of sales records submitted by federally licensed firearms dealers, it should be expected that almost all of the traceable weapons came from the United States. But two thirds of the weapons seized by the Mexican authorities were never submitted for tracing. In 2008, 27,721 firearms were seized by the Mexican federal authorities, of which 7,200 were submitted to the ATF for tracing. Given that tracing was selective, it is unlikely that many firearms would be submitted that were clearly not from the United States. As a result, the pool of firearms submitted for tracing cannot be said to be representative of the firearms seized or the firearms in circulation. According to the ATF, about 75% of the weapons traced between financial years 2005 and 2007 were handguns, with only 25% being long guns, some of which could have been military weapons. In financial year 2008, however, about 25% of the weapons traced were semi-automatic variants of AK-47 and AR-15 rifles. As of 2008, the Mexican authorities had submitted 25 machine guns for tracing, of which six were traced back to US military sources. 35 The 7.62x39 mm ammunition used in the AK-47 has been seized in large quantities in Matamoros on the US border. Tamaulipas leads Mexican states in ammunition seizures, including the single largest in the country s history: nearly one million rounds seized in Reynosa in November Over half a million rounds were seized in Mexicali in January In addition to these US sources, there are a number of possible alternative sources for weapons, particularly the military weapons that appear to be growing in popularity in the cartel wars. It is possible they were diverted from the Mexican military, perhaps alongside the sort of desertion of troops to the carteles that gave birth to the Zetas. In fact 1.74% of the weapons (403 firearms) submitted to the ATF turned out to be Mexican military arms. There is also growing evidence of importation of military arms, including grenades, from the considerable stocks left over from the civil wars in Guate- 148 TRANSNATIONAL ORGANIZED CRIME THREAT ASSESSMENT
155 6 mala, El Salvador and Nicaragua, or from corrupt elements in the military of these countries. During the Calderon administration, the government has seized nearly 1,500 firearms, some 850 grenades, and over 140,000 rounds of ammunition in Chiapas, on the border with Guatemala. Military weapons could be trafficked along with cocaine all the way from Colombia or the Bolivarian Republic of Venezuela, or even alongside ephedrine from China. 36 If half the long arms were from countries other than the United States, at most 75% of the seizures made in Mexico were of US origin, or about 21,000 arms in The seizures include not only weapons imported in 2008, but rather are drawn from the pool of all weapons available to organized criminals in the country. If a similar interdiction rate is taken for guns as for drugs and cartel members (10%), then there would be about 210,000 US weapons held in stock by the cartels. Since this is adequate to meet basic demand, and firearms have been trafficked into the country for many years, it is likely that the current flow is simply to compensate for attrition. The various US agencies involved in border control also seized about 10,000 arms in 2008, so it appears that about 30,000 arms are purchased in the United States, of which some 20,000 make it to Mexico to be sold. This would represent just under five firearms from each of the licensed dealers operating along the border, although in reality the sales are much more likely to be concentrated in a few complicit dealerships. At a price of US$1,000 per weapon, this would represent a flow worth US$20 million per year, or about 10% of the global estimate for the value of the illicit firearms market. Case studies of transnational threats 149
156
157
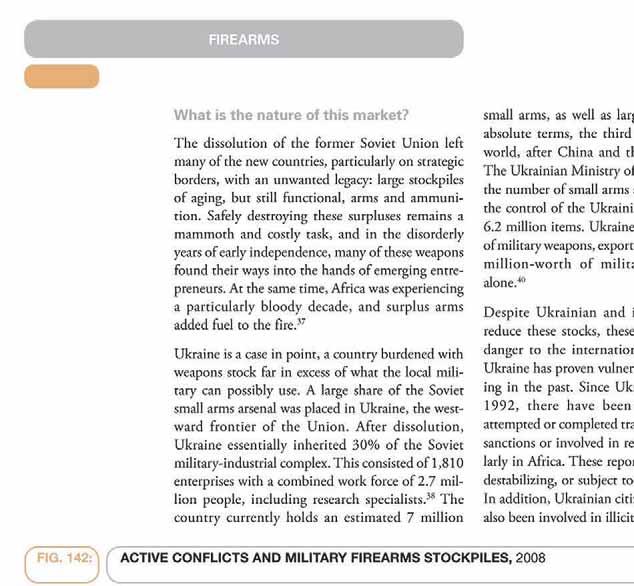
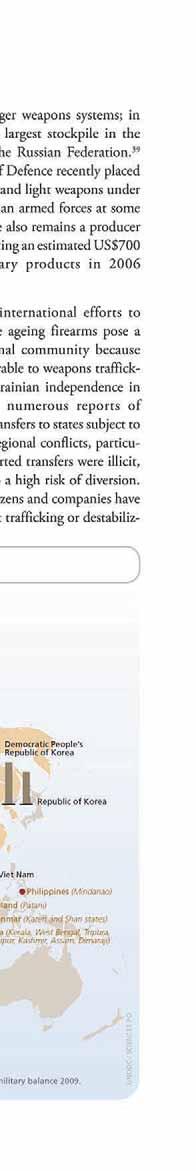

158
159 6 ing transfers from Ukraine and other states. Reported cases falling into one of these two categories include transfers to: Afghanistan (1996) Angola (1992, 2001) Bosnia and Herzegovina (1992) Burkina Faso (2001) Chad (2001, 2007, 2008) Cote d Ivoire (2001) Croatia (1992, 1994) Democratic Republic of the Congo (2001, 2009) Ecuador (1999) Equatorial Guinea (2004, 2009) Eritrea (1999, 2001) Ethiopia (1999) Former Yugoslav Republic of Macedonia (2001) Guinea (2003, 2004) Iraq (2000) Islamic Republic of Iran (2000, 2001) Kenya (2007, 2008) Liberia (2001) Libyan Arab Jamahiriya (1996, 2006, 2007) Sierra Leone (1993, 2001) South Sudan (2007, 2008, 2009) Sudan (2004) United Republic of Tanzania (1994, 2001) Yemen (1999) Clients for trafficked arms have also included insurgents such as the Tamil Tigers (1994), the United Front for the Total Independence of Angola (UNITA) (2000) and transnational organized crime groupings such as the Colombian Cali cocaine cartel (1996). Thankfully, both transnational and domestic wars and conflicts have declined since the early 1990s. Many of the current conflicts are longstanding, reducing the demand for trafficked weapons. 41 But as noted above, there have been few innovations in firearms design in recent years, so weapons from the Cold War retain their attraction, particularly in developing countries. Today, Ukraine is confronted with the challenge of managing these stocks in the context of the global economic crisis. Ukraine had a GDP per capita of just over US$3,000 in 2007, placing it below poor countries like Albania and Ecuador. 42 Until recently, the Ukrainian economy was growing rapidly, but GDP shrank by 14% in Both inflation and unemployment figures have risen, and the currency has slipped considerably in value. In this context, resources available for oversight may become tight. Ukraine also suffers from corruption: In the 2009 Transparency International corruption perceptions index, Ukraine scored in the bottom 20% of countries ranked, garnering a 2.2 score on a 10-point scale. As explained below, corruption is essential for large-scale weapons trafficking. Both the shrinking economy and lingering corruption increase the risk that weapons stockpiles will be misdirected. Especially since the Orange Revolution of 2004, the Ukrainian government has taken measures to address the flow of guns to embargoed areas, yet there is evidence that it continues. For 2009 alone, there is evidence that weapons originally sourced in the Ukraine have been transferred to the Democratic Republic of the Congo, South Sudan and Equatorial Guinea, in some instances by Ukrainian companies or brokers. 44 In addition, foreign arms brokers who have been identified as international arms traffickers by some governments have continued to access surplus Ukrainian small arms at least as recently as One example is a company in the Czech Republic, which acquired 4,000 Ukrainian Makarov pistols on the basis of an End User Certificate stating the destination of the weapons was Afghanistan. 45 Further, exports have been authorized to countries which, while not embargoed, should raise suspicions. Between 2004 and 2008, for example, Ukraine was apparently the most significant source of arms for Chad. 46 The United Nations is currently investigating the origins of 3,000 AK-47 type derivatives acquired by the Justice and Equality Movement (JEM) based in eastern Chad. 47 The UN panel has also recommended that the Chadian president s half-brother, Daoussa Deby, be subject to UN sanctions for violating the arms embargo on Darfur by supporting the transfer of arms to militias active there. 48 In 2008, the MV Faina affair (see Box) saw shipping of AK-type weapons from Ukraine to Kenya, despite the fact that the Kenyan forces use the NATO-standard ammunition; 49 the tanks that accompanied this shipment were later found to have been trafficked to South Sudan. 50 In 2009, Case studies of transnational threats 153
160 FIREARMS Ukrainian transport companies continued to transfer weapons from other countries to states such as Equatorial Guinea 51 where the risk of onward diversion is high. 52 In 2009, the United Kingdom began an investigation into companies registered in the UK that were sourcing arms in Ukraine for states in Africa in violation of controls. 53 Clearly, the large number of surplus firearms in the Ukraine leaves it vulnerable to exploitation by traffickers, and this trafficking is likely to continue until the surplus is addressed. How is the trafficking conducted? To arm a revolution or embargoed military, a large number of weapons is required. These weapons are either produced by tightly regulated companies or drawn from stocks controlled by a national military. In either case, it is generally difficult to steal and clandestinely traffic sufficient quantities to make the venture worthwhile. As a result, most military arms trafficking takes place under a veneer of legality. So long as the seller is willing, it is not difficult to provide sufficient documentation to justify authorization of a major export shipment. Like other commodities where the legality of a shipment is entirely dependent on paperwork, most large-scale arms trafficking hinges on corruption. The primary mechanism of international arms control is the end user certificate a document that verifies that the end user of the weaponry sold is a legitimate buyer and not an embargoed state or rebel group. But much of the diversion of arms occurs after the delivery to the nominal end users, a practice known as Post Delivery Onward Diversion (PDOD). In these cases, corrupt elements within the named destination state are complicit. If all the paperwork is in place, there may be no legal reason for the vending state to refuse the request for export. Another method is Point of Departure Diversion (PDD), where unauthorized or fake end user certificates provide arms traffickers with the documentation necessary to obtain arms export licenses. Rather than being delivered to the specified destination, the weapons are directly diverted to an embargoed state or group. This technique only works when the exporting state is negligent in verifying that the country named in the end user certificate has actually requested the arms. Corruption in the exporting country is implicit. Both forms of trafficking have been seen in firearms exports from the Ukraine. PDD should be controllable if officials are diligent in verifying the official request for export. But even in cases where the request is documented as genuine, there may be other reasons to deny permission. The requesting state may be known to favour one party or another in the conflict, or it may be known to suffer from high-level corruption. The brokers involved may be known to be shady, and there may be obvious signs that the transaction is something other than what it purports to be. As with arms trafficking anywhere in the world, these cases often involve the use of offshore holding companies to transfer and receive the money, as well as vessels flying flags of conve- Leonid Minin and Dmitri Streshinsky Probably the best-known Ukrainian arms trafficker is Leonid Minin. Though his case is dated, it still provides an instructive example of the way firearms and other weapons are trafficked. Dmitri Streshinsky is less notorious, but his activities follow a similar pattern. In 1999, Minin shipped 68 tons of small arms to Burkina Faso, ultimately bound for Liberia, at that time under embargo. The Ukrainian government issued an export licence based on an end user certificate allegedly issued by the Burkina Faso authorities, despite the fact that it had previously refused to ship arms to this country due to the risk of diversion. According to the contract, the Burkino Faso Ministry of Defence had authorized an off-shore, Gibraltar-based company called Chartered Engineering and Technical Services to act as intermediaries. Upon delivery in Burkina Faso, the arms were shipped onwards in a BAC-111 aircraft with an operating certificate from the Cayman Islands. The company that owned the aircraft, LIMAD, was registered in Monaco and belonged to Minin. In 2000, Minin coordinated a similar delivery of 113 tons of small arms to West Africa from Ukraine, including 10,000 AK-47 type assault rifles. He chartered a Russian company owned by an associate, Aviatrend, to transport small arms to Cote d Ivoire, also under embargo at that time. He was arrested later that year in Italy for possession of cocaine. Streshinsky also set up an off-shore company, Global Technologies Limited, registered in Panama but with an office in Kiev. He acquired weapons from Progress, the Ukrainian arms vendor controlled by the security service (the SBU), using end user certificates from Morocco and Egypt. Despite warnings from the SBU, both export licenses were signed by a cabinet minister and approved by then-president Kravchuk. The weapons were promptly shipped to Croatia, then (1992) under international embargo. 54 The second shipment was intercepted by the Italian navy due to a tip off from the SBU itself, and included some 30,000 AK-47s. The subsequent arrests included a number of Streshinksy s associates who were managing bank accounts located off-shore on the UK Channel Island territory of Jersey TRANSNATIONAL ORGANIZED CRIME THREAT ASSESSMENT
161 6 nience (see left Box). Although perhaps two thirds of maritime vessels are registered in low-vigilance countries, the same is not true for aircraft, so the use of these planes should raise suspicion. Since the shipments are ostensibly legal, the full range of mainstream mechanisms for shipping legitimate goods is available. By land, sea, or air, the port of departure and routing is entirely dependent on the location of the buyer and ordinary commercial concerns. Air transport is particularly favoured, using craft owned by the trafficker or his associates, as arms brokers prefer to control all aspects of the transaction from procurement to delivery. Some evidence of clandestine trafficking in firearms and other weapons from Ukraine has been detected, but most of this took place in the early years of independence, and there have been few recent cases. For example, in 1993, a group of soldiers in the Ukrainian city of Lugansk made a hole in the fence of a surplus depot and managed to steal eight antitank guided missiles. The group had managed to sell four before they were arrested, the rest were discovered in an apartment attic. 56 More senior officers have also engaged in theft, including a major in the Ukrainian Border Guards who commanded a unit close to the border with Moldova. On 24 August 1994, he was arrested with 4,320 rounds of 5.45 calibre ammunition and 78 pistols. 57 Some 300 weapons were stolen from the military base at Shepetovka, leading to the dismissal of officials of the Ministry of Defence as well as the commander of the Carpathian military district. 58 Who are the traffickers? Because large-scale arms trafficking is dependent on corruption, most transactions involve a combination of officials and international arms brokers. These brokers sell their connections, their access to fraudulent paperwork, and their transportation services to both insurgent groups and embargoed states. The brokers and their support organizations can clearly be described as a transnational organized crime groups, and may be involved in other forms of shady commerce, particularly involving natural resource extraction. The brokers themselves are a diverse group, with some originating in countries with large arms surpluses, some in regions with stability problems, and some from the wealthier nations. Most are multilingual and hold a number of passports. They operate chains of shell companies and often own small fleets of surplus planes and other vehicles (in particular, the Antonov and Ilyushin cargo aircraft that were sold off after the dissolution of the Soviet Union). Because warring parties may lack an international currency, brokers may take payment in the form of natural resource concessions, making money on both the sale of the arms and the sale of exported commodities. As a result, they may have a background in dealing in natural resources. In the years immediately after independence, relatively high-profile foreign traffickers visited the Ukraine to directly purchase weaponry. One example is Osman Ato, a well-known Somali warlord, who was sighted in Kyiv in April 1994 attempting to buy weaponry. 59 Since then, due to enforcement in the Ukraine, arms brokers have been forced to be more discrete, working through corrupt officials in the country. The MV Faina case One recent case of arms trafficking from the Ukraine would never have been detected if the vessel had not been hijacked en route. The MV Faina was a cargo ship flying under a Belize flag of convenience, owned by a Panama-based company, managed by a Ukrainian firm, and crewed mostly by Ukrainians. It was hijacked by Somali pirates in September 2008 and its crew was held hostage until February 2009, when a ransom of US$3.2 million was allegedly paid. The vessel was carrying approximately $33 million worth of grenade launchers, small arms ammunition and 33 battle tanks, allegedly bound for Kenya. Paperwork subsequently emerged indicating that the true destination was South Sudan. The T72 tanks, the largest and most easily identifiable element of the shipment, have been repeatedly sighted by observers 60 and Small Arms Survey reports that the SPLA has since confirmed the transfer. 61 The shipment captured was apparently the third in a series declared by Ukraine in its annual arms export report as licensed for export to Kenya. At least three contracts were signed with Ukrainian state-owned arms exporter Ukrinmash. These contracts included 40,000 AKM assault rifles, ammunition, and many heavier weapons, including the tanks. 62 The two other vessels involved in the three shipments were the Radomyshl and the Beluga Endurance both of which sailed in late The Beluga Endurance sails under the Antigua and Barbuda flag of convenience and was chartered for the shipment by an offshore company based on the Isle of Man. The Radomyshl sails under a Ukrainian flag and was chartered by a UK shell company comprised of two British Virgin Island companies. How big is the flow? As stressed above, arms trafficking to political combatants is episodic, and so it is difficult to speak of a consistent flow. During a crisis, demand may be high, only to subside as peace is restored. It is necessary to look at concrete figures for recent years and discuss volumes and values on that basis. Since almost all of the weapons diverted to embargoed parties go through the formal export procedure, these exports are reported. Since 2004, the Ukrainian government has published an annual Case studies of transnational threats 155
162 FIREARMS report on its arms sales, which is more comprehensive than those provided by most other major arms exporters. Ukraine s arms export control authorities receive between 5,000 and 8,000 export applications every year from Ukrainian arms manufacturers and stockpile vendors alone. Of these, only 2,500-3,000 are subsequently assessed as requiring an export licence. In 2003, some 2 or 3% were reported as rejected as most of them requested permission to export arms to countries against which international sanctions had been imposed. 63 This would mean that anything between 55 and 90 export licence applications were made on behalf of sanctioned clients every year, highlighting the ongoing attraction of Ukrainian arms to embargoed parties. At the end of 2005, the head of the parliamentary commission investigating cases of illegal arms and munitions sales declared that between 1992 and 1997, approximately US$32 billion worth of military equipment and munitions was stolen and illegally sold abroad. According to the commission, the main reason for such uncontrolled criminal activity was the absence at the time of relevant export control legislation regulating arms transfers. 64 Illegal arms sales peaked in 1996, when 114 companies were engaging in weapons transfers, but only 20% of the transactions were carried out by entities officially authorized by the Ukrainian government. While much progress has been made since that time, shipments like the MV Faina show that large scale exports continue to wind up in the hands of combatants. The contracts detail shipments to Kenya in 2007/2008 totalling 40,000 AKM assault rifles, hand-held RPG-7Vs, 14.5 mm and 23 mm anti-aircraft weapons. In addition to these lighter arms, the contracts covered 100 T-72 main battle tanks, BM-21 Grad 122 mm multiple-launch rocket systems as well as trucks, spare parts and large quantities of ammunition. 65 The value of this single deal has been estimated at more than US$2.5 billion, but most of this value derives from the tanks and other heavy arms. The value of firearms alone could be US$33 million. 156 TRANSNATIONAL ORGANIZED CRIME THREAT ASSESSMENT
163 6 IMPLICATIONS FOR RESPONSE It is clear that the large numbers of weapons available renders both the United States and Ukraine vulnerable to trafficking. It follows that reducing this availability would undermine organized criminal activity. In both instances, there are controls in place to prevent the misappropriation of weapons, but there are clearly problems with the implementation of these controls. Traffickers have found ways of skirting the regulations and moving guns across borders without drawing excessive attention from the authorities. This suggests that the regulations, and their implementation, need to be reviewed. received assistance in reducing weapons surpluses, but progress has been slow. Given the current economic situation, the need for assistance is greater than ever. Money invested in destroying weapons stocks today could pay dividends in conflict prevention tomorrow. The United Nations Programme of Action commits all parties to identity and destroy small arms surpluses, yet it is clear that these surpluses remain. The issue needs to be revisited, and renewed pressure put on leaky stocks. International support must be given: safely destroying weapons stocks is expensive, but it is cheaper than the alternative. While firearms are durable goods, ammunition supplies are in continual need of renewal. At present, ammunition is not normally given unique serial numbers and sales are rarely recorded. The ease of accessing ammunition limits its attraction as a criminal commodity, but lax controls represent a weak link in the efforts to control the violence caused by firearms. Like other commodities that can be used for both licit and illicit purposes, closer monitoring could make a world of difference. No matter how sound the regulatory system is, corruption can be its undoing. In both instances reviewed above, corruption is implicated: in the US, on the part of the Federal Firearms License holders, and in the Ukraine, among officials charged with authorizing weapons shipments. Measures taken to address corruption, including the use of sting operations, could dampen the flow of guns. Mexico already has many weapons, and the cartels could import them from a number of other sources even if the US supply were completely cut off. But even though US gun stores cannot be said to be the cause of the cartel violence, the problem remains: an under-regulated supply of guns is allowing criminals to arm themselves with little risk, and criminals are making money by trafficking these weapons internationally. By further investigating the ways traffickers are beating the system, the system can be strengthened to stop this abuse. The Ukrainian government has asked for and Case studies of transnational threats 157
164
165 7 ENVIRONMENTAL RESOURCES
166
167 7 ENVIRONMENTAL RESOURCES The topics discussed in this chapter lie at the intersection of two central areas of transnational organized crime: the theft and smuggling of a country s resource assets, and environmental crime. The trafficking of environmental resources is a key challenge for some developing countries. Many emerging economies are based on exporting raw products, but under-resourced governments may lack the capacity to regulate the exploitation of these assets. Rather than promoting economic progress, poorly managed natural wealth can become a cause of bad governance, corruption or even violent conflict. The best documented instances involve mineral wealth, such as oil, diamonds, gold or other valuable metals and ores. But biologic resources are also vulnerable, and their misappropriation and trafficking is an important form of transnational organized crime. There are many forms of transnational organized environmental crime, and as global regulations grow, new forms will emerge. Classically, there are two major subheadings under which these offences fall. One is crime related to pollution, in particular hazardous waste dumping and the trade in ozonedepleting substances (such as chlorofluorocarbons - CFCs). 1 The second is crimes related to illicit harvesting of natural resources, in particular threatened animal species, timber and fish. For reasons described below, this chapter deals with two important instances of environmental resource theft and trafficking: the trafficking of endangered species from Africa and South-East Asia to Asia as a whole, and the trafficking of timber from South- East Asia to Europe and Asia. Africa s wildlife population, including many large mammal species, is part of what makes the continent unique. It is the basis for a tourist trade that comprises a key part of many national economies. But widespread poverty and conflict have left this population exposed to poaching, and exotic animal products command high prices due to global demand, especially from Asia. This chapter looksparticularly at the markets for two of the best documented commodities: elephant ivory and rhinoceros horn. The poaching of large mammals in Africa receives considerable attention, but species in Asia are also under threat. There are only an estimated 3,200 tigers remaining in the wild, and the skin and bones command high prices. And while high value large mammals garner much sympathy, many other wild species are harvested in South-East Asia for traditional medicine, food and decor products, as well as being captured for the pet trade. In terms of volume and market value, this trade dwarfs that of the larger species, and much less is known about its long-term sustainability. South-East Asia is also home to some of the world s few remaining old-growth forests, containing many unique tree species, and the problem of timber trafficking is particularly acute. In order to protect these resources, national bodies have attempted to regulate the timber trade, but it is still possible to make money by skirting these controls, and illicit harvesting remains at unacceptably high levels. Demand for these hardwoods is broad, and consumers around the world may be unwittingly contributing to irreversible environmental damage. By concealing the nature and origin of this wood, organized crime makes this tragedy possible. These issues are inherently international, because all countries share a global ecosystem. The release of CFCs anywhere in the world affects the common ozone layer. Toxic waste dumping at sea damages a common and essential global resource. Elimination of plant and animal species irrevocably destroys part of our joint environmental heritage. Further, many of the consumer markets for these forms of contraband is situated in another part of the world than the supply. Trans-shipment often involves third countries, and thus the problem is beyond the scope of any national power to address. Coming to grips with this global responsibility requires international action. Many international conservation agreements have been signed, among the most influential of which is the Convention on International Trade in Endangered Species of Wild Fauna and Flora (known as CITES), adopted in 1973 at a meeting of members of the International Union for Conservation of Nature (IUCN). Around 175 countries have adopted CITES, although the extent of compliance varies. Under the Convention, states that do not take measures to protect endangered species are subject to escalating international pressure, which can ultimately result in trade sanctions. No matter how dedicated to environmental regulation, however, many countries struggle to protect their natural resources. Criminals make money circumventing these controls, subverting attempts to distinguish licit and illicit trade in natural resource Case studies of transnational threats 161
168 ENVIRONMENTAL RESOURCES products. In addition to an inherent tension between development and environmental protection, some countries lack the capacity to police vast tracts of wilderness. Poverty and instability mean that officials may be easier to corrupt. Borders, especially wild borders, may have very few controls. Rural populations may have few sustenance alternatives to what they can harvest from their natural environment. Most importantly, corruption can undermine even the best designed regulatory system. For these reasons, it is essential that the international community think creatively about ways of preventing the global looting of natural resources. Since many of these products are licitly traded and openly consumed, increased scrutiny of these open markets would be beneficial. In addition to tracking licit exchange, a global seizures database would greatly assist in understanding trends and developments. Cooperative action is key because local weaknesses in enforcing environmental controls can have global consequences. 162 TRANSNATIONAL ORGANIZED CRIME THREAT ASSESSMENT
169
170 ENVIRONMENTAL RESOURCES What is the nature of this market? Between them, sub-saharan Africa and South-East Asia are home to a large share of the world s endangered large mammal species. Both regions face serious challenges to environmental protection, including a lack of effectively managed resources for law enforcement, few alternative livelihoods for rural people, long hunting traditions, periodic insurgencies and conflicts, weak border enforcement, and some enforcement officials who may find the economic potential of this market more attractive than their salary. These problems are not unique to these regions, but, unfortunately, the wildlife species are. Destinations for products sourced from endangered species are broad, but, for a number of reasons, are especially concentrated in East Asia. Demand in Asia for Asian species is rooted in tradition, and Africa hosts species of many of these same animals, such as rhinoceros and elephant. Some feature in local cuisine, some are valued in traditional medicine, while others are prized for their decorative value and are regarded as status symbols. As habitats shrink and human populations grow, the demands placed on these resources multiply. As species become more scarce, some of their parts are worth more than their weight in gold. Despite the efforts of many dedicated rangers, in some areas these precious commodities are essentially free for the taking. Enforcement efforts are hampered by the parallel licit trade in wild animals. Hunting for bush meat, as well as for trophies and commercial gain, is legal and common in many countries. Wildlife markets are found throughout Asia, and wild species are available in many specialty restaurants. Few openly sell endangered species, but these may often be acquired in backroom transactions; those with the networks to source legally culled wildlife can also access banned products. Many endangered species closely resemble more common ones, and it may take an expert to distinguish between them, especially when they have been butchered or processed. Attempts have been made to farm some wild species in order to meet demand, but this does not necessarily reduce demand for wild animals. In fact, the legal availability of these products may increase demand beyond what the licit market can supply. Farms are necessarily required to maintain certain standards, and these restrictions limit the number of producers and increase costs. If demand outstrips supply, even licit producers may feel compelled to buy poached animals to remain competitive. In this way, laundered animals can enter the market though the licit trade. How is the trafficking conducted? The first step in the trafficking chain is poaching. Well-organized groups have been documented, and it is clear that some have turned environmental exploitation into a business. Not all players in the market are full-time professionals, and some of those sourcing wildlife products may be informal participants. Hunting remains a form of livelihood for communities in both Africa and Asia. 2 Even if cashing in meant a long trek to a regional selling point, such a kill would represent one of the few opportunities for income in families otherwise focused on subsistence. Poachers may also approach local hunters with an offer to buy the wildlife products desired. The concentration of endangered species in game parks may make the professional poacher s job easier. If they are able to corrupt game wardens, they can secure access to a steady stream of welltracked and healthy animals. Every year, the national parks of Africa and Asia report thousands of cases of poaching. It is unclear how many of these cases involve the collaboration of rangers. Once poached, the animal may be butchered for particular parts, or the whole carcass transported for further processing. Other species are captured and trafficked alive, to be used as pets, food, or medicine, though many die on the journey. Transportation, as described below, varies depending on the source and destination. As described below, the traffickers may be a completely different group of people than the poachers, acting as brokers with contacts in both source and destination countries. From Africa to Asia Every state in Africa with a wildlife population is affected by poaching, but some much more so than others. 3 Governance seems to be an especially important factor in determining whether or not heavy poaching occurs. 4 It appears that Central Africa is the main source of elephant ivory and Southern Africa the main source of rhino horn. Once the desired parts are removed, they may be transported and processed further in Africa before being shipped abroad. A number of African countries have been identified as carving sites for elephant ivory, for example. Some products are also 164 TRANSNATIONAL ORGANIZED CRIME THREAT ASSESSMENT
171 7 moved north to the Middle East. While Yemen is a key destination for rhino horn, it is unclear how much of this flow is consumed locally and how much is for onward shipment to Asia. FIG. 143: Rhinoceros LOCATION OF EXISTING RHINO AND ELEPHANT POPULATIONS IN AFRICA Elephants Small players may be important in sourcing ivory and rhino horn in some areas, but they also play a role in trafficking it internationally. Africa serves as a retail centre for animal parts, with individual buyers from Asia transporting small items home in their luggage. In November 2008, INTERPOL coordinated Operation Baba, which targeted ivory markets in five African countries involving 50 markets: Congo (Brazzaville), Ghana, Kenya, Uganda and Zambia. In November 2009, INTER- POL coordinated Operation Costa targeting ivory markets in six East African countries Burundi, Ethiopia, Kenya, Rwanda, Uganda and the United Republic of Tanzania. In Ethiopia, in particular, large volumes of ivory items obviously destined for the Far East were recovered (chopsticks, cigarette holders and signature seals). What share of these items are bought for personal use and what share resold for profit in Asia remains unclear. A similar situation has been observed in the Democratic Republic of the Congo, where ivory is sold to Asian buyers. Asian buyers have also been found purchasing ivory on ships in the harbour of Douala, Cameroon. 5 There are also documented cases of African vendors making larger-scale sales. In 2002, a sophisticated operation was found selling large amounts of ivory to Asian buyers from Malawi (see Box). Recently, a collective of Tanzanian businessmen were charged with smuggling 11 tons of ivory to the Philippines and Viet Nam between October 2008 and March The accused are representatives of domestic transportation companies, and their relationship with the poachers is not yet clear. 6 From Africa, the contraband takes a number of routes to Asia. Singapore, Thailand and Viet Nam increased in prominence as transit countries for elephant ivory in For rhino horn, China, Viet Nam and Thailand have been identified as both transit and consumer areas, 8 along with Singapore, Japan, the Republic of Korea, Malaysia (excluding Sarawak), Brunei Darussalam and Macao, China. 9 Endangered species parts are often concealed in legitimate cargo, taking advantage of the growing trade between Africa and Asia. Ivory has been seized hidden in shipments of plastic waste, dried fish, stone statues, precious stones and timber. Many of White Black Numbers (Common legend) 155,000 91,500 24,500 4, Source: IUCN SSC African Rhino Specialist Group 2008, Diceros bicornis. In: IUCN IUCN Red List of Threatened Species, (Version and IUCN, African Elephant Status Report 2007, page 24. the largest shipments detected have been hidden in containerized cargo, often originating in the United Republic of Tanzania, but air cargo has also been used. In July 2009, Kenyan authorities seized 300 kg of ivory packed into coffins on a flight that originated in Mozambique. Both tusks and black rhinoceros horn were seized, and the flight was destined for the Lao People s Democratic Republic, via Thailand. 10 Case study Singapore 2002 Ivory poached in Zambia and Mozambique was smuggled to Malawi by road. Malawi does not ban the domestic trade in ivory, leaving it vulnerable to exploitation by traffickers. In Malawi, some of the ivory was processed in a factory and stored in warehouses for buyers. The factory s records indicated buyers with contact details in Singapore, Japan and Hong Kong, China. Investigations revealed a complex network of shell companies and pseudonyms used in procuring the ivory. The case came to the attention of the authorities when more than 6 tons of ivory was discovered in Singapore, concealed in a shipment that had been declared as stone sculptures. The haul was equivalent to perhaps 300 elephants, and DNA testing later revealed that much of the ivory originated from Zambian savannah elephants. 11 Further investigations revealed that the networks in Zambia and Malawi had been in operation since 1994, having made at least 19 suspected ivory shipments: 15 destined for Singapore and four for China. 12 Given, however, that some of the tusks seized in Singapore were marked with the name of a Japanese port, and that ivory hankos (Japanese signature seals) were also seized, investigators concluded that the final destination of the contraband was Japan. The criminal network responsible was said to have the capability to receive and launder tens of thousands of hankos into existing legal markets and to date no significant members of the network have been prosecuted. 13 UNODC / SCIENCES PO Case studies of transnational threats 165
172 ENVIRONMENTAL RESOURCES FIG. 144: Rhinoceros Number 2, Nepal Kaziranga, India Sumatra, Indonesia In Asia Asia serves as source, transit, and/or destination for a large share of the endangered animals poached in the world. Some products are sourced and consumed in the same country, but, for economic reasons, most are trafficked transnationally. Myanmar, which still contains extensive forested areas, is the main source country, but the Lao People s Democratic Republic and Cambodia are also affected. STOCKS OF RHINOCEROS AND TIGERS IN ASIA, 2009 Dong Nai province, Viet Nam West Java, Indonesia Estimates: Sabah, Malaysia upper lower Source: van Strien, Steinmetz et al, Rhinoceros sondaicus. Talukdar, Emslie et al., Rhinoceros unicornis. In: IUCN IUCN Red List of Threatened Species. Version UNODC / SCIENCES PO Tigers Number Estimates: upper lower Box: Pangolin Pangolin (also known as the scaly anteater) are nocturnal mammals inhabiting areas of Asia and Africa. The distinctive keratin scales of the pangolin have historically been used to make clothing and are used in traditional Asian medicine. One environmental group has argued that the greatest threat to the conservation of pangolins is illegal hunting for trade, largely to supply demand in China for meat and scales used for tonics and traditional medicines, although pangolins are also utilized in other East Asian pharmacopoeia. 14 Asian pangolins are currently listed on CITES Appendix II (vulnerable species) with an annotation for zero trade. They are receiving ever more attention, partly due to a growing number of seizures within Indonesia, Malaysia, Viet Nam, the Lao People s Democratic Republic, Thailand, the Philippines and China. It is not uncommon for traffickers to use one consignment for the transportation of a variety of species, including pangolin. For example, pangolins have been seized with bear paws in China in 2008 and 2009, and in Taiwan, Province of China in 2005, pangolin derivatives were seized with ivory and tiger bones. The pangolin in Asia is threatened by habitat loss in addition to the illegal trade, and its relatively slow reproduction rate impedes short-term population recovery. 15 Traders in Asia have reported pangolins as increasingly scarce. 16 There are several species of pangolins in Africa, where they are subject to the pressures of poaching for bush meat. 17 There is some evidence of African pangolins being seized in Asia, 18 and it is possible that if Asian populations continue to be decimated, African pangolins will become increasingly targeted. 1, India Bangladesh Nepal Bhutan China Myanmar Thailand Viet Nam Cambodia Malaysia Indonesia Source: Chundawat, Habib et al., Panthera tigris. In: IUCN IUCN Red List of Threatened Species. Version UNODC / SCIENCES PO Myanmar is also the primary country used to smuggle South-East Asian wildlife into China, the single largest consumer, while wildlife from Cambodia and the Lao People s Democratic Republic are principally smuggled into Viet Nam, another major destination market. Thailand serves as a transit country and a retail centre for buyers throughout the region. Japan and the Republic of Korea are also destination markets for certain products. The variety of wildlife products used in Asia is extensive, and include many species that have not been designated as endangered or threatened. Local wildlife markets feature snakes, spiders, turtles, scorpions, squirrels and birds, and some offer endangered species products as well. In addition to high profile commodities like ivory, rhino horn and tiger skin, less well-known animals such as the pangolin (see Box) and the slow loris may be sold. Many are transported alive to destination markets, but when trafficked, many die in transit. A key source of demand is the catering industry. The China Wildlife Conservation Association (CWCA) conducted an opinion poll in 16 Chinese cities 19 in 2007 on the consumption of wild animals as food. According to the survey, 88 wild animals were identified as species which might be consumed as food. This was 26 more than indicated in a comparable poll in The number of grocery stores and supermarkets selling wild animals and products also increased by 22.8% during this period. A recent survey of 969 people in six Chinese cities 20 found that 44% of respondents claimed to have consumed wildlife in the past year, mostly as food. People with higher incomes and education levels were significantly more likely to consume wildlife as food, and 20% of respondents were open to eating protected animals, such as pangolin. 21 Cross-border wilderness areas are clearly a point of vulnerability for transnational trafficking, since they can be used to move illicitly harvested animals into the jurisdiction of least resistance. As with other commodities, trans-border ethnic groups can also be a factor. A key facilitator of wildlife trafficking in South-East Asia seems to be conflict and insurgency. The frontier town of Mong La in Myanmar, situated along the Chinese border, is a case in point. Mong La is located in a Special Region, a rebel area where the Myanmar Government has come to terms with the rebels: in return for ending hostilities, the insurgent army has been essentially granted control over local affairs. In the case of Mong La, 166 TRANSNATIONAL ORGANIZED CRIME THREAT ASSESSMENT
173 7 this opened up a lucrative vice market with China. Following a pattern seen around the world, the presence of an unregulated mini-state next to a large, highly-regulated consumer creates tremendous opportunities for shady entrepreneurs. Gambling, prostitution and the wildlife trade were among the biggest industries when the Chinese Government cracked down on this cross-border tourism in But while no longer so visible, the vice trade continues alongside the sale of wildlife, with at least eight active markets where items such as tiger skins are sold openly. Mong La is headed by Lin Mingxian (also known as Sai Leun and U Sai Lin), a former Red Guard volunteer and Communist Party of Burma commander. Areas under control of the United Wa State Army, the largest ceasefire group, are also used for trafficking. Myanmar also serves as a conduit for wildlife smuggled from north-east India and Nepal to China. One of the key commodities sourced in the subcontinent is tiger skin. There are about 3,200 tigers left in the wild, with around half of these in India. 22 Hunting of tigers is deliberate and systematic and there is evidence that commissioning may occur. 23 Traders in China have indicated that they can submit orders for animal parts, which are then procured, not from the poachers directly, but from a network of dealers in trade hubs such as Delhi and Lucknow 24 in India, and Kathmandu and Burang in Nepal. 25 Tigers are also smuggled across the Himalayas into China with important retail centres in Linxia, Xining, Lhasa, Nagqu, Shigatse and Litang. At the peak of the skin trade ( ) the primary demand for skins came from Tibet, where the skins are used to make traditional costumes known as chupas. One seizure in Tibet in 2003 consisted of 31 tiger skins, 581 leopard skins, 778 otter skins and two lynx skins. 26 This seizure alone represents 1% of the remaining tiger population. But this trade has declined significantly since Today, much of the demand comes from wealthy urban Chinese who use the skins as home décor items. 27 Rhino horn is also sourced in national parks on the subcontinent. In Assam s Kaziranga National Park, which is famous for its rhinos, two hornless rhino carcasses were found in mid-december At least 10 others had been killed that year. The border between India and Myanmar is another area where insurgent groups, mainly on the Indian side of the border, may play a role, primarily by taxing the trade. Traffickers seem to have adjusted UNODC / SCIENCES PO FIG. 145: Zimbabwe South Africa Source: UNODC to this, avoiding the main crossing spot at Moreh/ Tamu on the Manipur border and rather transiting Mizoram into Myanmar s Chin State. But wildlife is also smuggled through government-controlled areas of Myanmar. The Chinese town of Ruili is connected by a bridge to a Chinese enclave south of the Ruili (Shweli) river, which otherwise forms the border between China and Myanmar, and this area serves as a major smuggling centre. The town of Tachilek, on the border with Thailand, is another FIG. 146: India Nepal Royal Chitwan NP (Nepal) Origin of tigers trafficked Routes Tibet Manas Wildlife Sanctuary (India) Significant Asian consumers of big cat products and all tiger derivatives used in medicine Source: UNODC TRAFFICKING IN RHINOCEROS HORN MIDDLE EAST Yemen India Myanmar Nepal Royal Chitwan National Park TIGER TRAFFICKING ROUTES Kaziranga National Parks Myanmar China China ASIA Thailand Viet Nam Malaysia Singapore Japan Republic of Korea Brunei Countries where poaching of rhinos for horn has recently been reported Transit/destination countries Rest of the world 1,000 km UNODC / SCIENCES PO Case studies of transnational threats 167
174 ENVIRONMENTAL RESOURCES FIG. 147: India NORTH EAST 500 km Main trafficking routes Markets/hubs Source: UNODC WILDLIFE TRAFFICKING IN SOUTH-EAST ASIA KACHIN Myanmar Ruili China SHAN Dien Bien Mong La Phu Oudomxai Xam m Neua Phonsavan Thailand Hanoi Lao PDR Cambodia Danang Viet Nam Ho Chi Minh city M a l a y s i a notorious open market, although there appears to be fewer traders today than in the recent past, perhaps because the site is in a government-controlled area and has received media attention. Some of this trade may have moved to the Mekong settlement of Keng Lap, an area near the one crossing between the Lao People s Democratic Republic and Myanmar, across from Xieng Kok. It remains unclear how recent government crackdowns on insurgent groups will affect the wildlife trade. In part due to the role of tourism, Thailand serves as a trafficking hub for many commodities, although the wildlife trade cannot be conducted as openly as in some other countries. One wildlife trade monitoring group has recently argued that, due to legal loopholes, Thailand continues to harbour the largest [open] illegal ivory market in Asia, highlighting its role as a retail center for the larger buyers to the north. 28 The group detected 13 ivory workshops in Thailand, eight of them in Uthai Thani and much of the ivory being processed there was illegally imported from Africa. Viet Nam has emerged as a key destination market. Trade in ivory was outlawed in Viet Nam in 1992, with an exception for the sale of stocks existing at that time. 29 This parallel licit trade provides cover UNODC / SCIENCES PO for trafficking. Much of the ivory seized in Viet Nam is in raw form, including pieces of tusks, suggesting it is mainly a transit country for this product. But it has emerged as a key consumer of rhino horn, and may be partially responsible for the boom in demand seen recently. Vietnamese networks source wildlife in the Lao People s Democratic Republic and Cambodia and are involved in trafficking to China (from Lao Cai province to Hekou County). In Laos, wildlife is for sale near the Boten Golden City casino/hotel project on the Chinese border. The Golden City area has been leased by the Lao Government to a Chinese company; only Chinese is spoken, only Chinese currency is accepted, and most of the staff are Chinese. Chinese require no visa to enter the special economic zone. In short, this enclave serves much the same purpose as vice centres like Mong La. Regardless of source and transit countries, the primary destination of wildlife products sourced in Africa and South-East Asia is China. China has moved from being a key source country for endangered wildlife to being the largest destination. In the 1980s, pandas, saker falcons, Tibetan antelope and other species were trafficked out of the country, and some of this trade continues. Since China s economy began to grow in the 1990s, however, a huge number of potential consumers have been brought on to the global market. In 2005, the CITES Secretariat declared that China was the single most important influence on the increasing trend in illegal trade in ivory since In 2008, China was said to be the most important country globally as a destination for illicit ivory, 31 and much the same was concluded the following year. 32 It is also a significant exporter of wildlife products; for example, it was the second largest source of wildlife imports refused entry by the US Government between 2000 and 2004, after Mexico. 33 Animals sourced in South-East Asia enter China through the provinces of Guangxi and Yunnan, especially via the autonomous regions bordering Myanmar, the Lao People s Democratic Republic and Viet Nam. The provinces of Guangdong, Jiangsu, Yunnan, and Guangxi, as well as the cities of Hong Kong and Macao, are the primary destinations, but also important are Beijing and Dalian in the north and Shanghai in the east. A large share of the wildlife trafficked into China is believed to pass through Guangdong, and this flow has been the subject of a recent law enforcement crackdown. 34 In addition to land routes, high-powered speedboat 168 TRANSNATIONAL ORGANIZED CRIME THREAT ASSESSMENT
175 7 traffic from Hong Kong to Shenzhen (Guangdong) is another vector. The traffickers use zhongfei boats, which are faster than the cutters used by the Coast Guard. Routes include use of the waters near Shenzhen and Shekou of Guangdong province; the Beibu Gulf close to Hainan province; the waters near Beihai and Fangchenggang of Guangxi province; the waters near Shantou and Chaoyang of Guangdong province; and the waters near Xiamen of Fujian province. 35 Who are the traffickers? While well-organized and integrated groups exist, it appears that much of the poaching in South-East Asia is conducted by a large number of people who live in the wilderness areas, including armed groups. These people need not be professional poachers they simply need to have a firearm and reside in a wildlife domain. There are, however, professional groups of poachers, some of whom will source specific wildlife on order. The same is true in Africa, where the degree of professionalism is largely determined by the degree of law enforcement resistance. Groups harvesting wildlife in the Democratic Republic of the Congo are not necessarily well-organized, although having a militia connection can facilitate weapons and market access. In contrast, since the majority of the world s African rhinos reside in relatively well-protected parks in South Africa, more sophisticated poachers have started using techniques less likely to attract attention than a gunshot, including the use of veterinary drugs, poison and cross bows. 36 nese expatriate businessmen, some of whom may have taken foreign citizenship, also seem to be active in organizing trafficking in South-East Asia. Vietnamese networks are active in Cambodia and the Lao People s Democratic Republic. While some of the trafficking is conducted by individuals purchasing ivory on their own behalf, there is much evidence of active well-organized commercial groups. Since 1989, there have been at least 55 very large ivory seizures, the average volume of which was 2.3 tons. 39 These shipments would have been worth about US$2 million at wholesale level in destination markets. The ratio of large seizures to total seizures suggests especially large groups are involved in trade to or through China (including Hong Kong and Taiwan), Japan, Singapore, Viet Nam, Thailand, Malaysia and the Philippines. How big is the flow? For estimation purposes, it is easiest to break down the flows by species. Elephant ivory Globally, there are, on average, 92 ivory seizures a month, or about three per day. 40 Seizures reported to the Elephant Trade Information System 41 indicate that more than 361 tons of ivory were seized worldwide between 1989 and While annual seizures varied substantially, the average is less than 20 tons per year. Based on 10,737 seizure records from 1992 to 2009, the average seizure size was 28.7 kilograms. However, as mentioned above, the There is evidence of militant groups being involved in the trade. The Janjaweed militia have long been implicated in poaching elephants in Chad, and on 15 May 2007, they attacked the national storehouse of confiscated ivory in Zakouma, killing three rangers before being repelled. Similar battles have been fought between Kenyan rangers and Somali poachers, some of whom are linked to militant groups. 37 The lynchpin in the system, the large-volume traffickers, are generally brokers with connections in both source and destination countries, though not necessarily citizens of either. Destination country diasporas in source and transit countries do seem to play a key role in trafficking. For example, one wildlife trade monitoring group has argued that there is also evidence of commercial-scale illegal ivory operations involving Chinese nationals in 22 African elephant range states. 38 More recently, they noted that Vietnamese nationals are active as middlemen in rhino poaching in Southern Africa. Chi- kg of raw ivory equivalent seized FIG. 148: 40,000 35,000 30,000 25,000 20,000 15,000 10,000 5, QUANTITIES OF IVORY SEIZED ANNUALLY AND RECORDED IN THE ELEPHANT TRADE INFORMATION SYSTEM, Source: TRAFFIC Case studies of transnational threats 169
176 ENVIRONMENTAL RESOURCES 55 largest ivory seizure cases from 1989 through 2009 total 124,260 kg, or 34% of the total. This is an average large seizure size of some 2.3 tons. The number of large seizures in any given year can explain some of the volatility in annual seizure totals. Almost all this ivory is sourced in Africa. 43 To supply the unregulated domestic ivory markets in Africa and Asia, it is estimated that between 5,000 and 12,000 African elephants would need to be killed every year, 44 assuming no stockpiling takes place. Tusk weights vary substantially, but with an average weight of 10 kg of ivory per elephant, this suggests a total of between 50 and 120 tons of ivory entering the market annually. Since global annual seizures amount to about 20 tons on average, this suggests an interception rate of between 17% and 40%. On the upper end, this seems a rather high interception rate to be maintained over time, suggesting the figure is closer to 120 tons. The value of illicit ivory depends on where in the world it is located, and accurate data on the price in destination markets are extremely limited. 45 It is said that a kilogram of ivory sold in Africa for US$15 can fetch over fifty times that amount in Japanese markets. 46 For raw ivory in destination markets, a number of sources agree on figures around US$850 per kilogram. 47 Value may also be added to the raw material in the form of carving. The true value of the objects seized may be much greater than the weight of the ivory alone would imply. The illicit nature and size of the sale can also substantially impact the price. For example, in 2008, the Namibian Government sold 7.2 tons of stockpiled ivory for US$1.2 million, or only US$164 per kg. This was actually an increase over the price commanded in a similar auction in 1999, when only Japan was allowed to purchase. 48 Much higher prices have been cited to foreign buyers for smaller quantities in destination markets. 49 Using the figure of US$850 per kilogram and taking the high end of the volume estimates cited above (120 tons), the total value of ivory entering the market would be about US$100 million annually. The share of this production that heads to Asia is difficult to determine. Seizure figures may be more reflective of enforcement action than real prevalence of the problem, especially given the parallel licit market. China appears to be the largest national destination. In 2008 and 2009, China itself made 51 ivory seizures but was mentioned as destination in 120 other seizures that took place elsewhere in the world, many of which resulted in the arrest of Chinese nationals. Total seizures amounted to 43 FIG. 149: TRAFFICKING IN ELEPHANT IVORY China Republic of Korea Japan Gabon DR of the Congo U.R. Tanzania Kenya Malaysia Viet Nam Singapore UNODC / SCIENCES PO Zambia Malawi Mozambique Zimbabwe Sources of ivory of the seizures Main consumer countries Source: UNODC 170 TRANSNATIONAL ORGANIZED CRIME THREAT ASSESSMENT
177 7 tons in the decade between 1999 and 2009, or about one fifth of the global total during that period. This would suggest that China alone is the destination of ivory worth perhaps US$20 million per year. In 2007, selected countries in East Asia accounted for 62% of the ivory recovered in the 49 largest recorded seizure cases in the Elephant Trafficking Information System database. 50 Taking 62% of US$100 million would indicate an Asian ivory market worth about US$62 million per year, generated through around 75 tons of ivory transferred to Asia at a cost of 7,500 elephants poached. Rhino horn While seizures are smaller, rhino horn is worth far more than elephant ivory per kilogram. As with elephant ivory, prices paid in source countries may be as little as 1% of the final retail price. The reported wholesale value of Asian rhino horn increased from US$35/kg in 1972 to US$9,000/kg in the mid-1980s. The retail price, after the horn has been shaved or powdered for sale, has at times reached US$20,000-30,000 per kilo. 51 The key factor is demand, which reportedly spiked in Based on a detailed consideration of both African and Asian rhino poaching, one recent assessment concluded that more than 3,100 kg of illicit rhino horn reached Asian markets between January 2006 and September 2009, or about 800 kg per year. 52 At a value of US$10,000 per kilogram (a conservative figure given the peak valuations above), this would represent a market of just over US$8 million per year. Tiger Tiger parts continue to fetch high prices, with skins retailing in 2009 for up to US$20,000 in China, and raw bones selling for up to US$1,200 per kg. 53 A single kill would represent a large amount of money to individual traffickers in the region, because they are relatively close to the destination market, and so could be expected to earn a good share of the final retail figure. As a result, the incentives for poaching and trafficking remain strong. Tiger populations are less monitored than herd animals like elephant and rhino, and seizures of tiger products are less well documented. This makes it difficult to say how much product enters the market each year, but the market is likely to be much smaller than that for ivory or rhino horn. The National Tiger Conservation Authority of India detected 66 tiger deaths (not all of which were poached) and 29 seizures of tiger products in 2009, 54 out of an estimated population of 1,411 tigers. 55 This suggests a known loss of 5% from all causes. Since all parts of the tiger are used, however, it is possible that many are disappearing unrecognized. If as much as 5% of the remaining tiger population were poached each year, there would be about 150 tiger skins and about 1,500 kilograms of tiger bones entering the market. At optimal prices, this market would be worth less than US$5 million per year. Other South-East Asian wildlife trafficked to China Tens of tons of living wild animals are shipped into China on a daily basis, with terrapins and reptiles accounting for much of the total volume. Not all of this traffic is illicit, but from January to April 2009 alone, 129 cases of wildlife trafficking were opened in Guangdong, with wildlife seized valued at 48.3 million yuan (US$7 million). This surge was a result of a crackdown in the area, however, and may represent a significant share of the total flow. According to the Department of Wildlife Management of the State Forestry Administration of China, the total value of illicit wildlife imports entering the country is between 28 billion and 32 billion yuan per annum (around US$4 billion). If they are correct, the vast majority of this flow involves smaller species trafficked from South-East Asia, since the ivory, rhino horn and tiger markets documented above would account for about 1% of this market. To get some sense of whether this is possible, it helps to look at specific species. For example, the pangolin is largely nocturnal, highly evasive, and considered endangered in mainland South-East Asia, making it one of the more precious local wildlife species. A pangolin typically sells for about US$15 in Malaysia. They are even cheaper in Indonesia (between US$5 and US$10), increasingly the source as mainland stocks are decimated. 56 However, the same pangolin commands more than US$100 per kilo on the black market of Guangdong, yielding at least seven-fold profits. If the illicit wildlife trade from South-East Asia were comprised exclusively of pangolins, then it would take some 40,000 tons of pangolins to generate a 4 billion dollar flow, equivalent to perhaps 10 million animals. While there would hardly be demand to justify this scale of trafficking in one species, some large seizures show that the scale of pangolin trafficking is Case studies of transnational threats 171
178 ENVIRONMENTAL RESOURCES immense. In 2008, some 23 tons of pangolin carcasses and scales, the remains of approximately 8,000 animals, were seized in the province of Hai Phong, Viet Nam, in a single week. 57 At the rates cited above, this shipment would have been worth over US$2 million in Guangdong. Tacking into account assorted representatives of the 88 wild species eaten in China, and these estimates do not appear to be beyond the realm of possibility. At the very least, it is clear that the Asian demand for South-East Asian wildlife far exceeds that of African wildlife. This suggests that while the high profile poaching of large protected mammals in Africa receives much of the media coverage, the wholesale looting of South-East Asia s wildlife may not be getting the attention it deserves. 172 TRANSNATIONAL ORGANIZED CRIME THREAT ASSESSMENT
179
180 ENVIRONMENTAL RESOURCES FIG. 150: EVOLUTION OF FOREST AREAS, UNODC / SCIENCES PO China Myanmar Indonesia Nigeria DR of the Congo Brazil Sudan UR of Tanzania Zambia 42, Changing in forest areas between 1990 and 2005 (in thousand hectares) 9,000 1,000 Only values higher than 10,000 hectares are represented positive (reforestation) negative (deforestation) Source: FAO, Global Forest Resources Assessment 2005 What is the nature of this market? The transportation of wild animal parts, when detected, tends to raise questions. In contrast, the transport of large volumes of timber and wood products is a staple of international commerce. As with other ostensibly licit goods, the legality of any particular shipment of timber is based on paperwork. Fraudulent paperwork can be used for a number of purposes. It can transmute a protected hardwood into a more mundane variety. It can render a product originating in a protected area into one from an authorized source. In Asia, much of this paperwork is not forged it is bought from corrupt officials in timber source countries. Fraudulent paperwork can be used to evade the forest management policies of countries whose woodlands are threatened. For example, in Indonesia, the majority of illegal logging has involved clandestine harvesting of trees outside of authorized forest concessions or approved cutting plans. 58 In the past, illegal logging has outpaced the licit industry in Indonesia. 59 A number of countries have strict controls on logging, and some ban the export of whole logs or rough sawn wood, which serves both to protect the local timber processing industry and to reduce forest loss. For example, Indonesia has had a log export ban since 2001, and, in a reciprocal policy arrangement, Malaysia has banned the import of logs from Indonesia since Laos has had a ban on export of all unfinished wood products since Cambodia previously had a general logging ban, but has in place a quota system for national demand today. 61 Thailand has had a logging ban since There are a variety of ways wood can become contraband. It can be harvested illegally, in contravention of national law. Most countries in South-East Asia have a range of regulations on commercial logging, in an effort to try to restrict the scope and scale of the enterprise. It can also be exported and imported illegally. Some countries prohibit the importation of particular strains of hardwood, while for others, the provenance of the wood is also significant. In either case, fraudulent paperwork pits the word of one national official against another. Due to the bulk of the product, timber is generally transported by sea or by road, entering through official border crossings. Purely clandestine smuggling is rare, but where paperwork is lacking, a corrupt customs official on the receiving end will suffice. Since the import of illicit timber damages the source country and not the receiver, there may be little moral stigma attached to looking the other way for fraudulent imports. Often, importing coun- 174 TRANSNATIONAL ORGANIZED CRIME THREAT ASSESSMENT
181 7 tries lack the required legislation to seize shipments of illicit timber. As with wildlife trafficking, the role of special or autonomous zones in both the source and destination areas is important. These are areas where the national government may have limited authority, and may assume limited responsibility. When these areas lay astride a strategic border, they are especially vulnerable to trafficking. In addition, some South-East Asian countries make provision for a barter trade, where goods are exchanged instead of cash. The barter trade has special designated jetties and landing points and customs forms are mandatory, but little other paperwork is required for imported products, including timber. 62 South-East Asia is experiencing deforestation at the fastest rate on earth, but still retains some 7% of the world s old-growth forests. These forests provide habitat to many species found nowhere else on earth. Wildlife trafficking exterminates species one animal at a time, but deforestation can eliminate whole ecosystems in short order, and the impact that this loss of cover has had on waterways, soil erosion, and climate is well documented. The impact of this loss is global and many of the changes are irreversible. The motive for this crime is economic, and with globalized commerce, all nations bear some responsibility. The EU and Asia are two of the world's biggest markets for timber and wood products. The EU is estimated to import about 20% of the illegally felled timber in the world, and China an estimated 25%. 63 Adding other significant importers like Viet Nam, the demand discussed in this section constitutes at least half the global market. How is the trafficking conducted? According to a 2008 assessment, as much as 40% of wood-based products imported into the EU from South-East Asia are said to have originated from illegal logging. Most of these are in the form of furniture and other finished products, but raw timber is also involved. The primary source of illicitly harvested timber is Indonesia. Indonesian timber is frequently misrepresented as coming from Malaysia, often trans-shipped from China. 64 Over the past decades, European wood products traders have increasingly outsourced manufacturing to Asia. Initially, these contracts went to countries with abundant forest resources of their own, like Indonesia and Malaysia. But today, Viet Nam and China are the most prominent contractors. Since FIG. 151: In addition to its role as a re-exporter, China s rapidly growing economy is a major consumer of South-East Asian wood in its own right. China s timber demand is projected to rise to 350 million cubic metres in 2010, with a shortfall of 150 million cubic metres from official imports. The primary seaport of entry for raw logs is Zhangjiagang, an inland port city on the southern bank of the Changjiang River, Jiangsu Province, although the nearby ports of Nantong, Yangzhou and Taicang have also been important. In addition, a large amount of timber is imported from South-East Asia over land borders with Myanmar, the Lao People s Democratic Republic and Thailand via the autonoreforestation deforestation Rate (in % of 1990 areas) EVOLUTION OF FOREST AREAS, ,0 Kuwait 84,0 Iceland 66,4 Uruguay 64,2 Tunisia 60,0 Lesotho 38,1 Viet Nam 32,9 Spain 25,5 China 19,0 Italy 7,0 France 5,9 India 1,5 USA -4,9 DR of the Congo -8,1 Brazil -11,6 Sudan -13,6 Zambia -14,9 UR of Tanzania -17,8 Myanmar -24,1 Indonesia -32,3 Philippines -33,8 Afghanistan -34,9 Niger -35,7 Nigeria -35,7 Mauritania -37,1 Honduras -43,6 Togo -47,4 Burundi -58,3 Comoros Source: FAO, Global Forest Resources Assessment 2005 Balance (in thousand hectares) ,568 4,436 40,149 1,596 1,016 3,762 4,441-6,921-42,329-8,835-6,672-6,184-6,997-28,072-3, , , these countries do not have sufficient timber resources of their own, they import the wood to fill the EU s manufacturing requirements. In this way, the European companies have cut costs, but they cannot be sure of the origin of the wood being used to make their products. EU imports of products from wood and paper from China virtually tripled between 2003 and 2006, from 4 million m³ to 11.5 million m³. In contrast, the import of wood-based products from Indonesia has fallen by 15% from just under 6 million m³ to 5.1 million m³. A very large share of this wood (over 80%) is believed to be illegal. 65 UNODC / SCIENCES PO Case studies of transnational threats 175
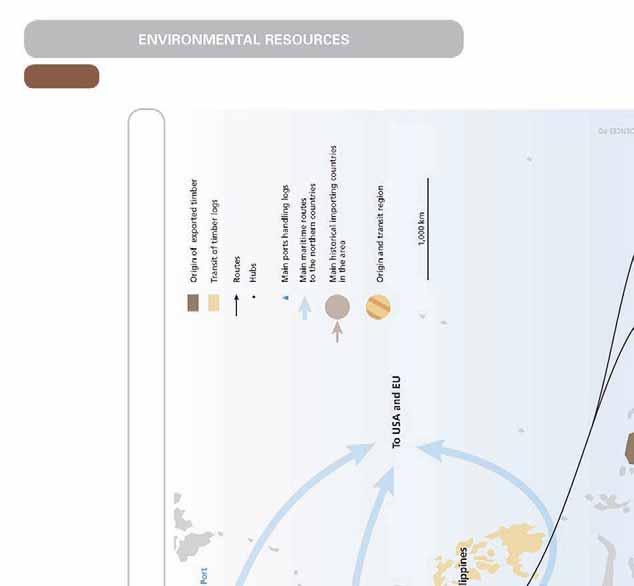

182
183 7 mous areas in Yunnan, and from Viet Nam though the Guangxi autonomous area. In September 2009, the former vice chairman of Guangxi was sentenced to 18 years in prison for corruption related in part to timber brokering. 66 The second major importer in the region is Viet Nam, where the wood is used to make furniture, especially outdoor furniture, for export. The Vietnamese export furniture industry has boomed remarkably in recent years, and are projected to rise to US$3 billion in Vietnamese outdoor furniture manufacturers have been accused of illegally sourcing their materials on many occasions. 68 In January 2010, a report on the trade between the Lao People s Democratic Republic and Viet Nam re-confirmed many earlier findings. It found that Vietnamese companies have a large influence over the forestry sector in the Lao People s Democratic Republic, and often circumvent controls. Vietnamese timber imports more than quadrupled between 2000 and 2008 and Viet Nam exported three quarters of a billion dollars worth of wood products to the EU in Despite a ban on log and sawn timber exports, timber is trafficked from the Lao People s Democratic Republic to both China and Viet Nam. Traffic from the Lao People s Democratic Republic to China passes through Phongsali northeast of Boten and enters a Pakha crossing, where customs presence is limited. It is estimated that 48% of timber imports by Viet Nam are illegal. 70 Viet Nam imports around 500,000 cubic metres of logs from the Lao People s Democratic Republic per year. 71 Much of this goes to fuel Viet Nam s own burgeoning wood processing industry and outdoor furniture manufacturers. Most of this furniture is exported to the USA and Europe. Indonesia remains the country most heavily affected by criminal deforestation, particularly the island of Papua. Historically, the two main countries directly importing Papuan timber, notably merbau, have been China and India. Logs transit the Philippines, Papua New Guinea, Singapore and Malaysia. The route through Papua-Kuantan (Malaysia) via Pontianak has also been identified. In addition, Kalimantan (the Indonesian portion of the island of Borneo) has been a location for illegal logging, including within the National Parks. A variety of species of timber were smuggled through the Malaysian provinces of Sarawak and Sabah. From the mid-1990s to 2004, this cross-border trade was believed to be high, but appears to have been reduced since that time. Timber trafficked into Malaysia includes sawn timber, which is prohibited for export in Indonesia. The timber crosses land and sea into cites in Sarawak where processing for export to Viet Nam, China, Thailand, Europe and the USA takes place. The Center for International Forestry Research (CIFOR) estimated that 2 million m 3 in Sabah, Malaysia, is actually brought over from Indonesia. 72 Helicopters are also used to transport logs from Indonesia into Malaysia. Elsewhere in Indonesia, Riau province in Sumatra has also been identified as a key location for the timber trade, especially in Gaung, Kampar (South), Siak Kechil, Bukit Batu (Central), Rupat, Panipahan and Duri (North). Timber is transported into Malaysia, increasingly in the form of sawn timber. Some of the timber is processed in Malaysia, and some simply transits Malaysia en route to China, India and other destinations. As in other locations, this is facilitated by misrepresentation of the cargo, and the complicity of corrupt authorities. In the past, Indonesian logs were transported first to Shanghai and then distributed to other areas. But with the growth of containerization, products such as merbau sawn timber are sometimes shipped directly to locations such as Fuzhou and Beijing. As mentioned above, the key port for whole logs is Zhangjiagang Port near Shanghai, China s biggest timber port, which is located close to Nanxun, where there are many flooring and decking factories. For ramin, however, Guangzhou may be used, with shipments sometimes transiting Hong Kong, China. The trade in timber from Myanmar has greatly decreased, partly due to interventions made by China and partly due to the fact that much of Kachin State, the primary source, has been denuded. From the early 1990s to about 2005, the trade in illegal timber was vast, much of it associated with areas controlled by cease-fire groups on the Myanmar side of the border. In fact, access to this economic opportunity was one reason these groups agreed to stop fighting the government. This timber crossed into China to Tengchong, Baoshan and the Yunnan provincial capital of Kunming. According to a recent report from an NGO focusing on natural resources and conflict, imports of logs and sawn wood across the land border from Burma fell by more than 70% between 2005 and However, 270,000 cubic meters of logs and 170,000 cubic meters of sawn timber were still imported into Kunming customs district in 2008, more than 90% of which was illegal. 73 There is also some flow to India, Bangladesh and Viet Nam. Case studies of transnational threats 177
184 ENVIRONMENTAL RESOURCES Case study Merbau Merbau is a dark, tropical hardwood, commercial stands of which are largely restricted to Indonesia, Malaysia and Papua New Guinea. It is one of the most valuable hardwoods in the region: in 2005 it was worth US$ per cubic metre for logs and up to US$ for sawn wood at the point of export. 76 By 2009 prices had risen to around US$540 per cubic metre for logs and US$750 for sawn wood. Although commercial exploitation of this timber only took off in the late 1990s, it has been harvested to the extent that it is presently classified as threatened. In response, the Indonesian Government banned the export of whole merbau logs in 2001, limiting exports to what the local sawmill industry could produce. But by 2005, it was estimated that criminal syndicates were smuggling 300,000 m 3 of merbau out of West Papua every month, 77 worth at least US$45 million-60 million to the sellers. One key problem is governance. In 2001, a system of autonomy was introduced for the province of West Papua, intended to direct a greater share of the proceeds of logging to local communities. This system was abused by loggers in cooperation with military leaders, and by the time the programme was abandoned in 2002, more than 300 projects were active across the province. 78 Despite the national ban, the governor of West Papua issued a decree allowing the export of merbau logs. In 2003, the regional government issued permits for logging more than twice as many hectares of land as permitted by the central government, covering almost one third of the entire land area of Papua. 79 The professionalism of the groups involved is revealed by the techniques they use to evade detection: false flagging of vessels; the use of barges instead of transport ships as these are less likely to be searched; the use of containerized rough-sawn timber instead of round logs; and a variety of fraudulent documentation, including origin certificates from neighbouring Papua New Guinea. A national clampdown in 2005 involving 186 suspects, including senior officials, caused the price of merbau to double, 80 but by 2007, only 13 of these suspects had been convicted, and no senior figures were prosecuted. Of the suspects, the Minister of Forests at the time stated: the evidence to incriminate them is already clear. I suspect that behind the rulings there has been something that is in conflict with the legal norms. 81 Estimates for 2008 suggest that merbau accounted for 14.3% of Indonesia s overall timber production, and 31.4% of its processed wood exports. The primary method of illegal importation remains the use of fraudulent Malaysian place-of-origin certificates to mask illegal imports from Indonesia. One of the most prized hardwoods is merbau, a timber found in Malaysia, Indonesia and Papua New Guinea, and used in China to produce flooring and furniture. It is illegal to export whole merbau logs from Indonesia, so exporting this product through an official Indonesian port requires fraudulent paperwork. Almost all of the timber exported from Papua New Guinea goes to China, and independent reports have found the majority of logging operations there to involve illegalities. 74 Since these products are ostensibly legal, they are trafficked to China and Europe using the mainstream methods of international commerce, including containerized shipping. The buyers may include many of the top European dealers in wood products. For example, an investigation into the merbau flooring industry in Europe in 2006 found many of the top brands and retailers were implicated, and a 2008 study found that, in many instances, little had changed. 75 Who are the traffickers? Illegal logging gangs operate throughout the source countries, with varying degrees of assistance from corrupt officials, particularly in the military. In Indonesia, for example, in a 2005 crackdown on illegal logging, many military figures were im - plicated, 82 and recently the Indonesian military missed a deadline to shut down its illegal businesses, including logging. 83 According to Human Rights Watch, the military has had a prominent role in large timber operations that have displaced communities from their ancestral lands and fuelled rampant illegal logging. Military units providing protection services to companies have earned offbudget cash payments, raising serious corruption concerns. 84 European players are difficult to identify, because destination markets include most European countries, and a wide variety of wood products are imported, many in the form of furniture, flooring, and other finished products. Since much of this material is re-exported from China, European importers can credibly claim ignorance as to its origins. It therefore becomes difficult to classify these operators as complicit in organized criminality, although without their purchases, the size of the market for illegal timber would be greatly reduced. Trafficking to China is often arranged by brokers based in Singapore, Taiwan, Province of China and Hong Kong, China who have long experience in the trade. In South-East Asia, Chinese expatriates are important players in arranging cross-border deals. In China, the timber industry is controlled by 178 TRANSNATIONAL ORGANIZED CRIME THREAT ASSESSMENT
185 7 a number of large trading firms who deal in import quotas. To meet tremendous demand, these brokers source timber wherever they can. In addition, corrupt public officials and businessmen in the source countries remain important in perpetrating this crime. Today, exports from Myanmar are controlled by local businessmen, who may also be involved in other extractive industries, in cooperation with rebel commanders. Thai businessmen are also involved in procuring illicit timber from the Lao People s Democratic Republic, often by bribing corrupt military officials. Before the opening of the Chinese border, the border between Thailand and Myanmar was the epicenter of trafficking in South-East Asia. While this trade has been drastically reduced, Thai brokers remain important players on the regional scene. US$ millions FIG. 153: 6,000 5,000 4,000 3,000 2,000 1, VALUE OF IMPORT OF WHOLE LOGS AND TIMBER TO CHINA, Log Imports Timber Imports Source: China Statistical Yearbook 91 For traffic to Viet Nam from the Lao People s Democratic Republic, actors on both sides of the border are important. Vietnamese timber companies actually do the felling while Lao teams handle the transport to the border. The lumber is passed to both Vietnamese wood processors and brokers, who may sell internationally. How big is the flow? The World Bank has estimated the annual global market value of losses from illegal logging alone at over US$10 billion, and annual losses in government revenues of about US$5 billion. 85 An influential 2004 study into the financial impacts of illegal logging on legitimate trade stated there is credible evidence to suggest that 8%-10% of global wood products production and, similarly, of the value of global wood products trade stems from illegal logging. The report based these figures on 2002 global roundwood production of 1.7 billion cubic metres, worth $256 billion. Registered imports were worth US$186 billion. 86 Illegal logging can reach extraordinary proportions. Between 2001 and 2004, it was estimated that 98% of all the timber leaving Myanmar for China overland was illegal. 87 Similarly, at the height of Indonesia s illegal logging problem, 80% of the timber coming out of the country was illegal, and the government estimated that this trade was costing the government US$4 billion annually. 88 This is around five times the country s 2004 health budget. 89 Indonesia s rate of deforestation peaked at around 2 million hectares a year (equivalent to 300 football fields every hour) 90 with one source stating this represented several hundred thousand truckloads, corresponding to a continuous line of trucks from Paris millions of cubic meters FIG. 154: CHINESE LOG IMPORTS BY SOURCE REGION, Asia Africa North America Russia Australia-New Zealand Europe South America Source: China Woods Logistics Association to Bangkok. 92 The United Nation Environmental Programme declared in 2007 that illegal logging was taking place in 37 of Indonesia s 41 national parks. 93 In the Indonesian example, the largest mark-up was made by the gangs organizing illegal logging. Traffickers stood to double their money exporting logs from Papua to China, more than the mark-up made by those who a turned these logs into flooring. If similar conditions prevail today, the incentives for trafficking remain. It has been estimated that 20-40% of global timber comes from illegal sources, and that 20% of this enters the EU. 94 This amounts to around US$3 bil- Case studies of transnational threats 179
186 ENVIRONMENTAL RESOURCES FIG. 155: CHINESE LUMBER IMPORTS BY SOURCE COUNTRY, Indonesia New Zealand Malaysia Thailand U.S. Canada Russia millions of cubic meters Source: China Woods Logistics Association lion worth of illegally-sourced timber every year. 95 In 2001, the EU was believed to be directly importing US$712 million of illegal timber from Indonesia and Malaysia alone. 96 A 2004 report indicated that up to 80% of tropical log imports into the EU15 were illegal. 97 According to the World Wildlife Fund, writing in July 2008, On average 40% (9.5 million [cubic meters in round wood equivalent]) of the wood-based products, which are imported into the European Union from South- East Asia including China, probably originate from illegal logging. 98 If just 20% of EU timber imports from this region were illegal, this would represent a market of some US$1.75 billion. (and Indonesia in particular) has been declining. Of course, these statistics cannot account for mislabelled imports, and the overall trend could be going in the opposite direction. Unlike the EU, China s timber import trade, particularly of whole logs, has been growing at a remarkable rate, so any estimates made quickly become outdated. It has been estimated that half of all China s wood imports are illegal, and that China accounts for about a quarter of all illegal timber traded internationally. 99 China imported some US$7 billion of logs and timber in If half these imports were illegal, this would represent a US$3.5 billion trade. A large share of Chinese timber imports, including whole logs, have been traditionally sourced from the Russian Federation, however. 101 If half of China s illicit imports come from South-East Asia, this would still represent an inflow of US$1.75 billion. According to data from the China Woods Logistics Association, however, China s import of tropical logs has been fairly stable in recent years, and the share of both logs and lumber coming from Asia 180 TRANSNATIONAL ORGANIZED CRIME THREAT ASSESSMENT
187 7 IMPLICATIONS FOR RESPONSE Transnational trafficking in endangered species and timber are facilitated by the licit trade in some of these products. For example, elephant ivory is not, in itself, contraband. The legality of any given piece of ivory depends entirely on its provenance. In a number of countries, legislation allows domestic processing, marketing and use of ivory. The same is true of many tree species: the legality of the wood is dependent entirely on where and how it was harvested. A piece of forged or fraudulently acquired paperwork is all that is needed to transform a container-load of contraband into legitimate commerce. If the demand is legal, it is difficult to ensure that the supply remains so. Even when a product is legally available in international trade, it is often cheaper to obtain it from illicit sources. Once one key player takes advantage of this cost savings, market pressure makes it very difficult for competitors to avoid doing the same. Over time honest players are eliminated from the market, unable to compete with those who cut corners. To avoid this downward cycle, it is necessary to create disincentives that outweigh the advantages of profiting from natural resource trafficking. For those products that cannot be completely banned, protecting the environment comes down to a reliable system of origin certification and international accounting. Buyers must be able to distinguish the illegal from the legal there must be no grey area. 104 A regime must be devised that makes it cost-ineffective to bring banned merchandise into the licit supply stream. International oversight is essential to circumvent corruption and short-term thinking on behalf of local actors. Once natural resource contraband has been effectively ghettoized, it will become more expensive to procure and more difficult to market. Greater regulation must go hand in hand with consumer education. For example, demand for endangered wildlife is especially galling because it is often combined with health fraud. The recent surge in demand for rhino horn, for example, has been tied to a rumour that powdered horn can cure cancer. This myth seems to have gained currency in Viet Nam in particular, 105 and may be behind the fact that demand for rhino horn skyrocketed to a 15-year high in Rhino horn is largely comprised of keratin, like human hair or fingernails, and there is no evidence that keratin has any effect whatsoever on cancer. As a result, the trade in rhino horn simultaneously speeds the extinction of an animal species and exploits the terminally ill. Public education therefore plays a critical role in preventing such inappropriate demand. More research is required to better quantify the problem and to identify priorities. There are a number of complex factors that make a species vulnerable to extinction, aside from market demand. Some of the most vulnerable animal species are slow to reproduce. Others require large ranges, or are adapted to very specific climatic conditions. The same is true for timber: trees that took hundreds of years to grow can be felled in minutes. They cannot be replaced at the rate they are poached. Ironically, as the species becomes scarcer, its value increases, and with it the incentives to drive it into extinction. Tracking this process is required so that scarce resources can be directed to the most acute problems. With such a system in place, those who licitly deal in these commodities will have strong incentives to inform on those who gain a competitive advantage by skirting the rules, so long as the informants are assured that swift and effective action is taken on information submitted. Industry competitors are in an excellent position to know where the weaknesses are in the system and how they might be corrected. They may also contribute financially to ensuring their industry avoids disrepute. Providing an international platform for information sharing and collective enforcement could go a long way to enlisting the support of these key players. Case studies of transnational threats 181
188
189 8 COUNTERFEIT PRODUCTS
190
191 8 COUNTERFEIT PRODUCTS Product counterfeiting is a form of consumer fraud: a product is sold, purporting to be something that it is not. This is different from the crime of copyright violation, which involves the unauthorized transfer of licensed material, such as the sharing of music or video files electronically. 1 Product counterfeiting is typically an organized group activity, because the manufacturing of goods takes people and time, and the goal is invariably profit. Many jurisdictions take the offence quite seriously, for reasons described below. As a result, most product counterfeiting would be considered organized crime under the Convention. Lesser goods have been passed off as high-quality merchandise since the dawn of organized commerce, but the practice has taken on new meaning and proportions in the latest wave of globalization. With the advent of outsourcing, companies in developed countries are responsible for the research, design and marketing of products, while the actual manufacturing of the goods takes place in countries with a productive, yet cheaper, workforce. These manufacturing countries are also generally poorer, and so have lower capacity for oversight. This is usually not a problem, because the licensing company provides quality control shoddy workmanship or substandard materials means loss of contracts and possibly legal action. But this same lack of regulatory capacity makes unauthorized production possible. Products in high demand can be manufactured based on the same or similar designs, often packaged and branded in ways to make them indistinguishable from the original. The counterfeit goods can then be sold through parallel markets, or even introduced into the licit supply chain. Without the overheads of the licit products, these counterfeits can be priced extremely competitively while remaining vastly more profitable. Due to this competitive edge, in some markets in some parts of the world, counterfeit products are far more common than the originals. Product counterfeiting is widespread: products destined for 140 countries were detected in 2008, according to the World Customs Organization. 2 The scale of the global problem has not been well documented, however. The International Chamber of Commerce continues to cite a frequently used estimate: Counterfeiting accounts for between 5-7% of world trade, worth an estimated US$600 billion a year. 3 This figure does not appear to have an empirical basis, however, and has been criticized as excessively high. In 2007, the Organization for Economic Co-operation and Development tentatively estimated the value of counterfeit and pirated goods that are traded internationally at 2% of the world trade in goods, or US$176 billion, in This estimate appears to have a stronger evidential base, but was released with substantial caveats due to the lack of comprehensive data. The production and trafficking of counterfeit goods is often portrayed as a matter of intellectual property theft, and through this prism it garners little sympathy. Many otherwise law-abiding citizens think nothing of buying a knock-off version of a designer article. Though many are aware that the loss of income reduces the incentives for creativity, the impact seems too remote and the victims too affluent for many people to give the matter a second thought. In aggregate, however, product counterfeiting poses a serious global challenge. The branding of a product provides implicit quality assurance and a legal line of accountability that consumers have come to take for granted. Without a brand to protect, counterfeiters have no incentive to produce anything but superficial quality. Where it becomes impossible to distinguish the real from the counterfeit, poor quality products destroy the reputation of the copied brand, and the cheaper goods will inevitably dominate. The ultimate threat of counterfeiting has been realized in some parts of the developing world: the original, high-quality products have been essentially priced out of the market. Unaccountable products are often dangerous products. Knockoff toy producers need not worry about choking hazards or paint toxicity. Counterfeit auto parts are not subjected to the rigorous safety testing borne by their licit counterparts. Due to cheaper materials and workmanship, counterfeit batteries and cigarette lighters are prone to explode. Counterfeit medicines need not contain any active ingredient at all. Worse, they could contain a substandard dose, allowing the target microbes to develop resistance. In this way, the proliferation of counterfeits anywhere in the world can have ramifications for global health. And counterfeit products have indeed proliferated, as detailed in the flow studies below. Electronic goods are one of the most commonly encountered counterfeit products, and detection of pharmaceuticals has also been rising. The single most commonly counterfeited class of goods, however, is apparel: clothing, accessories and shoes. The safety hazards of knock-off designer handbags are Case studies of transnational threats 185
192 COUNTERFEIT PRODUCTS less obvious than dilute penicillin, but all counterfeits undermine national and global attempts to regulate commerce in the common interest. For example, counterfeit products are often smuggled, both to circumvent problematic inspections and to evade import taxes. Since they are generally retailed irregularly, sales taxes are avoided. Tax evasion also allows counterfeit goods to be priced extremely competitively, while at the same time affording attractive profits for the dealers. By displacing the sales of legitimate products, they undermine the tax base, and thus affect public services available for all. The damage is not just felt in the receiving countries: the producing countries also suffer. Even as the major brands work to improve labour standards and workplace safety at their outsourced manufacturing sites, counterfeit goods producers take advantage of global sweatshops. As licensed manufacturers try to improve their environmental impact standards, counterfeiters enjoy the cost savings of dirty production. In short, anywhere that the international community attempts to establish good practice standards for industry, counterfeiters undercut them. Thus, much of the impact of product counterfeiting is long-term, subtle and diffuse. Deaths, many of which occur in developing countries, are often not tied back to the counterfeit product, or if they are, there is little organized response. As a result, the impact of counterfeiting can be frustratingly difficult to quantify. The most accessible metric is loss of revenues, and so counterfeiting is often reduced to a revenue issue, despite being much more than that. Much of the world s outsourcing has been from the United States and Europe to various countries in Asia, with a growing share of this work being concentrated in China. India is also a major outsourcing centre, and it plays a particularly important role in manufacturing drugs destined for Africa. It is therefore not surprising that a large share of global counterfeit seizures originate in Asia, and that this region is the focus of the following section. This is not to suggest the problem is limited to Asia, and in many cases the goods are only misbranded far from the production sites. As reiterated throughout this report, these are global problems, and solving them will require interventions at the level of the problem. 186 TRANSNATIONAL ORGANIZED CRIME THREAT ASSESSMENT
193
194 COUNTERFEIT PRODUCTS FIG. 156: US$ billions FIG. 157: Cellphones 12% What is the nature of this market? The massive growth of Chinese manufacturing has been one of the key drivers of the twenty-first century global economy. Much of this growth is the result of outsourcing by overseas companies, looking to take advantage of China s high productivity and low costs. Most of the retail value of these products accrues to the companies doing the outsourcing, while the Chinese manufacturing firms retain a relatively small share. This mutually beneficial arrangement is only possible because most Chinese firms respect the intellectual property rights of the outsourcing companies. Unfortunately, this situation in which the designers and manufacturers of a product often live on different continents has fostered the growth of VALUE OF EXPORTS FROM CHINA, Source: Chinese Customs SECTORAL SHARES OF CHINA S MANU- FACTURING EXPORTS, OCTOBER 2009 Other 19% Data processors and intergrated circuits 33% Source: Chinese Customs 6 Clothing textiles, and shoes 36% counterfeiting. Counterfeiting is an attractive alternative to licit commerce because costs are reduced to manufacturing, transport and distribution. The costs involved in research, design and marketing are all avoided. Because counterfeiters are essentially unaccountable and have no interest in building a brand reputation, costs can be additionally reduced by cutting corners in the production phase, such as employing sweatshop labour, engaging in environmentally unsound manufacturing processes and using inferior-grade materials. Profits can be further maximised by avoiding taxes: import duties are evaded through customs fraud or outright smuggling, and sales taxes are avoided though informal retailing, which itself often makes use of illegal migrants working for little compensation. The end result is a product that can look very much like the original, but which can be sold for much less while generating a larger profit. Both the scale and the nature of Chinese manufacturing which often involves a large number of small firms collaborating to produce a single product 5 leave the country vulnerable to this abuse. The situation is similar to that found around Naples, where a large number of cottage industries have traditionally produced the world s haute couture alongside the world s best counterfeits. In addition, many of China s largest exports are products where branding is either a key signal of product quality (as is the case with electronic devices), provides value as a status symbol (as is the case with many apparel items) or is an end in itself (as is the case with certain toys). Mass-scale counterfeiting for export in China seems to be mainly a product of the last decade in 2000, China ranked fourth among national sources of counterfeits to the EU, responsible for only 8% of the cases 7 but counterfeiting in East Asia has deeper roots. In the 1980s, regional demand for Western luxury goods spurred the development of counterfeiting operations in Hong Kong, China and Taiwan Province of China. As the Chinese economy began to open in the 1990s, these firms set up operations in Xiamen, Fujian and the Pearl River Delta of Guangdong, where generous conditions were offered for foreign investors. The onset of domestic production in mainland China coincided with growing domestic demand, as well as growing demand from the Russian Federation and Central Asia. Chinese-made consumer goods were marketed in border trade fairs in Harbin and Shenyang, including cheap, low-quality counterfeits. The problem of counterfeiting is, of course, not 188 TRANSNATIONAL ORGANIZED CRIME THREAT ASSESSMENT
195 8 FIG. 158: VALUE OF SEIZURES MADE BY CHINESE CUSTOMS FOR INTELLECTUAL PROPERTY VIOLATIONS, FIG. 159: ATTEMPTS TO IMPORT COUNTERFEIT GOODS DETECTED AT EUROPEAN CUS- TOMS UNION BORDERS, US$ millions Source: Chinese Customs 12 Source: European Commission 16 limited to China, and the Chinese Government has taken extensive measures to address it. In 2009, the General Administration of Quality Supervision, Inspection and Quarantine dealt with some 200,000 cases of counterfeit or substandard products, dispatching nearly two million quality inspectors and seizing an estimated US$490 million worth of goods. 8 The State Administration for Industry and Commerce announced seizing US$221 million in counterfeits in In addition, Chinese Customs typically seize tens of millions of dollars worth of counterfeits bound for export. Those convicted stand to face stiff sentences: the ringleader of a software piracy operation was sentenced to seven years imprisonment in The problem is also regarded as serious by the Chinese public. A recent poll indicated that Chinese citizens regard counterfeiting and substandard goods as the greatest taint on the national image, second only to corruption. 11 Nonetheless, China remains the source of most of the counterfeit items seized in the world, including the USA and Europe. In 2008, the World Customs Organization, reporting on data collected from 121 countries, found that 65% of the total of counterfeit shipments detected departed from China, accounting for some 241 million pieces seized globally. Hong Kong, China was the departure point for another 8 million, bringing the figure above two thirds of the global total. 13 In the financial year 2009, mainland China was the source of US$205 million worth of goods seized in the United States, which was 79% of the value of all counterfeit products seized that year. Hong Kong, China was the source of another US$26 million, or 10%, and Taiwan Province of China contributed another 1%. Collectively, then, some 90% of the value of the counterfeits seized in the US in 2009 came from China. 14 The European Customs Union does not provide a similar valuation figure, but there is good reason to believe the problem is even more acute in Europe. The number of seizures in the US (some 15,000 in 2008) was less than one third of the number of cases Number of articles seized UNODC / SCIENCES PO FIG. 160: COUNTERFEIT GOODS SEIZED IN THE EUROPEAN UNION (NUMBER OF ARTICLES), Spain Netherlands Belgium France Germany Denmark Italy Evolution of the total, (millions) Bulgaria Source: European Commission - Taxation and Customs Union: Report on EU customs enforcement of intellectual property rights, Results at the European border Case studies of transnational threats 189
196 COUNTERFEIT PRODUCTS FIG. 161: Toys and games 4% J ewellery and watches 10% CD, DVD, Casettes 4% Computer equipment 1% E lectrical equipment 7% FIG. 162: registered at the European border (just under 50,000 in 2008), and the flow of counterfeits into the EU appears to be growing at a much faster rate. Either due to increasing incidence or increasing detection rates, the number of counterfeit seizures at the European border has increased tenfold in the last 10 years. In 2008, almost 200 million counterfeit items were detected. Most of the cases (57%) involved articles of clothing or accessories, followed by jewellery and watches (10%) and electrical equipment (7%). While encountered in a smaller number of cases, the most numerous items were CDs, DVDs and cassettes. France detected the greatest number of cases, while the Netherlands confiscated the greatest number of articles. 15 Cigarettes 1% Other 6% Indonesia 1% Japan 2% Syria 2% Turkey 3% Unknown 10% COUNTERFEIT SEIZURES MADE AT THE EUROPEAN BORDERS BY PRODUCT TYPE (NUMBER OF INCIDENTS), 2008 Medicines 6% UAE 12% Hong Kong SAR China 1% Taiwan, China 10% F ood <1% Cosmetics 4% Source: European Commission 17 Clothing, accessories, shoes 57% COUNTRY OF ORIGIN OF COUNTERFEIT GOODS SEIZED AT THE EUROPEAN CUS- TOMS UNION BORDER, 2008 Others 4% Source: European Commission 19 China 55% Mainland China was the origin of 55% of the counterfeits seized at the European borders, with Taiwan, Province of China accounting for another 10% and Hong Kong, China for another 1%. In other words, two thirds of the counterfeit products seized at the European border in 2008 were produced in China as a whole. 18 China was by far the leading source of clothing items, CD/DVDs, electrical equipment and toys. But China is also a leading licit supplier of many of these same commodities. Indeed, looking at any particular sector, the number of counterfeits seized is generally dwarfed by licit imports. For example, in 2008, just under 6 million pairs of counterfeit shoes made in China were seized entering the EU, which sounds like a lot. 20 But that same year, the EU imported 1.8 billion pairs of shoes from China, equal to 73% of total footwear imports, more than three pairs of shoes for every EU citizen. 21 Thus, the counterfeits seized were equal to about one third of a per cent of licit imports. Of course, seizures are themselves but a fraction of the illicit flow but, as discussed further below, there can be little doubt that the illicit market for Chinese goods in the European Union is much smaller than the licit. How is the trafficking conducted? China s decentralized manufacturing model means that virtually any product can be produced by endless combinations of otherwise unrelated suppliers. It also means that outsourced product specifications may be widely disseminated. As a result, aggrieved rights-holders cannot simply hold a single contractor responsible. Finding the source of any given counterfeit in this labyrinth of parts suppliers, tool makers and assemblers can be a daunting task. The impetus for a counterfeit product can come from many sources. Those with a ready overseas market for a particular product can find a production team willing and able to supply it. Those involved in producing a popular licensed product can also produce unauthorized over-runs. It is difficult to discern how much of the Chinese counterfeit market is due to push factors and how much to pull. In either case, counterfeiting in China has developed a life of its own. For example, in Chinese wholesale markets, counterfeit goods are graded based on the degree to which they resemble the original. Grade A merchandise may be manufactured in the factories licensed to produce the authentic goods, and are virtually indistinguishable. These products carry price tags that qualify them as luxury goods in their 190 TRANSNATIONAL ORGANIZED CRIME THREAT ASSESSMENT
197 8 own right. Lesser grades may simply be diverted factory seconds or they may be produced in dedicated workshops using lower-grade materials. For any popular product, several different grades of imitations are often available. Geographic specialization has also evolved, and certain areas of the country are associated with counterfeiting particular products. For example, the wholesale apparel markets are concentrated in several well known areas, and the retail distribution sites are equally well-known (see Box). Similarly, according to the China United Intellectual Property Protection Centre, groups in Chaosan (Guangdong) specialize in electronics, cigarettes, pharmaceuticals and CDs. Car parts are more likely to be sourced in Wenzhou (Zhejiang); in Jintan (Jiangsu), counterfeit pesticide is produced. 22 Guangdong, Fujian and Zhejiang provinces are likely the leading sources of counterfeits for export. Anhui and Henan are also major producers, but mainly of lesser quality goods, intended for domestic consumption or border trade. The goods are moved from their production sites to destinations along all the regular commercial streams, assisted along the way by corruption and bribery, if necessary. Because the Chinese law bases the penalties for counterfeit trafficking on the value of the material seized, traffickers have learned to break up their shipments into small consignments. This has allowed even repeat offenders to operate profitably for extended periods without fear of incarceration. Many of these goods do not go far. An increasing share appears to be consumed in China. In addition, cheap Chinese-made consumer goods of all kinds are available throughout South-East Asia, including counterfeits, and some of the production has been moved there. For example, when Chinese authorities began to crack down on the production of pirated CDs and DVDs, many producers moved their equipment into the semi-autonomous Special Regions in north-eastern Myanmar, especially Mong La (which also acts as a conduit for Chinese counterfeits). Though sold everywhere, the main volume outlets for counterfeit CDs and DVDs in South-East Asia are Mong La and Tachilek in Myanmar and Phnom Penh in Cambodia. Law enforcement in Thailand has made it less of a direct destination for such goods; Chiang Mai residents (Thai as well as foreign) usually travel to Mae Sai/Tachilek to buy fake CDs and DVDs. Such goods are also available in The Silk Street Market Beijing s Silk Street Market has become notorious as a source of fake brand-name apparel and accessories. From around 1985, the market catered to tourist, expatriate and growing domestic demand for high-quality knock-offs and falsely branded imitations. It has been the subject of repeated enforcement actions, but counterfeits have continuously re-emerged. Before the Beijing Olympics, the market was given a makeover. It was moved from its original street location to a five-storey indoor mall. A Silkstreet brand was launched, intended to replace the false logos and labels which were the market s primary draw. By all accounts, the Olympics were a tremendous success for the market, with foreign athletes flocking to the site, and some teams ordering tailored uniforms from the market s merchants. But the problem has proven persistent. In December 2009, Wang Zili, who managed the market from early 2006 to July 2009, was arrested for selling counterfeits. Wang had resigned his post and fled to Inner Mongolia after being investigated for his role in selling misbranded merchandise and accepting bribes from stall holders to allow the storage of counterfeits on the market s premises. A security official was also arrested in connection with the charges. 23 Silk Street is just one of many counterfeit markets aimed at tourists. In 2007, police raided the Jueshi Building in Shenzhen, seizing more than 20,000 designer items valued at US$2.6 million. The primary clientele were believed to be tourists from Hong Kong, China and Macao, China, brought on shopping excursions to the mainland by their tour guides. 24 Mae Sot (Thailand) opposite Myawady (Myanmar) and other border crossing points. It appears that most of the counterfeits trafficked to the EU are shipped by sea. Containerized transport, often with a confusing series of way stations, is common for long distance traffic. Goods may also be ferried by speedboat to Hong Kong, China before being trafficked on from there. In addition, they may transit Xiamen, Quemoy or Matsu on their way to Taiwan, Province of China. Those destined for South-East Asia often make use of the land border crossing from Guangxi and Yunnan. Webbased sales and courier delivery have become increasingly popular. As for many other forms of seemingly licit contraband, counterfeit goods from China often transit free trade zones on their way to Europe, particularly Jebel Ali (Dubai) and other free trade areas in the United Arab Emirates. This allows the origin of the goods to be disguised, and it also allows unbranded products to be decorated with the appropriate logos close to the destination market. The United Arab Emirates is the second biggest source of counterfeit goods seized at the borders of the EU, the provenance of more than 15% of all cases recorded in Many of these goods may have been based on raw (unbranded) merchandise from China. While sea and road transport are responsible for the Case studies of transnational threats 191
198 COUNTERFEIT PRODUCTS FIG. 163: FIG. 164: COUNTERFEIT ITEMS SEIZED ENTERING THE EU, BY MEANS OF CONVEYANCE, 2008 Sea 81% Other 1% Air 6% Source: European Commission Road 12% greatest volumes of good imported, there are a larger number of smaller consignments sent by air and by post. Both postal and road traffic appear to be growing in popularity. In Europe, counterfeits enter at all the major seaports. Not surprisingly, the Netherlands, with the biggest port in Europe (Rotterdam), detects the largest volume of counterfeits entering the EU, followed by Germany, with the second (Hamburg) and fourth (Bremen) largest ports. In Spain, Valencia is a primary entry point for textile goods, and, with Algeciras and Barcelona, is the gateway for the vast majority of all counterfeit products entering the country. While France detected a fraction of the volume of these major ports, it did detect the largest number of cases, suggesting the country is a favourite of those preferring to ship small amounts by air. SHARE OF ALL COUNTERFEITS DETECT- ED AT EUROPEAN BORDERS, BY COUN- TRY, 2008 Other 33% Spain 15% Germany 16% Source: European Commission Netherlands 36% Once through customs control, the merchandise is generally transported to a warehouse district for storing, repackaging and distribution. One example is the Cobo Calleja district near Madrid, which is host to a 2 million square meter zone known locally as mercachina. This zone houses more than 300 Chinese commercial distribution companies. The area was the subject of a recent police crackdown, which netted more than 1.5 million items. 25 Merchandise that has still not been branded may be further processed in the destination countries or elsewhere in the EU. Major counterfeit operators may set up legitimate businesses, such as clothing manufacturing or sales businesses, as fronts for counterfeit operations and sales. Some may be involved in licit import and export operations as well. The Internet may be used to market the products, particularly for products like lifestyle drugs, watches and perfumes. But the most common conduit for counterfeit goods are illegal immigrants, working in informal markets. These hucksters are often the target of the bulk of enforcement efforts, but are symptoms, rather than causes, of the problem. Who are the traffickers? Counterfeiting operations in China vary greatly in their size and sophistication. Operations that gain their supply from over-runs or use of factory seconds make use of the same infrastructure as the licensed producers. In general, counterfeit production is as decentralised as other aspects of Chinese manufacturing. For example, in 2007 two brothers were charged with producing 160,000 fake branded razor blades from their home, using family members for labour and selling the counterfeits to a connection in Shanghai. 26 Many of the larger operations producing counterfeits in China today were founded, or at least funded, by people from Hong Kong, China and Taiwan, Province of China, who had already been active in the trade. The lower-end production in Anhui and Henan, aimed at the local and border markets, has traditionally been financed by businesspeople from Guangdong and Zhejian. New operations likely spring up whenever demand for a new product necessitates new supply chains. Many of those participating in creating components of the final counterfeit product may have no notion that they are involved in anything illegal. They are simply responding to new orders for products or services in an extremely complicated open market. 192 TRANSNATIONAL ORGANIZED CRIME THREAT ASSESSMENT
199 8 Since mainstream transportation channels are utilized, those who move the cargo internationally may also be unaware of the illicit nature of the consignment. If the products are only falsely branded at a re-routing hub or at destination, they may actually be entirely legal during transit. Those knowingly committing a crime may be confined to the destination countries. Expatriate Chinese who are resident in Europe appear to play an important role in receiving and processing the goods in many instances, however, as do vendors from South Asia. FIG. 165: EUROPEAN MARKET FOR CHINESE FOOTWEAR SHARE OF LICIT, ESTIMAT- ED ILLICIT AND SEIZURES, 2008 Estimated illicit imports Of which, seizures 4% 0.3% Some of these goods are directed into licit commercial outlets. In some cases, the retailers may not be aware of the nature of what they are selling, but most of the time, it appears that there is at least willing blindness to the origin of this drastically discounted merchandise. A survey from the British Home Office found that 44% of the businesses in three high-crime areas had been offered counterfeit goods in the year prior to the survey. 27 Whatever the role of licit retailers, the bulk of the trade appears to be conducted through informal markets and street sales. From places like Warsaw s once notorious Stadium Market to dozens of municipal flea markets across the United Kingdom, thousands of small entrepreneurs flog counterfeit merchandise. Street sales people are most often illegal immigrants, often from Africa or Asia. There have been many documented cases of illegal immigrants being forced into counterfeit distribution by the migrant smugglers. The pattern is similar to what is seen in human trafficking for the purposes of sexual exploitation from West Africa to Europe. The debt incurred by the migrant is so great that they cannot resist demands from their sponsor to engage in illicit work, and the activity becomes tantamount to human trafficking. There is also involvement by traditional organized crime groups such as the Neapolitan Camorra, which has long sold designer knock-offs manufactured by the same craftspeople who produce the originals. Today, the Camorra increasingly sells products manufactured in Asia, using the same marketing channels. How big is the flow? The European Union does not attach a financial value to the seizures of counterfeit goods it makes. The United States does, and puts the figure at around US$261 million from 14,841 seizures in financial year The types of products seized in both the US and the EU are similar. For example, 57% of the goods seized at the European border in Licit footwear imports 96% Source: Elaborated from data from the European Commission 2008 fell under the heading of clothing, shoes and accessories; in the US, it was 58%. If average value of each item seized in the EU was about the same as in the US, the European seizures from all sources would be worth roughly US$867 million in The question is: what share of the total flow does this seizure total represent? If about half the flow were intercepted, this would suggest a market worth at least half a billion dollars; this could be considered a minimum figure. If the share seized were 10%, the figure would be US$8.7 billion. If only 1%, it could be as high as US$87 billion; higher than this would suggest extraordinarily weak enforcement. Of this, some two thirds would come from China. Which order of magnitude is correct? There are several possible ways of getting a sense of which interception rate is most likely, all of which rely on clarifying the extent of demand. One is to compare this illicit flow to what is known about licit demand for the same goods. Returning to the footwear example again, in 2008, just under 6 million pairs of counterfeit shoes made in China were seized entering the EU, 29 and 1.8 billion pairs were legally imported. 30 If the market for counterfeit Chinese shoes were as large as that for legal ones, the interception rate would be only three tenths of one per cent. If for every 20 pairs of authorised Chinese-made shoes imported, one illicit pair was sold, 31 this would suggest an interception rate of 7%, which seems plausible, but needs further verification. Another way of getting at the extent of demand is to look to consumer surveys. One poll of consumers Case studies of transnational threats 193
200 COUNTERFEIT PRODUCTS in Spain in 2006 estimated that Spaniards spent 285 million euros on counterfeit goods in the previous year. 32 This boils down to about six euros per citizen per year. A similar study in the United Kingdom in 2007 found expenditures of 261 million pounds on watches, 351 pounds on fragrances, and some 3 billion pounds on clothing and footwear. 33 This is equal to about 59 pounds (about 66 euros) per citizen for the year. If all 500 million EU citizens spent between six and 60 euros each year on counterfeits, and the source of these counterfeits was the same as the counterfeits seized at the borders, then EU citizens would spend between about 2 billion and 20 billion Euros per year on counterfeit goods imported from China. This suggests an interception rate of between 3% and 30%. The true interception rate is unlikely to be as high as 30%, given that counterfeit clothing and footwear consumption in the UK alone is estimated to be worth more than 2 billion euros. Using the 7% interception rate posited for footwear above, an estimate of US$8.2 billion in 2008 can be derived. If the volume varies at the same rate as the value, this would involve some 2.5 billion counterfeit items. 194 TRANSNATIONAL ORGANIZED CRIME THREAT ASSESSMENT
201
202 COUNTERFEIT PRODUCTS What is the nature of this market? There has been much debate around what comprises a counterfeit medication, and the issue has become highly politicized. On the one hand, large international pharmaceutical companies invest more of their income in research and development than in just about any other industry, and need to protect this investment in order to continue to do so. On the other, smaller manufacturers in developing countries seek to meet the needs of the poorer countries, but some may have difficulties in meeting international quality standards. In some cases, cheaper, but lesser quality, medication is better than nothing; in other cases, it clearly is not. Counterfeit versus substandard The terms counterfeit drugs and substandard drugs are often conflated or confused. For public health purposes, the World Health Organization defines a counterfeit drug as one that is deliberately and fraudulently mislabelled with respect to identity and or source, and substandard drugs as genuine drug products which do not meet quality specifications set for them. Since counterfeiters seek to maximize profits, most counterfeits would be considered substandard if they were genuine products. Not all substandard drugs represent intentional frauds, however, because manufactures may believe that their products contain the active ingredients specified on the labels. Normally, for inaccurate labelling to amount to the crime of consumer fraud, some degree of intent must be demonstrated, but constructive fraud can be imputed where the perpetrator has a duty of care to the victim. Given that the manufacturing of pharmaceuticals is an activity with life-and-death consequences, a very high standard of care should be expected from drug producers. Particularly with regard to the amount of active ingredient, a matter where profit incentives favour mislabelling, anything other than the strictest adherence to standard could be regarded as reckless and any deaths that result could be deemed manslaughter. Products that are packaged in a way to misrepresent the manufacturer are clearly counterfeit, whatever their chemical content, but so are authentic products where the expiration date has been altered. Drugs that do not contain the amount of active ingredient specified on the label fall into a grey area. Those that are completely inert are unlikely to be the product of genuine mistakes. Similarly, those that contain pharmaceutically inappropriate chemicals or binders, especially those intended to mimic the effects of the specified drug, show the required level of intentionality to be considered counterfeits. Drugs containing certain contaminants, moulds or excessively high levels of active ingredient are unlikely to be deliberate frauds, but may rise to the level of recklessness to be considered a criminal act, especially when repeatedly traced back to the same source. Products labeled as counterfeit run the range from overt forgeries to pharmaceutically-sound close imitations; from substandard generic medications to repackaged expired drugs. The contents may be inert or dilute or inappropriate or poisonous. For the purposes of this discussion, counterfeit means any product that does not contain what the packaging indicates. This applies equally to branding as to chemical content, freshness and potency. Defined in this way, pharmaceutical counterfeiting is a form of health fraud that often amounts to mass manslaughter. A frequently cited estimate, attributed to the World Health Organization, is that 10% of the global medicine supply is counterfeit, rising to 30% in the developing world. Though the basis of this estimate is unclear, the figure is alarming, especially given the narrow definition of counterfeit used by the WHO. The bulk of world pharmaceutical sales occur in North America and Europe. These areas are not immune to counterfeit medicines: in 2008, the European Customs Union detected over 3,200 attempts to import bogus drugs, involving almost 9 million items, over half of which originated in India. Much of this trade involves so-called lifestyle drugs (particularly Pfizer s Viagra ), however, often ordered from on-line pharmacies, although there have been a number of well publicized detections of counterfeit essential medicines destined for the legitimate supply chain in North America and Europe. 34 The rest of the world consumes far fewer pharmaceuticals. If Japan is excluded, then Asia, Africa, and Australia combined represent less than 10% of the global market. Despite the relatively low value of drug sales in developing countries, pharmaceutical counterfeits are particularly prevalent in South-East Asia and Africa. According to the World Health Organization, counterfeits comprise less than 1% of the market value in most developed countries, although this figure may be increasing. In some developing countries in Africa, Asia and Latin America, the share is much higher, between 10% and 30%. 35 As much as 50% to 60% of anti-infective medications tested in parts of Asia and Africa have been found to have active ingredients outside of acceptable limits. 36 In other words, this is an opportunistic crime, emerging where regulatory capacity is low, not where profits would be highest. It is also an extremely callous one, depriving the poorest of lifesaving medicine, leading to countless deaths, for a relatively meager return. Beyond the direct impact on the victims, substandard medicines can fuel microbial resistance. Each under-medicated patient becomes an evolutionary vector though which superbugs can develop, posing a global threat to public health. 196 TRANSNATIONAL ORGANIZED CRIME THREAT ASSESSMENT
203 8 FIG. 166: GEOGRAPHIC DISTRIBUTION OF GLOBAL PHARMACEUTI- CAL SALES, 2007 FIG. 167: DISTRIBUTION OF COUNTERFEIT INCIDENTS DETECTED BY THE PHARMA- CEUTICAL SECURITY INSTITUTE, 2008 Asia, Africa, and Australia $62.2 billion Latin America Japan $32 billion $58.5 billion North America $304.5 billion North America 8% Eurasia 9% Near East 8% Africa 2% Asia 39% Europe $206.2 billion Europe 16% Latin America 18% Source: IMS Health Source: Pharmaceutical Security Institute 38 According to the incident database of the Pharmaceutical Security Institute, countries in Asia report the largest share of counterfeits detected globally, with Africa responsible for only 2%. But this is undoubtedly a product of enforcement capacity, because field tests of pharmaceuticals in both regions have produced similarly high shares of counterfeits. For example, one of the most commonly counterfeited drugs is artesunate, an antimalarial artemisinin derivative developed in China and widely used in South-East Asia and Africa. There are at least 16 manufacturers of artemisinin in Asia and millions of tablets are produced each year for local consumption and export. 39 According to street venders in West Africa, anti-malarials are among their most popular products. In 2003, researchers conducted a randomized study of artesunate tablets sold in the Lao People s Democratic Republic. Of the 25 outlets selected where artesunate was sold, 22 sold counterfeit artesunate, as defined by packaging and chemistry. Four of the fakes contained detectable amounts of artemisinin, which may encourage malaria resistance to artemisinin derivatives. 40 In 2008, many of these same researchers collected a total of 391 samples of genuine and counterfeit artesunate in Viet Nam, Cambodia, Lao People s Democratic Republic, Myanmar and along the Thai/Myanmar border. Sixteen different fake holograms, a safety feature introduced into the packaging to reduce counterfeiting, were identified. Half of the samples were believed to be counterfeit based on the packaging, and this was confirmed chemically. The tablets contained no or small quantities of artesunate, as well as other active adulterants. Analysis was able to trace some of the samples to southern China, close to the border with Viet Nam, the Lao People s Democratic Republic and Myanmar. 41 Based in part on this evidence, INTERPOL coordinated Operation Jupiter III, one in a series of anticounterfeiting operations. Chinese authorities arrested a suspect in Yunnan Province in 2006, FIG. 168: UNODC / SCIENCES PO West Africa Source: UNODC Main countries of production COUNTERFEIT MEDICINES FLOWS Southern Africa East Africa India China South-East Asia Case studies of transnational threats 197
204 COUNTERFEIT PRODUCTS FIG. 169: PERCENTAGE OF CHLOROQUINE TABLETS FAILING POTENCY TESTS IN SELECTED COUNTRIES, 2003 Ghana Zimbabwe Mali Kenya Gabon Mozambique S udan alleged to have traded 240,000 blister-packs of counterfeit artesunate. Police seized only a tenth of this amount, the rest of which had already been sold on the Myanmar border. 42 In 2008, INTERPOL coordinated Operation Storm, in which nearly 200 raids were carried out, in Cambodia, China, the Lao People s Democratic Republic, Myanmar, Singapore, Thailand and Viet Nam, resulting in 27 arrests and the seizure of more than 16 million pills with an estimated value of US$6.6 million. 43 In late 2009, Operation Storm II resulted in the seizure of 20 million counterfeit and illegal medicines, at least 33 arrests, and the closure of some 100 pharmacies and illicit drug outlets in Cambodia, China, Indonesia, the Lao People s Democratic Republic, Myanmar, Singapore, Thailand and Viet Nam. 44 Systematic pharmaceutical quality testing is rare in Africa, but there is rich anecdotal evidence indicating a problem every bit as severe. One of the only studies involving random sampling in West Africa tested medicines from 581 Nigerian pharmacies and found that 48% of anti-infectives contained active ingredients outside acceptable limits. 45 One small scale study of artesunate sold in Ghana found that of 17 brands sold, only six passed the International Pharmocopoeia content uniformity test and only three met the European Pharmocopoeia content requirements. 46 A 2003 study of counterfeit chloroquine, the traditional anti-malarial, in seven African countries showed not only the high percentage of the sample that failed to meet drug standards, but also how widely spread the counterfeits were, showing up everywhere, from district hospitals to local vendors and households Source: World Health Organization 48 There have also been many recent detections by law enforcement of counterfeit drugs in Africa. In Tanzania in 2009, INTERPOL coordinated Operation Mamba, in which 191 locations, including pharmacies, warehouses and illicit markets, were inspected. Medicines of all types, including anti-malarials, were confiscated, and 22 drug retailers were shut down. A similar effort was made in Uganda. 49 In Egypt, INTERPOL also led six combined operations in April and May 2009 in which 10 containers were seized, each holding hundreds of thousands of counterfeit medicines bound for the Middle East, 50 likely for trans-shipment. While some of these drugs are produced locally, the bulk are said to be produced in Asia, in particular in India and China. According to the Commonwealth Business Council Working Group on Healthcare, The vast majority of counterfeit medicines are currently thought to be produced in China, India and the Russian Federation, although significant numbers of illegal factories have also been reported in Nigeria, and the Philippines. 51 According to Dora Akunyili, former Director General of the National Agency for Food and Drug Administration and Control (NAFDAC) of Nigeria, Most of the fake drugs in Nigeria come from India and China. 52 Large consignments of counterfeit drugs made in India and bound for Africa have been seized in Europe. 53 Forensic study of the origin of these drugs, similar to what has been conducted in South-East Asia, is forthcoming. 54 In June 2009, Nigeria had seized a large consignment of counterfeit anti-malarial drugs made in China but falsely labelled Made in India. 55 The Chinese government has taken the matter seriously, sentencing the six Chinese citizens responsible to death. 56 China s licit pharmaceutical export trade has boomed alongside the rest of the economy, growing eight times larger in less than a decade; from US$3.4 billion in 1998 to US$24.6 billion in But this has been paralleled by a growth in imports, which have grown by nearly a factor of 10, from US$1.5 billion in 1998 to US$14 billion in India s export of pharmaceuticals has also expanded rapidly since the start of the twenty-first century, growing four times larger since that time. The biggest market for Chinese counterfeit pharmaceuticals may be China itself. China s primary source of licit medicine is domestic; it exports more medicine than it imports. Although no published national randomized study of counterfeit medicine prevalence exists, it is believed that the share is particularly high in the remote and poorer provinces TRANSNATIONAL ORGANIZED CRIME THREAT ASSESSMENT
205 8 For example, at least nine people were recently hospitalized and two died from consuming a counterfeit diabetes drug in the Xinjiang Uygur Autonomous Region. 62 In contrast, testing conducted in India s domestic markets has found that a very small share of the drugs were deemed spurious (falsely branded), less than 2% of the anti-infectives, for example. 63 Most of these instances were in the under-developed provinces of Bihar, West Bengal and Uttar Pradesh, as well as in Gujarat. While small in Indian terms, the spurious drugs market in India has been estimated at some US$250 million sales per annum. 64 The same study found, however, that as much as 10% of the drugs tested were substandard. 65 Under the definition used for this chapter (a product that does not contain what the packaging indicates ), all substandard medication would be considered counterfeit. The active ingredient accounts for 90% of the cost of most drugs, so even a 10% dilution can translate into a significant competitive edge. Diluted drugs can be difficult to detect, requiring quantitative chemical analysis. Even when they are detected, it is difficult to prove the dilution was intentional, and most such offences would be regarded as a trade infraction, rather than a criminal matter. Producers who lose their licenses in such matters may reincorporate under another name. In China, the production of fraudulent medications can be traced to the early 1980s. Many of these early forays into pharmaceutical fraud involved bogus herbal cures, in a country where traditional medicine is taken very seriously. These were marketed throughout the country by roving salesmen who posed as medical doctors, diagnosing illnesses and prescribing these patent medicines. The trade has become more sophisticated since that time: in March 2009, the Chinese Government had identified 365 websites selling fake traditional Chinese medicine. 66 In India, the market is said to have emerged a little more recently, starting in the twenty-first century. How is the trafficking conducted? Production The production of counterfeit pharmaceuticals can be as simple as producing alternative packaging materials using a laser printer or as complicated as the production of the original product. In general, counterfeit production in China appears to be more sophisticated than in India. In China, counterfeit drug producers are often chemical companies that US$millions FIG. 170: 7,000 6,000 5,000 4,000 3,000 2,000 1,000 0 FIG. 171: US$ millions IMPORT AND EXPORT OF PHARMACEUTICALS FROM CHINA, ,500 4,000 3,500 3,000 2,500 2,000 1,500 1, Source: National Bureau of Statistics of China 59 EXPORT OF PHARMACEUTICALS FROM INDIA, /7 1998/9 2000/1 2002/3 2004/5 are not licensed to produce pharmaceuticals, 67 or even licensed companies that produce both legitimate and bogus drugs. In 2008, the Chinese Government shut down 363 fake medicine production facilities. 68 In India, the manufacturers can be loosely grouped into three categories: unlicensed manufacturers who operate out of small cottage factories, licensed manufacturers who secretly make fake drugs alongside their legitimate products, and importers who bring in drugs from China and then fraudulently repackage them. The small manufacturers operate from the outskirts of major cities. In the past, their products were crude, but the dispersion of printing and packaging technology has brought credibility within the reach Medicinal and pharmaceutical product exports Pharmaceutical products imports 2006/7 Source: Department of Commerce of India 60 Case studies of transnational threats 199
206 COUNTERFEIT PRODUCTS of even the small entrepreneur. Medications may contain the right active ingredient in dilute amounts, and are distributed through informal channels to local retailers. Agra is reportedly a major outlet for these drugs. 69 As in China, counterfeiters may produce licensed pharmaceuticals by day and knock-offs by night. One case in point involved a pharmaceutical company in Gurgaon, Haryana. When the Food and Drug Administration confronted the owner with evidence of the counterfeit goods, he disavowed all knowledge of the products except for one: a tablet containing a new generation antibiotic ciprofloxacin. Upon testing at the state and central drug laboratories, it was found that the pill contained no ciprofloxacin at all, and the company s manufacturing license was revoked. But the factory continued to operate at night, until an evening raid by police uncovered an underground cellar in the factory, where exact look-alikes of several popular, fast-moving, high-cost medicines were being manufactured, most of which contained no active ingredient. 70 The latest trend may be the importation and repackaging of difficult to counterfeit drugs, such as biological formulations. The November 2009 seizure of illegally imported human immunoglobulin vials from a company in Mumbai is a case in point. As the product did contain some immunoglobulin, it appears that the vials were imported from a lesser producer in China and repackaged under a leading brand name. The counterfeits were being offered at 25% less than the market price. 71 Another case involved the seizure in Kochi, Kerala, of counterfeit name brand immunosuppressants, drugs designed to support organ transplantation, worth some US$11 million. Further evidence that counterfeit pharmaceutical products are being imported illegally from China emerged with three seizures at the port of Chennai in May 2009 alone. 72 Trafficking There are a number of ways counterfeit distributors in Africa can link up with producers in China. One case, adjudicated in China, started when a Nigerian businessman resident in China placed an order with a Chinese medicine exporter for counterfeit antimalarial medication. The exporter contracted the job to a pharmaceutical company employee, providing samples of the drug to be copied. This employee subcontracted the printing of the boxes and package inserts to a printing company employee. False shipping documents were obtained to indicate the source of the drug was Thailand. The drugs were seized en route in Belgium, shipped alongside counterfeit antibiotics, exported by a different Chinese counterfeiting group. On arrest of this second group, some 43 tons of counterfeit drugs were seized. 73 As with other ostensibly legitimate cargo, pharmaceuticals are often shipped out through regular freight companies. The contents may be falsely declared to avoid targeted inspections. Many of the counterfeit pharmaceutical consignments exported from China are containerized, some passing through customs by means of stealth or bribery. Some of the products destined for South-East Asia are shipped to Hong Kong by speedboat, consolidated, and shipped on by container. Smaller amounts, such as those associated with Internet sales, are dispatched by international courier services. According to the International Narcotics Control Board, India has become one of the main sources of drugs sold through illegally operating Internet pharmacies. Orders placed with such pharmacies are often dispatched to buyers in other countries using courier or postal services. Since 2002, Indian law enforcement agencies have detected and disbanded several groups that were operating illegal Internet pharmacies. 74 Law enforcement officials in South-East Asia say that the majority of the counterfeit pharmaceuticals in their countries come from Fujian, Guangdong and Yunnan provinces of China. Some of this traffic moves first through Shenzhen and Hong Kong, China before arriving in South-East Asia. Some is smuggled directly into Viet Nam at border crossings in Pinxiang and Nanning (on the Chinese side) to Huu Nhgi at Dong Dang in Viet Nam s Lang Son province. The Lao Cai border crossing point is more popular when the medicine is coming from Kunming (Yunnan province). When coming from Quangzhou, the border-crossing point at Mong Cai is used. The goods do not necessarily pass through official checkpoints at these border crossings. Rather, the main roads are used until the goods are close to the border. If necessary to avoid inspection, the goods can be moved across the border at unofficial crossing points. 75 Medicine coming from Kunming (but not necessarily originating there) is also smuggled into Myanmar, from Daluo (Yunnan province) to Mong La. As with other trafficked goods, the Je-Gao Chinese enclave in Myanmar connected to Ruili (Yunnan) and close to Muse (Myanmar) is a popular crossing spot. The Cangyuan Va Autonomous County is 200 TRANSNATIONAL ORGANIZED CRIME THREAT ASSESSMENT
207 8 also close to Saohin-Saohpa (Panghwei) in the northern Wa Hills of Myanmar, a rebel controlled area. Another route is from China along the Namting river into the Kokang area of northeastern Myanmar near the towns of Nam Teuk and Chinsweho. From there, the road leads west to Hsenwi (Theinwi) and Lashio in north-eastern Myanmar, and on to Mandalay and other urban centres in central Myanmar. Goods can proceed through Monywa near Mandalay to Tamu/Moreh on the Indian border. Counterfeit medicines are also smuggled to the Lao People s Democratic Republic, and through Laos to Cambodia. In Thailand, however, the availability of fake medicines is relatively limited. 76 Trafficking from India would proceed from the source provinces to exporters in Maharashtra, Gujarat, and Tamil Nadu. 77 The exact distribution channels in Africa are not well known. Nigeria appears to act as a clearing house for goods imported for regional distribution. Who are the traffickers? As discussed above, the counterfeit producers may have all the trappings of legitimate businesses and use the licit channels of commerce to distribute their products. People involved in the licit pharmaceutical industry or in other areas of public health may be involved. These people are specialists, and are unlikely to be involved in other forms of criminal commerce. Pharmaceutical counterfeiters may also make use of the services of traditional organized crime groups, however. For example, in China, if complicit wholesalers and retail outlets decide to default on their debts, it is easier to employ local thugs to collect than to risk exposure in the courts. Competition between rival firms may, in some instances, be settled with hired muscle. But for the most part, corruption achieves what stealth or violence would accomplish in other markets. For example, complicit officials or their relatives may be awarded stock in these operations, receiving periodic dividends. Wholesalers and distributors may also play an important role in introducing counterfeits into the supply chain. They may dilute shipments of legitimate pharmaceuticals by replacing part of the stock with counterfeits, retaining the balance for resale. In India, as well as in destination markets, pharmaceuticals are sold and transported like any other product. Countries where the oversight of these market players is limited are vulnerable to this sort of insider tampering. As a result, legitimate exporters may unwittingly source counterfeit medication for their African and South-East Asian clientele. In a pending case, one exporter of antibiotics and painkillers to Nigeria, Benin and the Congo, found that one of its long-term suppliers did not have a manufacturing facility at all and was using a forged export permit. In China, some of the larger domestic counterfeit drugs operations boast their own truck fleets. Some export operations have agents overseas in both transit and destination countries. Many of the key agents have important political connections, and some run their operations remotely, from Hong Kong, China or overseas. 78 In India, states in the north and east are affected by counterfeits manufacturing, but exports mostly occur from the southerly states. How big is the flow? Quantifying the scale of an industrial activity in rapidly changing societies the size of China or India is a daunting task; estimating the share of this activity that is clandestine is all the more so. Statistics are kept by different agencies at different levels of government, and may never be amalgamated at the national level. The definitions of sector may vary between agencies, and even within agencies over time. Some figures may include traditional medicines and supplements, while others may not. Medical devices, including everything from bandages to prosthetic limbs and pacemakers, may also be included at times. Further, as discussed above, there is no consensus on what defines a counterfeit pharmaceutical, and whether any particular substandard operation is considered egregious to merit the title counterfeit is often a matter of judgment. In China, the official data on seizures are both difficult to access and complex. Independent statistics are kept by each of a range of entities that might act against counterfeiters at local and national levels, including the food and drug administrations; the administrations for industry and commerce; the public security bureaus; and customs officials. The State Food and Drug Administration (FDA) reports having closed over 9,000 unlicensed pharmaceutical manufacturers and eradicated 388 counterfeiting operations in The value of the products confiscated in these proceedings varies substantially from year to year, from million yuan in 2006 to million yuan in 2007 (about US$35 in 2006 and US$25 million in 2007). 79 Seizures in China are thought to account for less than 5% of Case studies of transnational threats 201
208 COUNTERFEIT PRODUCTS counterfeit medicine output, which would suggest a total market of at least US$500 million based on the FDA seizures. But this is only part of the picture, since agencies other than FDA seize drugs. For export markets, customs seizures are particularly relevant. Chinese customs seizures of counterfeit pharmaceuticals typically comprise less than 1% of the total value of all counterfeit products seized, however only 11 such seizures, valued at 850,000 yuan (about US$125,000), were made in Experts estimate that since the mid-1990s, transactions in counterfeit medicines, health-care products and medical equipment in China have been growing at an annual rate of 15%, with the market value currently standing at around 20 billion yuan (about US$3 billion) per year. The export market and domestic market are believed to account for 40% and 60% of the total respectively. This would suggest an export value of US$1.2 billion. If correct, the counterfeit export trade would be equal to about 5% of Chinese pharmaceutical exports (estimated at US$24.6 billion). If a similar figure were applied to India s exports of US$7.6 billion, the combined counterfeit export value would be worth about US$1.6 billion. These export figures need to be placed in perspective by looking at the import markets in Africa and South-East Asia. The poorer countries in South- East Asia typically consume less than US$10 per capita per year on pharmaceuticals. 81 With a population of some 600 million, this would indicate a total market of less than US$6 billion. Per capita expenditure in Africa is even less, perhaps US$8 per capita, 82 representing a total annual expenditure of about eight billion dollars. If half the markets in each of these regions involved counterfeits, this would represent a combined annual market of around seven billion dollars. Given that both the share counterfeit and the per capita expenditures are rather soft figures, the US$1.6 billion market value cited above seems reasonable, representing about one tenth of all pharmaceutical sales and billions of dose units. 202 TRANSNATIONAL ORGANIZED CRIME THREAT ASSESSMENT
209 8 IMPLICATIONS FOR RESPONSE Counterfeiting can and must be combated at the source, but in a globalized world, this source is increasingly difficult to locate. The technology is widely available; for example, medicinal counterfeiting often involves nothing more than laserprinting new boxes and repackaging. China and India appear prominently because they are large countries promoting exports, and while shutting down production in either of these countries would have global impact, it would also create opportunities for criminals located elsewhere. Those who might be interested in buying a cheaper version of a popular product are similarly widespread. Little can be done to deter consumers committed to buying fake goods; there is not much support for criminalizing possession, and it would be difficult to prove buyers were not duped. Public awareness campaigns may help reduce demand, but only if members of the public can tell the genuine product from a counterfeit. To prevent fraud, the line between real products and knock-offs must be clearly articulated. Part of the solution is technological, making use of packaging and other markers that are increasingly difficult to imitate. Part is educational, assuring that consumers are aware of these markers and the possible consequences of ignoring them. retailers are ripe for public education efforts, where the hazards of buying merchandise of questionable origin can be publicized. These sites can also be subjected to preventative policing and police stings. Efforts should be made to break the link between counterfeit sales and migrant smuggling. The main barrier faced in enforcement is getting the authorities to take the matter seriously. So long as the chances of apprehension are low, sentences light and profits high, counterfeiting will remain a rational choice for many. It is imperative that measures be taken to protect the licit supply chain. If reputable wholesalers and retailers assure that their sources are clean, then the buying of counterfeits will remain a marginal activity. These retailers should be motivated to protect their reputations, but those found negligent in screening the products they sell should be held liable. Those outlets that specialize in discounted goods must be scrutinized. On an industrial level, purchasing agents must be carefully monitored. Policy should not encourage buyers to place price over reputability. The public cannot be prevented from buying cheap goods, but consumers should at least be assured that they get what they paid for. There is one market where price is likely to continue to be more important than quality assurance, and that is the market for pharmaceuticals in Africa. For the poorest consumers, the choice may be between questionable medicine and no medicine at all. The ultimate solution to this dilemma is ensure that they are never forced to make this choice, and that life-saving medication is available to all. Until this is possible, vigorous law enforcement is essential to protect the most vulnerable of consumers. African agencies need outside support to protect their populations, while agencies in source countries must continue to crack down on this shameful enterprise. The producers of legal medicines may be reluctant to disclose instances of counterfeiting for fear of hurting their market, but they should be legally compelled to do so. Manufacturers of medicine should be required to adhere to the same standards for exported products as for those made for local consumption. So long as the bulk of this trade occurs in the open, counterfeit distribution can be targeted geographically. Flea markets, street hawking sites and fringe Case studies of transnational threats 203
210
211 9 MARITIME PIRACY
212
213 9 MARITIME PIRACY Unlike most of the other organized crime problems discussed in this report, maritime piracy is not a trafficking issue. No contraband is moved, no illicit market serviced. Rather, it is a violent, acquisitive crime. 1 It is transnational because a ship is considered the sovereign territory of the nation whose flag she flies. 2 It is organized because commandeering a ship at sea requires considerable planning and some specialized expertise. The following chapter focuses on just one piracy problem: that found off the coast of Somalia, especially in the Gulf of Aden. This area has seen the largest share of global piracy attacks in recent years, and the problem appears to be growing. Somalia is not the only area of the world affected by maritime piracy, however. The Gulf of Guinea in West Africa has long been a high risk area, as are the waters along Bangladesh and the South China Sea. But in 2009, more than half the global piracy attacks were ascribed to Somali pirates. The term piracy encompasses two distinct sorts of offences: the first is robbery or hijacking, where the target of the attack is to steal a maritime vessel or its cargo; the second is kidnapping, where the vessel and crew are threatened until a ransom is paid. The Somali situation is unique in that almost all of the piracy involves kidnapping for ransom. Until recently, piracy was a phenomenon in decline. Twenty-first century piracy was first seen in the South China Sea and in the Malacca Straits. 3 Attacks peaked at roughly 350 to 450 reported attacks per year during the period , and then dropped by almost half in This reduction was attributed to effective and coordinated international action against the pirates. But in , piracy again skyrocketed, due almost entirely to the dramatic increase of piracy off the Coast of Somalia. Piracy is once again on the forefront of the international community s attention, as maritime trade is threatened and ransom payments to Somali pirates have risen to the millions of dollars. FIG. 173: Total number of attacks LOCATIONS OF ALL REPORTED PIRACY ATTACKS, Somalia/Gulf of Aden Rest of world Somalia/Gulf of Aden Rest of world Source: IMB-ICC annual reports, FIG. 174: PIRACY ATTACKS, 2009 Each dot represents a piracy or armed robbery incident during 2009 Total per regions Note: The names of countries are mentioned when the number of attacks was higher than 10 in UNODC / SCIENCES PO Pacific Ocean Caribbean Sea Peru South and Central 37 America Atlantic Ocean Nigeria Gulf of Guinea 47 West Africa Gulf of Aden Somalia India Indian Ocean, Red Sea and Gulf of Aden Bangladesh South Asia Indian Ocean Bay of Bengal 67 Viet Nam Malaysia Indonesia South-East Asia Pacific Ocean Sources: International Chamber of Commerce, International Maritime Bureau, Piracy Reporting Center Case studies of transnational threats 207
214 MARITIME PIRACY FIG. 175: PIRACY ATTACKS, MAIN COUNTRIES, Number of pirate attacks 350 Countries with more than 50 attacks during the period Nigeria Bangladesh India Malacca Straits Singapore Straits Malaysia Indonesia Ecuador Sri Lanka Thailand Philippines Brazil Source: ICC International Maritime Bureau, Piracy and Armed Roberry against Ships, annual reports from 2003 to 2009 China (including Hong Kong, Macao and Taiwan) Somalia / Red Sea / Gulf of Aden 10 Peru United Republic of Tanzania Bolivarian Republic of Venezuela Viet Nam 208 TRANSNATIONAL ORGANIZED CRIME THREAT ASSESSMENT
215
216 MARITIME PIRACY What is the nature of this market? Although there have long been pirates based in Somalia, profiting off the commercial maritime flows that concentrate in the area, recent events are a direct product of the social and political chaos that has prevailed in the last two decades. After the 22-year dictatorship of Siad Barre and 18 years of civil war, the central government collapsed in 1991, and the country effectively split into three: the independent north-eastern state of Somaliland; the central semi-autonomous region of Puntland; and the south-western state of Somalia. Today, the Transitional Federal Government of Somalia still does not retain full control of the capital, let alone the rest of its sovereign territory. Over three million Somalis depend on food aid, more than a two-third increase from The country has one of the highest maternal mortality rates in the world. Less than a quarter of Somalia s children go to school, and the country is about to become Africa s least literate. There has been a continuous outflow of refugees and migrants to neighboring countries, with the UN High Commissioner for Refugees estimating that as many as 50,000 people, predominantly Somalis, crossed the Gulf of Aden to Yemen in Modern piracy off the coast of Somalia is said to have arisen from efforts of local fishermen, who formed vigilante groups to protect their territorial waters. After the fall of the Barre regime, foreign vessels from Europe, Asia and Africa moved into tuna-rich Somali waters en masse. Unauthorized fishing may have resulted in the loss of nearly 30% of the annual catch. The United Kingdom Department for International Development (DFID) has estimated that Somalis lost US$100 million to illegal tuna and shrimp fishing in , at a time when the country s GDP was perhaps US$5 billion. 6 There have also been reports of toxic waste dumping in Somali waters. Initially, vessels involved in illicit fishing or dumping were attacked by these vigilante groups, with the end of either extracting taxes or deterring future incursions. One way of securing reparations was to hold the vessel and its illicit cargo until compensation was paid, and over time seizing vessels became an end in itself. Today, in a situation similar to what has happened in the Niger Delta, the political aims of the pirates have all but been forgotten. While the rhetoric remains, the true end of these attacks is the enrichment of the pirates. Drifting further and further from the Somali coasts, the pirates are attacking commercial freighters, pleasure craft and other vessels that have nothing to do with Somalia. Rather than championing the cause of the Somali people, pirates today attack vessels bearing the food aid on which so many Somalis depend. Somalia s pirates have had to drift further and further from the coast in search of prey. In 2004, the International Maritime Board warned all vessels to avoid sailing within 50 nautical miles of the Somali coast. In 2005, it increased this distance to 100 nautical miles. 7 By 2006, some pirate attacks extended as far as 350 nautical miles off the coast of Somalia, with pirate attacks occurring in the Indian Ocean, in the Gulf of Aden and at the mouth of the Red Sea. 8 Between 2007 and 2008, the main area of pirate activity shifted from southern Somalia and Mogadishu port to the Gulf of Aden. Since the beginning of 2009, there has been an increase in the number of attacks reported off the east coast of Somalia in the western Indian Ocean, with some attacks taking place over 1,000 nautical miles off that coast. The greatest victim of this piracy is undoubtedly the Somalis themselves. On top of the ongoing conflict, Somalia is also suffering from four years of catastrophic drought, and an estimated 3.2 million Somalis, approximately 43% of the population, were dependent on food aid in the latter part of Some 95% of international aid supplies to Somalia is shipped by sea. The World Food Programme (WFP) ships approximately 30,000 to 40,000 metric tons of food aid per month to the Horn of Africa region. As a result of the attacks on aid-bearing ships, WFP has reported that it has become more expensive and dangerous to ship food assistance to Mogadishu. 9 Since late 2008, on top of having to pay higher insurance premiums, WFP shipments also require an escort from European Union or Canadian navies. While some Somali pirates have consented not to target vessels carrying humanitarian aid and other supporting commercial vessels, 10 attacks on humanitarian aid shipments have yet to stop. For example, in April 2009, Somali pirates hijacked the MV Maersk Alabama and attacked the MV Liberty Sun, both US-flagged and -crewed cargo vessels contracted by the WFP to deliver food assistance off the south-east coast of Somalia. 11 In November 2009, the MV Maersk Alabama was attacked again, although the crew managed to repel the attack TRANSNATIONAL ORGANIZED CRIME THREAT ASSESSMENT
217 9 FIG. 176: PIRACY INCIDENTS ATTRIBUTED TO SOMALI PIRATES, Oman 500 km Oman 500 km Eritrea Yemen Eritrea Yemen Djibouti Djibouti Ethiopia S o m a l i l a n d l a n d P u n t Ethiopia S o m a l i l a n d l a n d P u n t Somalia Somalia Kenya Kenya United Republic of Tanzania Comoros Seychelles United Republic of Tanzania Comoros Seychelles Oman 500 km Oman 500 km Eritrea Yemen Eritrea Yemen Djibouti Djibouti Ethiopia S o m a l i l a n d l a n d P u n t Ethiopia S o m a l i l a n d l a n d P u n t Somalia Somalia Kenya United Republic of Tanzania Comoros Seychelles Kenya United Republic of Tanzania Comoros Seychelles UNODC / SCIENCES PO Sources: Source: ICC: International Maritime Bureau, Piracy and armed robbery against ships, Annual Report 2009 Each dot represents an actual or attempted piracy attack Number of pirate attacks in the area, The increased shipping costs have also had a major impact on the economy, since shipping is traditionally a major source of income for the country. The region s fishing industry has also been affected. Tuna catches in the Indian Ocean are reported to have fallen by 30% in 2008, in part because of fishing vessels fear of piracy. 13 This has had a major impact on countries like the Seychelles, who rely on the fishing industry for up to 40% of their income. 14 On the other hand, the inflow of ransom money has had a beneficial economic effect on some localities. For example, Garoowe, the capital of Puntland, appears to be experiencing a construction boom, and even the price of marriage dowries is Case studies of transnational threats 211
218 MARITIME PIRACY said to have increased. 15 This dirty money is likely to have a negative impact on governance in that region, however, as the purchasing power and influence of the pirates exceeds that of the government. Piracy is said to be penetrating all levels of the society in Puntland, with a number of ministers being suspected of involvement in piracy. 16 It is also reported to be undermining the traditional leadership influence of many clan elders in Somalia, who are actively encouraging local youth not to get involved in piracy. 17 There have been fears that ransom funds could affect the outcome of upcoming elections in Puntland. Beyond Somalia, the effects are also wide ranging. There are the direct victims: in the first half of 2009 alone, 485 seafarers were taken hostage off the coast of Somalia, with six injured, four killed and one missing. 18 Ship-owners are victim to piracy not only because of the ransom that they have to pay but also because of the increase in the cost of shipping. The increased incidence of piracy has raised insurance premiums for vessels plying these waters from some US$20,000 in 2008 to US$150,000 at the end of The Gulf of Aden is one of the most important trading routes in the world. Thousands of ships pass through the Gulf en route to or from the Suez Canal every year. The US Department of Energy estimated that, as of 2006, as many as 3.3 million barrels of oil per day were transiting the Bab el Mandab strait between the Gulf of Aden and the Red Sea. 20 To compound the problem, there are few alternatives to the Gulf of Aden. The longer route to Europe and North America around the Cape of Good Hope significantly increases the cost of shipping. Canal authorities have reported declines in shipping traffic and resulting revenue loss recently, due both to decreased economic activity and the piracy threat in the Gulf of Aden. 21 If international shipping continues to avoid the Gulf area s oil and gas exporting facilities, the world may see an increase in commodity and energy prices from Asia and the Middle East. Furthermore, it is feared that if the price of shipping, including insurance premiums, continues to rise, regional trade for countries like Egypt, Sudan, Saudi Arabia, Eritrea, Ethiopia, Dijbouti and Yemen will decline as well. How is the crime conducted? Somali piracy is unique in many regards, as Somalia does not have a natural coastal terrain of the sort that is usually favourable to pirates. Pirates in other parts of the world typically operate in areas with numerous forested inlets and islands, where ships could be hidden from aerial and maritime surveillance while they are being renamed and repainted. Instead, Somali pirates have developed on-land sanctuaries from which they can launch pirate attacks and conduct ransom negotiations. 22 This, no doubt, has affected their choice to focus on hostages rather than cargo. 23 What may have been considered a deficiency has resulted in a very positive outcome for the pirates: the amounts they command for ransoms far exceed what they could have gained through robbery. Traditionally, Somali pirates have operated from small, fast skiffs, waiting up to 50 nautical miles off the coast for a suitable vessel to attack. But as patrols have pushed them further out, they are increasingly using bigger fishing trawlers as mother ships. These larger vessels are usually able to carry several skiffs, as well as weapons (typically AK-47s and increasingly, rocket-propelled grenades). The visual horizon at sea is normally about three miles. The ability of pirates to locate target vessels in vast expanses of sea has led some to conclude that pirates are being provided with GPS coordinates by informants with access to ship tracking data. 24 Crews of some hijacked vessels have said that the pirates appear to know everything about the ship on boarding, from the layout of the vessel to its ports of call. Calls made by pirates from their satellite phones from captured ships indicate an international network. From the time of first sighting, it generally takes the pirates some 15 to 30 minutes to board the ship. 25 Once the vessel is targeted, the skiffs attack from a number of directions simultaneously, which usually allows one of the skiffs to approach the vessel unnoticed. Relatively slow ships with low sides, a small crew and insufficient surveillance are more vulnerable to pirate attacks. Pirates do not limit their attacks to one kind of ship, although bulk carriers, container ships and general cargo ships comprise the majority of piracy targets. 26 Most ships that are successfully captured by Somali pirates in the Gulf of Aden are brought to Eyl, Hobyo or Haradheere. 27 There are also reports that Bargaal and Garaad are used as anchorage sites. 28 As mentioned above, since the pirates are not concerned about concealing the vessel from public sight, negotiations are usually done with the ship visibly anchored off the Somali coast. 29 In the first part of 2009, the average time that crews were held hostage was approximately two months, with the shortest time being six days and the longest six months. 30 Negotiations for ransom are usu- 212 TRANSNATIONAL ORGANIZED CRIME THREAT ASSESSMENT
219 9 ally done directly between the pirates on the seized vessel and the ship-owners or head companies, although sometimes third-party intermediaries in Somalia and abroad are also used. The negotiations are generally conducted via satellite telephones and the captured ship s communication equipment. In most instances, ransoms are paid in cash and are delivered to the pirates aboard the seized ship. The method of payment may be direct transportation of the money to the pirates by a representative of the ship-owner or even the parachuting of the ransom money. In a few cases, ransoms have been paid to a trusted third party representative outside Somalia. Upon receipt of the money, the pirates release the hostages and usually leave separately to avoid tracking and capture. 31 Who are the offenders? Somali pirates are generally young men raised in a desperate and disorganized society, willing to risk their lives for the slightest chance of something better. The groups themselves are small perhaps six to 10 individuals so despite the existence of a number of well-known groups, this would appear to be an endeavour with few barriers to entry. So long as start-up financing is available, there is likely a long list of volunteers willing to sign up. Most use small arms such as AK-47s and shoulder-fired rocket-propelled grenades, of which there is an abundant supply in their war-torn country. While clearly no match for a naval vessel, teenagers with automatic weapons in skiffs can easily overcome most commercial ships, since the crews are generally unarmed. Some 1,400 Somalis are estimated to be involved in piracy. 32 Two main piracy networks in Somalia have been recognized: one in the semi-autonomous northern Puntland in the Eyl district and another group based in Haradheere in Central Somalia. 33 Smaller pirate groups have been recognized operating from the ports of Bosaso, Qandala, Caluula, Bargaal, Hobyo, Mogadishu and Garad. 34 Specific groups mentioned in reports from the region include: the Somali Marines based in Central Somalia, this group appears to have pioneered the use of mother ships; the Kismayu group (also own as National Volunteer Coastguard) from Kismayu in southern Somalia, focused on small boats, close to the shore; the Marka Group operating south of Mogadishu to Kismayo, this small group uses fishing boats with long-range fire power; and, the Puntland group operating from a small village near Bossaso, using modified fishing vessels and seized vessels for continued attacks. 35 It also appears that a number of groups are organized along clan lines, with the sub-clans of Darood and Hawiye being particularly prominent. But most piracy groups appear to be equal-opportunity employers, seeking recruits in the refugee camps housing some 40,000 internally displaced Somalis. They may recruit skilled fishermen since some would-be pirates have little or no knowledge of the sea. With the resources they command, pirates can draw whole communities into their net. 36 For example, the ancient town of Eyl is said to have been transformed into a logistic support structure for piracy. How big is the offence? The amount of ransom demanded by the pirate groups over the past few years has risen from tens of thousands of dollars to hundreds of thousands and even millions. In 2008, the average ransom was estimated at between US$500,000 to US$2 million, and in 2009 it appears to have risen further still. According to the Report of the Secretary-General to the Security Council on the state of piracy in Somalia (2009), the Eyl Group alone was holding hostage six vessels and their crew and was expected to have earned approximately $30 million in ransom payments by the end of While some shipowners have been understandably reluctant to disclose ransom payments, recent ransom payments of more than US$5 million have been reported. 38 Only a portion of this money goes to the pirates. Government officials and the armed groups that control different parts of the country - especially in Puntland - may also be taking a share, though the precise amount is unknown. According to one breakdown, the pirates involved in the actual hijacking receive only 30% of the ransom, out of which they must cover their expenses. The armed groups who control the territory where the pirates are based may claim perhaps 10% as a tax, and elders and local officials command a similar share. The financier of the operation may take 20% as interest on the funds advanced, with a full sponsor claiming perhaps 30%. 39 According to a convicted pirate, a single armed pirate can earn anywhere from US$6,000 to US$10,000 for a $US1 million ransom. 40 This is approximately equivalent to two to three years worth of salary for an armed guard at a humanitarian agency and much higher than what a local business would pay. Case studies of transnational threats 213
220 MARITIME PIRACY IMPLICATIONS FOR RESPONSE Somali piracy is another example of a problem caused more by prevailing conditions than by the impetus of any particular group. If armed robbery in any other part of the world routinely yielded takings in the millions of dollars, or even the equivalent of several years salary, this activity would be extremely difficult to deter through law enforcement, however harsh. But these rich pickings are available in an environment where there are few alternative sources of income, where war and famine have hardened some to the sufferings of others, and where the chances of being brought to justice are slim. In this context, becoming a pirate may appear to be a rational vocational choice. Halting this activity will require a change in circumstances. There have been longstanding international efforts to combat hunger, promote development and bring peace to Somalia, and these remain the core of the issue. There may be scope for reducing piracy, however, without waiting until this embattled nation is returned to normalcy. One approach is target hardening. The shipping lines themselves have experimented with a wide variety of security devices, most of which are nonlethal, including water cannons and high-intensity light and sound projectors. The efficacy of these devices remains unclear, but if they could truly repel a military attack, they would likely have wider application in conventional warfare. This sort of technical solution could promote an arms race, with cargo vessels taking on increasingly heavy hardware to avoid being singled-out, and well-funded pirates employing ever more aggressive tactics in response. However well-funded, it is unlikely the pirates will ever be able to take on a naval warship. Under Resolution 1816, 43 the Security Council has created conditions for third-party governments to conduct anti-piracy operations in Somali territorial waters, as well as engaging in on-shore operations with authorization from the Somali Transitional Federal Government (TFG). Currently, naval battleships from a wide range of countries patrol the Gulf of Aden. This presence seems to have had some impact: there were more attempted hijackings in the Gulf in 2009 than in 2008, but fewer successful ones. But the greatest potential lies in promoting action against the pirates by Somalis in Somalia. Somali Prime Minister Omar Abdirashid Ali Sharmarke has argued that, [Y]ou cannot tackle piracy from the sea no matter how many naval ships you put FIG. 177: ATTEMPTED VERSUS SUCCESSFUL HIJACKINGS IN THE GULF OF ADEN, Hijackings Attempts into the waters the best way to actually fight the piracy is to tackle these things from the land. 44 It is certainly true that the open way the pirates currently operate is only possible with substantial mainland support. The pirates are often at sea for months negotiating a ransom, and need supplies and services during this time. Once paid, the militants must debark and return to shore, often laden with considerable volumes of cash. They would not get far if they could not rely on the protection of local potentates. If the groups that are currently taxing the piracy trade including community officials, elders and clan leaders, and militants were to decide it were in their best interest to stop piracy, it would very likely stop. The governments of Puntland and the TFG have pledged their support, but need assistance in translating this political will into local action. Aside from the broader project of improving national governance and the rule of law in the country, specific measures aimed at enhancing law enforcement effectiveness could have a beneficial effect. Another point of vulnerability lies in the pirates information stream. While some attacks appear to be opportunistic, some seem to be aimed at particular maritime vessels. Locating a particular ship at sea without inside information would be extremely difficult. Better securing this information for vessels traversing the danger zone could pay dividends in reduced pirate attacks. Similarly, bundles of currency are of little use if they cannot be converted into the goods and services the pirates desire. Measures to prevent the outflow of this money or the inflow of products (particularly arms, maritime craft and parts, and vehicles) could also reduce incentives for piracy Source: IMB-ICC annual reports, 2008 and TRANSNATIONAL ORGANIZED CRIME THREAT ASSESSMENT
221 10 CYBERCRIME
222

223 10 CYBERCRIME In less than two decades, the Internet has grown from a curiosity to an essential element of modern life for millions. 1 As with other aspects of globalization, its rapid expansion has far exceeded regulatory capacity, and this absence of authority has left space for many abuses. The problem is compounded by the fact that the Internet was fashioned on a military system designed to circumvent interference and external controls. 2 But even those who most loudly champion its creative anarchy have come to realize that the Internet can only reach its full potential if some basic ground rules are established and if antisocial behaviour is vigorously discouraged. The challenge remains how, exactly, to do this. Cybercrime has been used to describe a wide range of offences, including offences against computer data and systems (such as hacking ), computer-related forgery and fraud (such as phishing ), content offences (such as disseminating child pornography), and copyright offences (such as the dissemination of pirated content). 3 It has evolved from the mischievous one-upmanship of cyber-vandals to a range of profit-making criminal enterprises in a remarkably short time. Of course, criminals, like everyone else with access, make use of the Internet for communication and information gathering, and this has facilitated a number of traditional organized crime activities. But the growing importance of the Internet and our collective dependence on it has also created a number of new criminal opportunities. This chapter considers two of the most problematic: the well-established fraud of identity theft and the previously unprofitable trade in child pornography. The former is an acquisitive crime, an updated version of check kiting. The latter is a kind of electronic trafficking, transmitting contraband across borders through the Internet. A key question at the outset is whether these two activities could or should be classed as organized crime. Both are offences that tend to favour lone or small groups of perpetrators. Among the great advantages cyberspace offers to criminals are anonymity and the ability to allow otherwise unassociated individuals in different parts of the world to FIG. 178: SHARE OF INTERNET USERS AND NUMBER OF SECURE INTERNET SERVERS, 2008 Internet users (% of population) 358,936 Internet users in the world, (in millions) World average Lack of data Source: ITU and World Bank 60,000 10,000 1,000 between 100 and 1,000 Number of Secure Internet servers Only data higher than 100 are represented UNODC / SCIENCES PO Case studies of transnational threats 217
224 CYBERCRIME network on a transactional basis (through the use, for example, of bulletin boards, typical in both offences). The inherent limitations in organizing identity theft and child pornography for the profit of standing criminal groups are discussed further below. Other forms of cybercrime, particularly intellectual property violations, may be more attractive to standing groups, and evidence has been increasing that organized cybercrime groups of some longevity are operating in areas like software piracy and other forms of copyright infringement. 4 And there are a number of reasons why cybercrime in general and organized cybercrime in particular might increase in the near future. First, the technology of cybercrime has become more accessible. Software tools can be purchased online that allow the user to locate open ports or overcome password protection. 5 These tools allow a much wider range of people to become offenders, not just those with a special gift for computing. For example, the proprietors of the recently discovered Mariposa botnet (a network of enslaved computers), perhaps the largest in history, were said not to have advanced hacking skills. 6 Due to mirroring techniques and peer-to-peer exchange, it is difficult to limit the widespread availability of such devices. 7 While skilled cyberthieves would likely see no advantage in working for a standing organization, these tools could allow criminal groups to employ large numbers of relatively unskilled individuals to labour on their behalf. detected involving 12.7 million infected computers, include those of many of the world s biggest corporations. 14 The capacity to launch millions of attacks is relevant for two reasons: It makes viable criminal strategies that would otherwise be unprofitable due to the high failure rate. For example, despite widespread knowledge of the nature of advance fee fraud and phishing schemes, these remain profitable because the perpetrators need only succeed in locating one or two marks in millions of attempts. It allows cyberthieves to fly under the radar by taking only a small amount of money from a large number of victims, decreasing the chances of detection. 15 Some analysts have posited losses to cybercrime to have been as much as 1 trillion US dollars in 2008, 16 although these sorts of figures are hotly contested. Given the breadth of the activity and the number of possible victims (over 1.5 billion internet users recorded in 233 countries), 17 it is difficult to come up with comprehensive estimates. Second, the profile of Internet users is changing. In 2005, the number of Internet users in developing countries surpassed the number in industrial countries. 8 If these new users were no more likely than those in developed countries to be predators, the number of predators should continue to expand apace. But the number of high-value victims, largely located in richer areas, will remain more or less the same. As a result, the intensity of the attacks on this unchanging victim pool will likely grow. The Internet has made high value victims as accessible as local ones for perpetrators in the developing world. 9 Finally, each new offender can increase the number of attacks exponentially through the growing use of automation. Many millions of unsolicited bulk spam messages can be sent out by automation within a short time frame. 10 Hacking attacks are often also now automated 11 with as many as 80 million hacking attacks every day 12 due to the use of software tools that can attack thousands of computer systems in hours. 13 Recently, a botnet was 218 TRANSNATIONAL ORGANIZED CRIME THREAT ASSESSMENT

225
226 CYBERCRIME What is the nature of this offence? The imposters who pepper history were unusual individuals with the confidence and skills to convince others that they were someone that they were not. In the days when most people died in the community in which they were born, however, the idea of widespread identity theft would have been absurd. In recent years, human mobility has reached such levels that governments and businesses have become reliant on technical devices to establish identity, such as documents, identification numbers, and, increasingly, biometric indicators. The Internet has placed even greater emphasis on associating people with bits of data, including codes, passwords and personal identification numbers. This information can be obtained by cybercriminals in a variety of ways, and used to steal money or incur uncollectable debt through the Internet or more conventional channels. Today, identity-related offences are the most common form of consumer fraud. 18 The technique is modern, but it is not new. With the widespread use of checks and credit cards came the misuse of these same instruments, by criminals posing as the authorized user. These documents can be obtained through theft or robbery, and this remains one of the most common forms of what could broadly be described as identity theft. More elaborate forms of impersonation were commonly based on personal data acquired by stealing mail or rummaging through refuse. 19 This information could be used to acquire identity documents, allowing the offender to open checking accounts or obtain credit cards, which would be used to acquire cash or goods. Credit card numbers could be obtained through discarded carbons and used to place telephonic orders for goods, often delivered to mail drops. These paper-based forms of fraud are still far more common than their electronic counterparts, but they are relatively slow and the potential for large profits is limited. Electronic forms of identity theft present many advantages, discussed below. The misuse of credit card information is often identified as the most common form of identity-related crime. 20 Rather than rummaging for carbons, large databanks of credit card information with personal identification numbers can be downloaded by those able to hack their way into protected sites. This information can be sold on to those in a position to exploit it, and for many cybercriminals, this is the end of the process. Their goal is to collect huge volumes of protected information and sell it, typically via dedicated bulletin boards, to criminal FIG. 179: Cash out services 3% Mailers 3% Full identities 4% Proxies 4% groups who specialize in cashing out. 21 These bulletin boards offer a wide range of information and services for sale, typically in bulk packages. 22 Electronic banking has offered opportunities for acquiring the cash more directly. The most recent techniques used to acquire identity information by Internet-related methods can be broken into three large headings: phishing, or deceiving Internet users into divulging their personal information; malware, or the use of unintentionally-installed software which collects and transmits personal information; and hacking, or illegally accessing computer systems remotely. Phishing BREAKDOWN OF GOODS AND SERVICES AVAILABLE FOR SALE ON SAMPLED UNDERGROUND ECONOMY SERVERS IN 2008 BY TYPE Others 25% addresses 5% accounts 5% Credit card information 32% Bank account credentials 19% Source: Symantec Global Internet Security Threat Report 2008 Some countries use the term identity fraud to describe this phenomenon, which could be classed with offences formerly described as larceny by trick. 23 The technique involves fooling victims into disclosing passwords and related information by posing as the relevant financial institution or other organization with a legitimate interest in this information. There are at least two headings under which phishing attacks can be further divided: 24 based and pharming. -based phishing typically occurs in three phases. In the first phase, offenders identify legitimate companies that are offering online services and communicating electronically with customers. 25 The Anti-Phishing Working Group identified 259 information campaigns that had been hijacked by phishers in June The most targeted sectors were payment services (49%) and the financial sector (32%) TRANSNATIONAL ORGANIZED CRIME THREAT ASSESSMENT
227 10 FIG. 180: In the second phase, offenders design websites that look like the legitimate websites of the identified company, known as spoofing sites. In order to direct users to the spoofing sites, offenders often send out s resembling those from the legitimate company. 28 These sites request the user to provide details such as passwords and other information that can be used for identity theft. The estimated response rate to phishing is between 3% and 11% of those to whom the request is sent. 29 Of these, some sites are so convincing that up to 5% of those accessing the site have provided the requested information. 30 In the third phase, the offenders use the information disclosed by the victim to log on to the victim s accounts and commit offences, such as transferring money or applying for new accounts. The transfer of money from the victim s account often involves financial agents to launder the funds so acquired. 31 In June 2009 Anti-Phishing Working Group detected more that 49,000 unique phishing sites. 32 The second technique used to direct the user to the spoofed website is manipulation of the Domain Name Server (DNS) in a process known as pharming. 33 This usually involves installing malware on the individual user s computer or a DNS, which routes traffic on the Internet. When a computer or DNS is infected, users attempting to access their electronic bank accounts or other online information are redirected to a spoof site. When they enter their personal information to log on, the identity thieves record this information. Malware Retail 1% Auction 9% Financial 32% INSTITUTIONS FEIGNED IN PHISHING ATTACKS Other 9% Payment Service 49% Source: Anti-Phishing Working Group, Phishing Activity Trends Report 2/2009 Instead of scams, identity thieves can use malicious software to obtain the desired information directly from the user s computer. 34 Toolkits that enable offenders to design such malware are available for US$200 to US$ Once installed, there are a number of ways these software devices can operate. 36 They can directly scan hard drives to collect information formatted in ways typical of passwords, credit card numbers and social security numbers. 37 Since many people use the same passwords for multiple accounts, detecting one or two can be enough to unlock all the users accounts. They can also be designed to intercept communications or log keyboard strokes - literally recording every entry made by a user - and this information can be sifted electronically for passwords and related information. Hacking The term hacking is used to describe the unlawful access of a computer system. 38 It is one of the oldest computer-related crimes, 39 and in recent years has become a mass phenomenon. 40 By targeting computer systems that host large databases, offenders can obtain identity-related data on a large scale, 41 and this is an increasingly popular approach. 42 In the largest case detected in the past in the USA, the thieves obtained more than 40,000,000 credit card records. 43 Apart from direct financial profit, offenders can use identity-related information for other purposes, including using a victim s bank account to launder money. 44 In addition, they can circumvent identification and terrorist prevention measures by using obtained identities. The Report of the Secretary- General of the United Nations on Recommendations for a global counter-terrorism strategy highlights the importance of developing tools to tackle identity theft in the fight against terrorism. 45 Who are the offenders? Identity theft is not necessarily a crime that needs to be committed with the help of others. 46 Single offenders with access to the technology can acquire and use this information on their own, or sell it on to others who can better exploit the data. Both the seller and the buyer of identity-related information are involved in the offence, but they do not form a group any more than do the buyers or sellers of any other commodity. Where groups exist, they tend to be both smaller 47 and more loosely structured 48 than those involved in other forms of organized crime. One of the great advantages of the Internet for criminals is that it allows the formation of exactly these ad-hoc associations between otherwise unrelated individuals. 49 Case studies of transnational threats 221
228 CYBERCRIME Since offenders may act as individuals and the crime may be committed from anywhere in the world, it is very difficult to profile identity thieves. It is estimated that many of the currently active groups are operating from Eastern Europe, 50 but this is difficult to demonstrate statistically. West Africa is also implicated: a recent survey of businesses operating online found that one quarter had stopped accepting orders from certain countries due to repeated fraud. Of these, 62% indicated Nigeria was one such country, followed by Ghana (27%) and Malaysia (21%). 51 National indicators, such as the coding language of malware, show too much volatility to be true indicators of the origin or residence of the criminals. The same is true for the location of servers used in the crime. For example, in May 2009, the country hosting the largest share of detected phishing websites was the USA, with 54% of the sites detected. 52 One reason for the dominance of the USA may be the high number of servers located in that country. But just two months later, the profile changed, with Sweden hosting the largest share: 46%, up from 7% in May. 53 FIG. 181: Germany 3% UK 3% Canada 4% China 6% Canada 4% China 2% Sweden 46% COUNTRIES HOSTING PHISHING SITES, MAY AND JULY 2009 Other 23% Sweden 7% May July Germany UK 1% 1% Other 5% Source: Anti-Phishing Working Group USA 54% USA 42% In terms of victims, the USA has been reported as the leading source of credit card numbers advertised on underground economy servers. 54 Figures from the USA show that most computer crime against US citizens is committed by other US citizens. Two thirds of the perpetrators of Internet crimes reported to the US national Internet Crime Complaint Center in 2008 were based in the United States, with 11% coming from the United Kingdom, 9% from Nigeria, 3% from Canada and 2% from China. South Africa, Ghana, Spain, Italy and Romania each comprised less than 1% of the perpetrators. 55 How big is the problem? As a new and ill-defined crime area, data on the scale of cyber identity theft are very rudimentary, with most figures emerging from national assessments. The United States appears to be the source of most of the identity information dealt on-line, comprising a large share of the value of the global market, so it is particularly relevant as a national example. Albert Gonzalez is said to be the single most prolific identity thief in United States history. Gonzalez was indicted in multiple cases, including the Shadowcrew case (1.5 million data items stolen), 56 the TJX Companies case (46 million) 57 and the Heartland Payment Systems case (130 million the single largest US case ever). 58 In addition to being used to withdraw cash from ATMs, the stolen information was sold to conspirators in Eastern Europe. His net profit from these exploits remains unclear, but his guilty plea included forfeiture of US$1.6 million, one condominium, a luxury car and some personal items. It remains possible that Gonzalez has additional wealth secreted in overseas accounts, but considering the extent of his activity, these assets seem rather modest. A large Nigerian identity theft ring detected in New York resulted in the indictment of 48 people. This network was alleged to have made US$12 million in 2008, or about US$250,000 apiece. 59 Based on a government survey in the USA in 2006, it was estimated that within a 12-month period, some 10 million people lost on the order of US$15.6 billion to identity theft. This represented a significant downward revision from a previous estimate based on a similar methodology. Victims were asked how the information was obtained. Over half of the victims did not know, and of those who did, the majority indicated sources that precluded cybercrime. Only 2% said the information was obtained 222 TRANSNATIONAL ORGANIZED CRIME THREAT ASSESSMENT
229 10 by phishing or hacking into a computer. 60 If the chances of the victim knowing the source of the leak were the same for both cyber victims and other victims, then perhaps 5% of the US$15.6 billion loss could be attributed to cybercriminals, or US$780 million. An update of this survey conducted by a private research organization in 2007 found a declining trend in the incidence of identity theft in the USA. 61 Outside the USA, other Anglophone countries have found much smaller total losses. In Australia, identity theft loss estimates vary from less than US$1 billion to more than US$3 billion per year. 62 In the United Kingdom, the cost of identity fraud was recently said to be 1.2 billion pounds (just under US$2 billion). 63 Total losses in Canada were pegged at about US$2.5 billion in It is unclear what share of these losses was computer-related. Beyond these countries, there are very few data. One annual study by a security company with global reach concluded that the USA was the source of some two thirds of the credit card information sold on known underground economy servers in If the USA represents two thirds of the market and US losses are on the order of US$780 million, global losses would be on the order of US$1 billion. 66 FIG. 182: Source unknown 56% HOW IDENTITY WAS OBTAINED IN CASES OF IDENTITY THEFT IN THE USA Hacking into computer 1% Phishing 1% From the mail 2% Source: Federal Trade Commission Company that had information 5% Purchase or other transaction 7% Knew thief personally 16% From wallet 5% Other 7% Case studies of transnational threats 223
230
231
232 CYBERCRIME What is the nature of this market? The virtues of the Internet include its ability to transmit great volumes of information at little cost anywhere in the world, and its ability to bring together people of common interests who would otherwise never meet. Unfortunately, the Internet is equally efficacious when the subject is vice, and pornography has traditionally been a mainstay of Internet content. 67 Of this, an indeterminate amount is child pornography. It appears that almost all child pornography transmitted today is in electronic form, typically traded though bilateral or multilateral exchanges. Behind every image of child pornography lies a victim of sexual abuse and, arguably, of human trafficking. Until recently, the production and acquisition of child pornography were highly risky activities. 68 Only a limited number of paedophiles had access to the facilities to produce hard copy materials, most materials were produced by amateurs, 69 and their dissemination was limited to social networks that were both difficult to establish and fragile. 70 Offenders, when arrested, were generally in possession of a handful of images. 71 These considerations suggested that a good deal of the demand for these materials would necessarily go unmet, and that the market would remain fundamentally unprofitable. One of the risks associated with the growth of the Internet is that the greater accessibility of child pornography could lead to greater demand, and thus greater profitability in the production and sale of these materials. If child pornography were to approach the profitability of adult pornography, this could attract the attention of organized crime groups, transforming what had been a furtive paper exchange into a professional operation and leading to greater levels of victimization. The greater accessibility of these materials may have a number of less direct impacts as well. Repressed paedophiles may find validation in these depictions of their fantasies and a sense of community in the groups that exchange child pornography. To gain acceptance in these groups and to achieve recognition among their peers, they may feel compelled to produce their own footage. These materials can even be used to groom victims, to convince them that such conduct is normal and accepted. The possibility that children are being victimized for the sole purpose of making marketable child pornography is subject to empirical verification, but, to date, has not yet been tested. Despite the seizures of many hard drives and even servers containing hundreds of thousands of images, very little work has been done examining the content of these images to determine what can be said about the nature of production how much is professionally produced, and how much is clearly amateur. In fact, little research has been done on the global scale or growth of the child pornography industry. Such an exercise would seemingly be straightforward to do, since image comparison can be automated, using, for example, the PhotoDNA software from Microsoft. Using a capture/recapture estimation technique, the universe of child pornography could be quickly surmised. Looking at different drives seized at different points in time, the growth rate of the market could be estimated. This could be complimented by a content analysis, looking at issues like the language spoken in video clips, indicators of the age of the images, or other indicators of when, where, and how the current stock of child pornographic images has been produced. Given the importance of the issue, it is remarkable that such research has not yet been done. Some of the best content-oriented studies are discussed below. Based on limited case studies, it does appear that those caught in possession of these materials today possess far more images than in the past. 72 But it remains unclear whether there are significantly more images in circulation, or whether each offender simply has access to a more complete collection than before. One study of dated digital images found a strong clustering in recent years, but images taken before the advent of the digital camera were necessarily excluded. 73 How is the crime committed? A key initial question to ask in understanding the child pornography industry would be: is the distribution of child pornography similar to YouTube, where most of the content is produced by amateurs competing for prestige within their peer group, or does it resemble the adult commercial pornography industry, which is run like a business? It appears that child pornography is available in both commercial and non-commercial domains, but the ratio between the two remains unclear. 74 It does appear that peer-to-peer exchanges, generally not commercial, have become the most popular means of exchanging these materials, however. 75 There have been studies of site content based on public reports to national complaint lines, but these studies generally do not capture peer-to-peer exchanges, and consequently the materials they review may not be representative of all those cur- 226 TRANSNATIONAL ORGANIZED CRIME THREAT ASSESSMENT
233 10 rently being exchanged. The Internet Watch Foundation is an organization in the United Kingdom that receives site-content complaints, the vast majority of which are related to child sexual content. In 2005 and 2006, the division between commercial and non-commercial domains was close to even, but more recent years show both a sharp shift to commercial sites and a diminishing number of overall detections. 76 This may not be a true trend, however, since diminishing detections may be related to trend toward the greater use of peer-topeer exchange rather than public websites, a trend that may be particularly pronounced among noncommercial actors. A similar organisation in Canada Cybertip.ca recently found that a much smaller share of the sites reviewed were commercial: only 13%. It found that the share of commercial sites varied greatly by the host location of the websites. In the Russian Federation, for example, only 2% of the known websites were commercial, while in the UK, 21% were. This ratio may be related to the likelihood of being prosecuted in the host jurisdiction. In the Cybertip.ca study, the commercial websites reviewed were actually more likely to feature modelling-type images and less likely to show sexual assault than non-commercial ones. This may be partially due to the fact that some of the commercial sites were themed to emphasize the innocence of the children. Whether commercially motivated or amateur, offenders do not seem to have difficulties in sourcing victims, because their targets are generally too young to defend themselves. Contrary to what might be expected, the victims of child pornography are not primarily teenagers just shy of adulthood. In the Cybertip.ca study, the majority appeared to be under the age of 8, with many of the most severe images featuring babies and toddlers. Commercial sites were more likely to show these very young children than non-commercial sites. The Internet Watch Foundation also provides a profile of the victims, noting that 69% of the victims appear to be under the age of 10, with 24% being less than In one sampling, 39% of those persons caught with images of child sexual abuse had images of children younger than 6 years old. 78 In the Cybertip.ca sample, girls comprised 90% of the victims on commercial websites, compared to 83% on all websites. While some studies have found greater gender balance, this is in keeping with the gender ratio found in other large studies. FIG. 183: 3,500 3,000 2,500 2,000 1,500 1,000 percent FIG. 184: FIG. 185: 100% 90% 80% 70% 60% 50% 40% 30% 20% 10% 0% 1,331 Russia CHILD PORNOGRAPHY DOMAINS REPORTED TO THE INTERNET WATCH FOUNDATION (UK) Source: IWF Annual Report 2007 and 2008 SHARE OF ALL CHILD PORNOGRAPHY WEB SITES REVIEWED BY CYBERTIP.CA THAT WERE COMMERCIAL, Canada France 13 USA Source: Canadian Centre for Child Protection Commercial 1,390 1,603 1, , Germany All websites Source: Canadian Centre for Child Protection 399 1, Spain 21 UK NATURE OF THE ABUSE ON COMMER- CIAL WEBSITES COMPARED TO ALL CHILD PORNOGRAPHY WEBSITES Noncommercial Commercial Extreme sexual assaults Sexual assaults Extreme sexual posing Sexual posing Case studies of transnational threats 227
234 CYBERCRIME FIG. 186: Older children 8 to 11 Under 8 APPARENT AGES OF THE VICTIMS ON COMMERCIAL WEBSITES COMPARED TO ALL CHILD PORNOGRAPHY WEBSITES 100% 90% 80% 70% 60% 50% 40% 30% 20% 10% 0% Commercial All websites Source: Canadian Centre for Child Protection Child pornography vendors often set up fictitious businesses in order to obtain a merchant account for credit card processing. 80 To evade detection by law enforcement, payment schemes used by commercial child pornography websites are increasingly complex. 81 The rapid growth of anonymous financial services has been reported. 82 The demand for anonymous payments led to the development of virtual payment systems and virtual currencies enabling anonymous payment. 83 Virtual currencies may not require identification and validation, thus preventing law enforcement agencies from tracing money-flows back to offenders. Recently, a number of child pornography investigations have succeeded in using traces left by payments to identify offenders. 84 The use of anonymous payment systems such as E-Gold can hinder such investigations. 85 Cybertip.ca also found that most commercial websites sell memberships, and although online payment systems appear to be preferred, the majority also offered credit card payment options. Sites tend to be themed, and frequently open with a homepage featuring a collage of images and text. There are generally links to a thumbnail gallery containing some 20 to 60 images with further links to a large collection of members-only material. Many of these sites move frequently to new hosts in different countries, illustrating that the location of the host computer may have little to do with the origin of the material. Aside from surveys of this sort, there are other reasons to believe that much of the production of child pornography is not primarily commercially motivated. As described below, the making of child pornography is generally opportunistic; the victimizer is very often a person entrusted with the care of the child. It appears that, in most cases, the images are generated as a result of the abuse, rather than the abuse being perpetrated for the purpose of selling images. More research is required to come to a firm conclusion on this issue, however. Those with an interest in child pornography locate and access the sites in several ways. Much material can be gained through networking on usenet groups or through bulletin board services. To gain access to non-commercial websites with large volumes of material, candidates may be required to submit images, both to bolster supply and to demonstrate bona fides. For example, those wishing to join the Wonderland club of the late 1990s were required to submit 10,000 images to the database, which gained them access to some 750,000 additional images. 79 Who are the offenders? Prior to the Internet s coming of age, child pornography was not a business of interest to traditional organized crime groups, 86 and there is little evidence of their participation today. Based on domain analysis, it is very likely that the number of organized groups involved in child pornography is small. 87 Those who produce, distribute and consume child pornography are all culpable, but could operate independently and in different parts of the world. In amateur operations, there is often substantial overlap: consumers of child pornography may produce their own material for trade, and set up or participate in online forums for distribution. These networks are not financially motivated, however, and so would not be regarded as organized crime groups under the UN Convention against Transnational Organized Crime. Considerations of this sort led the global NGO End Child Prostitution, Child Pornography and Trafficking of Children for Sexual Purposes (ECPAT) to conclude: The majority of child pornography distributed internationally is, in fact, exchanged between paedophiles and child molesters without any commercial motive. Furthermore, while there is evidence that organised crime is involved in adult pornography, the same is not generally true for child pornography. 88 Research indicates that up to 97% of those who engage in sex crimes against children on the Internet act alone. 89 This may also be true for both the production and dissemination of pornographic materials: it is possible for single offenders to set up and maintain commercial child pornography websites without having to act in groups. 90 On the other hand, the exchange of these materials, whether 228 TRANSNATIONAL ORGANIZED CRIME THREAT ASSESSMENT
235 10 for financial benefit or not, is a group activity, and for some offenders may become an end in itself. Whether professional or amateur, the damage done to the victims is the same, and those who exchange child pornography for non-commercial reason are often abusers themselves. Frequently, the child sex abusers captured in pornographic images are people who are meant to be caring for the children they victimize. According to data gathered by the US National Center for Missing and Exploited Children, in more than one quarter of the cases where the relationship was known, the victimizer was the parent of the child victim, and in an additional 10% of the cases, it was another relative. The perpetrator was a stranger in only 4% of the cases. One study found that 46% of those arrested for possession of child pornography in the US had access to children through their job or organized youth activity. 91 The majority of those who collect child pornography appear to be male, white and westernized, 92 although there is a subgenre featuring underage Japanese girls aimed at the Asian market. While some studies differ, 93 quite a few show the majority of collectors to be primarily middle-aged. Aside from this, the background appears to be fairly diverse. Those who produce these materials appear to fit a similar profile. In a study of 155 child pornography offenders, 85% admitted to having victimized children themselves. 94 Because those who produce child pornography are often the relatives of the children, the victims tend to match the ethnic profile of the victimizers: 96% of the victims in the Cybertip.ca sample were white. Research in Australia similarly concluded that most of the victims were white (86%), with some Asians and very few children of aboriginal background. 95 In 2009, the single largest content analysis ever produced was conducted on more than 250,000 images collected by the UK Child Exploitation and Online Protection Centre. This research found that 91% of the victims were white and 81% female, with 38% being white, prepubescent females. Some 6% were Asian females. Black children were conspicuous by their ab sence. 96 It has been argued that most of the victims come from developing countries, 97 but it is difficult to reconcile the facts above with this conclusion. Large-scale production in Africa is excluded due to the ethnic profile of the known victims. Amateur pornography produced in Mexico, Philippines and Brazil has been detected, 98 but clearly these sources do not predominate. It is frequently asserted that FIG. 187: RELATIONSHIP BETWEEN THE PER- PETRATOR AND THE VICTIM IN CHILD ABUSE IMAGES CIRCULATED ONLINE Prostitution 2% Guardian s significant other 4% Stranger 4% Babysitter/Coach/Mentor 4% Parent 26% Family friend 23% Online 13% Self-produced 8% Other relative 10% Source: National Center for Missing and Exploited Children 99 90% of the commercial child pornography comes from Eastern Bloc countries in Europe, 100 and that, as a location, Eastern Europe appears to be key to the organization of the trade. 101 This would be compatible with the ethnic profile described above. A number of cases have been documented in the Russian Federation, Ukraine, the Republic of Moldova and Belarus, often involving child modeling agencies. 102 But given that the producers and the consumers seem to be essentially the same people, most of these images likely originate in the main consumer countries. The USA holds the largest national share of the domains related to child pornography that are detected by groups like the Internet Watch Foundation and Cybertip.ca, but the USA also has by far the largest number of domains of all sorts. 103 The Russian Federation generally also figures prominently in these assessments. Of course, as noted above, the location of the offenders may be different than the location of the domains they use this is one advantage of the transnational nature of the Internet for those selling child pornography. Despite their use of the Internet, child pornographers and their clients are not necessarily technologically sophisticated. Only 6% of the offenders in one sample used encryption technology. 104 In another sample, 17% used password protection, 3% evidence-eliminating software only 2% used remote storage systems. 105 It is possible that more sophisticated consumers have evaded detection altogether, however. Relationship unknown or not reported 6% Case studies of transnational threats 229
236 CYBERCRIME How big is the flow? As noted above, the lack of research on the size and growth of the universe of child pornography is striking. Known databases have included up to one million images, but these figures include videos which contain many thousands of still images. The largest database that has been cleared of redundancies was collected by the project Combating Online Paedophile Networks in Europe (COPINE) at University College Cork in Ireland, which contained some half a million images, some of which might be 30 years older or more. In the late 1990s, an average of four new victims were appearing each month in images traded by the newsgroups they monitored. 106 If this trend were to continue, and 1,000 images were taken of each child, this would yield a growth of some 50,000 images per year, or about 10% growth annually. Some very large estimates have been made of the value of the commercial child pornography industry, with very little evidence to back them up. In one frequently cited estimate, the on-line commercial child pornography industry is said to be worth US$20 billion. Via a number of intermediary sources, this figure is variously cited to UNICEF and the FBI, both of which have disavowed the number. 107 As will be discussed below, this amount far exceeds credible estimates of the value of the adult internet pornography industry, and is about a quarter of the value of the global cocaine trade, a far more expensive and popular commodity. Perhaps leery of providing a more precise estimate, a number of sources have referred to child pornography as a multi-billion dollar industry, 108 although the basis for these calculations remains equally unclear. There are at least two ways a more accurate estimate could be made. Industry-based: an estimate of the annual turnover of the total pornography industry could be multiplied by the share of all pornography that involves children. Consumer-based: an estimate of the number of offenders could be multiplied by the amount spent by each annually. Industry-based Little credible recent research has been done to estimate the size of the market for adult pornographic materials. One 1999 scan of web content found that just over 1% of 2,500 randomly selected servers contained pornography. 109 In 1998, the online adult pornography industry was estimated to generate between US$750 million and US$1 billion in revenues annually. 110 It is likely that the demand has expanded since that time, 111 as the number of Internet users grows, but the number of free sites has also expanded. In addition, many of the new users are located in developing countries, and many of these new users may face restrictions in their access to internet pornography. China, for example, uses a national filter to prevent access to these materials, and treats violations very seriously over 5,000 people were arrested for internet pornography offences in As of 2000, online pornography also became illegal in India. The consensus seems to be that the market has become more competitive, with a small number of commercial providers 113 competing with the proliferation of free sites. The volume of pornographyrelated web searches is very large, but one industry estimate suggests that only 0.3% to 0.4% of those visiting the pay sites actually purchase content. 114 Those who do pay tend to be collectors, who subscribe to access huge volumes of material, with fees in the tens of dollars securing entry to extended consortia of websites. 115 Although pornography may play a greater role in the lives of paedophiles than for the public in general, it is highly unlikely that the value of the industry exceeds that of the adult trade, due to the much smaller user base. These considerations would favour an estimate of less than US$1 billion annually. Consumer-based There are no generally accepted figures for the prevalence of paedophilia, but some insight into the number of people who might buy child pornography can be gathered from criminal justice data. Data associated with law enforcement investigations have suggested some very large figures for the number of offenders and the annual turnover of particular networks. 116 Operation Avalanche was probably the largestever investigation focusing on commercial child pornography. Landslide Inc. was a company offering credit card and subscriber services for child pornography websites. It offered subscriptions to more than 5,000 websites globally 117 which, at the time of shut down, were reported to have between 75, and 390, customers. The profit, said to be generated mostly through child pornography-related financial services, was reported to be up to US$1.4 million a month. 120 This suggests a profit of around US$3,500 per site per year TRANSNATIONAL ORGANIZED CRIME THREAT ASSESSMENT
237 10 Some 7,000 British citizens were implicated in Operation Avalanche, making possible Operation Ore, a controversial crackdown in the United Kingdom in The litigation surrounding these arrests has suggested that a share of those allegedly paying for child pornography never downloaded it. In fact, some appear to have been victims of identity theft their credit card information was bought by website owners and charges falsely generated. Both Operation Avalanche and Operation Ore appear to have resulted in relatively few convictions compared to the number of offenders initially implicated, and many of the British convictions are still under appeal more than a decade later. 122 In fact, the number of arrests and convictions for possession of child pornography annually are rather modest, even in the best resourced countries. British Home Office figures show 116 offences were recorded for abuse of children through prostitution and pornography in 2008/ In Canada, 1,408 people were charged with possession of child pornography in This is up considerably from the 159 people were charged with possession of child pornography in The figure was 1,407 in 2007, suggesting a rather stable situation today. 126 The United States Federal law enforcement authorities, which actively pursue online sex offences, were referred 2,539 suspects for possession of child pornography in 2006, of whom more than half were prosecuted. 127 Due to the deployment of several federal task forces, including those focused on child abuse on the Internet, 128 this figure was up sharply from the 169 detected in If US federal authorities were referred even 1% of those in possession of child pornography annually, this would indicate a pool of one quarter of a million offenders, equal to less than one tenth of one per cent of the US population. If a similar share were offenders in Europe, including the Russian Federation, this would still be less than one million consumers in total. There is evidence of consumption of these materials in Asia, but even so, a figure of more than two million Internet child pornography consumers globally would posit extremely low detection rates and can be considered an upper limit. images. If viewed and acquired at a rate of one per minute, selecting 1 million still images would represent almost four years continuous work, labouring 12 hours per day. According to one sampling, the average number of images in the possession of offenders investigated was 16, This would represent a substantial investment if these images were selected and purchased individually, but case studies suggest that, as with the adult industry, material tends to be acquired en masse, through trade or subscription services. Other studies suggest far smaller numbers of images per offender: one US-based study of 429 arrestees found that more than half (52%) had fewer than 100 images, and 86% had fewer than 1,000 images. 133 The study distinguished a subset of organized collectors (27%), who were more likely to have large collections, video material, non-digital child pornography, images of children under 6 years old, better computer systems and encrypted files. 134 To consume one billion dollars worth of material, each of the two million global consumers would have to spend US$500 annually apiece, or about US$40 per month. One recent study found an average commercial site membership was US$53 per month, 135 so this is within the realm of possibility, but posits that all child pornography consumers are paying subscribers. It also assumes that subscribers receive sufficient new material every month to justify the monthly fee. All this would suggest that 1 billion US dollars would be pressing the outer limits of a credible estimate for the annual global turnover for child pornography. It is far more likely that the figure is considerably less, given that a good deal of material is shared between peers. And, if the US figures are representative, perhaps a quarter of global consumers (the share classed as organized ) are likely to be regular subscribers, for a market value on the order of US$250 million. How much do each of these people consume annually? Many child pornography consumers have been found in possession of large numbers of images. 129 As mentioned above, extreme examples include databases of 250, or even 1 million images, 131 although such figures quickly reach the point of absurdity, unless a large share are video Case studies of transnational threats 231
238 CYBERCRIME IMPLICATIONS FOR RESPONSE Of course, the impact of child pornography cannot be reduced to a dollar figure. And while production of this material appears to be largely an amateur activity, international action should be taken against those aspects of the market that do constitute transnational organized crime: the networks that distribute these images. These networks do comprise groups of some longevity aimed at the commission of a serious offence. The acquisition of new images represents a form of material benefit, so even networks engaged in bartering could be considered organized crime groups under the United Nations Convention against Transnational Organized Crime. The same is true for identity theft: the actual theft may be largely an individual activity, but those who organize this market and exploit the data constitute transnational criminal networks. There are at least two levels at which the problem can be addressed: prevention and justice. Prevention can be conducted by individual governments, or even by non-governmental actors. Offending sites can be rapidly disabled, monitoring groups established and tip-lines promoted. These national efforts can be global in scope, since the Internet knows no boundaries. Public education will continue to play a key role in preventing online financial victimization, as well as preparing children to deal with and report attempts to exploit them. Prevention efforts should have some ameliorative effect, but perpetrators will continue their attempts until a credible threat of incarceration can be generated. Creating this threat will require both international cooperation and national action. Unfortunately, there is, at present, no international agreement to cooperate on cybercrime, aside from the general provisions of the Convention against Transnational Organized Crime. Establishing such an agreement should be seen as a matter of international priority. Within this framework, national law enforcement agencies can cooperatively take advantage of the anonymity of cyberspace. Undercover work that would take months of preparation in the real world can be conducted by anyone with a terminal and a good set of leads. This is unlikely to prevent the activity altogether, but may discourage new players from entering the market place and reduce the incentives for stealing 232 TRANSNATIONAL ORGANIZED CRIME THREAT ASSESSMENT
239 11 REGIONS UNDER STRESS: WHEN TOC THREATENS GOVERNANCE AND STABILITY
240
241 11 REGIONS UNDER STRESS When TOC treatens governance and stability The United Nations Security Council has recently paid much attention to the threat posed by transnational organized crime. The Secretary-General, speaking at the African Union summit in January 2010, also emphasized the perils of illicit trafficking, particularly drugs. He noted that Criminal networks are very skilled at taking advantage of institutional weaknesses on the ground. 1 In February 2010, The Security Council note(d) with concern the serious threats posed in some cases by drug trafficking and transnational organized crime to international security in different regions of the world. 2 This chapter illustrates what happens when transnational criminal activities intersect with a region s governance problems. TOC can present a major challenge even where the state is strong, but when, for a variety of reasons, the rule of law is already weakened, it can pose a genuine threat to stability. As this crime further undermines governance and stability, countries can become locked in a vicious circle where social trust is lost and economic growth undermined. This challenge is sometimes overstated, but, as this chapter illustrates, it is very real in some parts of the world. The clearest examples are found in countries where insurgents draw funds from taxing, or even managing, organized criminal activities, particularly drug trafficking. South-West Asia, South-East Asia, and the Andean region are cases in point, and troubled areas in these regions have become the world s leading sources of illicit drugs. In the absence of the sort of outside funding found during the Cold War, rebel groups must derive their sustenance from the regions they control, and these unstable areas are often already enmeshed in drug trafficking. The money associated with organized crime can be so great that militants may forget about their grievances and focus on satisfying their greed. Even where this is not true, drugs pay for bullets and provide a lifestyle to combatants that makes them less likely to come to the negotiating table. Drugs trafficking is not the only organized crime activity that can keep a rebellion afloat, however. As the example of the Democratic Republic of the Congo illustrates, insurgents can harvest and traffic the natural resources present in the areas they control, generating incomes for warlords that dwarf what they could earn in peacetime. Some of the world s poorest countries have been robbed of their most valuable resources in this way, and untold environmental damage has been done. Africa is especially vulnerable to this type of abuse, as diamond-fuelled wars in Angola and Sierra Leone demonstrate. The oil-driven conflict in the Niger Delta provides a current example. The map on the next page overlays some of the major trafficking flows discussed in this chapter with some of the stability challenges experienced around the world. It illustrates the interplay between conflict, both current and recent, as well as global trafficking flows. The presence of United Nations Peacekeepers in many of the post-conflict areas highlights the importance of the issue for the international community. Organized crime can become even more important when rebels gain exclusive control of a portion of a country. The pseudo-states thus created have no international accountability and, particularly when strategically placed, often become trafficking hubs and retail centres for all manner of illicit goods and services. They also continue to pose a threat to national and international security, providing a safe haven for international fugitives, including terrorists. A large number of UN peace missions are operating in regions affected by transnational organized crime, including West Africa (UNOCI in Côte d Ivoire, UNMIL in Liberia, UNOGBIS in Guinea-Bissau, UNIPSIL in Sierra Leone and UNOWA for West Africa as a whole), Central Africa (MONUC in the Democratic Republic of the Congo and BONUCA in the Central African Republic), East Africa (Somalia), South-West and Central Asia (UNAMA in Afghanistan, UNRCCA in Central Asia), and South- East Europe (UNMIK in Kosovo). But conflict zones are not the only places where transnational organized crime can pose a threat to the state. There are a number of areas around the world where criminals have become so powerful that, rather than seeking to evade the government, they begin to directly confront it. In these cases, a pattern of symptoms is typically manifest. Investigators, prosecutors, and judges who pursue organized criminals are threatened and killed. Journalists and activists may also be targeted. Corruption is detected at the highest levels of government, and law enforcement can become paralysed by mistrust. Portions of the country may effectively drift beyond state control. This is the situation presently confronted in some parts of Central America and West Africa, both of which have suffered from a long history of violence and instability. Case studies of transnational threats 235

242 UNODC / SCIENCES PO FIG. 188: CRIME AND INSTABILITY - KEY TRANSNATIONAL THREATS Russian Federation United States of America West Central Europe South-East Europe Central Asia Caribbean Gulf area, Middle East West Africa Horn of Africa Andean region Central Africa East Africa Sources: UDCP/PRIO Armed Conflict Dataset version ; ICC International Maritime Bureau, Piracy and armed robbery against ships, Annual Report 2009; UN/UNODC Cocaine trafficking Main source countries High homicide rates linked to cocaine trafficking Heroin trafficking Main source countries Conflict resulting in 1,000 or more battle deaths in 2008 Conflict resulting in battle deaths in 2008 Area of instability with presence of UN peace missions UN regional peace mission South-East Asia Piracy off the Horn of Africa Trafficking from eastern Democratic Republic of the Congo Gold Cassiterite TRANSNATIONAL ORGANIZED CRIME THREAT ASSESSMENT
243 11 Drug trafficking can also have a catastrophic effect on local violence levels. Drug wars can rival some conflicts in terms of body counts. Of the countries with the highest murder rates in the world today, many are primary drug source or transit countries. Most of these are discussed in the regional profiles that follow. FIG. 189: TRANSNATIONAL OPIATE MARKET: GROSS ILLICIT PROFITS IN BILLION US$ AND IN % OF GDP, IN SE- LECTED SOURCE, TRANSIT AND DESTINATION AREAS, Organized criminals generally do not seek to topple the state, but they can provoke a reaction that can also threaten long-term peace prospects. A clear sign that crime has become a national security threat comes when exceptional legal and security measures are taken, including calling on the military to help re-establish the government s authority. % of GDP % of GDP billion US$ billion US$ While sometimes necessary to reacquire lost territory, the long-term use of regular military forces to police civilian populations presents risks for the rule of law and civil liberties. Military and police officials may become frustrated with a corrupt or ineffective criminal justice system and begin to engage in extrajudicial executions. The public may form civilian vigilante groups as well. Over time, these paramilitary vigilantes can become as big a security challenge as the criminals they were formed to combat. In all of these cases, the criminal activity is transnational because the main sources and destinations of contraband are typically found in different parts of the world. The profits from drug trafficking, for example, are drawn from consumers in the wealthiest nations. In absolute terms, transnational organized crime is strongest in the richest countries, but its share of total economic activity there is so small that it does not rise to become a substantial threat to state security. But when this wealth is levelled against countries with much smaller economies, organized crime is given the resources to overwhelm local law enforcement. To cope, these agencies need international support for local interventions. All affected countries must play their part, but these are truly transnational problems, and require transnational solutions, where all aspects of the market chain are assessed and addressed strategically. Too often, organized crime is seen only as a national law enforcement problem. Because the criminal justice system is focused on putting individual criminals in prison, efforts against organized crime tend to focus on organized groups. But the markets are much bigger than the people who presently ply them; cocaine has been trafficked from the Andean region for over three decades, and while the groups involved have changed over time, the flow continues. So too Afghanistan Central Asia Russian Federation EU/EFTA do the security challenges it creates. The success of the Kimberley Process 3 in stopping the flow of blood diamonds from West Africa illustrates how strategic measures designed to tackle the entire trans national market can be far more effective than armed interventions at the national level. Of course, sound national law enforcement remains essential, and has proven effective in reducing stability-threatening organized crime problems to more manageable proportions. For example, from the 1970s to the early 1990s, fuelled by money gained in processing and trafficking heroin to the United States, Cosa Nostra was able to threaten the stability of Italy, a G8 country and the third largest economy in Europe. In a situation very similar to that faced in Central America today, these transnational criminals sought to undermine public will to combat them by assassinating a number of high ranking public officials and engaging in a bombing campaign throughout the country. Resolute action against the mafia brought this onslaught to an end. While Cosa Nostra and the other regional Italian mafias still exist, Sicily is no longer a transhipment point for heroin, and direct attacks against the state are few. To experience these sorts of results, affected states must be supported in strengthening their domestic institutions, but this must be done in the context of an international strategy aimed at addressing the entire trafficking flow. While Sicily ceased to be a major heroin hub, the problem moved on to other regions. Over time, the problem may be displaced to precisely those areas least capable of coping, Case studies of transnational threats 237
244 REGIONS UNDER STRESS FIG. 190: ESTIMATED VALUES OF SELECTED TRANSNATIONAL TRAFFICKING FLOWS, 2008 Cocaine from S. America to N. America 38,000 Cocaine from S. America to Europe 34,000 Heroin from W. Asia to Europe 20,000 Heroin from W. Asia to Russia 13,000 Smuggled migrants from Mexico to the US Timber from SE Asia to Asia and Europe Trafficked women to Europe Global stolen identity information Ivory from Africa to Asia Firearms from US to Mexico 6,600 3,500 1,250 1, ,000 10,000 15,000 20,000 25,000 30,000 35,000 40,000 Source: UNODC 4 US$ millions where organized crime can pose a significant challenge to the state. The following pages look in more detail at the ways transnational organized crime is posing a challenge to stability in areas around the world. In particular, a number of case studies are presented in four main sections, concerning: the impact of cocaine trafficking on the Andean Region, Mesomerica and West Africa; the impact of heroin trafficking on South-West/ Central Asia, South-East Europe and South- East Asia; the impact of minerals smuggling on Central Africa; and the impact of maritime piracy on the Horn of Africa. Each of these discussions will look first at the major TOC problem confronting the region; though many of these regions are subject to multiple contraband flows, a single one is usually dominant, particularly with regard to its impact on political stability. Next, the history, sometimes quite protracted, of instability in the region is explored. Finally, the interaction between these two factors the organized crime problem and political stability is described. Many other examples could have been included, but these are some of the best known instances for which there are supporting data. Other areas, including Aceh (Indonesia), Sri Lanka, or the Philippines, have similarly been affected. There is virtually no region of the world with stability problems where organized crime is not an issue. Most of these examples involve drug trafficking, for the simple reason that drug trafficking generates greater revenues than any other form of transnational criminal activity in the world today. In addition to health and social consequences they bring, drugs provide the economic clout for insurgents and organized criminals to confront the state. They pay for arms and bribes. Competition for these profits is typically violent, and the targets for this violence can easily shift from rival traffickers to officials and other members of the public. There are a variety of reasons why other forms of trafficking are less relevant. Some forms of transnational organized crime that generate high revenues, such as human trafficking to Europe, do not concentrate this wealth sufficiently to pose a stability threat. Firearms trafficking was specifically excluded as a topic in this report. Weapons are a necessary part of armed violence, of course, but the transfer of weapons is usually episodic, rather than part of a sustained flow. The weapons themselves are dangerous, but the organized criminal activity of trafficking them rarely affects a region s stability. 238 TRANSNATIONAL ORGANIZED CRIME THREAT ASSESSMENT
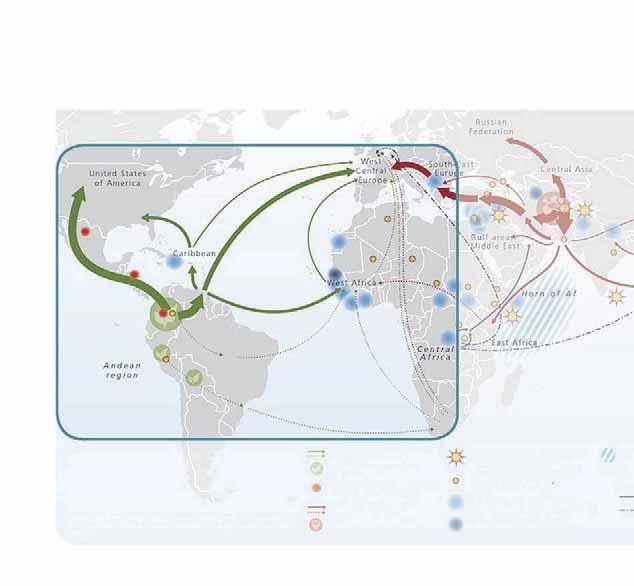
245
246
247
248 Regions under stress Main transnational organized crime threats Most of the world s illicit cocaine supply comes from the Andean region, primarily from or through Colombia. However, Colombia is also the country which has made most progress over the last few years in curbing the threats to national and international security emerging from drug production and trafficking. Colombian traffickers started out in the cannabis trade, flying locally produced marijuana to the US market. In the 1970s, they lost this market to cannabis produced closer to the consumer, but were sufficiently well connected at that stage to capitalize on the growing market for cocaine. Drawing their raw materials from the plurinational State of Bolivia and Peru, they processed the drug and exported it on a massive scale, and by the late 1970s, Colombia was the world s number one source of cocaine. The 1980s saw the emergence of the Medellin and the Cali cartels : large, structured organizations that controlled most of the market. Prices for cocaine were high at the time, as was consumption, and very shortly a huge amount of wealth was concentrated in a small number of hands. This allowed the cartel members to wield tremendous corrupting power and gain political influence. There were a series of scandals where high ranking politicians and civil servants were linked to the cartels. The destruction of these cartels became an urgent national security issue, and, with international cooperation and assistance, they were dismantled in the first half of the 1990s. This did not stop the drug trade, but it did significantly reduce its political influence. A large number of smaller criminal organizations emerged, sometimes also referred to as cartelitos. The emergence of these groups, in combination with increased efforts to curb the transport of raw materials from Peru and the Plurinational State of Bolivia, led to increased coca cultivation in Colombia in the second half of the 1990s. By 1997, Colombia became the world s largest source of coca leaf. Around this time, the Colombian groups began to face some serious challenges. First, prompted in part by evidence that insurgent groups were taxing the trade, the Government intensified its eradication efforts. The area under coca cultivation fell from 163,300 ha in 2000 to 81,800 ha in 2008, mainly due to eradication. During the same time, however, yields increased, due to the introduction of more efficient farming and processing techniques, before declining again in recent years. In sum, Colombian cocaine production declined by 38% between 2000 and The second challenge faced by the Colombian trafficking organizations in the late 1990s was the loss of control over their primary destination market: the USA. Mexican traffickers, who had previously been little more than transportation agents for the Colombians, began to assume control of everything from importation to street sales, seizing the most Fig. 191: Coca bush cultivation in the Andean region, Colombia Peru Bolivia Total 250, , , , , , , , , , , , ,600 81,000 50,000 50,300 43,400 56,100 38, ,100 38,000 14,600 30, Hectares Source: UNODC 242 TRANSNATIONAL ORGANIZED CRIME THREAT ASSESSMENT
249 11 lucrative segments of the trafficking chain. This loss was partly due to the reduced size of the Colombian groups, and partly to new extradition rules, which made Colombian traffickers reluctant to be associated with direct shipments to the USA. The Mexican traffickers had been paid for their services in kind for some time, and they took advantage of their numeric superiority and long experience in trafficking to reduce their former bosses to mere suppliers. This left the Colombian traffickers looking for new markets to explore, and they found a ready one in Europe. The size of the European cocaine market doubled between 1998 and While Colombian traffickers now cooperate with a wide range of groups in Europe, they still maintain a dominant role in supplying the European market. In parallel, traffickers in Peru and the Plurinational State of Bolivia began to manufacture cocaine. By 2008, about half of the world s finished cocaine products originated in these two countries, and was shipped to the growing markets of South America and Europe. Powder cocaine destined for Europe is often shipped via Brazil and various West African and Southern African countries. Criminal groups in Peru and the Plurinational State of Bolivia are, in general, only involved in shipping the cocaine within the region to neighboring countries, where international syndicates take over the trafficking. Security/governance situation Colombia has long been the most developed and most industrialized country in the Andean Community. But Colombia also suffers from a highly unequal distribution of wealth and has had a long history of political violence. In the nineteenth century more than 50 armed conflicts emerged between and within the traditional political parties. The twentieth century started with the Guerra de los Mil Días (One Thousand Day War) of , costing the lives of some 100,000 Colombians. Another wave of conflict was dubbed La Violencia (the Violence), an undeclared civil war over the period that claimed some 300,000 lives. Leftist guerilla groups emerged in the mid-1960s. Several of the left-wing rebel groups later joined the political system, leaving the Fuerzas Armadas Revolucionarias de Colombia (FARC) and the Ejército de Liberación Nacional (ELN) as the two main guerilla forces. 6 Right-wing paramilitaries emerged in the 1980s, initially to protect the interests of the large farmers and other business owners. By 1997, the paramilitary groups amalgamated under the umbrella of the Autodefensas Unidas de Colombia (AUC). 7 The services of the paramilitary groups were, however, also sought by various organized crime groups to protect their smuggling activities. Eventually, the AUC itself emerged as a key organizer of cocaine trafficking. The country s overall security situation deteriorated around 2000, as the FARC, the ELN and the AUC started to control ever larger parts of the Colombian territory, partly financed through drug money. With the strong decline in coca cultivation over the period, and the regaining of the territory by the Government, the security situation improved again. Starting in 2003, many members of the AUC were demobilized through an amnesty process, which included a promise not to be extradited to the USA. But, as described below, the threat has not passed, and the country continues the struggle to control all of its sovereign territory. The main security threats for Peru have been the activities of the Sendero Luminoso (Shining Path), a Maoist group which started its operations in the Ayacucho region of Peru, close to the coca cultivation centres of Apurimac-Ene. Its activities were later concentrated in the Huallaga valley, Peru s largest coca producing area (Alto Huallaga). The leader of the Shining Path was arrested in 1992 and the rebel group started to disintegrate. Links with drug trafficking groups, however, enabled the Shining Path to survive. In line with growing coca cultivation in recent years, sporadic attacks against army patrols increased again after Linkages between TOC and stability threats The progress made in Colombia over the last few years in reducing the threats emerging from the narco-business has been impressive, as shown above. Nonetheless, the overall situation remains fragile. Without the continuation of efforts, Colombia could fall back to where it was a few years ago. As the cocaine economy expanded, the number of homicides rose in Colombia from around 5,000 per year in the late 1970s to some 30,000 in the early 1990s. 9 But when the large cartels were dismantled in the early 1990s, violence began to decline again. The smaller groups assumed a lower profile and avoided open confrontations with the authorities. Large amounts of cocaine continued to flow out of the country, but homicides declined from around 28,000 in 1993 to 23,000 in This trend was briefly reversed in the late 1990s, as Case studies of transnational threats 243
250 Regions under stress Rate Fig. 192: homicide rate in Colombia (per 100,000 inhabitants), Sources: Multiple sources 10 both the insurgents and the paramilitaries increased their role in the drug business. The left-wing groups have primarily taxed coca cultivation in the areas under their control, with the FARC engaging in some manufacture and local trafficking to neighbouring Bolivarian Republic of Venezuela and Ecuador. The paramilitary groups, on the other hand, increasingly focused on providing services to trafficking groups, and even trafficking themselves. At the beginning of the twenty-first century, the AUC reportedly made some 70% of its total income from drug related activities, mostly related to the cocaine business. The international reach of the AUC tended to be much larger than that of the FARC, extending to Mexico and in some cases to the USA. When the Colombian Government began to regain territory lost to the militants, the homicide rate began to decline again. Important areas controlled by the FARC, including some of the country s coca producing areas, were recovered. The number of persons enlisted in the insurgent groups in Colombia (excluding the AUC) declined from 33,800 persons in 2002 to 13,200 in From 2003, the Government also began to dismantle the 32,000- strong AUC. As a result, the number of homicides in Colombia fell by some 45% between 2002 and 2008 to 16,000 persons, the lowest number over the last two decades. Similar trends to those seen in Colombia over the last few years can also be observed in Peru. In line with a massive decline of coca cultivation in the 1990s, terrorist incidents, mostly related to the activities of the Sendero Luminoso (Shining Path) operating out of the main coca cultivation areas of the country, declined drastically. While revenues from the cocaine business declined, overall economic development improved. In Peru, GDP grew by 4% per year over the period, that is, more than the overall economic growth in Latin America and the Caribbean over Fig. 193: Coca cultivation and size of illegal armed groups (FARC and ELN) 160,000 40, ,000 33,800 hectares 120, ,000 80,000 60,000 40,000 20,000 14,000 67,200 79, , , , , ,071 86,000 28,100 80,000 86,000 15,100 13,200 78,000 99,000 81,000 30,000 20,000 10,000 number of persons Coca surface Size of illegal armed groups (enrolment) Sources: UNODC, Colombia: Coca Cultivation Survey, June 2009 and previous years 244 TRANSNATIONAL ORGANIZED CRIME THREAT ASSESSMENT
251 11 FIG. 194: AREA UNDER COCA CULTIVATION AND TERRORIST INCIDENTS IN PERU, Area under coca cultivation Terrorist incidents Hectares Number of attacks Source: DEVIDA, Cocaine production Monitoring in the Andean region, Lima, July 2004; UNODC cultivation data the same period (3.3% per year). Similarly, the Colombian economy grew, on average, by 4.4% per year over the period, which was above the average for the Latin America and Caribbean region (3.6%). In parallel, corruption declined in Colombia. In 1999, Transparency International rated Colombia the country most affected by corruption in South America. By 2009, it had the second best rating, second only to Chile. 11 Despite these remarkable achievements, the danger has not passed, and the armed groups have not been eliminated. The Shining Path in Peru is still active and has been launching attacks, particularly after In Colombia, there were illegal armed groups in 79% of the municipalities where coca was cultivated in 2008, while in non-coca growing areas the proportion was significantly lower (27%). 12 There are also indications that some of the former members of the dismantled AUC have re-organized themselves to become full-fledged cocaine-trafficking organizations. Out of the 31,700 persons that were enlisted in the various AUC groups in 2003, around 4,800 persons may have become members in the new paramilitary/trafficking organizations. 13 There have even been claims that elements in the FARC and the AUC are collaborating in producing cocaine. Case studies of transnational threats 245

252 Regions under stress Fig. 195: Illegal armed groups and coca cultivation in Colombia, 2008 Source: UNODC, Colombia coca cultivation survey, June TRANSNATIONAL ORGANIZED CRIME THREAT ASSESSMENT
253 11 As the situation in Colombia improves, the situation in neighboring the Bolivarian Republic of Venezuela appears to be in decline. The single largest cocaine seizure in 2008 was 4.1 tons of cocaine seized from a commercial vessel coming from the Bolivarian Republic of Venezuela, and 2.5 tons were also seized on a fishing boat coming from that country. 14 According to the new Maritime Analysis Operation Centre (MAOC-N), more than half (51%) of all intercepted shipments in the Atlantic (67 maritime events over the period) started their journey in the Bolivarian Republic of Venezuela. Direct shipments from Colombia, in contrast, accounted for just 5%. 15 the Bolivarian Republic of Venezuela s murder rate has risen in recent years, and is now among the highest in the world. Its standing in the Transparency International rankings has also dropped. At the same time, all available information suggests that profits made by Venezuelan organized crime groups are still substantially lower than those made by Colombian organized crime groups. Trafficking to markets in both North America and Europe may have generated Colombian drug traffickers some US$6.6 billion in sales (US$6 billion in gross profits) in This is more than twice as much as the US$2.7 billion of gross profits generated by Afghan opiate traders in The gross profits made by the Colombian groups were, however, equivalent to only 2.5% of Colombia s GDP in 2008, while the equivalent ratio in Afghanistan was 26%. 17 Colombia has long struggled with this intractable blend of organized crime and insurgency, and while it has received international assistance, much of this has been aimed at drug interdiction within the country itself. Significant progress has been made by Colombia in recent years, but much more could be done on addressing the entire trafficking chain through better coordinated international efforts. The problems linked to Colombia s cocaine production not only have implications for Colombia itself but also for a number of other countries, including neighbouring the Bolivarian Republic of Venezuela, Ecuador, Panama, other countries of Central America, most countries of the Caribbean, Mexico, the USA as well as countries in Western Africa and Europe. Colombia s problems have been aggravated by factors outside its control, and this instability has likewise had an impact on areas outside its jurisdiction. To address a problem that affects South America, Central America, North America, Europe, Africa, and the rest of the world, a global strategic plan to combat the cocaine trade is needed. FIG. 196: DEPARTURE LOCATIONS OF IDENTI- FIED DRUG TRAFFICKING SHIPMENTS BY SEA FROM SOUTH AMERICA TO EUROPE, West Africa 11% Colombia 5% Caribbean 11% Other 12% Brazil 10% Source: Maritime Analysis Operation Centre Venezuela 51% Case studies of transnational threats 247
254
255
256 Regions under stress Main transnational organized crime threats There are many transnational organized crime threats affecting West Africa, including the trafficking of cocaine, natural resources (including oil), cigarettes, counterfeit medication, women, small arms, toxic waste, and migrant workers. Of these, two forms of contraband currently pose a real threat to the stability of states in the region: cocaine and natural resources. The other organized crime problems are serious for other reasons, but they do not concentrate enough money into a small enough number of hands to pose a real challenge to the state. Fig. 197: major cocaine seizures (in kg), ,000 Countries that reported seizures on land , Morocco 2,252 Cape Verde ,300 1,500 *Only seizures above 100 kg are displayed 3,100 3, ,250 1,200 Senegal The Gambia Guinea-Bissau Guinea 170 Sierra Leone 3, E 3,700 Mauritania 2,500 Liberia Côte d Ivoire Mali 500 km Algeria Burkina Faso Benin Togo Ghana 274 Nigeria , Large-scale cocaine trafficking through the region was first detected in 2004, symptomatic of a shift in the centre of gravity of the global market from the USA to Europe. West African traffickers had long been active in small-scale import and marketing of cocaine in Europe, as they have been in many other parts of the world. But around this time individuals based in West Africa began to provide logistic assistance to Colombian traffickers in organizing their maritime shipments to Europe from at least two hubs: one centred on Guinea-Bissau and Guinea in the north, and one centred on the Bight of Benin in 840 Niger the south, both involving Nigerian nationals. Mother ships from South America could unload cargoes to smaller craft from the coast, and the cocaine could be stored, repackaged, and redirected to European buyers from this vantage. In exchange for their services, it is believed that the West Africans were paid in kind: they were allowed to retain up to one third of the shipment to traffic on their own behalf, which they did mainly via commercial air couriers. By 2008, the situation began to change. Heightened international awareness of the threat made trafficking via West Africa more difficult. In addition, a series of events shifted the political terrain in the northern hub. In August 2008, the head of the navy of Guinea-Bissau fled the country under allegations that he was orchestrating a coup d état. In December 2008, the man who had ruled Guinea for 24 years died, and a military cabal took control, later arresting two of the dictator s sons and several prominent officials for their involvement in drug trafficking. In March 2009, the head of the army of Guinea-Bissau was murdered, and, shortly afterward, in an apparent reprisal attack, so was the president. Finally, a series of very large seizures of cocaine disappeared while in police custody. The owners of these shipments, Colombian traffickers, may have concluded that their West African partners had decided to keep 100%, rather than one third, of the consignment, and terminated relations on this basis. Whatever the cause, both maritime seizures and airport seizures on flights originating in West Africa virtually disappeared at the end of Some trans-atlantic traffic may have shifted to private aircraft, however, as the recent crash of a Boeing 727 jet in central Mali suggests. Some may be trafficked by means as yet undiscovered. The cocaine trade through West Africa continues, but apparently at a reduced rate of perhaps 25 tons per year, with a retail market value of US$6.8 billion at destination in However, there is anecdotal information from law enforcement circles that cocaine trafficking via West Africa may have started to increase again in late 2009 and in 2010 as traffickers are trying out new routes, including shipments via the Sahara for transit destinations in northern Africa and final destinations in Europe. West Africa has also been affected by trafficking of natural resources. One of the best documented cases involved the trafficking of diamonds from Sierra Leone, often via Liberia, with the funds supporting the rebel Revolutionary United Front and the criminal regime of Charles Taylor. While this trade has largely been tamed due to the end of the war and the 250 TRANSNATIONAL ORGANIZED CRIME THREAT ASSESSMENT
257 11 FIG. 198: SHARE OF COCAINE COURIERS ORIGINATING IN WEST AFRICA DETECTED AT SELECTED EUROPEAN AIRPORTS, % 59% 50% 48% share West African 40% 30% 20% 10% 0% 35% 35% 36% 30% 28% 27% 20% 15% 8% 6% 5% 1% 0% 1 Qtr 2 Qtr 3 Qtr 4 Qtr 1 Qtr 2 Qtr 3 Qtr 4 Qtr 1 Qtr 2 Qtr 3 Qtr 4 Qtr 1 Qtr 2 Qtr 3 Qtr 4 Qtr Source: IDEAS database implementation of the Kimberley Process, an older trafficking flow endures: the illegal bunkering of oil from the Niger Delta in Nigeria. Oil was discovered in Nigeria in 1956 and has played an important role in domestic politics since that time. During the Nigerian Civil War ( ), the rebel Igbo Biafrans devised simplified ways of refining the high quality crude of the Delta, allowing local marketing of stolen oil. Today, oil bunkering is inextricably entangled in the militant struggle in the Niger Delta. A series of organized armed groups have demanded the Government and the international oil companies give a larger share of the wealth of their land to the local people and to compensate them for damage done to waterways and farm land. These militants fund themselves through a variety of criminal activities, including kidnapping of oil company employees, but their mainstay has long been the trade in stolen oil. The stability/governance situation West Africa is one of the the poorest and least stable regions on earth. All but three of the 16 countries in this region are on the United Nations list of the least developed countries, including the five countries with the very lowest levels of human development. Since independence, West Africa has experienced at least 58 coups and attempted coups, some very recent, such as the 18 February 2010 coup in Niger. There remain many active rebel groups in the region. At present, of the 15 nations of the Economic Community of West African States (ECOWAS), about half are experiencing some form of instability. Longstanding insurgencies are found in Côte d Ivoire, Senegal, Mali, Niger and, arguably, Nigeria. Both Sierra Leone and Liberia are continuing to recover from brutal civil wars. Mauritania and Guinea recently experienced coups d état, and the president of Guinea-Bissau was murdered by his own troops. According to one recent rating of the 25 countries with the highest risks of instability globally, nine were in West Africa: Niger, Mali, Sierra Leone, Liberia, Mauritania, Guinea-Bissau, Côte d Ivoire and Benin. 18 The United Nations maintains a number of political and peace missions in the region, including the United Nations Office for West Africa (UNOWA), the United Nations Peace-building Support Office in Guinea Bissau (UNOGBIS), the United Nations Integrated Peacebuilding Office in Sierra Leone, United Nations Operation in Côte d Ivoire (UNOCI) and the United Nations Mission in Liberia (UNMIL). Linkages between TOC and stability threats The greatest danger posed by cocaine is its extreme value compared to that of local economies. This allows traffickers to penetrate to the very highest levels of government and the military. Law enforcement officials can be offered more than they could Case studies of transnational threats 251
258 Regions under stress earn in a lifetime simply to look the other way. This extreme leverage has allowed traffickers to operate with very little resistance from the state, and therefore little need to resort to violence. There appears to have been some violence in elite circles as rivals compete for access to these profits, however. For example, in Guinea-Bissau, several journalists and activists have had to flee the country or go into hiding after they received death threats for reporting on military involvement in drug trafficking. Both the then head of the army and the head of the navy appear to have been involved in making these threats. 19 From 2007 onwards, high level officials have made similar accusations, including the Interior Minister and the head of the Judicial Police, but none has been able to challenge the military. Drugs have been detected arriving on military air strips, military officers have been arrested in possession of hundreds of kilograms of cocaine, and there have been several armed stand-offs between police and military forces concerning drug shipments. Drugs seized by the police are confiscated by the military and then disappear. Accused soldiers, as well as foreign traffickers, are simply released from custody. In July 2008, both the Attorney General and the Minister of Justice said they had received death threats related to investigations into a cocaine seizure. 20 The killing of the president and the army chief of staff in March 2009 appears to have been motivated more by personal rivalry between the two men than by trafficking, although the latter was said to have accused the former of involvement prior to the 2008 elections.the nature of the alleged coup plot by the head of the navy is even less clear. But given the evidence of corruption and the relative sizes of the contraband and the economy, virtually every political conflict has criminal undertones. Guinea-Bissau is not unique in this respect. In Guinea, the presidential guard, commanded by one of the president s sons, appears to have been involved in drug trafficking, alongside a number of high ranking public security officials. Another of his sons has also been accused of involvement. In Sierra Leone, the Minister of Transportation resigned after his brother was implicated in the country s largest cocaine seizure. Given their close ties to national officials, it is perhaps not surprising that there is little evidence of insurgents dealing in the drug. There have been allegations that rebels in the north of Mali and Niger have been involved in trans-saharan trafficking, but little evidence is currently available on this flow. In contrast, oil bunkering in Nigeria has been very much a rebel activity from the start, although the political objectives of the thieves have always been vague. The Niger Delta rebels argue that their portion of the country has been left undeveloped and subjected to environmental abuses, even as Nigeria s most valuable resource is extracted from the Delta. But as time has passed, it has become difficult to distinguish those with political motivations from those with financial ones. The integrity of the oil trade is particularly important to regional stability because Nigeria accounts for over half the population of the region and over 60% of the regional GDP. Oil comprises 95% of Nigeria s foreign exchange earnings and up to 80% of budgetary revenues. 21 In turn, Nigeria is a key trading partner for the other countries of the region, so a large share of the region s population is dependent on the oil sector. Thousands have died in the armed struggle, which itself has absorbed a large amount of national security resources. From August to October 2009, Nigerian President Umaru Yar Adua offered a pardon and cash payments to rebels who laid down their arms, and many of the most prominent leaders took him up on this offer. The major militant umbrella group, the Movement for the Emancipation of the Niger Delta (MEND) declared a ceasefire at the same time. But in February 2010, MEND retracted this ceasefire, calling the amnesty process a sham and warning the oil companies to prepare for all-out onslaught. 22 The conflict and the smuggling continue. The countries of West Africa need help in strengthening their capacity to resist transnational organized crime. Recent efforts against the cocaine trade, with the support of the international community, have shown promising results. But, rich or poor, there isn t a region in the world that can be entirely shielded against transnational organized crime. West Africa remains particularly exposed, and the region will continue to face serious potential threats to governance and stability so long as transnational contraband markets are not addressed. 252 TRANSNATIONAL ORGANIZED CRIME THREAT ASSESSMENT
259
260 Regions under stress Main transnational organized crime threat A great deal of international attention has been placed on the drug-related violence in Mexico, with some even arguing that the country is in danger of being severely destabilized. Less attention has been placed on Central America, where the murder rates are four to five times higher than in Mexico, and where both the economy and the state are far less robust and resilient. While the drug violence has been intense in places like Ciudad Juarez, Mexico s overall murder rate remains moderate compared to many other countries afflicted by the drug trade. On the other hand, the Mexican cocaine traffickers appear to be evolving into multi-crime groups, with the ability to shift investment to other areas if the cocaine trade declines. Unlike Mexico, the Central American countries have high levels of violence unrelated to the drug trade a legacy of longstanding social divisions and decades of civil war. The highest murder rates in these countries are seen not in the largest cities, but in provinces with a special role in the drug trade, often ports or border crossing points. For example, the rural Petén province in Guatemala, particularly affected by the drug trade, has the highest murder rate in the country. The death count has risen over time, as a growing share of cocaine trafficking is conducted through this region. The territory of Mexico has long been used by traffickers as a conduit for cocaine destined for the USA, but as noted above, the groups in Mexico have progressively wrested control of this flow from their Colombian suppliers over time. Today, some 180 tons of cocaine, bringing about US$6 billion to the regional cartels, transits Central America and Mexico annually. A sudden drop in consumption in the United States after 2006, almost certainly Fig. 199: Murder rates in mexico and Central America, 2009 U N I T E D S T A T E S Tijuana Mexicali O F A M E R I C A Juarez Nogales Petén 98 Belize Izabal 91 Cortés 92,1 200 km Baja California Hermosillo Guatemala Atlantida 108,4 Chihuahua Guatemala Honduras Tegucigalpa Sinaloa El Salvador San Salvador Nicaragua UNODC / SCIENCES PO La Paz Mazatlán Durango M E X I C O Gulf of Mexico CUBA Nayarit Pacific Ocean Jalisco Colima Manzanillo Michoacán México Distrito Federal Morelos FOCUS Quintana Roo Murder rate (per inhabitants) Lázaro Cardenas Guerrero Oaxaca B ELIZE GUATEMALA HONDURAS 500 km EL SALV ADOR NICARAGUA Sources: Official sources 254 TRANSNATIONAL ORGANIZED CRIME THREAT ASSESSMENT
261 11 related to loss of supply, has rendered competition for the remaining market even more intense. It may also be prompting trafficking organizations to diversify their operations. The wealth associated with cocaine trafficking has created large and powerful organized crime groups. These groups command manpower and weaponry sufficient to challenge the state when threatened, including access to military arms and explosives. They also have the funds to sow widespread and high-level corruption. In Mexico, the cocaine trade is now dominated by a number of cartels who compete to control border crossings and transportation routes. The leadership, turf, and structure of these groups has shifted over time as conflict both within and between the cartels, as well as enforcement efforts, force realignments. As of early 2010, the dominant cartels were the following: The Sinaloa Federation, led by billionaire, and Mexico s most wanted man, Joaquin El Chapo Guzman; The Gulf Cartel, once the most powerful criminal organization in Mexico, now greatly weakened by the defection of Los Zetas; Los Zetas, founded when a group of special forces soldiers defected to the Gulf Cartel and now operating as a trafficking organization in its own right; The Juarez Cartel, also known as the Carrillo Fuentes Organization, which is struggling to maintain control over its plaza (smuggling turf) in Ciudad Juarez, the city most affected by cartel violence; The Tijuana Cartel, also known as the Arellano Felix Organization, which is similarly struggling to maintain control over the Tijuana plaza. The Beltran Leyva Organization, a breakaway from the Sinaloa cartel, now weakened by the police killing of its leader, Arturo Beltran Leyva, on 19 December La Familia Michoacana, a Zetas breakaway based in Michoacan but expanding, renowned for its penchant for beheadings, quasi-religious ideology, and domination of methamphetamine production. Perhaps due to the recent slump in the cocaine trade, these groups are progressively engaging in a number of other organized crime activities, including migrant smuggling, kidnapping, and extortion (including taxing businesses) all crimes that were prevalent in Mexico before cartel involvement. % FIG. 200: POSITIVE TESTS FOR COCAINE USE AMONG THE US WORKFORCE, La Familia, which espouses a bizarre ideology combining aspects of evangelical Christianity with revolutionary populism, provides the most extreme example, taxing businesses in the areas they control and engaging in very public displays of violence to soften resistance. Though the total flow has declined, the share of northbound cocaine passing through Central America (particularly Guatemala and Honduras) appears to have increased. The groups involved in this region are less well defined. For most forms of crime in the region, the blame often falls on two street gang confederations founded by deportees from the USA: Mara Salvatrucha (MS13) and Calle 18 (M18). But there is little evidence that these groups, comprised of street youths intensely focused on neighborhood issues, are widely engaged in large-scale transnational drug trafficking. Most are based in inland cities, far from the maritime routes along which most cocaine flows before arriving in Mexico. They are certainly culpable in street sales in the areas they control, but their capacity to engage in bulk transnational smuggling is questionable. Some may be recruited as hit men by the Mexican organizations, but as they frequently tattoo their faces as a sign of their commitment to the gang, they are ill-suited for any operation involving possible contact with the public or the authorities. The maras have engaged in demonstrative violence in the past, including the random killing of civilians, but there is little to indicate they have any kind of political agenda, aside from avoiding police interference with their affairs * * January-June Source: Quest Diagnostics General US workforce Federally mandated, safety-sensitive workforce Case studies of transnational threats 255
262 Regions under stress Fig. 201: OECD average Latin America average El Salvador Mexico Subsaharan Africa average Honduras Guatemala The repeated arrests of high level officials in the police and the military, in contrast, suggest that the main traffickers in Central America are far more sophisticated than street gangsters, and are tied to some members of the ruling elites, rather than the underclass. There is also growing evidence of Mexican cartel penetration into Central America, particularly regarding Los Zetas in Guatemala and the Sinaloa Federation in Honduras. The stability/governance situation The Northern Triangle of Central America is still reeling from the brutal civil wars in Guatemala ( ) and El Salvador ( ). The region suffers from having one of the most unequal distributions of income in the world, comparable only to southern Africa or the Andean region. Small elites working with strong militaries have long dominated countries in this region, exporting agricultural commodities, as well as engaging in other labor-intensive enterprises. All countries in this region score poorly in governance indicators, particularly with regard to the rule of law (Figure 15), and the threat of renewed instability and conflict remains. Guatemala has long had a problem with vigilante justice, a response to a lack of police presence in much of the country. Honduras experienced a coup d état in 2009, when the serving president attempted to attain public support for an extended term of office. As a result of this legacy of violence, instability, and inequality, the Northern Triangle of Central America has the highest murder rate of any region in the Percentile rank of countries and regions based on World Bank Rule of Law indicator 23, percentile rank Source: World Bank 24 world, and very high rates of other forms of violent crime. It has also experienced political violence, and at times the distinction between criminal and political violence can be difficult to discern. Street gangs appear to be a symptom, rather than a driving cause, of this underlying violence Fig. 202: Honduras Comparative regional murder rates (per 100,000 inhabitants), El Salvador 49.0 Guatemala 11.6 Mexico 5.2 USA Source: UNODC International Homicide Statistics Mexico is very different from her southern neighbors, having a much larger and diversified economy, a stronger government, and milder social divisions. Nonetheless, insecurity in some parts of the country has become intense, and drug-related corruption has had an impact on national institutions. Linkages between TOC and stability threats 1.7 Canada Organized crime threatens stability, to varying degrees, in both Mexico and the northern triangle of Central America. In some areas, the civilian police have been both corrupted and outgunned, and the military has been brought in to recapture territory lost to criminal groups. These groups have gone on the offensive, murdering a number of prominent law enforcement officials who dared to oppose them. For example, in December 2009, the head of the Honduran anti-drug agency was murdered, as was Mexico s federal police chief in Organized criminals also target rank-and-file police officers for retaliatory killings. In June 2009, 12 federal police agents were tortured, killed, and their bodies dumped when the Mexican police arrested a high ranking member of La Familia Michoacana. Civilians have also been targeted for demonstrative 256 TRANSNATIONAL ORGANIZED CRIME THREAT ASSESSMENT
263 11 attacks, such as 2008 Independence Day grenade attacks in Morelia. In all of these countries, corruption at the highest levels, on occasion including the national heads of police and drug enforcement agencies, has been detected. For example, in Guatemala in August 2009, President Colom fired the director general of the national police, his deputy, his operations head, and his investigations head after a large amount of cocaine and cash went missing. This was far from the first such purging in Guatemala in recent years. In 2005, the head of the drug enforcement agency, his deputy, and another top drugs official were arrested for drug trafficking after being lured to the USA on pretence of training. The drug enforcement branch they commanded was itself a reworking of a previous agency, which had been disbanded following arrests of members for similar diversions. The agency has been reworked yet again in Similarly, in August 2008, the Mexican Government launched Operation Cleanup, aimed at purging the top ranks of the police of drug cartel corruption. The operation resulted in the jailing of both the interim commissioner of the Federal Police and the acting head of the counternarcotics division, among others. The same month, El Salvador s chief of police resigned when two top aides were accused of drug links. The corruption extends outside the police, and has implicated other criminal justice officials, legislators, and members of state and local government. But this situation is complicated: accusations of drug complicity can be used to take out opponents, and some of those assassinated by the traffickers may have been erstwhile collaborators. The fact that high level corruption continues to be detected and the officials removed shows the struggle is very much alive and that progress is being made. The complexity of the situation is perhaps best illustrated by a drug scandal that began on 19 February 2007, when three Salvadoran representatives to the Central American parliament (Parlacen) in Guatemala were killed after inexplicably departing from their motorcade. Their murderers were quickly identified as the head of Guatemala s criminal investigations division and three of his men. One of these arrestees claimed they had been hired to hijack the car, which was allegedly carrying cocaine worth US$5 million. The arrestees were never able to elaborate, however, as they were all shot dead while in custody in a high-security prison on 25 February. This incident led the serving Interior Minister to tender his resignation. Since then, two key investigators have been murdered, and the United Nations International Commission against Impunity in Guatemala (CICIG) has accused the Attorney General of interfering in the investigation of one of these cases. Aside from its corrosive effect on law enforcement integrity, the cocaine trade has also propelled the murder rate in the northern triangle of Central America to the highest in the world. Figure 12 demonstrates the clear linkages between drug trafficking and violence. Contrary to what would be expected, in none of these countries is the highest murder rate found in the largest cities: rather, it is found in provinces that have strategic value to drug traffickers. For example, Guatemala s Petén province is rural and largely indigenous, two variables that negatively correlate with violence elsewhere in the country. But it is also a major drug trafficking zone, where jungle landing strips provide easy access to the Mexican border. Consequently, it has the highest murder rates in the country. Other provinces have the misfortune of containing key trafficking ports, such as the provinces of Atlántida in Honduras, Sonsonate in El Salvador, Escuintla in Guatemala and Michoacán in Mexico. Honduras has the unfortunate distinction of having the fastest growing murder rate in the region, which may be associated with its increased use of the country as landing site for cocaine-laden aircraft from Colombia and the Bolivarian Republic of Venezuela. It also hosts the province with the single highest murder rate in the region: Atlántida, where one out of every 1000 people was murdered last year. The capital of Atlántida is La Ceiba, a wellknown cocaine trafficking port, and the site of clandestine landing strips. 25 As mentioned above, in December 2009, General Aristides Gonzalez, director general of the national office for combating drug trafficking, was murdered. The General had gone on a campaign against the unauthorised airports found across the country, some of which are said to be linked to the Sinaloa cartel. Just before his murder, he had seized a major strip and threatened to take action against all property owners on whose land the strips were found. Some have argued that the violence in Mexico is tied to the Government s efforts to stop the drug trade, not the drug trade itself. While it is true that enforcement can create instability in drug markets that can lead to violence, enforcement in countries like Guatemala is much weaker, and the murder rate is at least four times higher. In addition, most Case studies of transnational threats 257
264 Regions under stress Fig. 203: Murder rate trends in mexico and Central America (per 100,000 inhabitants), El Salvador 70 Guatemala Honduras Mexico murders per 100, Source: UNODC International Homicide Statistics of the deaths in the cartel wars are of cartel members themselves, fighting over trafficking routes. These groups have shown their willingness to diversify into other areas of crime, and recent losses in cocaine revenues seems only to have intensified the violence. A policy of appeasement is impractical: these people, and corrupt officials who support them, cannot be allowed to remain in place. The treatment is painful, but the alternative is to lose the patient itself. they face are fuelled by a cocaine trade that runs the length of the region. Mexico s killers are armed largely by weapons trafficked from the north, but also from the south. Dealing with these threats will require both national institution building and a global strategy to address the relevant trafficking flows. This may sound like an exaggeration, but many who have worked closely with law enforcement in the region concur. In December 2008, the head of UN CICIG said, If the Guatemalan authorities are unable to stop the infiltration of Mexican drug cartels, in two years they could take over Guatemala City. 26 President Colom has issued a series of state of prevention orders in response to the violence in which constitutional liberties are restricted for a period of time in certain parts of the country, and there have been a series of attacks against labor union leaders, environmentalists, and human rights defenders. 27 While Guatemala appears to be the most affected, its problems are not unique, and the stability of all countries in this region requires that transnational organized crime be controlled. To do this, the states need support in strengthening local law enforcement and governance. But even more important, they need the assistance of the international community in addressing the transnational flows affecting their countries. The drug wars 258 TRANSNATIONAL ORGANIZED CRIME THREAT ASSESSMENT
265
266
267
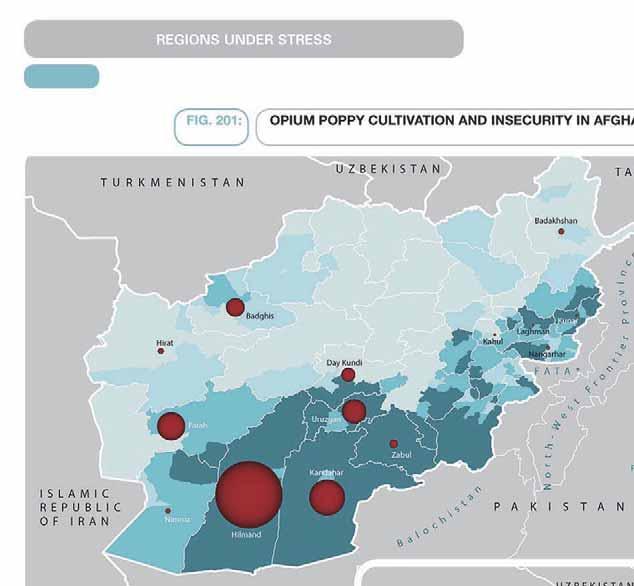
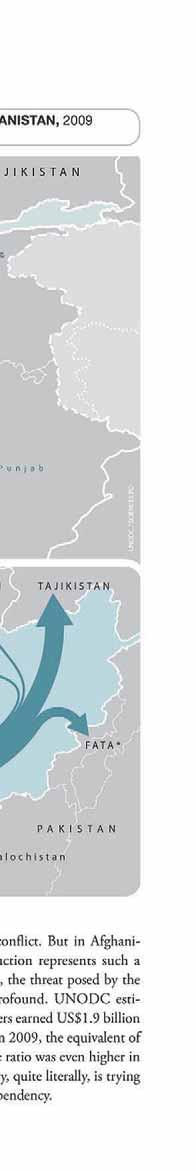
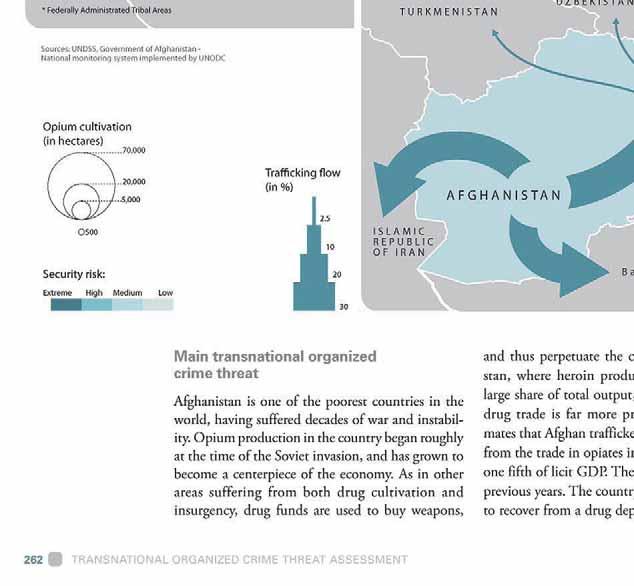
268
269 11 Afghanistan has dominated the worldwide opium market for more than a decade and 2009 was no exception as overall opium production in the country now stands at 6,900 metric tons, or 95% of global supply. The impact extends beyond Afghanistan itself, affecting neighbors with stability issues of their own. An estimated 375 tons of Afghan heroin are trafficked worldwide via routes flowing into and through the neighboring countries of Pakistan (150 tons), the Islamic Republic of Iran (105 tons), and the Central Asian countries of Tajikistan, Uzbekistan and Turkmenistan (95 tons). 28 Most of the drugs are bound for the lucrative markets in Europe and the Russian Federation, but drug use in the region is rising. The heroin trade is controlled by well-established trafficking networks of various sizes in cooperation with corrupt officials with a range of international connections. 29 Some of the larger traffickers and corrupt officials may launder their money internationally, particularly in the nearby financial hub of Dubai. Despite robust efforts by Dubai authorities, 30 the Emirate s proximity to Afghanistan, the presence of an important South Asian diaspora and large informal financial systems leave Dubai particularly vulnerable to exploitation by criminal gangs and, possibly, terrorist groups. In Afghanistan, where 80 to 90% of the economy is still informal, the hawala system of money transfer remains prevalent: money is paid to a network s representatives in one country, and this broker authorizes the same amount to be paid out in another. All this occurs outside the formal banking system, and this allows criminal funds to be transferred without risk of encountering official controls. 31 Narcotics make up a significant portion of this informal economy. 32 Research by UNODC in 2006 suggested that 60% of fund transfers in Afghanistan were drug related, while an estimated 80 to 90% of the hawala dealers in Kandahar and Hilmand provinces were involved in drug money transfers. 33 An estimated US$5 to US$6 billion were transferred to and from Afghanistan in 2004 and 2005, through hundreds of hawala markets around the country. 34 The smuggling of the chemical precursors needed to make heroin from opium is also a big business. Around 13,000 tons of chemical precursors, including the crucial acetic anhydride, are needed each year to produce heroin from Afghan opium. There is no licit use for these chemicals in Afghanistan, so they have to be diverted from legal shipments from a wide range of sources around the world. In the metric tons FIG. 202: OPIUM PRODUCTION IN MAJOR PRODUCING COUNTRIES (MT), span of a decade, the price of acetic anhydride in Afghanistan has shot up from US$24 per litre in 1998 to US$ per litre in 2008, either due to more effective interdiction or increased demand. The concentration of processing in Afghanistan should make it easier to interdict chemicals like acetic anhydride, but current seizures comprise less than 1% of what is believed to be imported into the country. 35 Although opium is Afghanistan s most notorious crop, the hashish trade has also grown in recent years, and total production today may rival that of Europe s traditional supplier, Morocco. All of Afghanistan s neighbors are reporting increases in cannabis seizures, 36 and cannabis production has been reported in 20 of Afghanistan s 33 provinces. 37 With entrenched smuggling networks, widespread insecurity and a drug-based economy, Afghanistan is ideally placed to become a major player in the global hashish market. In 2008, a single seizure in Kandahar province netted an astonishing tons of hashish with a regional wholesale value of US$400 million. 38 In terms of sheer volume, this was the largest drug seizure in history. Stability/governance situation Afghanistan has suffered from more than thirty years of conflict beginning with the Soviet invasion of Afghanistan (1979), a war which would last ten years, cost more than a million Afghan lives, and destroy most of the country s economy and infrastructure. Civil strife and warlordism followed the Soviet withdrawal (1988), so that many welcomed the arrival of the Taliban in They ruled over most of the country until the events of September 11, 2001 and the international coalition s interven- Myanmar Afghanistan Case studies of transnational threats 263
270 REGIONS UNDER STRESS tion in Afghanistan. Eight years afterward, conflict remains a central part of life in the country. Afghanistan is one of the least developed countries in the world in terms of most human development indicators. Governance is weak. The writ of the central Government is weak and overtly challenged, or indeed supplanted, in many parts of the country by anti-government elements. The Afghanistan NGO Safety Office (ANSO) estimates that insurgents control or exert effective influence over nearly half of Afghanistan. As the de-facto government in some areas, the Taliban s system of taxation and shadow tribunals also provides the only form of criminal justice and security. As unrest spreads to once stable areas, international agencies are being forced to scale back aid delivery. Governance in the provinces is dependent on the leadership and integrity of the individual governors and on the local security situation. Corruption is endemic both at a low level (among border guards and police), as well as among senior officials. 39 A recent UNODC survey estimated that Afghans paid upwards of US$2.5 billion in bribes and related payments in Corruption is also rife along trafficking routes all the way from Afghanistan to the destination markets of Europe and the Russian Federation. In terms of casualties, 2009 was the deadliest year yet for coalition forces fighting the insurgency, with 520 troop deaths, up from 295 in In August 2009, NATO forces in Afghanistan lost 77 troops, setting a new monthly record. Civilian casualties rose by 14% in 2009 compared with 2008 and were the highest they have been since Nearly 70 percent of the more than 2,400 civilian deaths were reportedly caused by insurgent attacks. Although the number of suicide bombings stayed nearly the same (141), the average number of attacks rose by 30 per cent (from 741 per month in 2008 to 960 per month in 2009) according to the United Nations Assistance Mission to Afghanistan (UNAMA). Insurgent-led insecurity is no longer confined to southern and western Afghanistan, as even the once relatively calm northern areas bordering Tajikistan have seen anti-government elements resurfacing. This is particularly true in Kunduz province where the Taliban have steadily staged a resurgence and now appear to threaten a vital NATO supply line. Violence spilled over the border into Tajikistan in 2009, with a number of clashes reported between Tajik security forces and Al-Qaida linked groups. A number of related incidents have also been reported in Kyrgyzstan and Uzbekistan, perhaps indicating a regional destabilization strategy on the part of militants. The Pakistan-Afghanistan border is currently one of the most critical regions in terms of insurgency and terrorism. From bases in Pakistan s tribal areas, militants launch incursions across the border into Afghanistan but also increasingly into adjacent Pakistani districts/provinces. Once unheard of in Pakistan, suicide bombings now occur with grim monotony: there were 87 suicide attacks in 2009, up nearly 40% from the previous year (and only 6 in 2006). Violence by Al-Qaida-linked Pakistani groups such as the Tehrik-e-Taliban Pakistan (TTP), previously confined to the Federally Administered Tribal Areas (FATA), has continued to spread to the settled districts of the North-West Frontier Province (which sustained 60% of all suicide attacks in the country in 2009), coming to within 100 kilo meters of Islamabad last winter. Linkages between TOC and stability threats There is a symbiotic relationship between drug traffickers and the insurgency in Afghanistan, and both groups have an interest in prolonging the instability. It is no coincidence that in 2009, 99% of all opium produced in Afghanistan came from seven provinces in the south and west, where government control was weakest. 40 Drug traffickers focus on regions controlled by the Taliban and other anti-government forces. The insurgent groups profit from taxing illicit trade and some receive donations from criminals and warlords. Opium is even used as a currency to purchase weapons, vehicles, and manpower. Taliban insurgents earn at least US$125 million annually from the opium economy through taxation of cultivation, production, and trafficking. 41 This figure does not include income from other drug-related activities in which they might be engaged. This figure is small compared to the overall value of the drugs trafficked, but its impact on the security of Afghanistan is direct and immediate. There have even been reports of joint operations between drug traffickers and insurgent groups, transferring opium or heroin to major dealers on the Afghanistan/Pakistan border and sharing the profit. 42 There is also some evidence to suggest that insurgent groups provide protection for heroin processing facilities within Afghanistan. 43 The opiate trade and insurgent activity overlap to such an extent that some law enforcement actions are both counter- 264 TRANSNATIONAL ORGANIZED CRIME THREAT ASSESSMENT
271 11 narcotics and counter-insurgency simultaneously. This was apparent in 2009, when Afghan-led military operations in Hilmand province netted millions of dollars worth of poppy, precursor chemicals, weapons, and ammunition. 44 Although opium poppy is the highest-value drug on regional markets, cannabis also likely contributes to insurgent funding. 45 Borders, particularly with Pakistan, still require substantial strengthening, and the rise in volumes of goods traded across these borders provides opportunities for both traffickers and insurgents. The Afghan Trade Transit Agreement (ATTA), designed to promote free trade between Pakistan and Afghanistan, is being abused by groups illicitly trafficking all kinds of goods, including precursor chemicals. The total estimated value of opiate trafficking in Pakistan is around US$1 billion per year. Drugs trafficked into Pakistan that pass through its Federally Administered Tribal Areas (FATA), travel through territory that is under the influence of the Tehrik-e-Taliban Pakistan and other Al-Qaida linked groups. Taliban-style taxation systems have been reported in these regions as well. 46 In southern Tajikistan, the porous border with Afghanistan is crossed by traffickers but also militants linked to the Islamic Movement of Uzbekistan and other Al- Qaida linked groups. 47 The estimated value of opiates trafficked through Central Asia is around US$ million and increases as opiates travel northward towards the Russian Federation. On Afghanistan s western front, the Islamic Republic of Iran has suffered greatly from the influx of Afghan opium. It has the highest level of opium consumption in the world. Drug trafficking is considered such a major security threat that the Government has spent over US$600 million to dig ditches, build barriers and install barbed wire to stop well-armed drug convoys from entering the country. More than 3,500 Iranian border guards have been killed in the past three decades by drug traffickers. member of the judiciary has become a dangerous profession. For example, Chief Judge Sher Gul was murdered by insurgents in Khost province in August 2008 while Judge Alim Hanif, who headed the Central Narcotics Tribunal Appeals Court in Kabul, was murdered in September Widespread corruption, violence, and impunity have undermined the confidence of the Afghan people in their government, further strengthening the hand of the insurgents. Indeed, a portion of the Afghan Taliban are non-ideological, more opportunistic fighters motivated by a mixture of political discontent and financial need. As the insurgents and criminals grow stronger, they are better able to sow more violence and corruption, and recruit among the disenfranchised. There was little indication that this vicious circle would be broken soon, but there is hope that recent political developments will alter the course of events. At present, various insurgent groups now control large swathes of the Afghan countryside, preventing aid from reaching some of the most vulnerable communities. At the same time, insurgents are able to carry out brazen terror attacks in major population centers, such as recent operations in Kabul. Instead of focusing on the development needs of the Afghans, international aid is tied up in the eighth year of fighting the insurgency. Given the transcontinental dimensions of the Afghan heroin trade and the difficulties in combating drug trafficking in the context of an active conflict, internationally coordinated action against the global heroin market is vital. In addition to funding insurgency, the drug trade is fueling corruption. Afghanistan seized less than three tons of heroin in 2008 while about 375 tons were estimated to be trafficked out of the country, a seizure rate of less than 1%. This appears to reflect high levels of corruption among border guards and police, as well as collusion with transportation companies. In addition, few drug traffickers are ever brought to justice, and some of those that have been convicted have been pardoned, suggesting higher level corruption as well. At the same time, being a Case studies of transnational threats 265
272
273
274 REGIONS UNDER STRESS Main transnational organized crime threat South-East Europe has long been a transit zone for east-west commerce, both licit and illicit. The impact of organized trafficking became particularly profound after the Cold War ended and Yugoslavia dissolved. During this time, organized criminals forged connections with some commercial and political elites that continue to have ramifications to this day. As a result, organized crime in this region is generally exceedingly well organized, and contraband moves through the region with very little resistance from law enforcement. This arrangement lacks the kind of confrontational violence currently seen in other countries, but it has had long-term implications for the integrity and stability of the state. In modern times, the key illicit commodity trafficked has been heroin. The end of the Cold War also saw an increase in trafficking in women for the purposes of sexual exploitation from Eastern Europe to Western Europe, as well as a good deal of assisted illegal migration. During the Yugoslav wars, all manner of materiel was trafficked, and cigarettes were a particularly important source of funds for the conflict. After the wars ended, much of this activity declined, but trafficking, especially of heroin, remains an issue. About 80 tons of heroin, worth some US$20 billion at retail level, is smuggled through South-East Europe on its way to Western Europe each year. 48 Very little of this flow is seized in South-East Europe, and, while the precise routes have varied a bit over time, this general flow has remained unchanged over the years. Aside from ferrying heroin through the region, Balkan criminals have played a strong role in heroin markets in West Europe, especially during the war. This role appears to be declining since that time, however. For example, in 2000, ethnic Albanians were said to control 70% of the heroin market in Germany, among other countries. 49 Between 2000 and 2006, the number of Albanian heroin trafficking suspects identified in Germany declined by a factor of five. The German 2009 Organized Crime Situation Report discusses organized crime groups of nine different foreign nationalities. 50 Albanians, and Balkan groups in general, are pointedly not among them, and they are no longer singled out in official reports on the heroin situation. 51 Italy remains one key heroin consumer market where Albanians play an important role, but, in 2008, only 6% of heroin traffickers arrested in Italy were Albanian. This decline in Balkan participation can be seen in other criminal markets as well. At one stage, women from South-East Europe and Eastern Europe (often trafficked via South-East Europe) were clearly predominant among human trafficking victims in West Europe, but this appears to have changed. For example, in the late 1990s, Albania was a predominant source of victims. In 1996, about 40% of the victims of trafficking for sexual exploitation detected FIG. 203: HEROIN SEIZURE LOCATIONS AND VOLUMES (KG) REPORTED, BY CITY, United Kingdom Netherlands Belgium Germany Poland Belarus UNODC / SCIENCES PO Czech Republic Ukraine Slovakia France Switzerland Austria Hungary Slovenia Croatia Romania Bosnia and Herzegovina Serbia Spain Italy Montenegro The FYR Macedonia Albania Greece Bulgaria Turkey Non-reporting countries > 1000 kg kg kg Algeria Tunisia 750 km Syrian Arab Republic Sources: UNODC and World Customs Organization 268 TRANSNATIONAL ORGANIZED CRIME THREAT ASSESSMENT
275 11 FIG. 204: NUMBER OF ALBANIAN HEROIN TRAFFICKING SUSPECTS IDENTIFIED IN GERMANY 52, FIG. 205: SHARE OF HUMAN TRAF- FICKING VICTIMS DETECTED IN ITALY WHO WERE ALBANIAN, per cent Source: Bundeskriminalamt Source: Anti-mafia Bureau and Project WEST in Italy were Albanians. This percentage dropped to 22% in and 13% after And Italy is the one country where Albanian victims are most prevalent: of some 10,000 human trafficking victims detected in Europe and reported to UNODC over the period 2005 to 2006, only 56 (about half a percent) were Albanian. 53 A similar situation can be seen with victims from the Russian Federation, Ukraine and the Republic of Moldova. Today s human trafficking victims come from a much wider variety of locations, many of them much further afield. The trade in counterfeit cigarettes was once a mainstay of the belligerent parties, even a key source of funding to certain national governments, and it remains an important issue. But as far as stability in the region is concerned, the biggest crime problem facing South-East Europe is domestic: fraud and corruption involving some government officials and their network of private sector partners. This corruption is fuelled by complicity in the heroin trade and other trafficking activities. The region has moved on from the chaos of wartime to a period of transition, where opportunities in a rapidly growing FIG. 206: ECONOMIC GROWTH IN THE BALKANS, Economic growth (%) Albania Bosnia & Herzegovina Bulgaria Croatia FYROM Moldova Montenegro Romania S erbia -6 Source: World Economic Outlook, IMF, April Case studies of transnational threats 269
276 REGIONS UNDER STRESS Cosa Nostra and heroin trafficking From the mid-1970s until the early 1990s, Cosa Nostra threatened the national security of a G-8 country from within as no other criminal group has done in the western world. The cause of this confrontation was heroin, and the threat was only resolved through dedicated and decisive law enforcement action. Rooted in Sicily and in the Italian communities abroad, Cosa Nostra reigned as the paramount Italian organized crime group for decades, synonymous in the public imagination with the mafia. It existed long before its rise to prominence, expanding to fill a governance vacuum during the process of Italian unification. Without formal structures to mediate transactions and resolve disputes, informal structures emerged, including those that would evolve into today s mafia. i During its early years, Cosa Nostra assumed a low profile, opting, for example, not to carry out abductions in Sicily because of the attention these received in the media. Until 1980, there was serious debate as to whether the organization really existed. ii This all changed when the Cosa Nostra families became involved in the international heroin trade. In the mid-1970s, Cosa Nostra took over heroin trafficking from groups operating out of Marseilles. Opium was transported directly from Asia to Sicily, where it was refined into heroin and trafficked into US markets. iii In the USA, the heroin was distributed countrywide through a network of pizzerias. From 1975 to 1984, this pizza connection supplied about one third of the entire US market and 80% of the heroin consumed in the country s north-east. iv With the introduction of transnational heroin trafficking, a provincial racket was transformed into an international business with massive profits, and into a threat to the stability of the country. There are at least four ways Cosa Nostra posed a threat to state stability in Italy: By dramatically increasing the murder rate; By mobilizing votes for sympathetic politicians; By assassinating public officials who opposed them; and By perpetrating quasi-terrorist attacks outside Sicily. With regard to murder, the control of drug routes was the central cause of a mafia war, which ran between 1981 and Much to the ire of the other families, just a few in particular the Bontade and Inzerillo families were well positioned to control the primary trafficking nodes. The fight over this key territory left some 1,000 people dead, giving Palermo a murder rate three times the national average in The end result was the dominance of one family the Corleonesi in the Sicilian heroin trade. v The rise in violence produced political backlash, which the mafia combated with its influence and drug money. Cosa Nostra was able to direct tens of thousands of votes and used this power to gain a margin of impunity. Pointing at the close relationship between some public representatives and the families, Judge Giovanni Falcone commented in 1987 that: this convergence of interests with the mafia is one of the most important causes of the growth of Cosa Nostra and of the difficulties encountered in addressing its criminal manifestations. vi A number of those who could not be influenced were killed. From 1960 to 1974, at least eight public officials were murdered. During the peak of the heroin trade, between 1975 and 1985, Cosa Nostra killed at least 20. Among these were the president of the Sicilian Region, the head of the Communist Party in Sicily, the Palermo chief prosecutor, the local police chief and the Prefect of Palermo. Investigation into the heroin trafficking led to the prosecution of all major members of Cosa Nostra in the Maxi-Trial, involving about 500 people in Palermo and around 30 in New York. In January 1992, most of the indicted were sentenced to life imprisonment. Between the time the first Maxi-Trial convictions were announced (1987) and August 1992, the violence against the authorities escalated. Five magistrates and many officers and activists were murdered by Cosa Nostra. Among these were the judges Falcone and Borsellino, the masterminds behind the Maxi-Trial, who were assassinated in two separate bomb attacks. These murders prompted the stationing of 7,000 troops in Sicily. After the arrest of Salvatore Riina, head of the Corleonesi family, in 1993, the bombing campaign grew increasingly random. In May, a bomb in Rome failed to kill a prominent news anchor, known for his anti-mafia campaigns. That same month, the Uffizi Museum in Florence was bombed, killing five people. In July, a bomb in Milan killed five people. In the same month, two bombs exploded simultaneously in Rome, targeting two major churches. Don Puglisi, an anti-mafia priest, was killed in Palermo in September. In January 1994, Cosa Nostra attempted to kill hundreds of people during a football match in Rome, but the bomb they planted at the Olympic Stadium failed to explode. After 1994, the attacks stopped, and most of the major mafia chiefs have now been arrested. This progress was made possible because of the participation of Sicilian civil society, supported by the national authorities. Nowadays, the other Italian mafia groups, Ndrangheta and Camorra, appear to be more prominent than Cosa Nostra. This does not mean the Sicilian mafia activity has stopped, however. Cosa Nostra still plays a role in the US drug market in at least 19 cities. Matteo Messina Denaro, believed to be the paramount reigning boss, remains at large. vii But Sicily itself is not a drug transit zone anymore and the homicide CHRONOLOGY OF MAFIA-RELATED EVENTS IN SICILY 1980 Homicide rates in Palermo (per 100,000p) Homicide rates in Italy (per 100,000p) Mafia War Arrests, Trials in Italy and USA Maxi Trial Appeal and 3rd instance Sources: ISTAT, Homicide Statistics, and Saverio Lodato, Trent anni di Mafia. Jan-July 1992 Final Convictions July-Dec 1992 Troops & Hard Prison Regime 1993 Arrest of Riina (Jan) present Arrest of other corleonesi and major bosses 270 TRANSNATIONAL ORGANIZED CRIME THREAT ASSESSMENT
277 11 COSA NOSTRA, Milan 1993 Number Assassinations of public figures/officials Terrorist activity around 20 economy and the possibility of European integration may prove more attractive than criminal rackets. Of course, renewed political conflict could change all this, as could the sudden downturn in the economy. 100 km 5 Florence Year or period of the attacks Rome Sacra Corona Unita Bari APULIA Naples Taranto CAMPANIA Camorra CALABRIA The stability/governance situation Many of the states in South-East Europe are recent creations, and new institutions are still consolidating. The simultaneous stresses of the transition from communism to free markets and the conflicts associated with the dissolution of the former Yugoslavia placed tremendous pressure on the region. It is still recovering from this difficult period. Heroin to the USA ALGERIA Sources: UNODC Tunis TUNISIA Palermo SICILY Cosa Nostra Valletta MALTA Ndrangheta Messina Reggio Calabria Catania Opium from Asia During the Yugoslav wars, all sides depended on smugglers. For the rump Yugoslavia, oil was essenrate in Palermo (0.6 per 100,000 inhabitants) today is one of the lowest in Europe. viii The history of Cosa Nostra shows what can happen when an under-governed region meets a lucrative transnational trafficking flow, but it also demonstrates how, with political will, public support, international cooperation, and sufficient resources, even the most powerful gangsters can be brought to heel. The heroin trade that ignited a long period of violence in Italy is still strong and going through other regions, sometimes with consequences worse than those suffered in Italy. Addressing criminal groups can be of great benefit to individual states, but to deal with a problem of international dimensions, collaborative efforts to treat the entire trafficking flow are needed. i Paolo Borsellino, Lezione sulla Mafia, lecture in Bassano del Grappa, 1989; Antonio Gramsci, Alcuni Temi sulla Questione Meridionale, ii Giovanni Falcone, Marcelle Padovani, Cose di Cosa Nostra, Biblioteca Universale Rizzoli, iii Ibid., Saverio Lodato, Trent Anni di Mafia, Saggi, Biblioteca Universale Rizzoli 2006; John Dickie, Cosa Nostra A history of the Sicilian Mafia, Coronet Books, iv Giovanni Falcone, Marcelle Padovani Cose di Cosa Nostra Biblioteca Universale Rizzoli, Time Magazine Busting a pizza connection 23 April John Dickie, Cosa Nostra A history of the Sicilian Mafia, Coronet Books, v Pino Arlacchi, Addio Cosa Nostra - la vita di Tommaso Buscetta, Rizzoli, 1994; John Dickie, Cosa Nostra A history of the Sicilian Mafia, Coronet Books, 2004; Giovanni Falcone, Marcelle Padovani, Cose di Cosa Nostra, Biblioteca Universale Rizzoli, vi Final sentence of the Maxi-Trial first instance, 17 July vii Magazine S, Ho visto Messina Denaro, August viii BRA, Crime Statistics 2008; HEUNI, Criminal Justice Systems in Europe and North America, Finland, UNODC / SCIENCES PO Unrest between rival ethnic groups in the Socialist Federal Republic of Yugoslavia began in 1990, just as communism was collapsing across Eastern Europe. Slovenia was able to secede in a relatively short 10-Day War, and the former Yugoslav Republic of Macedonia was allowed independence without challenge. But the struggles in Bosnia and Croatia were much more protracted, extending until 1995 and involving serious war crimes. These wars were followed by a conflict in Kosovo until 1999, and within the Former Yugoslav Republic of Macedonia in These conflicts have yet to be entirely resolved. Bosnia and Herzegovina remains under international supervision, and tensions between the Federation and the Republika Srpska have run high. Kosovo (Serbia) still hosts a large international peacekeeping force and states are divided on the question of its final status. The global financial crisis, which has had an especially negative impact on institutions investing in the Balkans, threatens the progress that has been made. Linkages between TOC and stability threats Organized crime has played a direct role in enabling conflict in the region and continues to play a role in perpetuating the residual instability. Under communism, organized criminal figures linked to the various national secret services smuggled consumer goods and performed other needed services that the state could not directly perform. These skills would prove invaluable during the conflict period, when evading sanctions was essential for all the antagonists. They were also useful in navigating the privatization process, where entrepreneurial instinct and informal pressure played a key role. Case studies of transnational threats 271
278 REGIONS UNDER STRESS tial; for other parties, weapons and other materiel. Many traffickers sold to both sides in the conflict. Some factions relied on trafficking as a source of funding. Smuggling cigarettes to the region and into Western Europe was one important money spinner, and heroin was another. Criminal activities extended beyond the region into the extensive Balkan diaspora in Western Europe and throughout the world. Even more directly, organized criminals were often among the antagonists, deployed in volunteer brigades or paramilitaries or even as commissioned officers of the warring factions. These groups were responsible for some of the worst atrocities of the war. One of the key objectives was to cleanse disputed areas of rival ethnicities, and for this, authorized criminals were often more effective than a military approach. Rape camps were organized, making use of female prisoners of war, 55 and trafficking in women for the purposes of sexual exploitation continued to be an issue even after the peacekeepers arrived. 56 In these ways, organized crime became an instrument of war. War and privatization took place simultaneously, and organized criminals were well placed to take advantage of this process. 57 Once the war in Yugoslavia began to cool, another front opened up. In 1997, the economy and government of Albania collapsed when a series of nationwide pyramid schemes ran insolvent. Around this time, fighting began between ethnic Albanian Kosovars and the forces of the Federal Republic of Yugoslavia and this continued through to The Kosovo Liberation Army received weapons looted from the armories of Albania and support from the Albanian diaspora community. It also drew funds from heroin trafficking, making use of diaspora networks in Italy, Switzerland, and elsewhere in Europe. In 2001, ethnic Albanians in the Former Yugoslav Republic of Macedonia rebelled, a move that some have said was motivated more by criminal interests than political ones. During the conflict, Albanian traffickers enjoyed a great advantage in the heroin market, due to chaos in their home areas and large diaspora populations in several key destinations, including Italy, the second-largest heroin market in Europe. They were also highly motivated, since they were engaged in a civil war. When the war ended and a moratorium was imposed on speedboat traffic between the two countries, these traffickers lost their privileged position. Their declining participation in West European heroin markets can be seen in declining arrest and seizure figures, as noted above. It can also be seen in the decline of their traditional allies in Italy, the criminal group Sacra Corona Unita. Without these organized criminal activities and the funds they provided, the wars could have been much shorter, and the parties quicker to come to the negotiating table. Having penetrated government and business, criminal elites applied the techniques of organized crime, such as assassination, in politics and commerce in the immediate post-conflict period. The most spectacular example of this was the assassination of Serbian Prime Minister Zoran Đinđić in 2003 by organized crime figures who had managed to infiltrate the security services. This led to a major crackdown in Serbia and sent a message through the region that tolerance of organized crime was not sustainable. The situation in South-East Europe has moved on considerably since that time, due in part to intensive attention by the European Union. Much work has been done on building institutions and supporting regional governments in making progress toward the goal of European integration. But instability remains a threat in some areas. Much of the remaining tension in the region is tied to the interests of rival strong men seeking to protect their fiefdoms, including the right to control criminal rackets. Of these, heroin trafficking routes are among the most lucrative. So long as powerful people remain involved in illicit activities, they will retain an interest in keeping the region off balance. They will also maintain the funds and the manpower to promote instability if it suits their interests. In addition to supporting peace and stability in the region, international cooperation on Balkan organized crime remains a priority because of the global dimensions of this activity. In particular, the huge flow of heroin that continues to go through the region is a matter of serious concern, and, more recently, Balkan criminals seem to be expanding their role in the European cocaine trade. The countries of South-East Europe do not have the means to stop these multi-billion dollar drug flows on their own. 272 TRANSNATIONAL ORGANIZED CRIME THREAT ASSESSMENT
279
280 REGIONS UNDER STRESS metric tons Main transnational organized crime threats Afghanistan has not always been the world s largest heroin producer. The title once belonged to Myanmar, which, from the 1980s until the 1990s, was the primary supplier to North America. 58 It remains an important producer for the region, including Thailand and China. Opium production has been largely concentrated in the Shan State, the area of the country also most affected by insurgency. FIG. 207: OPIUM PRODUCTION IN MYANMAR, ,000 1,500 1, ,621 1,728 1,660 1,791 1,583 1,664 1,760 1,676 1, ,087 1, Source: UNODC, World Drug Report 2009, and UNODC, Opium Poppy Cultivation in South East Asia, December FIG. 208: INDIA BANGLADESH MAJOR METHAMPHETAMINE TRAFFICKING ROUTES OUT OF MYANMAR MYANMAR Yangon Expanded trafficking routes Emerging trafficking routes Bangkok Traditional trafficking routes LAO P.D.R. Vientiane THAILAND CAMBODIA Phnom Penh CHINA Hanoi VIET NAM UNODC Source: UNODC, ATS Trafficking Route Information and Select Seizures and Production Facility Seizures in East Asia and the Pacific, February 2007 Indeed, Myanmar s declining role in global heroin markets is directly tied to the defeat of a key insurgent group. The Mong Tai Army, a separatist rebel group headed by the drug warlord, Khun Sa, was defeated in It controlled more than 70% of the heroin trade in the Golden Triangle at that time. 60 The implementation of a number of peace agreements with the various ethnic rebel groups operating across the Shan State, some alternative development efforts in combination with Chinese pressure put on several of the ethnic groups in the eastern parts of Myanmar, led to massive declines in opium production. As a result of these efforts, over the period, the area under poppy cultivation fell from 163,000 ha to 21,500 ha, a decline of 87%. The Kokang region, bordering China, became opium poppy free in The Wa region, also bordering China, was once the largest opium producing area of Myanmar, but it became poppy free in The other main opium production region, the North Shan State, which also borders China, reduced the area under poppy cultivation by 99% between 2003 and By 2008, Myanmar accounted for only 5% of the world s total opium production, down from 30% in Since 2006, cultivation has again increased, however, reaching 31,700 ha in 2009, but this is still much lower than 10 or 20 years ago. The South Shan State, bordering Thailand, is currently the largest opium producing area, followed by the East Shan. These two areas accounted in 2009 for around 90% of Myanmar s total area under poppy cultivation. Since the late 1990s, partly in parallel to the massive declines in heroin production, methamphetamine production increased in the country, particularly in the regions where opium production declined. The territory controlled by the United Wa State Army (UWSA), the largest militant group, has been identified by both US and Thai sources as a major producer of methamphetamine, as well as territories controlled by the Shan State Army-South (SSA-S) and territories controlled by various groups inside the ethnic Chinese Kokang autonomous region. 61 The number of arrests made for synthetic drug trafficking in Myanmar has already started to approach those made for heroin. The authorities in Myanmar dismantled 16 synthetic drug laboratories and 24 heroin laboratories over the period. 62 These drugs are mainly destined for China and Thailand, though increasingly also affect other countries in South-East Asia (the Lao People s Democratic Republic, Cambodia and Viet Nam) as well as India. 274 TRANSNATIONAL ORGANIZED CRIME THREAT ASSESSMENT
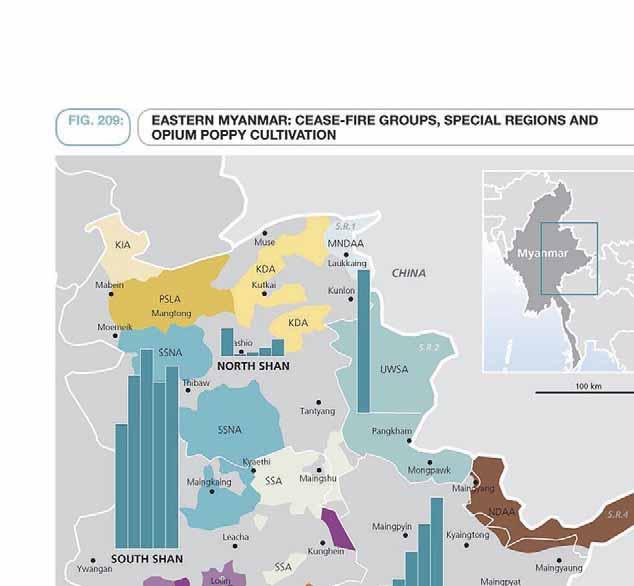
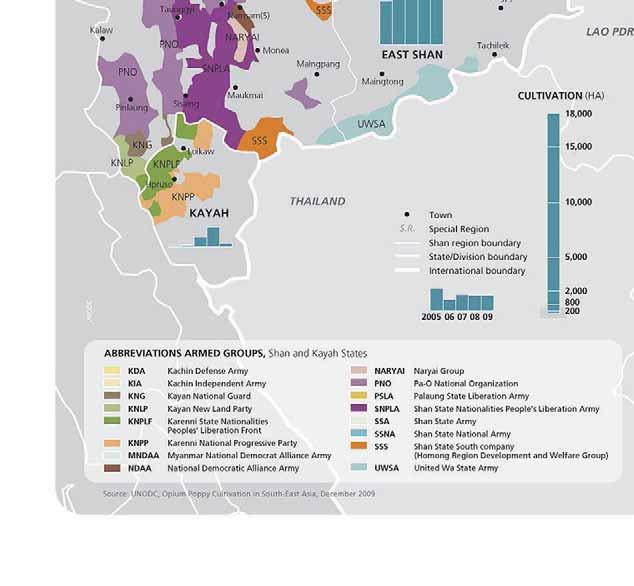
281
282 REGIONS UNDER STRESS Stability threat Myanmar is categorized as one of the Least Developed Countries and is the second poorest country in Asia. 63 It is also consistently rated as one of the countries most affected by corruption in the world, coming in third from the bottom in the Transparency International rankings in The country has been governed by the military since 1962, and at times more than 40 regional ethnic militias were engaged in armed conflict with the central authorities. This fighting drove some 140,000 ethnic minority refugees to camps in Thailand and displaced an even larger number within Myanmar. 64 In 1989 and subsequent years, a series of ceasefire agreements were concluded, mostly in exchange for some kind of local autonomy. A number of the ethnic groups, however, have continued their armed struggle or are in a position to take up the armed struggle at any moment. There were at least 16 different armed groups controlling parts of the Shan State and the Kayah State in The strongest seems to be the United Wa State Army (UWSA), controlling the Wa region, as well as some border regions in South Shan and East Shan. Another important group is the Shan State National Army (SSNA), controlling several parts in North Shan and northern parts of the South Shan. South Shan is the most contested province, and it is also the province with the highest levels of cultivation. Most of the smaller groups see opium as a key source for generating income to maintain their military power. Next to the SSNA, parts of the South Shan State are controlled by the Shan State Army (SSA), by the Shan State Nationalities People s Liberation Army (SNPLA), by the Shan State South company (SSS), by the Pa-O National Organization (PNO), the Shan State Kayan New Land Party (KNLP) and the Kayan National Guard (KNG). Groups controlling the Kayah State include the Karenni National Progressive Party (KNPP) and the Karenni State Nationalities Peoples Liberation Front (KNPLF). The Special Region 4 (S.R.4) is controlled by the National Democratic Alliance Army (NDAA). Links between TOC and stability threats Being isolated from other sources of income, many of the insurgent groups turned to taxing of drug production as a major source of revenue. In addition, they were also reported to tax timber, gems, and other black-market goods passing through the territories which they control. The survival of many of these groups seems to depend on the illicit drug business. The 330 tons of opium produced in Myanmar in 2009 generated around US$100 million in gross income for the farmers. 66 It is not possible to calculate the income earned by the drug traffickers, because there are no accurate data on heroin prices in the border regions. A very rough estimate would place heroin sales at around US$360 million in 2009, with a range of perhaps US$140 to US$500 million. Gross profits (income less amounts paid to farmers) would then be around US$260 million. 67 On this basis heroin sales would be equivalent to around 1.3% of the licit GDP of Myanmar. 68 This is much less than in Afghanistan. So while drug sales allow rebel forces to remain mobilized, the country as a whole is not dependent on them. Should the rebel forces need to become active again, they could very rapidly increase their drug income. Farmers in the region have the know-how to immediately exapand production if needed. One factor constraining yields in 2009 was the poor weather. If weather conditions had been the same as in 2008, the 2009 yield would have been 40% higher. The rebel groups could also become more actively involved in international trafficking if there were financial needs to do so, as Khun Sa s Mong Tai army had done. Short-term incomes in excess of one billion dollars would not be out of the question. But accessing this income requires international trafficking to foreign consumption markets, many of them located half a world away. Reducing the potential for violence in South-East Asia will require addressing the transnational heroin trade, ATS production and regional trafficking, as well as all the other illicit activities that fuel armed groups in the region. 276 TRANSNATIONAL ORGANIZED CRIME THREAT ASSESSMENT
283 11 Russian Federation United States of America West Central Europe South-East Europe Central Asia Caribbean Gulf area, Middle East West Africa Horn of Africa South-East Asia Andean region Central Africa East Africa Sources: UDCP/PRIO Armed Conflict Dataset version ; ICC International Maritime Bureau, Piracy and armed robbery against ships, Annual Report 2009; UN/UNODC Cocaine trafficking Main source countries High homicide rates linked to cocaine trafficking Heroin trafficking Main source countries Conflict resulting in 1,000 or more battle deaths in 2008 Conflict resulting in battle deaths in 2008 Area of instability with presence of UN peace missions UN regional peace mission Piracy off the Horn of Africa Trafficking from eastern Democratic Republic of the Congo Gold Cassiterite UNODC / SCIENCES PO THE IMPACT OF MINERALS SMUGGLING ON CENTRAL AFRICA Main TOC threat Type of threat: Areas mostly affected: Origin and destination of trafficking flows: Annual volume of main goods trafficked: Estimated value at the regional level: Criminal groups involved: Location of traffickers: Stability threats Type of threat: Areas mostly affected: Armed groups involved: Illicit exploitation/trafficking of minerals, particularly gold and cassiterite (tin ore) East of the Democratic Republic of the Congo, Rwanda, Uganda, Burundi, United Republic of Tanzania Origin: DRC; destination for gold: mainly United Arab Emirates; for cassiterite: Belgium (mainly), Thailand, UK, Rwanda Gold: 40 tons; cassiterite: unknown Gold: US$1.24 billion; cassiterite: some US$130 million (likely much higher) Mainly FDLR, ex-cndp; elements of FARDC Mainly eastern DRC; Rwanda and other Armed conflict, erosion of central authority North and South Kivu provinces of the DRC FDLR, ex-cndp, PARECO, Mai Mai groups Links between TOC and stability threats Nature of the link: Large illicit incomes for armed groups Impact of TOC on the stability threat: Armed violence, obstacle to peacekeeping Estimated trend: Increasing (gold); decreasing (cassiterite) Case studies of transnational threats 277
284 REGIONS UNDER STRESS Main transnational organized crime threat Unlike the other areas reviewed with insurgency problems, the problem in the Democratic Republic of the Congo (DRC) is not drugs, but the illicit extraction and smuggling of minerals. The DRC has tremendous mineral wealth, yet the Congolese are among the poorest people on earth, and they have grown poorer even as the value of their national assets has grown. One of the reasons for this apparent paradox is organized crime: the looting and smuggling of gold and other minerals by armed groups who have assumed control of parts of the country. And despite decades of peace efforts, the insurgent groups who benefit from these minerals do not appear eager to come to the negotiating table. Until the mineral trafficking is addressed, the prospects for peace will be seriously undermined. Insurgent groups in the eastern part of the country are arming themselves with money gained from illegal mining and mineral trafficking. The problem is an international one, with countries in the region serving as transit zones and wealthier nations as destinations for the contraband. Rwanda is particularly affected one of the key armed groups operating in the DRC is the ethnic Hutu Forces Démocratiques de Libération du Rwanda (FDLR) and the country is a key transit zone for trafficked minerals. 69 But the traffic also affects Burundi, Uganda and the United Republic of Tanzania. Prime destination markets include Belgium, the United Kingdom, the United Arab Emirates and Thailand. While coltan used to be the biggest source of income for armed groups in the eastern DRC, gold and cassiterite (tin ore) have now replaced it. Gold prices have increased steadily over the last decade, and demand has been stable at just below 4,000 tons per year. 70 US$ per tr oz (~31 g) US$ per ton FIG. 210: ,000 18,000 16,000 14,000 12,000 10,000 8,000 6,000 4,000 2, PRICE OF GOLD AND TIN, Price of gold, Price of tin, Source: World Bank Commodity Price Data Demand for tin increased in the mid-2000s, peaking at more than 363,000 tons per year in 2007, and prices increased accordingly. 71 However, as a result of the global economic downturn in 2008, both demand for, and the price of, cassiterite have decreased. It is too early to tell whether this will significantly impact on the groups profiting from the trade. While it is clear that armed groups are benefiting from supplying these markets, it is unclear how FIG. 211: OFFICIAL CASSITERITE EXPORT FIGURES FROM NORTH AND SOUTH KIVU (TONS), Jan-Sept Jan-Sept North Kivu 10,175 North Kivu 10,903 North Kivu 7,592 South Kivu 4,731 South Kivu 2,880 South Kivu 3,644 Total 14,906 Total 13,783 Total 11, TRANSNATIONAL ORGANIZED CRIME THREAT ASSESSMENT
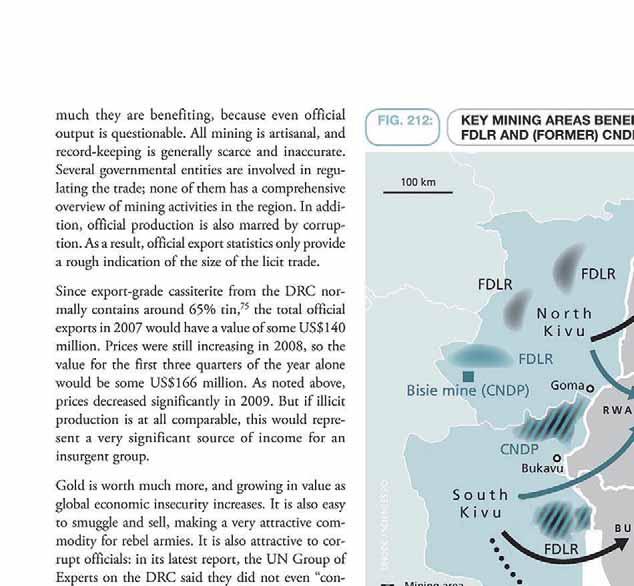
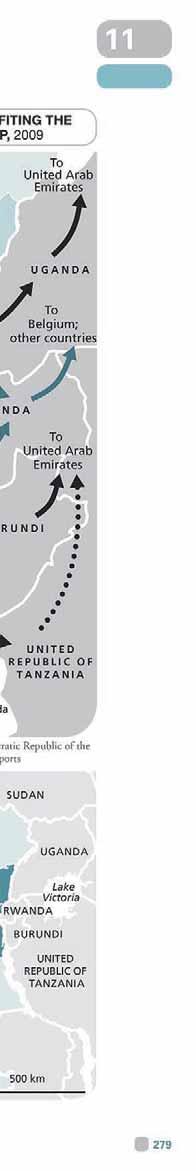
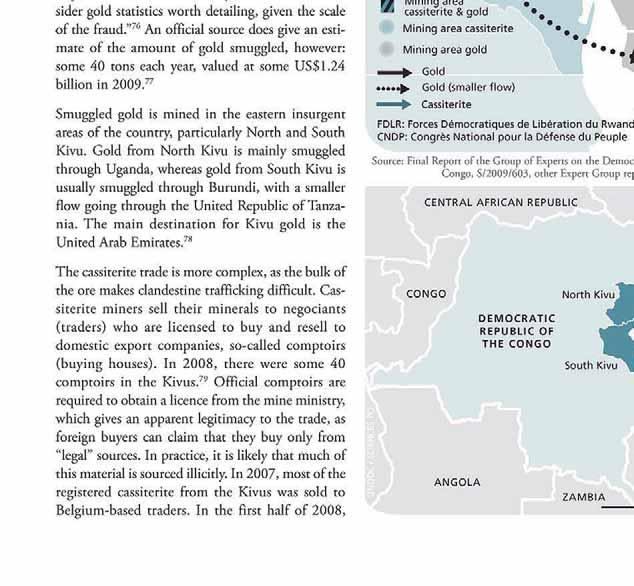
285
286 REGIONS UNDER STRESS FIG. 213: CASSITERITE FROM NORTH AND SOUTH KIVU, MAIN IMPORTERS BY COUNTRY OF REGISTRATION, ,000 9,000 9,294 8,000 7,000 6,000 5,000 4,000 3,000 2,000 1,000 2,135 1,623 1, Belgium Thailand United Kingdom Rwanda Malaysia Hong Kong, China India Austria China Netherlands Russian Federation Source: Global Witness, Faced with a gun, what can you do? War and the militarisation of mining in eastern Congo, July 2009, p. 60. traders in Canada, China, India and the Russian Federation increased their share. 80 The stability/governance situation The DRC is a country the size of Western Europe, sharing land borders with nine countries. Most Congolese today live within 100 kilometres of an international border and often have closer links with neighbouring countries than the central government. 81 The distance from Kinshasa to the Kivus is more than 1,500 kilometres, practically inaccessible given the lack of paved roads. The country has experienced serious governance problems since independence, including the 32-year dictatorship of Mobutu Sese Seko, during which infrastructure was allowed to decay. In 1994, ethnic Hutu militias in Rwanda attacked the country s Tutsi population, killing an estimated half a million people in about 100 days. When order was again restored, a large number of Hutus fled the country in fear of reprisals. Among them were militants, who continued to attack Rwanda. Some of these would evolve into today s Forces Démocratiques de Libération du Rwanda (FDLR). In 1996, the Rwandan and Ugandan militaries invaded the DRC, in order to defeat the Hutu and overthrow Mobutu Sese Seko. DRC politicians, who had wanted to depose Mobutu for some time, joined the offensive. In 1997, Laurent Kabila deposed Mobutu with the assistance of the Rwandan and Ugandan armies. In 1998, Kabila broke with his allies, who refused to leave the country, so both backed new militia groups. Although the conflict formally ended in 2003, 82 the eastern part of the country particularly North and South Kivu is still experiencing armed conflict. While there are several underlying issues, 83 profits from illegal minerals are funding armed groups and thus perpetuating insecurity. Following a serious escalation of fighting 84 in North Kivu in the second half of 2008, the political situation changed dramatically in early The long-time leader of the armed group Congrès National pour la Défense du Peuple (CNDP), Laurent Nkunda, was arrested in Rwanda in January. Soon thereafter, several thousand combatants from CNDP, PARECO (Patriotes Résistants Congolais) and smaller armed groups were incorporated into the national army (the Forces Armées de la République Démocratique du Congo FARDC). 85 In spite of the political progress, the Forces Démocratiques de Libération du Rwanda (FDLR) remains active, and millions of dollars continue to flow into its coffers. 86 Although the CNDP is now ostensibly a part of FARDC, the movement and its revenue-generating capacities remain distinct. 87 For example, at Bisie mine in Walikale, North Kivu, which produces some 70% of the province s cassiterite, a former CNDP officer was assigned to collecting taxes on behalf of the government, and he continues controlling part of the mine s production TRANSNATIONAL ORGANIZED CRIME THREAT ASSESSMENT
287 11 Linkages between TOC and stability threats The United Nations has established clear links between illicit mineral exploitation and trafficking and armed conflict in the eastern DRC through the work of its Group of Experts. The Group s reports 89 have detailed how income gained from this trade has enabled various armed groups to build up their military capacities and challenge the Government s territorial control, particularly in North and South Kivu. The Forces Démocratiques de Libération du Rwanda (FDLR), a predominantly Rwandan Hutu group, is the group that has benefited most from illicit minerals. Its control of gold and cassiterite mines, particularly in South Kivu, continues to generate large revenues. It is involved in trafficking minerals by road to Rwanda, and has close ties to a number of traders and trading houses. For example, the top five cassiterite comptoirs in South Kivu in 2007 (according to Government export statistics) had direct financial links to negociants who work with the FDLR. 90 the trade. The UN Group of Experts argued that the Group believes that it is not in the interest of certain FARDC commanders to end the conflict in eastern Democratic Republic of the Congo as long as their units are able to deploy to, and profit from, mining areas. 95 In other words, the trafficking of minerals is key to conflict in the DRC. Addressing this conflict will require addressing the transnational organized crime that fuels it. If, through internationally coordinated efforts, this flow were to be stemmed, many of the combatants would lose their ability, and perhaps their will, to fight. Efforts similar to those used in the Kimberley Process on conflict diamonds could make a major difference in the security of the DRC. In 2009, the newly-integrated FARDC, with assistance from the Rwandan Defence Force, launched an offensive aimed at weakening the FDLR s military capabilities. It targeted key FDLR bases and strategic locations. The offensive failed, however, and FDLR is still deeply entrenched in South Kivu, particularly in key mining areas. 91 The Congrès National pour la Défense du Peuple (CNDP) has often chosen more indirect methods of profiteering from the natural resources. This group controls a key border crossing with Rwanda, 92 imposes various forms of taxation on the production and trafficking of minerals, and exerts pressure on mineral traders and buying houses for cuts of their profits. Some parts of North Kivu are, in fact, under parallel civilian administrations, with CNDPappointees working in administrative offices of some local government entities. For example, in Masisi, CNDP officials are collecting a number of local taxes. 93 PARECO and various community-based armed groups (known as Mai Mai ) also benefit financially from the trade in illicit minerals, but usually in an opportunistic way. This also reflects the fact that these groups tend to lack a well-defined economic and political agenda. 94 Finally, elements of the Congolese military forces are also deeply entrenched in and benefiting from Case studies of transnational threats 281
288
289
290 REGIONS UNDER STRESS FIG. 214: Somalia/ Gulf of Aden Rest of world Total number of attacks Main transnational organized crime threat Somalia is a single state comprised of three autonomous zones: Somaliland, Puntland, and the residual Somalia, which has been contested by rival armed groups for nearly two decades. In this context, it is difficult to speak of threats to the state, but anything that serves to aggravate and spread instability must be addressed. The recent growth of maritime piracy, bringing millions of dollars in ransom money to armed criminals, poses this threat. Piracy has been around as long as people have depended on seaways for transport and trade. Incidents of piracy in Somalia, the country with the longest coastline on the African continent, have increased rapidly in recent years, as has the country s share of global piracy incidents. In the early 2000s, Somali pirates were responsible for around 5% of global attacks. In 2009, out of 406 reported incidents, more than half (217) were attributed to Somali pirates. LOCATIONS OF TOTAL REPORTED PIRACY ATTACKS, Somalia/Gulf of Aden Rest of world Source: IMB-ICC annual reports, The pirates claim to be defending the coastline of Somalia from illicit fishing and toxic waste dumping, but their actions belie their words. As the number of pirate attacks in the region has increased, commercial fleets have been advised to steer farther and farther from the Somali coast. This has compelled the pirates to travel farther in search of victims, and they now attack craft having absolutely no relation to their domestic waters. Playing the role of the national defender has won the pirates some public legitimacy; important because they are dependent on community support on shore. This line is becoming increasingly implausible, but the practice has become so widespread that it may not matter any more. Pirates are now operating more than 1,000 nautical miles (1,852 kilometers) from the shore, which means they are capable of targeting ships off the coasts of Kenya, the United Republic of Tanzania, Seychelles and Madagascar, as well as in the Indian ocean. 96 As the principal waterways become better policed, the location of piracy incidents has shifted away from the Gulf of Aden and towards the southeastern coast of Somalia. In 2008, less than 20% of the attacks took place outside the Gulf; in 2009, more than 40% did. The main method for targeting vessels is for the pirates to wait in skiffs, usually some 50 nautical miles off the coast, on the lookout for a suitable vessel to attack. This method is used both in the Gulf of Aden and in the Indian Ocean. However, there are also reports of pirates being equipped with GPS and tracking ships through the use of on board navigation information systems. They are also believed to have built up a large network of coastal and port informants. 97 Once a vessel has been targeted for attack, several small skiffs are released from pirate mother ships, 98 prepared to attack the vessel simultaneously from different directions. This method of attacking moving vessels is currently very common for Somali piracy; it is used much less frequently by other pirates. 99 Assault rifles and/or rocket-propelled grenades are now used in most attacks by Somali pirates. 100 At least some of the pirates involved usually manage to board the vessel and capture the (generally unarmed) crew. 101 Bulk carriers, container ships and general cargo ships comprise the majority of piracy victims. 102 This is likely due to their relatively large size and slow speed. The hijacked vessel is then brought to one of the main bases of operation, Eyl, Hobyo or Haradheere, 103 and negotiations for ransom can commence. The pirates have set up safe locations onshore from where they can conduct ransom negotiations. 104 Companies that pay ransoms are understandably reluctant to reveal the amount, and the pirates themselves are not a reliable source, but the figures mentioned are frequently in the millions of dollars. In January 2010, a record ransom of either US$5.5 or 9 million was paid. 105 With 47 successful hijackings in 2009, the annual profit generated by piracy could amount to tens of millions of dollars, in a country with a GDP of some 2.5 billion dollars TRANSNATIONAL ORGANIZED CRIME THREAT ASSESSMENT
291 11 FIG. 215: PIRACY INCIDENTS ATTRIBUTED TO SOMALI PIRATES, 2009 n Each red dot represents an actual or attempted piracy attack in 2009 OMAN 500 km ASMARA ERITREA SANA'A YEMEN 15 Aden DJIBOUTI DJIBOUTI Gulf of Aden Socotra (Yemen) ADDIS ABABA ETHIOPIA Hargeysa Berbera S o m a l i l a n d P u n t l a n d SOMALIA MOGADISHU Kismaayo 0 KENYA VICTORIA DAR ES SALAAM UNITED REPUBLIC OF TANZANIA SEYCHELLES MORONI COMOROS MOZAMBIQUE MADAGASCAR 45 E 60 E Source: ICC: International Maritime Bureau, Piracy and armed robbery against ships, Annual Report 2009 UNODC / SCIENCES PO 15 There is anecdotal evidence that as many as 1,400 Somali men are now actively engaged in piracy. 107 Two main piracy networks have been identified: one in the semi-autonomous northern Puntland and another in the south-central Mudug region. 108 The most prominent pirate groups today seem to have their roots in Somali coastal fishing communities, especially in north-eastern and central Somalia, and their organization tend to reflects Somali clanbased social structures. 109 Case studies of transnational threats 285
292 REGIONS UNDER STRESS The stability/governance situation After the 22-year dictatorship of Siad Barre and 18 years of civil war, the Government collapsed in Numerous attempts at establishing a central authority since then have failed. Somalia still does not have an effective national government which controls the entire country. Indeed, it has three administrations with differing objectives: 1) the Transitional Federal Government, which aims to be the national government; 2) Government of Somaliland, which aims to be the government of an independent Somaliland; and 3) Government of Puntland, which aims to be the government of the semi-autonomous region of Puntland. While the election of President Sheikh Sharif Sheik Ahmed in January 2009 brought some optimism, as his ascent to power was brought about by a union between the former enemies of the Transitional Federal Government and the Islamic Courts Union; unfortunately, this union was short-lived. Somalia once again descended into a state of anarchy, and the insurgent groups Al Shabaab and the Hizbul Islam coalition attempted to take Mogadishu. 110 Since early May, in addition to the intermittent attacks on Government forces, there have been targeted killings by insurgent groups, such as the June assassination of Omar Hashi Aden, the serving Minister of National Security. 111 The President and his government have sought engagement with armed opposition groups, including the Hizbul Islam coalition. There have also been consultations with influential clan elders and Islamic clerics in efforts to broaden domestic support for the stabilization of the country. However, these engagements have proved to be challenging, in large part due to inflexibility among hard line insurgents. 112 Of the three entities that constitute Somalia, Somaliland has the best established central government, whereas the putative national Government in Mogadishu is the weakest. Even the Somaliland Government struggles to deliver basic public services. Four fundamental shortcomings affect all three governments, namely inadequate governance systems, human resources, public service delivery and physical infrastructure. 113 In Puntland, which is a base for pirates, the political situation was recently described as generally calm, 114 in spite of occasional violent incidents, abductions and assassinations. 115 Two Members of Parliament were also assassinated in separate incidents in January It has been argued that the common strand linking all Somali insurgents is a perception that the international community has been indifferent to the country s sovereignty and the interests of ordinary Somalis. For example, some see the Transitional Federal Government as a foreign imposition. The American missile strike that killed the leader of one of the main insurgency groups, Al-Shabaab, in 2008, provoked intense anger across the country, even among those who do not support the group. 117 It is clear that Somalia has severe problems establishing even the most basic governmental structures, let alone tackling piracy. Moreover, resources to improve the situation are scarce and unpredictable: the Transitional Federal Government forecast a total expenditure of US$110 million on anti-piracy measures in 2010, 80% of which depends on foreign assistance. 118 Linkages between TOC and stability threats Somali piracy is clearly linked to the general lawlessness in the country. The instability is enabling piracy to flourish, as pirates have little to fear from a state that lacks capacity to prevent, expose and prosecute the crime. Pirates can generally operate with impunity, 119 and may even enjoy an air of respectability within their communities. Other cases presented in this chapter illustrate how the development of organized crime activities in a context of instability and weak governance can impact the situation that created it. One commentator argues that the failure of governance has resulted in a climate of insecurity in Somalia, which led to the development of a criminal economy. The reign of terror which has plagued Somalia on land created the environment for the extension of violence to the sea, and the profit from piracy in turn again sustains the insurgency in the country as a whole. 120 While Somalia may indeed become trapped in a vicious circle, it is currently not clear to what extent piracy is driving instability. The links between pirates and insurgents are not clear-cut. Neither of the two main insurgent groups, Al-Shabaab and the Hizbul Islam coalition, 121 are known to be directly involved in piracy, but it has been reported that Al- Shabaab (AS) does have some links to pirates. Pirates have apparently approached AS for combat training, and AS is learning about maritime operations from the pirates. It also appears that AS is capable of taxing piracy. For example, when the 286 TRANSNATIONAL ORGANIZED CRIME THREAT ASSESSMENT
293 11 group captured the southern port of Kismayo, it was reported that pirates operating out of the port had to pay protection money in order to be left alone. 122 The operational synergies that may exist between some of the pirates and AS seem to be limited to the pirates of Haradheere (north of Mogadishu), who are from the same clans as many of AS. Due to clan rivalry, the pirates north of Haradheere are likely to have limited connections with AS. 123 In addition to indirectly funding insurgency, there is concern about the growing influence of the pirates on what government exists. 124 Politicians who wish to remain in power may be loathe to challenge the pirates, given their wealth and, often, popular support. In Puntland, piracy is said to be penetrating all levels of society. The pirates annual income dwarfs the Government s budget, 125 and a number of Puntland ministers are suspected of involvement in piracy. 126 In short, in addition to addressing the security concerns around a very important maritime trade route, efforts to address piracy should also contribute to the efforts to restore order to Somalia. Wealthy organized criminals are yet one more powerful group with an interest in instability. And any wealth entering the country at this stage is likely to find its way into the hands of the militant groups who control so much of the territory of the country. Case studies of transnational threats 287
294 REGIONS UNDER STRESS IMPLICATIONS FOR RESPONSE This chapter has illustrated the ways that transnational organized crime is both a symptom and a cause of instability in a diverse range of regions around the world. Both organized crime and insurgency undermine the rule of law. Together, they pose an even greater challenge to stability. Left unaddressed, criminal riches can buy the arms and the influence to affect the course of political events, particularly in the poorer areas of the world. And the direction of this influence is almost always toward further conflict, as the downward cycle feeds upon itself. This insidious link can provide a point of insertion for intervention, however. Contraband flows can have devastating local effects, but their dynamics are almost always international. Interventions can be targeted in areas less problematic than war zones. Strategies aimed addressing these flows could play a pivotal role in addressing civil conflict, by removing the profit motive that keeps many antagonists armed and in the field. Put simply, reducing crime can help foster peace. For example, the two most problematic illicit drugs cocaine and heroin leave a swathe of destruction in many regions affected by the trade, not to mention the damage they do in North America and Europe. If the flow of these drugs were significantly reduced, this could pay dividends in reducing conflicts around the world. collaboration has occurred under this aegis, but more could be done. Too often, work under the Conventions has been limited to law enforcement, while transnational organized crime cannot be reduced to a criminal justice issue. The Conventions provide a bedrock, but they do not constitute a global strategy, and they do not frame drug trafficking as a matter of international security. To deal comprehensively with these intractable and interlinked issues, there can be no substitute for coordinated international action. One area where immediate progress can be made is to fully integrate crime prevention into United Nations peace operations. The Security Council recently invited the Secretary-General to consider these threats as a factor in conflict prevention strategies, conflict analysis, integrated missions assessment and planning and to consider including in his reports, as appropriate, analysis on the role played by these threats in situations on its agenda. 127 The United Nations is best suited to provide the leadership needed to address these global issues at the level required. But doing so will necessitate moving beyond the disciplinary silos that distinguish organized crime from other security threats. It will mean acting as one United Nations, making use of the full range of military, development and crime prevention tools available. The problem is that most efforts against drugs are national, or, at best, bilateral, when the scale of the trafficking is global. Without a strategy scaled to fit the size of the problem, successful national efforts run the risk of simply displacing contraband flows. When opposed, the drug markets in cocaine and heroin have consistently adapted, finding new cultivation areas, new transit zones, and new consumer markets. In many cases, they have settled in the areas of least resistance, which are precisely the areas least equipped to deal with the challenge. And it is here that organized crime can escalate to the level of being a threat to stability. The world does have a framework for dealing with these drugs internationally, in the form of the three drug Conventions (of 1961, 1971, and 1988), the United Nations Convention against Transnational Organized Crime, and the Convention against Corruption, which provide a platform upon which cooperation can occur. A great deal of successful 288 TRANSNATIONAL ORGANIZED CRIME THREAT ASSESSMENT
295 CONCLUSION
296
297 CONCLUSION This report has been framed as a threat assessment, so it is fair to ask: which transnational organized crime flow poses the greatest global threat? Throughout the report, when feasible, an estimated dollar value has been ascribed to each flow, in order to facilitate comparison. Of course, this is just one metric, and others may be more significant, as discussed below. But higher value flows can pose a higher risk because they place more money in the hands of criminals, who may use it to put bullets in guns or to bribe officials. This kind of comparison is especially useful when looking at areas where organized crime could pose a threat to the state. The value estimates presented in this report must be regarded as extremely tentative. Since the data are incomplete everywhere, different estimation methods have been employed with each flow, and this affects their comparability. Many are based on seizures, which reflect an unknown level of enforcement success. In general, they should be seen more as indicators of the order of magnitude of the problem than figures of any precision. Still, the differences between flows discussed in this report are striking. Drugs remain the highest value illicit commodities trafficked internationally, by quite a wide margin. The flows coming closest are actually those best integrated into licit markets counterfeit goods and illicit timber as well as those involving illicit human movement. Firearms, for reasons described above, make up some of the lowest value flows. The estimated total value of the flows considered in this report is about US$125 billion per year, of which about 85% is generated by drug markets. In addition to absolute value, a number of factors can affect the threat posed by a particular flow. Flows that direct a large amount of money to a small number of individuals or groups are more dangerous than those where the proceeds are more widely disbursed. Migrant smuggling from Mexico to the US results in billions of dollars changing hands, as much as local profits from cocaine, but so many hands are involved that the threat is much less. The identities of the traffickers is also clearly relevant, as is the location where the value accrues. Those who manufacture counterfeits in East Asia generate huge revenues collectively, but none of these people has any interest in taking on the state. The same amount of money in the hands of militants in Central Africa would be considerably more problematic. The nature of the enterprise is also relevant. Human trafficking, for example, involves a lot of overheads. In the case of women trafficked to Europe for the purposes of sexual exploitation, it involves the housing and upkeep of some 140,000 workers, plus the costs of security and marketing. Turnover may be large, but profits, many of which accrue to small trafficking groups, are likely to be relatively small. In comparison, almost all the money gained through FIG. 216: TOC VALUE ESTIMATES DISCUSSED IN THIS REPORT COMPARED Cocaine to North America Cocaine to Europe Heroin to Europe Heroin to Russia Counterfeit goods to Europe Migrant smuggling from Latin America Illicit South-East Asian timber Counterfeit medicine Trafficking in persons to Europe Identity theft Trafficking in Chinese persons to US Child pornography Migrant smuggling from Africa Maritime piracy Ivory to Asia Firearms from Ukraine Firearms to Mexico Rhino horn to Asia 6,600 3,500 1,600 1,250 1, ,200 13,000 20,000 34,000 38, ,000 10,000 15,000 20,000 25,000 30,000 35,000 40,000 Source: UNODC estimates US$ millions Case studies of transnational threats 291
298 CONCLUSION identity theft is profit, with operating costs reduced to the price of an Internet connection. Weighing all these considerations, drugs appear to generate the most dangerous flow of profits, followed by environmental resources. Individual traffickers may make tens of millions, if not hundreds of millions, of dollars in a relative small number of transactions. Production areas are often affected by insurgency, and transit countries often suffer both from either high rates of murder, high levels of corruption, or both. With core demand generated by a consumer base of addicts, drugs also represent a long-term source of income for organized crime groups. But drug flows also illustrate that it does not take a lot of money to cause a lot of damage. Traffickers and insurgents in Afghanistan, for example, command only a small share of the value of the global heroin market, but cause far more violence than traffickers in Europe, where most of the value of the market resides. Similarly, those who fight over extractive industries in Africa may be competing for relatively small amounts of money, but in the context, these profits are worth killing for. Although important, the impact of destabilizing money flows is just one aspect of the threat posed by organized crime. The direct impact of drugs, which have resulted in addiction, disease and death for millions, is equally severe. The violation of human rights when a woman is trafficked for sexual exploitation, or when a child is violated for pornography, can never be adequately quantified. Firearms trafficking may not generate the largest incomes, but can even more directly challenge peace and stability. The market for tiger parts may be worth only a few million dollars per year, but the poachers pursuing this market could still drive these animals to extinction. Another way of looking at the threat is to look at the trend. Only five of the 17 TOC problems discussed in this report are clearly increasing, but this may be because only the largest and best established flows were included. Some organized crime problems have been around for decades, and may already be declining due to interventions and other factors. Others are rapidly emerging, and it may be possible to take action before the problem spirals out of control. For example, there has been a recent surge in demand for rhino horn associated with growth of the market in the east; a demand that could cause irreversible damage in a short period of time if not addressed. In addition, the trend in the volume of contraband moved and the trend in threat may point in different directions. For example, the cocaine flow to the United States has been in long-term decline, with a sudden drop off since At the same time, violence associated with this flow has dramatically increased. Changes in routing can also strongly affect the threat posed by a trafficking flow, such as when cocaine to Europe began to be diverted through West Africa. In the end, it appears that drugs remain the backbone of transnational organized crime, commanding the largest share of revenues, and fuelling violence, corruption, conflict and addiction. But this report has examined only a few markets in natural resources, and it is possible that some could be comparable both in scale and in impact, at least in the source countries. More research is needed on these extractive markets and their relationship with TOC and conflict. Given this complexity, can any meaningful lessons be drawn from the findings of this report about TOC as a whole? At least three major points come to the fore: 1. Because most trafficking flows are driven more by the market than by the groups involved in them, efforts that target these groups the traditional law enforcement response are unlikely to be successful on their own. 2. Because TOC markets are global in scale, global strategies are required to address them, and anything else is likely to produce unwanted side effects, often in the most vulnerable countries. 3. Because globalized commerce has made it difficult to distinguish the licit from the illicit, enhanced regulation and accountability in licit commerce could undermine demand for illicit goods and services. Responding to TOC markets requires more than law enforcement The preceding chapters have illustrated what was suggested at the outset of this report: most of what we call transnational organized crime today is rooted in market forces, not the plotting of professional criminal groups. For example, a large number of people know that firearms legally acquired in the United States can be sold for much more in Mexico. No mastermind is needed to coordinate the hundreds of straw purchasers required to satisfy demand. Similarly, people in rural areas of South-East Asia understand that the wildlife that surrounds them has value. So long as the buyers remain in certain 292 TRANSNATIONAL ORGANIZED CRIME THREAT ASSESSMENT
299 well-known collection points, no one has to contract these traditional hunters to do the job. Sophisticated structures are not needed to dispatch teetering boatloads of migrants into the Atlantic or the Mediterranean, or to post stolen credit card information on underground bulletin boards. Piracy in Somalia has become a vocation, almost a movement. Individual pirate groups may become more or less important, but for as long as the opportunity exists and barriers to entry are low, there will be many young men willing to risk their lives for a shot at escaping conflict and hunger. This is not to say that organized criminal groups are irrelevant to global TOC problems. Triad-type groups mediate relations between traffickers and officials in many markets in Asia. The Camorra remains important in receiving and distributing counterfeit goods in Europe, as well as in a number of other rackets. The Mexican cartels are becoming multi-crime enterprises, likely to endure even if cocaine demand were to dry up. These and many less well-known groups play an important role in promoting contraband provision and sales of illicit services. Much like insurgents, many take advantage of their geographic control and network of corrupt officials to facilitate the business of crime. In doing so, they can acquire tremendous power, and become a problem in their own right. But in the end, they are participants in the market, not the source of it. The implications of this central finding are several. While arresting and incarcerating individual perpetrators is important for its general deterrent effect, doing so is not sufficient to counteract illicit trade. So long as there is standing demand, and there remain areas where illicit goods can be sourced and trafficked, the market will adapt to any loss of personnel. Since the problem of TOC cannot be resolved purely through arrests and seizures, it cannot be reduced to a criminal justice issue. The solutions will require a much broader range of tools than those currently in the hands of law enforcement officials. Global strategies are needed for global problems Of the 17 crime problems examined in this report, 14 are intercontinental. What happens in these markets is a product of supply on one end of the world and demand on another, as well as conditions in a string of transit countries. Interventions at any point in this chain will have implications for every link. From a global perspective, national or even regional efforts made in isolation can be worse than ineffective; they can be counterproductive, as the problem is pushed from regions that pose resistance to those that do not, or cannot. Treating transnational organized crime markets will require two parallel sets of measures. First, there is a need to strengthen global resistance to TOC by building both the national and international capacity to track and respond to the problem. This is something like strengthening the immune system, and represents a long-term collective project. Second, there is a need to create global strategies to collectively address TOC problems that have become so acute that they require special intervention. This is more like a response to a particular infection, and would involve international strategic planning. In either case, the intervention must occur systemically, involving the whole organism. Both supply side and demand side measures must be coordinated, and the problem must be approached at a global level. Regulating the licit can curtail the illicit Traditional approaches tend to focus on influencing the behaviour of people whose behaviour is very difficult to influence. Many of those involved in TOC markets have very little to lose. Some are desperately poor, and contribute to global crime because there are few alternative options available. Some are marginal members of affluent societies, who participate in TOC as part of a broader counterculture. Of course, there are organized criminals who are both privileged and greedy, but they generally rely on the work of countless others who are not so well-off. It is difficult to deter the desperate and the marginal with the threat of incarceration. These are often people for whom the immediate rewards of participation in TOC seem far more significant than the distant possibility of arrest. Coca and poppy farmers, street gang members, drug-addicted sex workers, straw purchasers, bush meat poachers, trafficking victims turned traffickers, the illegal migrants who vend counterfeit goods and the small manufacturers who produce them: most of the people who make illicit markets possible either do not appreciate that what they are doing is wrong, or they no longer care. Many are focused on making it through the day, and for some, imprisonment is not the least attractive alternative. But there is another group of people whose behaviour is very important to maintaining these mar- Case studies of transnational threats 293
300 CONCLUSION kets, a group with quite a bit to lose if they are found to be operating outside the law: those who operate on the licit side of these same markets. Lack of clarity about the origin of certain goods allows otherwise honest buyers, including commercial firms, to purchase illicit merchandise. This results in much larger demand than there would normally be for contraband goods. When products are sold openly, the average buyer assumes they can be bought in good conscience. Professional buying agents may be under pressure to find the cheapest source available, and globalized commerce has made it impossible to individually screen each vendor. Regulating these markets globally would eliminate the good faith buyer pool, substantially reducing demand for contraband. All suppliers to the licit market internationally must be carefully monitored to ensure nothing illegal gets passed off as legitimate goods. For example, trafficked timber and minerals enter the legitimate supply chain and are used by companies that can claim ignorance as to the ultimate origin of these commodities. Counterfeit goods and medicines are often produced by the same firms that make the licensed products and may be sold from legitimate wholesale and retail outlets. Similarly, the trade in illicit ivory is only lucrative because there is a parallel licit supply, and ivory can be sold and used openly. Ivory would lose much of its marketability if buying it were unequivocally an illegal act, or if ownership of these status goods had to be concealed. In some cases, consumers are duped; in others, there is willing blindness. If the source of these products were clearly documented internationally, they would not be confronted with this dilemma. The same may even be true of services. Whatever decision a national government makes on the legality of foreign workers or the sex trade, this decision must be enforced. The line between the legal and the illegal must be clear and consistently enforced. There must be no grey area, because this grey area conceals the workings of transnational organized crime. Illicit drugs remain one of the few items discussed in this report that are illicit on their face, but even these are reliant on poorly regulated international commerce in chemical precursors. When only legitimate users of acetic anhydride can access it, for example, heroin production will be considerably more difficult. A number of the most significant flows discussed in this report are by-products of licit commerce that has globalized at a rate in excess of our collective ability to regulate them. Supply chains are not subject to comprehensive audit because no one can keep track of the myriad products being shuffled back and forth across national borders. What goes on domestically remains obscured, and trade secrets have come to be regarded as matters of national security. It is in this murk and muddle that transnational trafficking germinates. Putting an end to the parallel trade in illicit goods is part of the larger project of bringing transparency and accountability to global commercial flows, but considerable progress could be made by focusing on a few of the most problematic commodities. The Extractive Industries Transparency Initiative provides an example in the oil and mineral field. A similar effort could be mounted for environmental resources, and global accountability programmes launched for arms, pharmaceuticals, and even certain sectors of manufactured goods and chemicals. More accurate accounting of containerized shipping could also help reduce the volumes of contraband transported internationally. Most global commercial flows proceed by sea, but at present, transnational shipping is a chaotic affair, with international waters a largely lawless zone. Progress has been made in assuring bulk carriers are licensed and monitored. So too should be their cargoes, if commercial accountability is to become a reality. Of course, this logic does not apply to those forms of organized crime that are predatory, rather than market-based, such as identity theft and piracy. Arrest and seizures are not much more likely to curtail these activities than they are to eliminate contraband markets, however. Internet access is growing in the developing world, where law enforcement capacity is limited, and there is currently no viable criminal justice system in Somalia. Here, the solutions are more likely to be technological, aimed at making it more difficult to acquire money in these ways. In the end, each flow is unique, and the interventions required to address it cannot be prescribed without detailed consideration of the particularities, but the potential for taming the illicit by regulating the licit should be explored in each instance. Coming to terms with TOC This report represents the first attempt by UNODC to survey the broad terrain of transnational organized crime. It comes nearly 10 years after the meeting in Palermo that gave birth to the Convention. 294 TRANSNATIONAL ORGANIZED CRIME THREAT ASSESSMENT
301 Progress has been slow in coming to terms with this multi-faceted and complex topic. It is hoped this threat assessment will help promote the international cooperation required to take on these global problems. Case studies of transnational threats 295
302
303 ENDNOTES
304
305 ENDNOTES Executive Summary 1 A more secure world: Our shared responsibility, Report of the High-level Panel on Threats, Challenges and Change, United Nations, 2004, p 2. 2 Presidential Statement S/PRST/2010/4. 3 Including Taiwan, Province of China. Chapter 1 - The threat of transnational organized crime 1 Von Lampe, K., Not a process of enlightenment: the conceptual history of organized crime in Germany and the United States of America. Forum on Crime and Society Vol. 1 No. 2, December 2001, pp As well as the substantive offences of money laundering, corruption, and obstruction of justice. 3 In accordance with the provisions of article 18.1 (c) of the Single Convention on Narcotic Drugs, 1961, and article 16.3 of the Convention on Psychotropic Substances For opium, cannabis herb, cannabis resin and cannabis plants: 1 kilogram and above; for heroin, morphine, cocaine, and psychotropic substances: 100 grams and above. 5 United Nations Office on Drugs and Crime, Global Report on Trafficking in Persons. Vienna: UNODC, Article 12 deals with the exchange of information, and was included in the Firearms Protocol despite discussion of information sharing in the main Convention. A number of forms of bilateral information exchange are suggested, while the pooling of seizure data pointedly was not. 7 Commission of the European Communities, Towards a European strategy for preventing organised crime: Joint report from Commission Services and Europol. Brussels: European Commission, p Report of the High-Level Panel on Threats, Challenges and Change, A more secure world: our shared responsibility, Attached to Note by the Secretary-General, A/59/565, 2 December 2004, para Europol, Organized Crime Threat Assessment The Hague, Europol, 2006, p US Department of Justice, Overview of the law enforcement strategy to combat international organized crime, April See: p. 10. Published the same year, van Dijk concurs, The fragmentation of organized crime seems to be a worldwide trend...organized crime groups today resemble networks of entrepreneurs... This new generation of Mafias does not conform to the hierarchical, static, and semi-bureaucratic structures, the cartels, cupolas, and the like. In many cases, territorially-oriented groups have been replaced by criminal organizations that are smaller, less stable, and lighter on their feet. van Dijk, J, The world of crime. Thousand Oaks: Sage Publications, 2008, p Roberto Saviano, in his personal journey into the Naples organized crune system, argues, The flexibility of today s economy has permitted small groups of manager bosses operating in hundreds of enterprises in well-defined sectors to control the social and financial arenas. There is now a horizontal structure much more flexible than the Cosa Nostra, and much more permeable to new alliances than the Calabrian Ndrangheta that adopts new strategies in entering cutting-edge markets Camorra groups no longer need to maintain widespread military-type control because their principal business activities now take place outside Naples The clans no longer need to organize in large bodies. Saviano, R. Gomorrah. New York: Farrar, Straus and Giroux, 2007, pp von Lampe, K., Organized Crime in Europe. In: Philip Reichel (ed.), Handbook of Transnational Crime and Justice, Thousand Oaks: Sage Publications, 2005, pp Sterling, C., Crime Without Frontiers: The Worldwide Expansion of Organised Crime and the Pax Mafiosa. New York: Time Warner Paperbacks, For example, the United States Department of Justice strategy to combat international organized crime identifies four priority areas of action: Marshall information and intelligence Prioritize and target the most significant international organized crime threats Attack from all angles [Apply] Enterprise theory But in explaining the concept of threat assessment, it suggests: Select and target for high-impact law enforcement action the international organized crime figures and organizations that pose the greatest threat to the United States (emphasis added) And in discussing enterprise theory, it recommends, Develop aggressive strategies for dismantling entire criminal organizations, especially their leadership (emphasis added) In short, while the document emphasises a non-traditional approach, it remains focused on the pursuit of individuals and organizations, rather than the dismantling of markets. See: United States Department of Justice, Overview of the law enforcement strategy to combat international organized crime, Washington, D.C.: DOJ, April See Langewiesche, W. The Outlaw Sea: A World of Freedom, Chaos, and Crime. New York: North Point Press, Peter P. Belobaba and Amedeo Odoni, Introduction and Overview, in The Global Airline Industry, P. Belobaba, C. Barnhart and A. Odoni (eds.), John Wiley & Sons, Ltd., International Air Transport Association (IATA), Fact Sheet: World Industry Statistics, July Government Accountability Office, Airline Deregulation: Reregulating the Airline Industry Would Likely Reverse Consumer Benefits and Not Save Airline Pensions, June United Kingdom Department for Transport, International sea container freight: The container freight end-to-end journey, December TEUs though Shanghai, Shenzhen, Qingdao, Ningbo, Guangzhou, Tianjin and Xiamen ports increased from 27,844 in 2002 to 86,990 in 2007, according to the AAPA s World Port Rankings. 20 July 2009 Web Server Survey, Netcraft. 21 International Centre for Missing and Exploited Children, Child Pornography: Model Legislation & Global Review, Serious Organized Crime Agency, The United Kingdom Threat Assessment of Organised Crime 2009/ Kattoulas, V., The Yakuza Recession. Far Eastern Economic Review, 17 January United Nations Department of Economic and Social Affairs, World Population Prospects: The 2006 Revision, New York, UN-HABITAT, Global report on human settlements 2007, pp Ibid. 27 International Organization for Migration, World Migration Report 2008, Geneva, Switzerland, December United Nations Department of Economic and Social Affairs, World Population Prospects: The 2006 Revision, Population Division, New York, IOM, op cit. 30 UNODC, What is migrant smuggling? See: 31 US Office of National Drug Control Policy, ADAM II Annual Report, April See: Chapter 2 - Trafficking in persons 1 Article 3, paragraph (a) of the Protocol to Prevent, Suppress and Punish Trafficking in Persons defines Trafficking in Persons as the recruitment, transportation, transfer, harbouring or receipt of persons, by means of the threat or use of force or other forms of coercion, of abduction, of fraud, of deception, of the abuse of power or of a position of vulnerability or of the giving or receiving of payments or benefits to achieve the Case studies of transnational threats 299
306 ENDNOTES consent of a person having control over another person, for the purpose of exploitation. Exploitation shall include, at a minimum, the exploitation of the prostitution of others or other forms of sexual exploitation, forced labour or services, slavery or practices similar to slavery, servitude or the removal of organs. 2 UNODC, Trafficking in Persons; Global Patterns, Vienna, The figure refers to 111 countries providing such information for the year 2006; See UNODC/UN.GIFT, Global Report on Trafficking in Persons, Vienna, Ibid. 5 ILO, A Global Alliance Against Forced Labour, Geneva, The definition used was that of the Forced Labour Convention of 1930: all work or service which is exacted from any person under the menace of any penalty and for which the said person has not offered himself voluntarily. The ILO argues that trafficking in persons for the purpose of exploitation is encompassed by the definition of forced or compulsory labour provided under the [Forced Labour] Convention. This estimate focuses on the costs to the laborers, including lost wages, rather than the profits accruing to the traffickers or exploiters. See ILO, The Cost of Coercion; Global Report under the follow-up to the ILO Declaration on Fundamental Principles and Rights at Work, International Labour Conference, 98th Session 2009, Geneva, ILO, 2005, op cit. 8 The Protocol to Prevent, Suppress and Punish Trafficking in Persons, especially Women and Children, was adopted by General Assembly resolution 55/25. It entered into force on 25 December It is the first global legally binding instrument with an agreed definition on trafficking in persons. 9 IOM, Deceived Migrants from Tajikistan: A Study of Trafficking in Women and Children, Dushanbe, 2001; Tatiana A. Denisova, Trafficking in Women and Children for Purposes of Sexual Exploitation, Zaporizhie State University, 2004; UNODC, An Assessment of Referral Practices to Assist and Protect the Rights of Trafficked Persons in Moldova, Chisinau, Moldova, UNODC Trafficking in Persons; Global Patterns, Vienna, The West and Central European countries considered in this chapter as destination of trafficking are the following: Albania, Austria, Belgium, Bosnia and Herzegovina, Bulgaria, Croatia, Cyprus, Czech Republic, Denmark, Estonia, Finland, France, Germany, Greece, Hungary, Iceland, Ireland, Italy, Latvia, Lithuania, Luxembourg, Malta, Montenegro, The Netherlands, Norway, Poland, Portugal, Romania, Serbia, Kosovo (Serbia), Slovakia, Slovenia, Spain, Sweden, Switzerland, the Former Yugoslav Republic of Macedonia, Turkey, the United Kingdom. 12 TAMPEP, TAMPEP 8, 1st General Meeting, Vienna 2008; International Human Rights Law Institute, In Modern Bondage; Sex Trafficking in the Americas; Central America, The Caribbean, and Brazil; Chicago, Dutch National Rapporteur on Trafficking in Human Beings; Trafficking in Human Beings; First Report of the Dutch National Rapporteur, The Hague 2002; TAMPEP, TAMPEP 8, 1st General Meeting, Vienna UNODC, Transnational Trafficking and the Rule of Law in West Africa: A Threat Assessment, Vienna, Ibid. 16 Rebecca Surtees, Traffickers and trafficking in southern and eastern Europe, European Journal of Criminology, Volume 5/ Number 1/January Tatiana A. Denisova, Trafficking in Women and Children for Purposes of Sexual Exploitation, Zaporizhie State University, Ivana Trávníčková, Trafficking in Women: The Czech Republic Perspective, Institute for Criminology and Social Prevention and UNICRI, Prague, Z.Izdebski, J.Dec Criminal Justice Responses to Trafficking in Human Beings in Poland, Institute of Social Pedagogy Counselling and Sexual Education Unit University of Zielona Góra and UNICRI. 20 UNICRI, Trafficking in Women from Romania into Germany Comprehensive Report, March According to a country profile of Azerbaijan compiled by The Protection Project, most Azeri women and girls are trafficked by friends, acquaintances, neighbours, or relatives. See IOM, Shattered Dreams: A Report on Trafficking in Persons in Azerbaijan, Geneva, Tatiana A. Denisova, Trafficking in Women and Children for Purposes of Sexual Exploitation, Zaporizhie State University, Ivana Trávníčková, Trafficking in Women: The Czech Republic Perspective, Institute for Criminology and Social Prevention and UNICRI, Prague, Z.Izdebski, J.Dec Criminal Justice Responses to Trafficking in Human Beings in Poland- Institute of Social Pedagogy Counselling and Sexual Education Unit University of Zielona Góra and UNICRI. 25 E.Ciconte; The Trafficking flows and routes of Eastern Europe, WEST-Women East Smuggling Trafficking, Ravenna, 2005; F. Carchedi, V. Tola, All aperto e al chiuso; Prostituzione e Tratta: I nuovi dati del fenomeno, I sevizi sociali, le normative di riferimento, Materiali Eddiesse, Roma, Tatiana A. Denisova, Trafficking in Women and Children for Purposes of Sexual Exploitation, Zaporizhie State University, 2004, 27 Izdebski, J.Dec Criminal Justice Responses to Trafficking in Human Beings in Poland- Institute of Social Pedagogy Counselling and Sexual Education Unit University of Zielona Góra and UNICRI; Ivana Trávníčková, Trafficking in Women: The Czech Republic Perspective, Institute for Criminology and Social Prevention and UNICRI, Prague, 2005; UNICRI Trafficking in Women from Romania into Germany Comprehensive Report March Ibid. 29 International Human Rights Law Institute, In Modern Bondage; Sex Trafficking in the Americas; Central America, The Caribbean, and Brazil, Chicago, CECRIA, Save the Children Sweden Study on Trafficking in Women, Children and Adolescents for Commercial Sexual Exploitation; PASTRAF, F.Carchedi, I.Orfano, La Tratta di Persone in Italia; Evoluzione del Fenomeno ed Ambiti di Sfruttamento, Osservatoriotratta, FrancoAngeli, Milano, International Human Rights Law Institute, In Modern Bondage; Sex Trafficking in the Americas; Central America, The Caribbean, and Brazil; Chicago, UNICRI, Trafficking of Nigerian Girls to Italy; Report of Field Survey in Edo State, Nigeria. Turin F.Carchedi, A Piccioli, G. Mottura, G. Campani, I Colori della Notte. Migrazioni, Sfruttamento Sessuale, Esperienze d Intervento Sociale, FrancoAngeli, Milan, 2000; C. Magnabosco, M.Visentin, A.Giaconia, G.Martano, G.Parodi, G.Celestini, A.Delcanale, Da uomo a uomo da cliente a cliente; Storie italiane si clienti anonimi e clienti anomali, Progetto La Ragazza di Benin City, associazione WHO, Aosta. 35 Carling, J. Migration, Human Smuggling ad Trafficking from Nigeria to Europe, IOM, 2005; Carchedi-Orfano La tratta di persone in Italia, Osservatorio tratta, 2007; UNICRI Trafficking of Nigerian Girls to Italy, According to IOM, The so-called second wave refers to women who were trafficked and who have been offered, or somehow taken, the option of recruitment rather than continued sexual exploitation. Also other studies confirm this pattern. In Ukraine these criminal groups are both big and small, organized and unorganized, and nationally and internationally based. Within these organizations, 60% of the leaders are women, usually 30 to 35 years old; many of them are former prostitutes. See Tatiana A. Denisova, Trafficking in Women and Children for Purposes of Sexual Exploitation, Zaporizhie State University, More than one mean of coercion can be used for the same victim. 38 IOM, Deceived Migrants from Tajikistan: A Study of Trafficking 300 TRANSNATIONAL ORGANIZED CRIME THREAT ASSESSMENT
307 ENDNOTES in Women and Children, Dushanbe, 2001; Tatiana A. Denisova, Trafficking in Women and Children for Purposes of Sexual Exploitation, Zaporizhie State University, 2004; UNODC, An Assessment of Referral Practices to Assist and Protect the Rights of Trafficked Persons in Moldova, Chisinau, Moldova, L.Kelly, Fertile Fields: Trafficking in Persons in Central Asia, IOM Vienna, UNICRI, Trafficking in Women from Romania into Germany Comprehensive Report, March Carling, J., Migration, Human Smuggling and Trafficking from Nigeria to Europe, IOM, 2005; Carchedi-Orfano La tratta di persone in Italia, Osservatorio tratta, 2007; UNICRI Trafficking of Nigerian Girls to Italy, Ibid. 43 Ibid. 44 Ibid. 45 G. Vermeulen, T.van der Beken, Belgium, A study for monitoring the trafficking of human beings for the purpose of sexual exploitation in the EU member states, Unpublished, HEUNI, Helsinki, E,Turiakova Human Trafficking in the Russian Federation: Inventory and Analysis of the Current Situation and Responses Institute for Urban Economics for the UN/IOM Working Group on Trafficking in Human Beings, Moscow, Azad Azarbaycan TV, Baku, 9 February UNICRI, Trafficking in Women from Romania into Germany Comprehensive Report, March International Human Rights Law Institute, In Modern Bondage; Sex Trafficking in the Americas; Central America, The Caribbean, and Brazil, Chicago, CECRIA, Save the Children Sweden Study on Trafficking in Women, Children and Adolescents for Commercial Sexual Exploitation, PASTRAF, International Human Rights Law Institute, In Modern Bondage; Sex Trafficking in the Americas; Central America, The Caribbean, and Brazil, Chicago, ILO, A Global Alliance Against Forced Labour, Geneva, ILO s methodology is based on reported cases of trafficking, not on cases detected. 53 The year 2006 was used in this case because more countries reported data in 2006 than in the other years covered in the UN.GIFT research. 54 Transcrime suggests a multiplier of 20 for every victim detected. See A Pilot Study on Three European Union Key Immigration Points for Monitoring the Trafficking of Human Beings for the Purpose of Sexual Exploitation across the European Union. 55 If one out of seven sex workers is a trafficking victim, then the detection ratio suggested above (one in 20) seems on the low side. 56 ILO, Minimum Estimate of Forced Labour in the World, Geneva: International Labour Organization, One US study found a client load of 694 male partners in the last 12 months per sex worker. This estimate was adjusted to account for higher client rates among drug addicted sex workers. Brewer, D., J. Potterat, S. Garrett, S. Muth, J. Roberts, D. Kasprzyk, D. Montano, and W. Darrowi, Prostitution and the sex discrepancy in reported number of sexual partners. Proceedings of the National Academy of Sciences, Vol 97, No 22, 2000, pp Trafficking victims are likely to have higher client loads, perhaps comparable to drug addicts, but more research is needed on client loads for sex workers and trafficking victims. 58 See Carchedi, F. and Tola, V, All aperto e al chiuso, prostituzione e tratta: i nuovi dati del fenomeno, i servizi sociali, le normative di riferimento, Eddiesse: Rome, More research is also required on prices for services. 59 A.C.Kinsey, W.Pomeroy, C.Martins Sexual Behaviour in the Human Male, Indiana University Press, Bloomington, Indiana, USA, E.O. Laumann, G. Kolata J.H Gagnon, R.T, Michael, Sex in America: A Definitive Survey, Warner Books Edition, New York B. Lewin, Sex in Sweden. On the Swedish Sexual Life, The National Institute of Public Health, Stockholm, Leridon, Zesson and Hubert, The Europeans and their sexual partners, UCL, London, Rissel, Richter, Grulich, et al, Sex in Australia: Experiences of commercial sex in a representative sample of adults, Australia and New Zealand journal of public health, vol. 27, no. 2, (pp ), Canberra, Leridon, Zesson and Hubert, The Europeans and their sexual partners, London, UCL, Ibid. 66 M.C Santos Ortiz., J.L. Lao-Melendez,,Torres-Sanchez, Sex workers and the elderly male clients, Prometeus Books, B. Anderson, J O Connell Davidson, Is trafficking in human beings demand driven? A multi-country pilot study, IOM, M. Carael, E. Slaymaker, R. Lyerla, S. Sarkar, Clients of sex workers in different regions of the world: hard to count, Sexually Transmitted Infections, Vol 82: 2006, pp. iii26-iii Ward, H., C. Mercer, K. Wellings, K. Fenton, B.Erens, A. Copas, A. Johnson, Who pays for sex? An analysis of the increasing prevalence of female commercial sex contacts among men in Britain, Sexually Transmitted Infections, Vol 81, 2005, pp Groom, T. and R. Nandwani, Characteristics of men who pay for sex: a UK sexual health clinic survey, Sexually Transmitted Infections, Vol 82, 2006, pp Belza, M., L. de la Fuente, M. Suárez, F. Vallejo,, M. García, M. López, G. Barrio, Á. Bolea. Men who pay for sex in Spain and condom use: prevalence and correlates in a representative sample of the general population, Sexually Transmitted Infections, Vol 84, 2008, pp Vandepitte1, J, R. Lyerla, G. Dallabetta, F. Crabbé, M. Alary, A. Buvé, Estimates of the number of female sex workers in different regions of the world, Sexually Transmitted Infections, Vol 82, (Supplement 3 ), 2006, pp. iii18-iii Elaboration from UN.GIFT-UNODC data. 74 When trends in convictions were not available, trends concerning prosecutions or investigations were considered. 75 In Spain, the share of Romanian victims increased during the entire period considered. 76 This refers to people who furnish the supply of labour for the production of economic goods. Source: Economic activity rate and economically active population, by sex, thirteen age groups, (ILO estimates and projections) are data from the International Labour Union (ILO). Source details: ILO, Economically Active Population, , fourth edition, diskette database (Geneva, 1997). The latest set of estimates and projections covering the period (4th edition) was released by ILO in December World Bank, World Development Indicators. 78 Ryan, Jan, Globalization and Migration in the 21st Century: Looking back in the future, Forum on Public Policy, Spring 2007; UNFPA State of World Population; A passage to hope, women and international migration Population Division, United Nations Department of Economic and Social Affairs, International Migration Report 2006: A Global Assessment, New York: DESA, 2006, p UNODC cross countries correlation between Chinese outward stock FDI recorded in 2007, and Chinese migration recorded between 2000 and The analysis was conducted on a sample of 226 countries. The Pearson Correlation Coefficient resulted , (Sig, 2-tailed, 0,000). FDI data source is the 2007, Bulletin of China s Outward Foreign Direct Investment and migration data source is Development Research Centre on Migration, Globalization and Poverty, Global Migrants Origin Database. 81 Technically, trafficking in persons is very different from migrant smuggling which comprises assisted irregular border crossing. Nevertheless, many of the Chinese smuggled migrants are eventually exploited by the organizations that have smuggled them, transforming a migration phenomenon into a human trafficking activity. It is difficult to understand how much the organized irregular migration managed by these Case studies of transnational threats 301
308 ENDNOTES groups is aiming at the simple irregular border crossing of the migrants or at their exploitation. 82 Based on UNODC/UN-GIFT data, published in UNODC/ UN.GIFT, Global Report on Trafficking in Persons, Vienna, UNODC/UN.GIFT, Global Report on Trafficking in Persons, Vienna, UNIAP, COMMIT Sub-Regional Plan of Action Achievement; , December Hong Kong, China is largely Cantonese-speaking, while Taiwan, Province of China is populated mainly by Min-speaking people of Fujianese descent. 86 F. Carchedi, V. Tola, All aperto e al chiuso; Prostituzione e Tratta: I nuovi dati del fenomeno, I sevizi sociali, le normative di riferimento, Materiali Eddiesse, Roma, Ibid. 88 S. Zhang; K. Chin Characteristics of the Chinese Human Smugglers: A cross-national Study, Final report, San Diego, CA: San Diego State University Ibid. 90 Ibid. 91 Ko-lin Chin, Smuggled Chinese: clandestine immigration to the United States, Temple University Press, Philadelphia, Chin, K.-L., Chinatowns Gangs. Extortion, Enterprise, and Ethnicity, New York, Oxford University Press, International Copyright Piracy: Links to Organized crime and Terrorism _ Jack Valenti, Testimony before the U.S. House of Representatives Subcommittee on Courts, the internet, and intellectual Property, 13 March Ko-lin Chin, Smuggled Chinese: clandestine immigration to the United States, Temple University Press, Philadelphia, F. Carchedi, V. Tola, All aperto e al chiuso; Prostituzione e Tratta: I nuovi dati del fenomeno, I sevizi sociali, le normative di riferimento, Materiali Eddiesse, Roma, J. Raymond, D. Hughes, Sex Trafficking of Women in The United States: International and Domestic Trends, Coalition Against Trafficking in Women, March Transnational Activities of Chinese Organization, Federal Research Division, Library of Congress, April IOM La trata de personas con fines de explotación sexual en la república oriental del Uruguay, R. Tailby, Organized Crime and People smuggling/trafficking to Australia, Trends and Issue in Crime and Criminal Justice, N.208, Australian Institute of Criminology, May F. Carchedi, V. Tola, All aperto e al chiuso; Prostituzione e Tratta: I nuovi dati del fenomeno, I sevizi sociali, le normative di riferimento, Materiali Eddiesse, Roma, J.O Finkenauer, K. Chin Asian Transnational Organized Crime and its Impact in the United States, NCJ , January Ibid. 103 F. Carchedi, V. Tola, All aperto e al chiuso; Prostituzione e Tratta: I nuovi dati del fenomeno, I sevizi sociali, le normative di riferimento, Materiali Eddiesse, Roma, A.Camuso, E. Fittipaldi, la Mafia Gialla in Espresso N. 23, June F.Carchedi, I.Orfano, La Tratta di Persone in Italia; Evoluzione del Fenomeno ed Ambiti di Sfruttamento, Osservatoriotratta, FrancoAngeli, Milano, EUROPA PRESS, Los explotados por la mafia china en Mataró trabajaban hacinados 12 horas al día Barcelona 17 June Dutch National Rapporteur on Trafficking in Human Beings; Trafficking in Human Beings; Sixth Report of the Dutch National Rapporteur, The Hague, Library of Congress, Asian organized crime and terrorist activity in Canada, , (a report prepared by the Federal Research Division, Library of Congress under an interagency agreement with the United States Government). 109 UNODC website, frontpage/2009/july/ghana-sentences-first-human-traffickers. html. 110 IOM, Trafficking in Persons in Afghanistan; Field Survey Report, Kabul, J.O Finkenauer, K. Chin Asian Transnational Organized Crime and its Impact in the United States, NCJ , January Royal Canadian Mountain Police, Understanding Asian Organized Crime ( ecdd0054.htm). 113 S. Zhang; K. Chin, Characteristics of the Chinese Human Smugglers: A cross-national Study, Final report. San Diego, CA: San Diego State University Library of Congress, Transnational Activities of Chinese Crime Organizations, Federal Research Division (A Report Prepared by the Federal Research Division, Library of Congress under an Interagency Agreement with the United States Government). 115 Direzione Investigativa Antimafia, Report to the Italian Parliament, Rome, Library of Congress, Asian organized crime and terrorist activity in Canada, , (a report prepared by the Federal Research Division, Library of Congress under an interagency agreement with the United States Government). 117 K. Chin, The Social Organization of Chinese Human Smuggling, Global Human Smuggling: Comparative Perspectives, Baltimore, MD., The Johns Hopkins University Press, UNIAP, COMMIT Sub-Regional Plan of Action Achievement; , December UNODC/UN.GIFT, Global Report on Trafficking in Persons, Vienna, USA Department Of Justice, Trafficking in Persons Report 2009, Washington, June N. Tran, An Assessment on the Exploitation of Chinese Migrants in the Wesetrn Hemisphere: a Modern Form of Trafficking in Persons, OAS, July UNODC/UN.GIFT, Global Report on Trafficking in Persons, Vienna, Ko-lin Chin, Smuggled Chinese: clandestine immigration to the United States, Temple University Press, Philadelphia, According to the US Department of State, in the year 2000 about 12,000 Chinese were smuggled into the USA. However, Zhang and Ko-Lin Chin assess the annual inflow to be much higher, between 20,000 and 30,000 victims per year. 125 Ko-lin Chin, Smuggled Chinese: clandestine immigration to the United States, Temple University Press, Philadelphia, According to Zhang, Ko-Lin Chin, the smuggler profit for migrant is about 10,000USD, while the smuggling fee paid by the migrant would range around US$55,000. See more in Characteristics of the Chinese Human Smugglers: A cross-national Study, Final report. Sheldon Zhang; Ko-lin Chin UNODC/UN.GIFT, Global Report on Trafficking in Persons, Vienna, Elena Tyuryukanova, Forced labour in the Russian Federation today: irregular migration and trafficking in human beings, ILO, Geneva, F. Carchedi, V. Tola, All aperto e al chiuso; Prostituzione e Tratta: I nuovi dati del fenomeno, I sevizi sociali, le normative di riferimento, Materiali Eddiesse, Roma, Direzione Investigativa Antimafia - Report to the Italian Parliament Dutch National Rapporteur on Trafficking in Human Beings, Trafficking in Human Beings; Fourth Report of the Dutch National Rapporteur, The Hague, Comensha, JAARVERSLAG 2008 Augustus 2009, Chapter 3 - Smuggling of migrants 1 According to Article 3 (1) of the Protocol against the smuggling of migrants by land sea and air - commonly referred as the Migrant Smuggling Protocol - supplementing the UN Convention Against Transnational Organized Crime. UN General Assembly Resolution 55/25, 8 January In addition, Article 6 of the Protocol criminalizes the facilitation of 302 TRANSNATIONAL ORGANIZED CRIME THREAT ASSESSMENT
309 ENDNOTES illegal residence. 2 United Nations Development Programme; Human Development Report 2009; Overcoming Barriers: Human Mobility and Development, New York Webb, S., Burrows, J., Organised immigration crime: a postconviction study, Home Office, There are many examples of opportunism in studies of migrant smuggling. For instance, in a study conducted by UNODC on migrant smuggling from Tamil Nadu (India) many of the smugglers were from the district of Chennay, the area of the local international airport. See UNODC, Smuggling of migrants from India to Europe and in particular to the UK - a study on Tamil Nadu, New Delhi, 2009, p Neske, M., Human Smuggling to and through Germany, International Migration Vol. 44 (4) In a study on East Africa, the author explains that the large majority of migrants leaving Somalia and Ethiopia would choose to travel overland or by sea in extremely precarious situations because of their poor economic conditions. Only 3-5% of the them could afford flying directly to South Africa, usually with forged documents. See Horwood, C., In pursuit of the Southern dream: victims of necessity. Assessment of irregular movement of men from East Africa and the Horn to South Africa, International Organization for Migration, 2009, p For example, migrants travelling from South or East Asia to the Russian Federation and points beyond often fly from their origin countries to Tajikistan, Kyrgyzstan or Uzbekistan, and from there continue by land across Kazakhstan to the Russian Federation. Taxis waiting on the other side of the border take them to Moscow for US$1,000 See Gembicka, K., Baseline research on smuggling of migrants in from, through Central Asia (Kazakhstan, Kyrgyzstan, Tajikistan), International Organization for Migration, September 2006, p Pew Hispanic Center estimates derived principally from the March 2004 Current Population Survey and Census Passel, J. S., Unauthorized migrants: Number and Characteristics Background Briefing Prepared for Task Force on Immigration and America s Future, Pew Hispanic Center World Development Indicators database, World Bank, 7 October See list at 12 Presentation by R. Medina, World Bank, CPSS-WB General Principles for International Remittances Services; The Point of View of Authorities: Banco de México, May Hanson, G., The Economic Logic of Illegal Immigration. Washington, D.C.: Council on Foreign Relations, CSR No 26, April Bloomberg news, Greenspan says illegal immigration aids U.S. economy, 30 April Homeland Security, Office of Immigration Statistics, Policy directorate, Immigration enforcement action: 2008, Annual Report, July Rytina, N., Simanski, J., Apprehensions by the U.S. Border Patrol: , Homeland Security, Office of Immigration Statistics, Policy directorate, June Homeland Security, Office of Immigration Statistics, Policy directorate, Immigration enforcement action: 2008, Annual Report, July Nuñez-Neto, B, Siskin, A., Viña, S., Border Security: Apprehensions of Other Than Mexican Aliens; Congressional Research Service, The Library of Congress. CRS Report for Congress, September Rytina, N., Simanski, J., Apprehensions by the U.S. Border Patrol: , Homeland Security, Office of Immigration Statistics, Policy directorate, June Nuñez-Neto, B, Siskin, A., Viña, S., Border Security: Apprehensions of Other Than Mexican Aliens; Congressional Research Service, The Library of Congress. CRS Report for Congress, September United States Government Accountability Office, Illegal Migration; Border-Crossing Deaths Have Doubled Since 1995; Border Patrol s Efforts to Prevent Deaths Have Not Been Fully Evaluated, Ibid. 23 Ibid. 24 Ibid.; and McCaul, M., Line in the Sand: Confronting the Threat at the Southwest Border, Majority Staff of the House Committee on Homeland Security, Subcommittee on Investigations. 25 United States Government Accountability Office, Illegal Migration; Border-Crossing Deaths Have Doubled Since 1995; Border Patrol s Efforts to Prevent Deaths Have Not Been Fully Evaluated, Nuñez-Neto, B., Siskin, A., Viña, S., Border Security: Apprehensions of Other Than Mexican Aliens; Congressional Research Service, The Library of Congress. CRS Report for Congress, September Ibid. 28 Ibid. 29 Ibid. 30 McCaul, M., Line in the Sand: Confronting the Threat at the Southwest Border. Majority Staff of the House Committee on Homeland Security, Subcommittee on Investigations. 31 Spener, D., Mexican-migrants smugglers: a cross border cottage industry, Journal of International Migration and Integration, Volume 5, Number 3/June, National Gang Intelligence Centre, US National Gang Assessment 2009, January Stratfor, Mexican Drug Cartels: Government Progresses and Growing Violence, December US Customs and Border Protection, Arrest of notorious Tijuana Alien Smuggler Successful through Bi-National Enforcement Efforts, 23 June United States District Court for the Northern District of Ohio Eastern Division, Indictment for Manuel Valdez-Gomez and others. 36 Ibid. 37 Ibid. 38 Each year, during the winter months (when seasonal migrants are home), the Mexican Migration Project randomly samples households in communities located throughout Mexico. After gathering social, demographic and economic information on the household and its members, interviewers collect basic information on each person s first and last trip to the USA. From household heads, they compile a year-by-year history of US migration and administer a detailed series of questions about the last trip northward, focusing on employment, earnings and use of US social services. (See princeton.edu/research/design-en.aspx). 39 The Mexican Migration Project Surveys are conducted among Mexican migrants who are back in Mexico to celebrate Christmas with their families. It is likely that these migrants cross the border more than once in a year. 40 Stratfor, Mexican Drug Cartels: Government Progresses and Growing Violence, December Rytina, N., Simanski, J., Apprehensions by the U.S. Border Patrol: , Homeland Security, Office of Immigration Statistics, Policy directorate, June Muenz, R., Europe: Population and Migration in 2005, Hamburg Institute of International Economics and Erste Bank; in Migration Information Source, June Collyer, M., Undocumented Sub-saharan African Migrants in Morocco 2004, Working Paper. Falmer: Sussex Centre for Migration Research, University of Sussex. 44 Carling, J., Unauthorized Migration from Africa to Spain, International Migration, Volume 45, Number 4, October 2007, pp. 3-37(35). 45 Ibid. 46 Ibid. 47 Moroccans resident in the provinces surrounding the two cities can travel freely to Ceuta and Melilla. According to the Schengen agreements, however, onward travel to the mainland has to be controlled by the customs authorities. 48 Valsecchi, R., Ceuta, the border-fence of Europe, New York: Case studies of transnational threats 303
310 ENDNOTES WorldPress, 25 June Carling, J., Unauthorized Migration from Africa to Spain, International Migration, Volume 45, Number 4, October 2007, pp. 3-37(35). 50 Valsecchi, R., Ceuta, the border-fence of Europe, New York: WorldPress, 25 June 2009; El Mundo, Primavera avalancha masiva en la frontera con Marruecos desde 2006, 22 June 2008; El Mundo, La guardia Civil intercepta a 30 inmigrantes que lograron entrar en Melilla, 27 October Ibid. 52 Valsecchi, R., Ceuta, the border-fence of Europe, New York: WorldPress, 25 June Carling, J., Unauthorized Migration from Africa to Spain, International Migration, Volume 45, Number 4, October 2007, pp. 3-37(35). 54 Ibid. 55 Monzini, P., Il traffico di migranti per mare verso l italia; Sviluppi Recenti ( ), CeSPI Centro Studi di Politica Internazionale, Working Papers, 43/ Ibid. 57 Ibid. 58 See 59 Ibid. 60 Monzini, P., Il traffico di migranti per mare verso l italia; Sviluppi Recenti ( ), CeSPI Centro Studi di Politica Internazionale, Working Papers, 43/ See 62 Monzini, P., Il traffico di migranti per mare verso l italia; Sviluppi Recenti ( ), CeSPI Centro Studi di Politica Internazionale, Working Papers, 43/2008; and 63 International Centre for Migration Policy Development, The East Africa Migration Route Report, Vienna See 65 Collyer, M., Undocumented Sub-saharan African Migrants in Morocco 2004, Working Paper. Falmer: Sussex Centre for Migration Research, University of Sussex. 66 El Pais, La guardian de los negreros del Sahara, El Pais, Carling, J., Unauthorized Migration from Africa to Spain, International Migration, Volume 45, Number 4, October 2007, pp. 3-37(35). 68 Ibid. 69 Monzini, P., Il traffico di migranti per mare verso l italia; Sviluppi Recenti ( ), CeSPI Centro Studi di Politica Internazionale, Working Papers, 43/ Ibid. 71 Ibid. 72 International Centre for Migration Policy Development, The East Africa Migration Route Report, Vienna Ibid. 74 Ibid. 75 Ibid. 76 Maroukis, T., Undocumented Migration, Counting the Uncountable. Data and Trends across Europe Country reports Greece, Clandestino, December 2008 (revised July 2009). 77 Icduygu, A., Toktas, S., How do smuggling and smuggling operate via irregular border crossings in the Middle East? International Migration, 40/6, 2002, pp Most of the sea apprehensions registered in the Rest of Italy in the nineties and early 2000s referred to South-East Europeans (Albanians and Kosovars) along the south-east coast of Italy. This flow has disappeared today. 79 This figure does not include the 1,600 people apprehended in Sardinia who do not appear to have been smuggled. 80 The NGO Fortress Europe has systematically registered what they deem to be reliable accounts of the number of migrants believed dead and missing since According to this database, in 2008 about 1,000 migrants died or disappeared trying to reach Europe by sea. 81 These statements are based on responses from member states to a questionnaire submitted as part of a review of the implementation of the United Nations Convention against Transnational Organized Crime and the Protocols thereto, CTOC/COP/2006/7/Rev The principle of non-refoulement is set out in the 1951 Refugee Convention article 33 (1): which states that No Contracting State shall expel or return ( refouler ) a refugee in any manner whatsoever to the frontiers of territories where his life or freedom would be threatened on account of his or her race, religion, nationality, membership of a particular social group or political opinion. Chapter 4 - Cocaine 1 US data for the year 2008 show that the lifetime prevalence rate of those using crack-cocaine among the rich, i.e. those earning US$ 75,000 or more a year, is 76% lower than among the very poor, i.e. those earning less than US$10,000 a year. In contrast, the lifetime prevalence of overall cocaine use, which includes cocaine HCL and crack-cocaine use, is still 28% higher in the USA among the rich, compared to the very poor. (US Department of Health and Human Services, Substance Abuse and Mental Health Services Administration (SAMHSA), 2008 National Survey on Drug Use and Health, Rockville MD 2009). The popularity of cocaine HCl among wealthier sections of society is also reflected in Canadian data. The household survey among adults in the province of Ontario (which accounts for more than a third of Canada s total population) found a life-time prevalence of cocaine use among the poor, i.e. those earning less than Can$ 30,000 a year of 4.5% in 2007, gradually rising to 9.1% among the rich, i.e. those earning more than Can$ 80,000 a year. ( Cocaine use mainly reflects cocaine HCl use in Ontario). In contrast, cannabis and other drugs follow an inverted J curve in Canada, as in most other countries. Thus, annual prevalence of cannabis use amounted to 21.1% of those earning less than Can$ 30,000 a year in Ontario in 2007 and fell to 10.3% among the middle class, i.e. those earning between Can$50,000 and Can$80,000 a year, before rising again slightly among the rich (i.e. those earning more than Can$80,000 a year) to 13%. (Canadian Centre for Addiction and Mental Health (CAMH), 2007 CAMH Monitor ereport, Addiction and Mental Health Indicators Among Ontario Adults, , Toronto The Library of Congress Country Studies: Colombia and CIA World Factbook, quoted in Colombia Drugs and Society, UNODC, 2009 World Drug Report, Vienna Ibid. 5 The average amount of heroin seized per seizure case in 2007 amounted to 0.26 kg, while the corresponding figure for cocaine was 3.1 kg, based on information from the 67 countries reporting both pieces of information in the UNODC Annual Reports Questionnaire. A year earlier, the average cocaine seizure even amounted to 4.7 kg (information from 82 countries) and was 26 times larger than the average heroin seizure (0.18 kg). 6 US Department of Health and Human Services, Substance Abuse and Mental Health Services Administration (SAMH- SA, 1995 National Household Survey on Drug Abuse, Report #18, Rockville, MD, SAMHSA, Results from the 2008 National Survey on Drug Use and Health. If the data are re-adjusted to the internationally comparable age group 15-64, the decline in the annual prevalence of cocaine use was from 3% in 2006 to 2.6% in National Drug Intelligence Center, National Drug Threat Assessment 2009, Dec Health Canada, Canadian Alcohol and Drug Use Monitoring Survey 2008, Ottawa The decline from 1.9% of the population age 15 and above in 2004 to 1.6% in 2008 is equivalent to a decline from 2.3% to 2.0% if the numbers are re-adjusted to the internationally comparable age group of those aged Institute for Defense Analyses (Barry Crane, Art Fries, A. Rex Rivolo, Amy Alrich, Tara Mc. Govern), History of the US Cocaine Market (Supply and Consumption), presentation 304 TRANSNATIONAL ORGANIZED CRIME THREAT ASSESSMENT
311 ENDNOTES given to the UNODC expert group meeting: The evidence base for drug control in Colombia: lessons learned, Bogota, 9-10 November National Drug Intelligence Center, National Drug Threat Assessment 2009, December US State Department, Bureau for International Narcotics and Law Enforcement Affairs, International Narcotics Strategy Report, Vol. I, March The issue of extraditing narco-traffickers played a key role in Colombian politics in the 1990s. Following ongoing terror by the narco-cartels, the Colombian authorities gave in and changed the constitution in 1991, forbidding extraditions. As violence did not stop, the Colombian Congress amended again in 1997 its constitution in a way that permitted the extradition of Colombian nationals. (See Article 35, amended in the Colombian Constitution, A.L. No. 01, 1997). 14 Mexico signed with the USA a bilateral Extradition Treaty in However, a revision of January 10, 1994, stated that extradition of Mexican nationals is prohibited except in exceptional circumstances. A subsequent decision (October 2, 2001) by the Supreme Court of Mexico introduced an additional barrier to extradition. It ruled that no extradition should be granted unless the requesting state gives assurances that the suspect would be eligible for parole as it saw the purpose of punishment in the subsequent rehabilitation of the convicted person. But this cannot ex-ante be expected from a US court. In 2002, a Mexican court even went a step further and ruled that assurances by an US prosecutor had no value because US judges are autonomous So they would apply the punishments established by the U.S. Penal codes. (See Escaping Justice Extradition / Foreign Prosecution, Mexico, ). 15 National Drug Intelligence Center, National Drug Threat Assessment 2009, December UNODC and Government of Colombia, Colombia Coca Cultivation Survey, Bogota, June R. Anthony and A. Fries, Empirical modelling of narcotics trafficking from farm gate to street, in United Nations Office on Drugs and Crime, Bulletin on Narcotics, Vol. LVI. Nos. 1 and 2, 2004, Illicit Drug Markets, pp Article 35, amended in the Colombian Constitution, A.L. No. 01, National Drug Intelligence Center, National Drug Threat Assessment 2009, December For example, new data are available on the number of cocaine-dependent people and heavy cocaine users (using cocaine more than 100 days a year) identified in the National Household Survey on Drug Use and Health (NHSDU). There are also new data on cocaine-positive tests among arrestees, provided in the Arrestee Drug Abuse Monitoring Program (ADAM II). See ONDCP, Arrestee Drug Abuse Monitoring Program, ADAM II 2008 Annual Report, Washington D.C., April This allows an updated definition and estimate of chronic use. 21 The calculation of the new data series of chronic users was based on the following model: data on heavy cocaine users (consuming cocaine on more than 100 days a year), plus ½ the number of dependent cocaine users, plus 1/3 of the arrested cocaine users. The occasional cocaine users were defined as the total number of users having consumed cocaine at least once over the last 12 months, less the chronic users. The logic for the definition of the chronic cocaine users is as follows: heavy cocaine users and dependent cocaine users (which are of similar magnitudes in the USA) can be considered to form part of chronic cocaine users. Simply adding the two variables will, however, lead to an over-estimate. Each data series, taken by itself, represents, in contrast, an under-estimate of the problem. The 2008 data from the ADAM II project, e.g. found that just 45% of the persons whose urine analysis had indicated cocaine use within the last 2 to 3 days, actually admitted to having used cocaine recently. Against this background, half of the dependent cocaine use variable was added to the heavy use variable. This combination is assumed to provide a more accurate reflection of the total number of heavy cocaine users who are still living in a household and are thus captured in household surveys. In addition, a certain proportion of those arrested, who consumed cocaine within the last two to three days, can be assumed to be chronic users of cocaine; a certain proportion of these people will no longer live in a normal household. Based on the analysis of the ADAM II data, it was established that this proportion could be close to 30%, which includes people who are homeless, living in shelters or have been institutionalized over the last few months, i.e. having lived in treatment facilities, in jails or in prison. (See ONDCP, Arrestee Drug Abuse Monitoring Program, ADAM II 2008 Annual Report, Washington D.C., April 2009). Such cocaine users would not be captured in a household survey. 22 The 31 grams of pure cocaine figure is the result of a multiplication of the number of chronic users (2.3 million) with a per capita use of 55 grams per year and a multiplication of the number of occasional users (3 million) with 14 grams per year, This yields a total at 165 tons for 5.3 million users, which gives 31 grams per user in 2008, down from 44 grams per user in 1998 and 66 grams per user in The per capita use figures were derived from the results of the ONDCP study on What America s Users Spend on Illegal Drugs, published in They found average per capita consumption for chronic users to have fallen from 141 grams in 1988 to 106 grams in 1990 and 78 grams in The model used assumed that the downward trend continued as availability of treatment facilities continued to improve (67 grams in 2007). The downward trend was assumed to have accelerated in 2008, as a result of falling purity levels (55 grams). The decline in per capita consumption for occasional users was less pronounced, from 16 grams in 1988 to 15 grams in 1998, and was thus assumed to have fallen only slightly, to 14 grams in The ONDCP model assumed that 20% of the monthly cocaine users consumed 0.5 grams of cocaine per day while the remaining 80% of the monthly cocaine users consume 0.5 grams per week. This gives an average consumption of 57.3 grams of cocaine per month. The non-monthly annual users are assumed in this model to consume just 4 grams per year. In the case of crack cocaine it is assumed that 30% of the monthly users consumed 0.75 grams per day and the remaining 70% of the monthly users consume 0.75 grams per week. This gives, on average, grams of crack cocaine per year for monthly users. The annual excluding monthly users are assumed to consume 6 grams per year. (See ONDCP, Cocaine Consumption Estimates Methodology, September 2008 (internal paper)). 24 The problem here is that the US household survey provides estimates on overall cocaine use (i.e. cocaine HCl and crackcocaine) and then gives an estimate on the number of crack cocaine users. Assuming that no crack user in the US consumes cocaine HCl, the cocaine HCl users can be calculated by subtracting crack cocaine users from all cocaine users; assuming that all crack-cocaine users also consume cocaine HCl, the cocaine HCl figure would be identical to the overall cocaine figure. Applying the first interpretation, cocaine use would have amounted to 140 tons in 2008; applying the second interpretation, cocaine use would have amounted to 164 tons in For data : ONDCP, What America s Users Spend on Illegal Drugs, December 2001; for 2001 data: Drug Availability Steering Committee, Availability Estimates in the United States, December 2002; for : UNODC estimates based on SAMHSA, 2008 National Survey on Drug Use and Health, Rockville MD 2009, and previous years; FBI, Uniform Crime Reports ( ) and ONDCP, Arrestee Drug Abuse Monitoring Program - ADAM II 2008 Annual Report, Washington D.C, April 2009 and ONDCP, Cocaine Consumption Estimates Methodology, September 2008 (internal paper). 26 Institute for Defense Analyses (Barry Crane, Art Fries, A. Rex Rivolo, Amy Alrich, Tara Mc. Govern), History of the US Cocaine Market (Supply and Consumption), presentation given to the UNODC expert group meeting: The evidence base for drug control in Colombia: lessons learned, Bogota, 9-10 November ONDCP, What America s Users Spend on Illegal Drugs, December 2001; Drug Availability Steering Committee, Availability Estimates in the United States, December 2002; Case studies of transnational threats 305
312 ENDNOTES SAMHSA, National Survey on Drug Use and Health, Rockville MD 2009, and previous years; FBI, Uniform Crime Reports ( ) and ONDCP, Arrestee Drug Abuse Monitoring Program - ADAM II 2008 Annual Report, Washington D.C, April 2009 and ONDCP, Cocaine Consumption Estimates Methodology, September 2008 (internal paper); Health Canada, Canadian Alcohol and Drug Use Monitoring Survey 2008 and previous years; CINADIC, Encuesta Nacional de Adicciones 2002, Ciudad Mexico, Secretaria de Desarrollo, Encuesta de Hogares, 2006; CONADIC and Instituto Nacional de Salud Pública, Encuesta Nacional de Adicciones, 2008, UNODC, Annual Reports Questionnaire Data / DELTA. 28 UNODC, 2009 World Drug Report, Vienna 2009; UNODC, Annual Reports Questionnaire Data / DELTA; ONDCP, What America s Users Spend on Illegal Drugs, December 2001; Drug Availability Steering Committee, Availability Estimates in the United States, December 2002; SAMHSA, National Survey on Drug Use and Health, Rockville MD 2009, and previous years; FBI, Uniform Crime Reports ( ) and ONDCP, Arrestee Drug Abuse Monitoring Program - ADAM II 2008 Annual Report, Washington D.C, April 2009 and ONDCP, Cocaine Consumption Estimates Methodology, September 2008 (internal paper), Health Canada, Canadian Alcohol and Drug Use Monitoring Survey 2008 and previous years, CINADIC, Encuesta Nacional de Adicciones 2002, Ciudad Mexico, Secretaria de Desarrollo, Encuesta de Hogares, 2006, CONADIC and Instituto Nacional de Salud Pública, Encuesta Nacional de Adicciones, For data : ONDCP, What America s Users Spend on Illegal Drugs, December 2001; for 2001 data: Drug Availability Steering Committee, Availability Estimates in the United States, December 2002; SAMHSA, National Survey on Drug Use and Health, Rockville MD 2009, and previous years; FBI, Uniform Crime Reports ( ) and ONDCP, Arrestee Drug Abuse Monitoring Program - ADAM II 2008 Annual Report, Washington D.C, April 2009; ONDCP, The Price and Purity of Illicit Drugs: , Report prepared by the Institute for Defense Analyses for ONDCP, Washington, July 2008; US Drug Enforcement Agency, based on STRIDE data. 30 For data before 2000: ONDCP, What America s Users Spend on Illegal Drugs, December 2001; for 2001 data: Drug Availability Steering Committee, Availability Estimates in the United States, December 2002; SAMHSA, National Survey on Drug Use and Health, Rockville MD 2009, and previous years; FBI, Uniform Crime Reports ( ) and ONDCP, Arrestee Drug Abuse Monitoring Program - ADAM II 2008 Annual Report, Washington D.C, April 2009; ONDCP, The Price and Purity of Illicit Drugs: , Report prepared by the Institute for Defense Analyses for ONDCP, Washington, July 2008; US Drug Enforcement Agency, based on STRIDE data, quoted in DEA Intelligence Division, Cocaine Shortages in U.S. Markets, November 2009 and US Bureau of Labor Statistics, Consumer Price Index (CPI); UNODC, Annual Reports Questionnaire Data. 31 The calculations were based on the available price data series, provided by ONDCP, ending for the year For 2008, the purity adjusted cocaine prices per gram, as reported by the DEA, were used. However, a comparison shows that the two price data series though both based on STRIDE data do not correspond, neither in absolute values nor in trends. While the ONDCP price data are supposed to reflect exclusively the retail level, based on the analysis of purity adjusted prices for purchases of 2 grams or less, the DEA price data series is based on the average price for all effected cocaine purchases, purity-adjusted and recalculated to represent the average price of cocaine per gram. Though differences in the methodology used can explain differences in the level, they do not really explain differences in trends. In fact, the bulk of the DEA prices concerns the retail level and the DEA prices should thus primarily - reflect changes in these prices as well. The differences in the two data sources is not only of academic interest. If the growth rates in prices, as revealed in the DEA data, were applied to the ONDCP price data set, starting as of 2007, the calculations suggest that the overall cocaine market would have slightly increased, from US$33.5 bn in 2006 to US$35 bn in 2008, as the strong increases in prices would have more than compensated the declines in consumption. Given the large number of reports suggesting that strong price increases took place over the period, the latter estimates appear to have a higher level of credibility. 32 Gross profits are defined here as the difference between the sales price of the drugs and the original purchase price. 33 Institute for Defense Analyses (Barry Crane, Art Fries, A. Rex Rivolo, Amy Alrich, Tara Mc. Govern), History of the US Cocaine Market (Supply and Consumption), presentation given to the UNODC expert group meeting: The evidence base for drug control in Colombia: lessons learned, Bogota, 9-10 November The 27 EU countries are: Austria, Belgium, Bulgaria, Cyprus, Czech Republic, Denmark, Estonia, Finland, France, Germany, Greece, Hungary, Ireland, Italy, Latvia, Lithuania, Luxembourg, Malta, the Netherlands, Poland, Portugal, Romania, Slovakia, Slovenia, Spain, Sweden and the United Kingdom. 35 The 4 EFTA countries are: Iceland, Liechtenstein, Norway and Switzerland. 36 UNODC, Annual Reports Questionnaire Data; Government reports; UNODC, 2009 World Drug Report; EMCDDA, Statistical Bulletin 2009; and United Nations, Department of Economic and Social Affairs, Population Division, World Population Prospects: The 2008 Revision, Ibid. 38 World Customs Organization, Customs and Drugs Report 2008, Brussels, June Serious Organized Crime Agency (SOCA), The United Kingdom Threat Assessment of Organised Crime, 2009/10, London, World Customs Organization, Customs and Drugs Report 2008, Brussels, June Maritime Analysis Operation Centre (MAOC(N), Statistical Analysis Report, Lisbon Ibid. 43 MAOC-N, Semi-Submersible Briefing Paper, Lisbon Ministerio de Sanidad y Consumo, 2008 National Report to the EMCDDA by the Reitox National Focal Point, Spain New Development, Trends and in-depth information on selected issues, Madrid, Ministerio del Interior, Secretaria de Estado de Seguaridad, Centro de Inteligencia contra el Crimen Organizado, Hashish and Cocaine in Europe, presentation given to UNODC, Vienna July No data for 2008 received for Poland, Scotland, Ukraine and Belarus assumed unchanged levels of seizures 47 Direction Générale de la Police Nationale, Direction Générale de la Police Judiciare, Office Central pour la Répression du Trafic Illicite des Stupéfiants (O.C.R.T.I.S.)., Usage et Trafic des Produits Stupéfiants en France en 2008, Paris, UNODC, Annual Reports Questionnaire Data. 49 US Department of State, International Narcotics Control Strategy Report, March Damian Zaitch, Trafficking Cocaine Colombian Drug Entrepreneurs in the Netherlands, Studies of Organized Crime, The Hague US Department of State, International Narcotics Control Strategy Report, March Ibid. 53 Ibid. 54 Serious Organised Crime Agency (SOCA), The United Kingdom Threat Assessment of Organised Crime, 2009/10, London, Ibid. 56 US Department of State, International Narcotics Control Strategy Report, March Presidenza del Consiglio dei Ministri, Dipartimento Politiche Antidroga, Relazione Annuale Al Parlamento Sullo Stato Delle Tossicodipendenze in Italia 2008, Rome Ibid. 59 Sample of arrested cocaine traffickers (n = 442) for which nationality was identified; number of all arrested cocaine traf- 306 TRANSNATIONAL ORGANIZED CRIME THREAT ASSESSMENT
313 ENDNOTES fickers in France in 2006: N = 2, UNODC, Annual Reports Questionnaire Data, Bundeskriminalamt, Polizeiliche Kriminalstatistik 2008, Wiesbaden Bundeskriminalamt, Organisierte Kriminalität, Bundeslagebild 2008, Wiesbaden Ibid. 64 These techniques are detailed in the following documents: United States Office of National Drug Control Policy, Cocaine Consumption Estimates Methodology, September 2008 (internal paper); Home Office, Sizing the UK market for illicit drugs, London 2001; Home Office, Measuring different aspects of problem drug use: methodological developments, Home Office Online Report 16/06, London 2006; UNODC, 2005 World Drug Report, Volume 1: Analysis, Vienna 2005: and European Centre for Social Welfare Policy, Two Worlds of Drug Consumption in Late Modern Societies, Vienna While the first model, developed by ONDCP, seems reasonable, it is based on assumptions, not on actual empirical data from European countries. The second model is based on empirical data, but they refer to the situation in one country (UK) which is not necessarily representative for the rest of Europe. The third model refers to cocaine use in West and Central Europe, but it is again derived from a number of underlying assumptions (such as effectiveness of law enforcement interventions and importance of regional proximity). The fourth model is based on empirical data from six cities in Europe, but applying the use rate found among marginalized users to all past month users is likely to result in an over-estimate. At the same time, a basic problem of household surveys, based on self-reports, is that they are most likely showing a substantial under-estimate of the extent of drug use. It remains difficult to judge to what extent these errors offset each other in the final calculation of the amounts consumed. 65 UNODC, Annual Reports Questionnaire Data; Government reports; UNODC, 2009 World Drug Report, Vienna 2009; EMCDDA, Statistical Bulletin 2009, Lisbon 2009; United Nations, Department of Economic and Social Affairs, Population Division, World Population Prospects: The 2008 Revision, 2009; European Centre for Social Welfare Policy, Two Worlds of Drug Consumption in Late Modern Societies, Vienna 2009; ONDCP, Cocaine Consumption Estimates Methodology, September 2008 (internal paper); Home Office, Sizing the UK market for illicit drugs, London 2001; Home Office, Measuring different aspects of problem drug use: methodological developments, Home Office Online Report 16/06, London 2006; UNODC, 2005 World Drug Report, Volume 1: Analysis, Vienna Current Euro values were transformed into constant Euros by applying the consumer price index for the Euro zone. 67 Current US dollar values were transformed into constant US dollar values by applying the US consumer price index. 68 The unweighted averages of reported purities for countries in West and Central Europe show a decline at the retail level from 59% in 1998 (range: 25% - 75%) to 47% in 2005 and 36% in 2008 (range: 16% - 52%). At the wholesale level the decline was from 78% (range: 55% -90%) in 1998 to 55% in 2008 (range: 26% - 80%). As some of the decline could have been simply the result of specific countries reporting in one year, and not in another year, a modified calculation model was introduced. This model assumes that the results of non-reporting countries remained basically unchanged from the previous year (or a later year) for which data are available. This was done to avoid changes in the overall average due to the reporting or nonreporting of countries in specific years. Using this approach for missing data, changes in the overall average only reflect actual changes in country-specific purity data. Based on this model, the average cocaine purities at the retail level in West and Central Europe declined from 55% in 1998 to 43% in 2005 and 37% in The wholesale purities declined according to this model from 72% in 1998 to 60% in 2005 and 56% in This masks, however, two conflicting trends. Retail prices in constant euros showed a downward trend over the period (-7%) which was followed by an increase of 9% over the period, reflecting first signs of supply shortage. Expressed in constant US$ terms, prices increased from US$218 per pure gram in 1998 to US$273 per pure gram in 2008 (+25%). Most of the increase took place over the period (+24%). 70 Expressed in constant US dollars, purity-adjusted wholesale prices rose from US$79,400 per kg in 1998 to US$87,300 in 2005 and US$111,600 per kg in 2008, equivalent to an increase of 28% over the period. 71 Based on the Annual Reports Questionnaire Data, about 55% of the seizures made in the Caribbean and 61% of the seizures made in South America excluding the Andean countries were linked to shipments towards Europe in 2008, up from 47% and 46% respectively in For seizures made in Africa it was assumed that the bulk of them was linked to shipments towards Europe. 72 Range: tons. 73 Range: tons. 74 UNODC, Annual Reports Questionnaire Data; Government reports; UNODC, World Drug Report 2009, Vienna 2009; EMCDDA, Statistical Bulletin 2009, Lisbon 2009; United Nations, Department of Economic and Social Affairs, Population Division, World Population Prospects: The 2008 Revision, 2009; European Centre for Social Welfare Policy, Two Worlds of Drug Consumption in Late Modern Societies, Vienna UNODC, Annual Reports Questionnaire Data; Government reports; UNODC, 2009 World Drug Report, Vienna 2009; EMCDDA, Statistical Bulletin 2009, Lisbon 2009; United Nations, Department of Economic and Social Affairs, Population Division. World Population Prospects: The 2008 Revision, 2009; Home Office, Sizing the UK market for illicit drugs, London 2001, Home Office, Measuring different aspects of problem drug use: methodological developments, Home Office Online Report 16/06, London 2006; European Centre for Social Welfare Policy, Two Worlds of Drug Consumption in Late Modern Societies, Vienna 2009; UNODC, 2005 World Drug Report, Volume 1: Analysis, Vienna Political Declaration and Plan of Action on International Cooperation towards an Integrated and Balanced Strategy to Counter the World Drug Problem, in United Nations Commission on Narcotic Drugs, Report on the fifty-second session (14 March 2008 and March 2009), E/2009/28; E/n.7/2009/12, pp Chapter 5 - Heroin 1 This newfound role was the result of political shifts both within the country and beyond its borders. Over the years, opium cultivation has been dramatically reduced in other South-West Asian countries due to domestic enforcement, starting with Turkey in the early 1970s and culminating with the crackdown on production in the Islamic Republic of Iran and Pakistan in The Soviet invasion of Afghanistan, occurring at roughly the same time as the enforcement efforts in the Islamic Republic of Iran and Pakistan and drought in South-East Asia, initiated a long period of instability from which the state is still attempting to recover. More recently, enforcement efforts in South-East Asia and South America have increased the relative importance of Afghan illicit production. 2 A recent UNODC study revealed that Afghans end up paying upwards of US$2.5 billion in corruption payments annually. 3 There has never been a national drug use survey in the country, but household surveys often fail to capture heroin users in any case, since their addiction leads to marginalization. The government registers known drug users, and while it is difficult to distinguish trends in the real number of drug users from trends in the efforts of the government to locate them, these numbers have been growing. 4 A rise in seizures in Kazakhstan and Uzbekistan in 2008 reversed this five-year slide. 5 An average of heroin wholesale kilogram prices in 17 European countries was about US$33,000 in The price of a wholesale kilogram of cocaine the same year in the USA was US$31, CARICC Information Bulletin No 14, March 3, Ekaterina Stepanova, Nezakonnyi oborot narkotikov i ego Case studies of transnational threats 307
314 ENDNOTES sviazi s konfliktami i terrorizmom; Afganistan i Tsentral naia Aziia, in Razoruzhenie i bezopasnost, ; Mezhdunarodnaia bezopasnost, novye ugrozy novogo tysiacheletiia (Moscow, 2003), pp in Sergey Golinov Drug Trafficking through the Russia-Kazakhstan Border: Challenge and Responses*. 8 Interview. 9 According to the head of the Tajik Drug Control Agency, approximately 20 large networks control the drug trade in Tajikistan, with many smaller groups in the border areas. 10 Interview, Tashkent, Uzbekistan, October See M. Madi, Drug Trade in Kyrgyzstan: structure, implications and countermeasures, Central Asian Survey (December 2004) 23 (3-4), p Pure heroin refers to heroin purity in Afghanistan, which is about 70%. UNODC s Russian Federation country office and the National Research Center on Drug Addiction (NRC) of the Federal Agency on Health and Social Development implemented a survey on drug treatment centres to understand the average heroin consumption per day per user in According to the survey results, average heroin consumption per user per day is around 1.87 gram with 5% purity or 0.13 gram of pure heroin (70%) per day per user. The estimated number of heroin addicts in the Russian Federation is 1.5 million, so the consumption of heroin was estimated at 70 tons per annum. 13 According to UNODC surveys, the average heroin consumption per user is gram per day. The cost of one gram of high quality heroin (around 70% purity) is around US$10-15 in Central Asia. But the typical cost for one gram of heroin ranges from US$1.5 2 at street level. Hence, this would indicate that street level heroin purity is between 7-10% ([1.5/15] * 70) in Central Asia. Based on daily consumption (1-1.5 grams per day), the total annual heroin consumption per user is estimated at grams (at 7-10% purity) per year, the equivalent of grams (midpoint 40 grams) of pure heroin. 14 UNODC, Drug Supply Reduction: An overview of drug supply and trafficking in Iran, ( situation/dsr/supply_reduction_trends_and_trafficking.pdf). 15 Information provided by UNODC consultants, June UNODC, Addiction, Crime and Insurgency - The transnational threat of Afghan opium, Vienna, Ibid. 18 Ibid. 19 This amount is equivalent to the estimated heroin consumption in Italy and Switzerland. 20 Interview UNAMA, Hirat, Afghanistan, October 30th. 21 Interview, Turkish law enforcement officials, October 12, EUROPOL Annual report, SOCA, The United Kingdom Threat Assessment of Organized Crime, October 2009, p While these estimates are the best currently available, one has to be aware that they are not based on direct research. This reflects the absence - for most countries - of any structured or organized data collection system to arrive at scientifically sound per capita consumption estimates. Heroin consumption estimates presented in this section should therefore be treated with caution. 25 UNODC, 2009 Afghanistan Opium Survey, Vienna, November United Nations Office for Drug Control and Crime Prevention, Global Illicit Drug Trends 2002, ODCCP Studies on Drugs and Crime Statistics, New York Islamic Republic of Iran, ECO DCCU, Country Profile 2005, 28 UNODC, Drug Policy and Results in Australia, October 2008, Drug_Policy_Australia_Oct2008.pdf. 29 United Nations, Commission on Narcotic Drugs (CND), Fifty-second session, Vienna, March 2009 (UN Doc. E/CN.7/2009/L.2). 30 United Nations, Commission on Narcotic Drugs, Report on the fifty-second session (14 March 2008 and March 2009), Official Records of the Economic and Social Council, 2009, Supplement No. 8A (E/2009/28/Add.1). 31 United Nations, Commission on Narcotic Drugs (CND), Fifty-second session, Vienna, March 2009 (E/ CN.7/2009/L.2). 32 United Nations, Commission on Narcotic Drugs, Report on the fifty-second session (14 March 2008 and March 2009), Official Records of the Economic and Social Council, 2009, Supplement No. 8A (E/2009/28/Add.1). Chapter 6 - Firearms 1 Ammunition is expended, and thus must be renewed, but contolling ammunition flows is much more challenging, because ammunition does not have unique identifying characteristics and ammunitions sales are not generally tracked. The number of ammunition manufacturers is also much greater than the number of firearm manufacturers. This makes ammunition acquisition relatively simple, and therefore less attractive for transnational organized crime groups. 2 Small Arms Survey, 2009, Shadows of war, Geneva, Switzerland: July These estimates are only for firearms, not their parts, accessories, and ammunition. It also does not include light weapons, such as heavy machine guns and grenades. 4 US Department of Justice, Federal Bureau of Investigation Criminal Justice Information Services Division, 2008 Crime in the United States, Expanded Homicide data, September US Department of Justice, Bureau of Justice Statistics Special Report, Weapon Use and Violent Crime, September Latin American News Security Update, latinnews.com, 18 November This does not take into account reserves, because the role of reserves varies so much between countries. In some countries, they gather and drill, while in others, they only exist on paper. 8 South African Police Service, The crime situation in South Africa: 2008/9 Annual Report. Pretoria: SAPS, 2009, p Ibid, p Dreyfus, P., N. Marsh, and M. de Sousa Nascimento, Tracking the guns: International diversion of small arms to illicit markets in Rio de Janeiro. Viva Rio, NISAT and ISER: Rio de Janeiro and Oslo, November 2006, pp Dreyfus, P., L. Guedes, B. Lessing,, A. Bandeira, M. de Sousa Nascimento, and P. Rivero, Small Arms in Rio de Janeiro: The Guns, the Buyback, and the Victims. Geneva: Small Arms Survey, 2008, p Statement available on the website of the Mexican presidency, 13 Instituto Nacional de Estadistica y Geografia (Mexico), mortality database. See: 14 Small Arms Survey, 2009, op cit. 15 United States Bureau of Justice Statistics (BJS), Firearms use by offenders. Washington, D.C.: United States Department of Justice, 2002, p United States Bureau of Justice Statistics, Guns used in crime. Washington, D.C.: United States Department of Justice, 1995, p BJS 2002, op cit., p US Department of the Treasury, Bureau of Alcohol, Tobacco & Firearms, Following the Gun: Enforcing Federal Laws Against Firearms Traffickers, June Klare, M. and Andersen, D., A Scourge of Guns: Diffustion of Small Arms and Light Weapons in Latin America, Federation of American Scientists, Cited in Marsh, N. Two side of the same coin? The legal and illegal trade in small arms. The 308 TRANSNATIONAL ORGANIZED CRIME THREAT ASSESSMENT
315 ENDNOTES Brown Journal of World Affairs, Vol. 9, No. 1, 2002, p PGR Traffico de armas. 21 GAO 2009 op cit. 22 See endnote GAO 2009, op cit. 24 GAO 2009, op cit., p Under surveillance, one prominent trafficker advised a police informant, If you get pulled over, two is no biggie. Four is a question. Fifteen is, What are you doing? McKinley, J. U.S. is arms bazaar for Mexican cartels. New York Times, 25 February RITA Research and Innovative Technology Administration, US Bureau of Transportation Statistics, Border Crossing Data US-Mexico GAO 2009 op cit. 28 Project Gunrunner Fact Sheet, September Attorney General of Mexico, Tráfico de Armas México-USA, 30 April Violence Policy Center, Indicted: Types of firearms and methods of gun trafficking from the United States to Mexico as revealed in US court documents. Washington, D.C.: Violence Policy Center, April 2009, p Small Arms Survey, 2007, Guns and the city, Geneva, Switzerland: August National Drug Intelligence Center, National Drug Threat Assessment Washington, D.C.: Department of Justice, December UNODC ARQ. 34 Attorney General of Mexico, Indicadores de Gestión en contra de la Delincuencia Organizada, April Chu, V and Krouse, W., Gun Trafficking and the Southwest Border. Washington, D.C.: Congressional Research Service, 29 July 2009, pp Norinco, the Chinese manufacturer, is one of the most commonly detected makes. See Federal Government of Mexico, Tráfico de Armas México-USA. 30 April Document available at the website of the Attorney General: pgr.gob.mx/prensa/documentos.asp. 37 A former deputy defence minister and member of parliament, Oleksandr Ihnatenko has stated that some $32 billion in Ukraine s stockpiles was stolen between See Kuzio, Tario, Ukraine s decade-long illegal trade in arms, Radio Free Europe/Radio Liberty, Crime, Corruption, and Terrorism Watch Vol. 2, No. 1, 10 January Badrak, V., Ukraine on Arms Market a View from Kiev, Eksport Voordzheniy, May-June 2001, p The Ukrainian Ministry of Defence states that the original figure upon independence in 1992 was 7.1 million SALW. The reduction of some 900,000 SALW between 1992 and 2007 is said to be due to commercial sale and destruction. The Ministry of Defence states that between 20-25% of the 900,000 were sold. However, these figures are disputed by a number of national and international sources. 40 The main manufacturers are the State Scientific and Technical Centre Artillery & Rifle Arms (SSTC ARA) and the Tasko Corporation, which is managed by former high-ranking Ukrainian army officers. The Lugansk-Patron (cartridge) company is gearing up for the large scale production of 5.45 mm calibre ammunition. For the export value, see Agence France-Presse, Ukraine s arms exports rise to $700 million in 2006: Report, Kiev, 11 July Also see Interfax-AVN, Ukraine arms exports, Kiev, 7 November According to the SIPRI 2009 Yearbook, there were 16 major armed conflicts were active in 15 locations around the world in 2008 (two more than in 2007), involving the following areas: Burundi, Somalia, Sudan, Colombia, Peru, USA, Afghanistan, India (Kashmir), Myanmar (Karen State), Pakistan, Philippines, Philippines (Mindanao), Sri Lanka ( Tamil Eelam ), Iraq, Israel (Palestinian territories), and Turkey (Kurdistan). The conflict in Myanmar, for example, has been ongoing since Many of these conflicts stretch back decades According to the 2009 UNDP Human Development Report. See: 43 IMF, quoted in Barley, R., Ukraine s economy is hostage to politics, Wall Street Journal, 19 January Watt, N., Arms trade: UK dealers accused of selling Soviet weapons to blacklisted countries, Guardian, 19 August, That company has been accused by the Czech government of trafficking rocket propelled grenades to the Democratic Republic of Congo and of illegal shipments of firearms to Slovakia. Prague Daily Monitor, Court: State harmed Imex Group in arms export deal, 16 October Wezeman, P., Arms Flows to the Conflict in Chad, SIPRI Background Paper, August See United Nations, Report of the Panel of Experts, United Nations S/2007/584, 10 September 2007, p See United Nations, Report of the Panel of Experts, Unied Nations S/2007/584, 10 September 2007 Annex V. Catalogue of outgoing correspondence by the Panel of Experts to Member States, United Nations, p NATO forces, as well as many other governments, use the 5.56x45mm round, with the 7.62x51mm in older weapons. The round used in the AK-47 is 7.62x39mm. Kenyan troops are armed with the FN-FAL and HKG3 Assault Rifles, which chamber the NATO round. 50 Lewis, M., Skirting the Law: Sudan s Post-CPS Arms Flows, Small Arms Survey report, September BBC, Nigeria Holds Ukraine Arms Plane, 18 June 2009; Radio Netherlands Worldwide, Nigeria grounds weapons plane, 18 June The aircraft used in the transfer UR- CAK serial number had recently been transferred to the Ukrainian air cargo company Meridian, formerly registered with Ukrainian and Moldovan-based air cargo companies Aerocom and Jet Line International, companies named in United Nations arms trafficking-related reports. 52 Griffiths, H. and Wilkinson, A., Guns, Planes and Ships: Identification of Clandestine Arms Transfers, SEESAC/UNDP, 2007, p Watt, N., Arms trade: UK dealers accused of selling Soviet weapons to blacklisted countries, Guardian, 19 August, Kupchinsky, R. (testimony), Helsinki Commission Hearing, United States Commission on Security and Cooperation in Europe. 55 Thomson, T., UK banker s link to arms plot, Guardian, 8 December Tkachenko, L., Soldiers Steal Eight Anti-Tank Missiles, Moscow, 2 July 1993 ITAR-TASS, in FBIS-SOV , 6 July 1993, p BASAPRESS Ukrainian Officer Arrested for Arms Trafficking, 25 August 1994, FBIS-SOV , 30 August 1994, p Moscow INTER-FAX, Officials Dismissed Over Illegal Arms Trade, 29 September 1992 in FBIS , p The Horn of Africa Bulletin, 18 April 1994, 2/94, p, Jane s Defence Weekly, IMINT tracks T-72 tanks toward South Sudan, 7 July Lewis, M., Skirting the Law: Sudan s Post-CPA Arms Flows, Small Arms Survey report, September 2009, pp Ibid., p Narodna Armiya, Ukraine: Defense Ministry Newspaper Views Arms Export Control Efforts, 13 January 2004, FBIS- SOV MosNews, Ukraine Reveals $32Bln Weapons Embezzlement, 19 December 2005; Soroka, M., Over 5 years $32 billion worth of arms were illegally removed from Ukraine, Podrobnosti.ua, 16 December Lewis, M., op cit., p. 39. Chapter 7 - Environmental resources 1 These issues are dealt with in the 1989 Basel Convention on the Control of Transboundary Movement of Hazardous Wastes and Other Wastes and their Disposal, and the 1987 Case studies of transnational threats 309
316 ENDNOTES Montreal Protocol on Substances that Deplete the Ozone Layer. 2 For example, TRAFFIC estimates that wild foods (animals as well as edible plants and herbs) contribute between 61-79% of non-rice food consumption by weight for rural people in the Lao People s Democratic Republic. See What s Driving the Wildlife Trade? A Review of Expert Opinion on Economic and Social Drivers of the Wildlife Trade and Trade Control Efforts in Cambodia, Indonesia, Lao PDR, and Vietnam, Traffic/the Wildlife Monitoring Network, October 2008, p For example, a recent analysis of poaching data in the Monitoring the Illegal Killing of Elephants (MIKE)database, examined 29 factors that could potentially influence levels of illegal killing, and identified five factors that strongly correlated with levels of illegal killing in Africa. These included ecosystem type (forests experiencing higher levels of illegal killing than savannah), actual levels of protection, ease of human access (e.g. through logging and mining roads), and the Corruption Perceptions Index (CPI) produced annually by Transparency International. The analysis further suggested that levels of illegal killing, statistically adjusted for effort and influencing factors, were highest in central Africa (where 63 % of carcasses were found to be illegally killed), followed by eastern (57 %), west (33 %) and southern Africa (19 %). See: 4 Ibid. 5 LAGA, May report (2006). Available at 6 The Citizen, Seven Dar residents arraigned over export of illegal ivory export, 22 July Interview INTERPOL Environmental Crime Manager, October IUCN / TRAFFIC / WWF, Status, conservation and trade in African and Asian rhinoceros: An IUCN, TRAFFIC and WWF Briefing for the 58 th Meeting of the CITES Standing Committee, Geneva, July (2009). Available at BIAZA, Poaching for traditional Chinese medicine. Available at Docs/chinese.pdf. 10 BBC, Kenya seizes coffin-stashed ivory. (July 2009), available at 11 Reported on SSN, 18/08/2006. From National Geographic, Record ivory cache traced to Zambia elephants (2006). Link was ivory-dna.html. 12 EIA, Made in China: How China s illegal ivory trade is causing a 21 st century African elephant disaster (2007). 13 Wasser, Samuel et al, Using DNA to track the origin of the largest seizure since the 1989 trade ban. Proceedings of the National Academy of Sciences of the Untied States of America (2007), cited in ibid, p Shepherd, Chris R., Overview of pangolin trade in South East Asia, in Pantel, S. and Chin, SY (Eds), Proceedings of the workshop on trade and conservation of pangolins native to south and southeast Asia. TRAFFIC South East Asia (2009). 15 Shepherd, Chris R., Overview of pangolin trade in South East Asia, in Pantel, S. and Chin, SY (Eds), Proceedings of the workshop on trade and conservation of pangolins native to south and southeast Asia. 16 WWF. Seized pangolins might have returned to illegal market (2009) Seized-pangolins. 17 Bushmeat Crisis Task Force (2009). Available at bushmeat.org/node/ Noted in National Geographic News, Asian Pangolins Being Consumed to Extinction (2009) available at and reported in Overview of pangolin trade in South East Asia TRAFFIC South East Asia (2009), however actual data not available to EIA at the time of writing. 19 Beijing, Shanghai, Tianjin, Wuhan, Haikou, Hangzhou, Guangzhou, Changsha, Fuzhou, Xi an, Chengdu, Nanjing, Nanning, Shenzhen, Dalian and Xiamen. 20 Beijing, Shanghai, Guangzhou, Kunming, Harbin and Chengdu. 21 Wasser, R, and P. Bei Jiao, Understanding Tthe Motivations: The First Step toward Influencing China s Unsustainable Wildlife Consumption. Beijing: TRAFFIC East Asia, January WWF, Ten to Watch in See: about_our_earth/species/about_species/problems/ten_to_ watch_in_2010/. 23 EIA A deadly game of cat and mouse Pers. comm. traders in Kathmandu 2002 and seizure tables in EIA Reports -Tiger Skin Trail- and Skinning the Cat. 25 Personal communication, Asian Big Cat traders - China EIA The Tiger Skin Trail. 27 EIA A deadly game of cat and mouse TRAFFIC, Elephant-size loopholes sustain Thai ivory trade, 19 June See: elephant-size-loopholes-sustain-thai-ivory-trade.html. 29 WWF. Available at 30 CITES Secretariat. SC53, Document Control of Trade in African Elephant Ivory. (2005). 31 TRAFFIC, Monitoring of illegal trade in ivory and other elephant specimens. Submission to CITES CoP 14. Item Available at index.shtml. See document for analysis methodology and breakdown of figures. 32 Milliken, T., R. Burn and L. Sangalakula, The Elephant Trade Information System (ETIS) and the Illicit Trade in Ivory. Submission to CITES CoP15 Doc A, October Wyler, L and P Sheikh, International illegal trade in wildlife: Threats and US policy. Washington, D.C.: Congressional Research Service, 2 February 2009, p 5. China is third, after Canada, in the document, but is second when combined with Hong Kong SAR. 34 Field interviews in South-East Asia conducted for this report. 35 Ibid. 36 Milliken, T., R. Emslie1 and B. Talukdar, African and Asian Rhinoceroses Status, Conservation and Trade: A report from the IUCN Species Survival Commission (IUCN/SSC) African and Asian Rhino Specialist Groups and TRAFFIC to the CITES Secretariat pursuant to Resolution Conf (Rev. CoP14) and Decision November Testimony of William Clark, Chairman of the INTERPOL Working Group on Wildlife Crime, before the United States House of Representatives Committee on Natural Resources, 5 March Broad, S for TRAFFIC, Wild Appetite (2008), available at p:// cmsdata.iucn.org/downloads/00_w_c_2008_02_wild.pdf. 39 See discussion of the seizures recorded in the ETIS database, below. 40 WWF. Available at 41 ETIS is the Elephant Trade Information System which is managed by the NGO TRAFFIC on behalf of CITES Parties. 42 Milliken, T., R. Burn and L. Sangalakula, The Elephant Trade Information System (ETIS) and the Illicit Trade in Ivory. Submission to CITES CoP15 Doc A, October There is little evidence of elephant poaching for ivory in Asia Female Asian elephants lack tusks altogether and even among the males, there is a very high percentage of genetic tusklessness. Asian elephants have also been domesticated as working animals, and so are valued assets. In contrast, both African elephant sexes carry ivory. 44 Martin, E, and D. Stiles, Care for the Wild, Illegal ivory trade continues: New surveys in Africa and Asia, available at www. cwiftp.co.uk/web_files/europeanivoryreportupdate.pdf. 45 The Congressional Research Service in the United States gives a price range of US$191 to US$900 per kilogram, compiled from a variety of sources. See Wyler, L and P Sheikh 2009 op 310 TRANSNATIONAL ORGANIZED CRIME THREAT ASSESSMENT
317 ENDNOTES cit. 46 Dependent upon size, ivory hankos were retailing for between US$16 and US$$667 in Japan in Ivory hankos weigh between 20 and 100 grams, This suggests a per gram value of between one and seven dollars for worked ivory. See Sakamoto, M, Japan Wildlife and Conservation Society, Black and grey: Illegal ivory in Japanese markets (2002). Available at from hyperlink at bottom. 47 For Wasser, SK, et al, Combating the illegal trade in African elephant ivory with DNA forensics (2008). Available at conservationbiology.net/data/ccbpdfs/wasser_08_consbio. pdf Also see Cites IUCN. Reuters, Low ivory prices at first legal auction in nine years (2008). Available at: com/article/companynews/idusls Note this is on the high end of the US estimates cited above. 48 Reuters, Low ivory prices at first legal auction in nine years (2008). Available at: 49 WWF. Available at Note, report addresses Asian ivory. 50 Excerpt from press release, Markets in China create a high demand for illicit ivory, which arrives either directly or through ports such as Hong Kong, Macao and Taiwan. Japan and Thailand are also important final destinations, whereas the Philippines mainly acts as a transit country linked to the major importers. Together, these seven countries and territories account for 62 per cent of the ivory recovered in the 49 largest seizure cases recorded by ETIS, in Asian crime syndicates based in Africa fuel illegal ivory surge, available at org/home/2007/5/10/asian-crime-syndicates-based-in-africafuel-illegal-ivory-su.html. Full report: Milliken, T., Burn, R. W. and Sangalakula, L. - TRAFFIC East/Southern Africa, The Elephant Trade Information System (ETIS) and the illicit trade in ivory: A report to the 14th meeting of the Conference of the Parties to CITES (2007) available from: eng/cop/14/doc/e pdf. 51 BIAZA, Poaching for traditional Chinese medicine. Available at Docs/chinese.pdf. Adds, In contrast, in May 1990, pure gold was worth about $13,000 per kilo. 52 Milliken, T., R. Emslie1 and B. Talukdar, African and Asian Rhinoceroses Status, Conservation and Trade: A report from the IUCN Species Survival Commission (IUCN/SSC) African and Asian Rhino Specialist Groups and TRAFFIC to the CITES Secretariat pursuant to Resolution Conf (Rev. CoP14) and Decision November EIA - A deadly game of cat and mouse Tiger most endangered, Hindustan Times, New Delhi, 6 Jan 2010: aspx?news_id= Pantel, S. and S.Chin Proceedings of the Workshop on Trade and Conservation of Pangolins Native to South and Southeast Asia. Singapore: TRAFFIC, 2008, p TRAFFIC, Final call for pangolins, 30 June See: 58 See for example WWF/World Bank Alliance, 13 Step Program To Combat Illegal Logging in Indonesia, January Indonesia-UK Tropical Forest Management Programme, Roundwood Supply and Illegal Logging, Personal communication, Chen Hin Keong, Global Forest Trade Programme Leader, TRAFFIC, 2 March Wörner, H., Purchasing of Sustainable Raw Material An Important Factor for the Vietnamese Forest Industry to Compete in the International Market: Importance of an functioning chain of custody. Paper presented at the XIII FAO World Forestry Congress, Buenos Aires 20 October org/es/programapost/trabajos/94-woerner%20heiko.pdf. 62 Personal communication, Chen Hin Keong, Global Forest Trade Programme Leader, TRAFFIC, 2 March See discussion on How big is the flow? below. 64 WWF, Illegal wood for the European market: An analysis of the EU import and export of illegal wood and related products (July 2008). Available at: what_we_do/safeguarding_the_natural_world/forests/forest_ publications/?2903/illegal-wood-for-the-european-market. Note the methodology for these estimates. See also: WWF, Failing the forests: Europe s illegal timber trade (2005). 65 WWF, Illegal wood for the European market: An analysis of the EU import and export of illegal wood and related products (July 2008). Available at: what_we_do/safeguarding_the_natural_world/forests/forest_ publications/?2903/illegal-wood-for-the-european-market. Note the methodology for these estimates. See also: WWF, Failing the forests: Europe s illegal timber trade (2005). 66 Xinhua, Former Guangxi vice chairman gets 18-year jail term for taking bribes, 1 September Vietnam furniture exports set to bounce back next year. Vietnam Business Finance News, 20 November For example, in 1999 it was reported that Vietnamese outdoor furniture manufacturers were buying large quantities of logs from neighbouring Cambodia, despite the fact that Cambodia had imposed a total export ban in Factories in just four towns were found to have stockpiled up to 260,000 cubic meters of Cambodian logs, and that at least 70 log trucks a day were crossing from Cambodia to Vietnam every day to fulfill demand for furniture exports. See Global Witness, Made in Vietnam - Cut in Cambodia, How the garden furniture trade is destroying rainforests, April In 2008, investigations into the Vietnamese garden furniture sector concluded that high demand from export-orientated manufacturers combined with low domestic timber production resulted in about 500,000 cubic metres of keruing and balau logs being imported from Laos each year, despite Laos having banned log exports. Many European companies were found to be buying uncertified keruing and balau wood outdoor furniture from Vietnamese companies directly importing illegal Laos logs. See EIA/Telapak, Borderlines: Vietnam s Booming Furniture Industry and Timber Smuggling in the Mekong Region, March Forest Trends, Timber Markets & Trade between Laos & Vietnam: A Commodity Chain Analysis of Vietnamese Driven Timber Flows, January 2010: documents/files/doc_2365.pdf). 70 Meyfroidt P and E. Lambin, Forest Transition in Vietnam and displacement of deforestation abroad. Proceedings of the National Academy of Sciences, In particular, the provinces of Attapeu, Savannakhet and Khammouane. 72 Cited in EIA Thousand Headed Snake. 73 Global Witness, A Disharmonious Trade: China and the Continued Destruction of Burma s Northern Frontier Forests. London: Global Witness, 21 October EIA Behind the Veneer. 76 EIA The Last Frontier. 77 EIA Behind the Veneer. 78 ibid. 79 ibid. 80 Report from Illegal Logging Info, May id=1443&it=news. 81 EIA Thousand Headed Snake. 82 See EIA The Last Frontier and Thousand Headed Snake, as well as ELSHAM, Army s Tainted Logging Business in Papua, July Wright, T., Indonesian Army Misses Deadline to Withdraw Business Activities. Wall Street Journal, 16 October Human Rights Watch, Unkept Promise: Failure to End Military Case studies of transnational threats 311
318 ENDNOTES Business Activity in Indonesia. 10 January 2010, p World Bank Strengthening Forest Law Enforcement and Governance - Addressing a Systemic Constraint to Sustainable Development, Seneca Creek Associates, LLC for American Forest & Paper Association, Illegal Logging and Global Wood Markets: The Competitive Impacts on the U.S. Wood Products Industry. 87 Global Witness (2005) A choice for China Ending the destruction of Burma s northern frontier forests. 88 Tempo Magazine, The Rape of Merbau, March World Health Organisation (Per capita total expenditure on health at international dollar rate, 2004). $118 per capita. 90 AFP, Activitists Protest Indonesia Deforestation, March UNEP Executive Director, Press Release, Authorities Step Up Action against Illegal Loggers Threatening the Last Orang- Utans, UNEP The last stand of the orangutan, European Parliament press release, MEPs adopt rules to keep illegal timber off the EU market, April EIA, Receiving stolen goods: Why the UK must legislate against the trade in illegal timber (2007). 96 Friends of the Earth, European league table of imports of illegal tropical timber, Note the methodology in generating these figures. Estimates that, for example, Belgium directly imported 0.58% of Indonesia s illegal tropical timber, and the EU of 2% of Indonesia s tropical timber and 0.5% of Malaysia s tropical timber, using 1999 data. This trade continues: A 2008 ITTO report listed EU imports of hardwood rough sawn lumber from Malaysia at 157,472 cubic meters and Indonesia at 21,836 cubic meters over the first six months of It notes a significant slowdown in European hardwood imports from around the globe, against a rise in plywood and hardwood flooring imports See ITTO Market Information Service, ITTO Tropical Timber Market (TTM) Report, Volume 13 Number 18 (16-30 September 2008), p Seneca Creek Associates, LLC for American Forest & Paper Association, Illegal Logging and Global Wood Markets: The Competitive Impacts on the U.S. Wood Products Industry. 98 WWF, Illegal wood for the European market: An analysis of the EU import and export of illegal wood and related products. WWF: Frankfurt am Main, 2008, p Global Witness, A Disharmonious Trade: China and the Continued Destruction of Burma s Northern Frontier Forests. London: Global Witness, 21 October White, A., X. Sun, K. Canby, J. Xu, C. Barr, E. Katsigris, G. Bull, C. Cossalter, and S. Nilsson, China and the Global Market for Forest Products: Transforming Trade to Benefit Forests and Livelihoods. Washington, DC: Forest Trends, Center for Chinese Agricultural Policy, and CIFOR, TRAFFIC has proposed that all timber imports has to be accompanied by a customs export declaration form from the exporting country. This would allow comparison of timber export data with import data, possibly flagging illegal trade. 103 CITES COP 15 - CoP15 Doc TRAFFIC has proposed that all timber imports has to be accompanied by a customs export declaration form from the exporting country. This would allow comparison of timber export data with import data, possibly flagging illegal trade. 105 CITES COP 15 - CoP15 Doc Chapter 8 - Counterfeit products 1 For the purposes of this chapter, the sale of pirated CDs and DVDs is considered counterfeiting, because the goods are packaged in such a way that the buyer may believe they are purchasing authorized material. 2 World Customs Organization, Customs and IPR Report International Chamber of Commerce-Commercial Crime Services, Counterfeiting Intelligence Bureau. 4 Dryden, J. Counting the Cost: The Economic Impacts of Counterfeiting and Piracy Preliminary Findings of the OECD Study, January Dryden emphasized that this estimate does not include the very large volumes of fakes produced and consumed within economies, where in some sectors, like music, domestic counterfeiting and piracy appear to predominate. It does not include the (certainly higher) prices charged to final purchasers, nor the (higher still) prices of equivalent genuine articles. It does, however, include pirated material, which is broader than the definition used in this chapter. 5 One analyst argues that the mainland Chinese manufacturing model is closer to that found in Taiwan Province of China than that found in Japan or South Korea, countries where the state has thrown its weight behind a few large firms. In Taiwan Province of China, manufacturing has been characterized by thousands of small firms, a few of which grew large. [Mainland] China is, of course, vaster than the other countries combined, but its export-oriented companies are small Even Foxconn, [Mainland] China s largest exporter, was only No. 206 on last year s Fortune Global 500 list of the biggest companies in the world. Fallows, J. China makes, the world takes. The Atlantic Monthly, August China customs website: 7 See: 8 Xinhua, China deals with 200,000 cases involving counterfeit, shoddy goods in 2009, 5 January Xinhua, China seizes counterfeit commodities worth 1.55 bln yuan in 2008, 14 March Xinhua, Transnational software pirating case adjudged in Shanghai, 18 June Xinhua, Chinese believe corruption biggest blot on nation s image: poll, 6 January China customs website, Statistice of China customs seizures , see: 13 World Customs Organization, 2008, op cit. 14 United States Customs, Intellectual Property Rights Seizure Statistics: Fiscal Year European Commission, Report on EU Customs Enforcement of Intellectual Property Rights, Results At The European Border Brussels: European Commission, European Commission, op cit, p European Commission, op cit., p The United Arab Emirates was the second most common source of counterfeits, accounting for 12% of the items seized, and the leading source of counterfeit cigarettes. The leading source of counterfeit medicines, however was India (some 1,500 cases in 2008), with lifestyle drugs being prevalent among those seized. 19 European Commission, op cit., p European Commission, op cit. 21 European Commission, Enterprise and Industry, Footwear statistics, see: statistics/. 22 Phillips, T., Knockoff: The deadly trade in counterfeit goods. London: Kogan Page, 2005, p Xinhua, Well-known Beijing market s manager arrested in selling fake LV bags, 13 February Xinhua, Police seize 20-mln-yuan worth counterfeits in S China, 25 August La Cerca, La Policía Nacional interviene más de artículos infantiles y juveniles falsificados dirigidos al mercado navideño, 8 December China Daily, Suspects charged for forging Gillette, 19 September Tilley, Nick and Hopkins, Matt, Business views of organised crime, UK Home Office, December This includes US$205 million for 10,288 seizures from mainland China, US$27 million for 1680 seizures from Hong Kong, China, and US$3 million for 279 seizures from Taiwan 312 TRANSNATIONAL ORGANIZED CRIME THREAT ASSESSMENT
319 ENDNOTES Province of China 29 European Commission, op cit 30 European Commission, Enterprise and Industry, Footwear statistics, see: statistics/. 31 This would suggest the illicit market is 5% the size of the licit one, which is in keeping with the popular 4% to 7% figures cited at the start of this chapter. These figures seem high when referring to all global commerce, but may be reasonable when applied to trade from China, given the large share of detected counterfeits (some two thirds) departing from this country. 32 Cámaras (presentation), El consumidor ante las falsificaciones y las imitaciones, andema/pdf/los_consumidores_ante_las_copias_2006 version_final 2ppt.pdf 33 Ledbury Research, Consumer Survey: Clothing and Footwear. London: Alliance Against IP Theft, 2007; Ledbury Research, Consumer Survey: Fragrance Sector. London: Alliance Against IP Theft, 2007; Ledbury Research, Consumer Survey: Watch Sector. London: Alliance Against IP Theft, For example, operation MEDI-FAKE in late 2008 detected more than 34 million illegal medicines in a two-month period, including antibiotics, anti-cancer, anti-malaria and anti-cholesterol medicines, as well as painkillers, Viagra and drug precursors. See: European Commission press release, Customs: Millions of illegal medicines stopped by MEDI-FAKE action, 16 December World Health Organization, Counterfeit Medicines: An update on estimates, 15 November Newton, Paul; Green, Michael; Fernandez, Facundo; Day, Nicholas; and White, Nicholas, Counterfeit anti-infective drugs, The Lancet Infectious Diseases, Vol. 6 Issue 9, September 2006, p Excludes unaudited markets, and Russia, Ukraine and Belarus audited data. Sales cover direct and indirect pharmaceutical channel pharmaceutical wholesalers and manufacturers. The figures above include prescription and certain over-thecounter data and represent manufacturer prices. IMS, Global Pharmaceutical Sales by Region, 2007 (see: imshealth.com/deployedfiles/imshealth/global/content/staticfile/top_line_data/globalsalesbyregion.pdf). 38 Pharmaceutical Security Institute, Geographic Distribution (see: 39 Newton, P, et al, A Collaborative Epidemiological Investigation into the Criminal Fake Artesunate Trade in South East Asia. PLoS Med, Vol 5, No 2, Sengaloundeth, S., et al, A stratified random survey of the proportion of poor quality oral artesunate sold at medicine outlets in the Lao PDR implications for therapeutic failure and drug resistance. Malaria Journal, Vol 8, No 172, Newton, P, et al, op cit. 42 See Malaria: Fake antimalarial drugs analysis highlights threat to global health, Biotech Business Week, 25 February INTERPOL, Police across Southeast Asia target counterfeit medicines in multi-agency operation. Press release, 17 November INTERPOL, INTERPOL applauds Southeast Asia Operation Storm II s success in disrupting trade of counterfeit medical products. Press release, 27 January Taylor, RB et al, Pharmacopoeial quality of drugs supplied by Nigerian pharmacies. The Lancet, Vol. 357, June 16, Ofori-Kwakye, K, Y. Asantewaa and O. Gaye, Quality of Artesunate Tablets Sold in Pharmacies in Kumasi, Ghana. Tropical Journal of Pharmaceutical Research, Vol 7, No 4, pp , Maponga, Charles and Ondari, Clive. The quality of antimalarials: A study in selected African countries. WHO, Maponga, Charles and Ondari, Clive, op.cit. 49 INTERPOL, Operation Mamba (IMPACT) targeting counterfeit medicines in Tanzania and Uganda, 29 October INTERPOL, Arrests and major seizure of counterfeit medicines across Egypt follow international co-operation with INTERPOL and IMPACT stake-holders, 29 May See The Problem of Counterfeit Medicines in the Commonwealth, Commonwealth Business Council Working Group on Healthcare, May Aldhous, Peter, Counterfeit pharmaceuticals: In the line of fire, Nature, Vol. 434, p. 134, 10 March BBC News, Belgians seize Africa-bound drugs, 3 October 2008: 54 Personal communication, Paul Newton,. December Nwezeh, K. Fake Drugs - China Apologises to The Government. This Day (Nigeria), 21 September Dasgupta, S. Death for 6 Chinese traders faking Made in India tags, The Times of India, Dec 10, This figure differs from that shown in the graph for definitional reasons. 58 Chinese Government White Paper, Overview of Drug Supply, Quality and Safety (see: whitepaper/ /20/content_ htm). 59 National Bureau of Statistics of China, Yearly Data (see: 60 Government of India, Ministry of Commerce and Industry, Import/Export database (see: ecom.asp). 61 A 2007 survey found that counterfeit goods were one of the most serious problems facing rural consumers. See: Xinhua, Survey: Overall consumption environment in rural China on improvement, 11 December Xinhua, Fake diabetes drug hospitalizes 9 in NW China s Xinjiang, 3 February Under Section 17-B of the Indian Drugs and Cosmetics Act, 1940, a drug is considered spurious if the label or container bears the name of an individual or company purporting to be the manufacturer of the drug, which individual or company is fictitious or does not exist; or it purports to be the product of a manufacturer of whom it is not truly a product or it is manufactured under a name which belongs to another drug. See Sheth, P. et al, Extent of spurious (counterfeit) medicines in India. New Delhi: SEARPharm, Ibid. 65 Ibid. 66 Xinhua, China blacklists 46 websites for selling fake TCM, 23 March Bogdanich, W., Chinese chemicals flow unchecked onto world drug market. New York Times, 31 October Xinhua, China s ministries work together to bust online counterfeit drug dealers, 15 May Bate, R., The deadly world of fake drugs. Foreign Policy, October Personal communication from a contributing editor at Pharmabiz, a Mumbai-based pharmaceutical trade magazine 71 Drug authorities file case against Shree Vinayak Trading Co for selling spurious drugs. Phamabiz. (Mumbai), 16 November The consignments consisted of 500 kg of roxithromycin from Sinobright Development International in the name of licensed manufacturer Zhejiang Zheuan of China and addressed to Envee Drugs, Ahmedabad, 400 kg of progesterone imported from Thiango International on behalf of a manufacturer called Shen Zhou Pharmaceutical and destined for Mumbai s Khokhani & Co., and two tons of cimetidine shipped by Zhe Zhiang Chemicals Importers and Exporters for a manufacturer called Jiangxi Juermei that was addressed to Sheetal Pharma of Mumbai. All the three consignments were imported by unregistered manufacturers who falsely used the name of producers that were registered in India. They were imported classified as chemicals so as to avoid routine monitoring for pharmaceutical products. The total worth of the seizures was around US$220,000. See Pharmabiz source above. 73 Judicial Protection of IPR in China, GlaxoSmithKline Case Study (see: Case studies of transnational threats 313
320 ENDNOTES news14.htm). 74 International Narcotics Control Board, Report for 2009, p Bertil Lintner, personal communication, November Ibid. 77 Interviews with law enforcement source in India, November Interviews with law enforcement sources in Asia, November China State Food and Drug Administration (see: sda.gov.cn/ws01/cl0108/41834.html). 80 See Intellectual Property violations seizures at China customs website: 81 See, for example, Episcom Business Intelligence Ltd., The Outlook for Pharmaceuticals in South East Asia to 2013, September Bennett, S., J. Quick, and G. Velásquez, Public-Private Roles in the Pharmaceutical Sector: Implications for equitable access and rational drug use. Geneva: World Health Organisation, 1997, p 39. Chapter 9 - Maritime Piracy 1 According to Article 101 of the United Nations Convention on the Law of the Sea, piracy is: (a) any illegal acts of violence or detention, or any act of depredation, committed for private ends by the crew or the passengers of a private ship or a private aircraft, and directed: (i) on the high seas, against another ship or aircraft, or against persons or property on board such ship or aircraft; (ii) against a ship, aircraft, persons or property in a place outside the jurisdiction of any State; (b) any act of voluntary participation in the operation of a ship or of an aircraft with knowledge of facts making it a pirate ship or aircraft; (c) any act of inciting or of intentionally facilitating an act described in subparagraph (a) or (b). 2 According to Articles 91 and 92 of the Convention on the Law of the Sea, Ships have the nationality of the State whose flag they are entitled to fly, and Ships shall sail under the flag of one State only and shall be subject to its exclusive jurisdiction on the high seas. 3 International Expert Group on Piracy off the Somali Coast, Piracy off the Somali Coast: Final Report, November 2009, p Congressional Research Service, Piracy off the Horn of Africa, April 24, 2009, p UN-IRIN, More Somali Migrants Drown off Yemeni Coast, March 1, Maritime Resources Assessment Group, Review of Impacts of Illegal, Unreported and Unregulated Fishing on Developing Countries, Synthesis Report for the UK s Department for International Development (DFID), July Azim, Sayyid, African Businesses Hit Hard; Tourists Scared Off By Pirates, Somaliland Times, Issue 200, November 13, International Expert Group on Piracy off the Somali Coast, Piracy off the Somali Coast: Final Report, November 2009, p For more information, see the WFP website, for example Security stops WFP in southern Somalia, 6 January International Expert Group on Piracy off the Somali Coast, Piracy off the Somali Coast: Final Report, November 2009, p ICC-International Maritime Bureau. Piracy and armed robbery against ships: 2009 Annual Report, January EU NAVFOR Somalia, Maersk Alamaba evades pirate attack off Somali coast, 18 November BBC News, Somali Piracy Reduces Tuna Haul, January 22, Ibid. 15 International Expert Group on Piracy off the Somali Coast, Piracy off the Somali Coast: Final Report, November 2009, p Ibid, p Ibid, p International Maritime Bureau. Piracy and armed robbery against ships: 2009 Annual Report, January 2010, p Assuming a vessel worth US$100 million. Marcus Baker, head of the marine practice at Marsh insurance broker, quoted in As Somalian pirates widen their horizons, the cost of ship insurance is soaring, Times Online, 1 December United States Department of Energy, Energy Information Administration, World Oil Transit Chokepoints: Bab el-mandab, January Congressional Research Service, Piracy off the Horn of Africa, April 24, 2009, p International Expert Group on Piracy off the Somali Coast, Piracy off the Somali Coast: Final Report, November Ibid, p Ibid, p Congressional Research Service, Piracy off the Horn of Africa, April 24, 2009, p ICC-IMB 2008 Report and ICC-IMB 2009 Report. 27 International Expert Group on Piracy off the Somali Coast, Piracy off the Somali Coast: Final Report, November 2009, p Reported Incidents of Somali Pirate Attacks and Hijackings in the Gulf of Aden for 2008, UISAT/UNITAR, 13 January Available at: Lowres_v7.pdf 29 Ibid, p ICC-International Maritime Bureau. Piracy and armed robbery against ships: 2009 Annual Report, January International Expert Group on Piracy off the Somali Coast, Piracy off the Somali Coast: Final Report, November 2009, p Ibid, p United Nations Security Council, Report of the Secretary- General pursuant to Security Council resolution 1846 (2008), S/2009/146, 16 March 2009, para Ibid. 35 Höges, Clemens., Looking for the Good Guys off the Somali Coast, Spiegel, June 10, International Expert Group on Piracy off the Somali Coast, Piracy off the Somali Coast: Final Report, November 2009, p United Nations Security Council, Report of the Secretary- General pursuant to Security Council resolution 1846 (2008), S/2009/146, 16 March 2009, para Wright, Robert, Somali pirates free tanker after record ransom, Financial Times, 18 January Harper, Mary, Chasing the Somali Piracy Money Trail, BBC, May 24, BBC claims that these figures were taken from a UN report which had gathered information from pirates based in the north-eastern village of Eyl. 40 Quoted in van Huijgevoort, Saskia, Piracy: coast guards become pirates, Radio Netherlands Worldwide, July 1, SC Resolution 1816 (June 2008) authorized states acting in cooperation with and with prior notification of the TFG to enter the territorial waters of Somalia for the purpose of repressing acts of piracy and armed robbery at sea and to use, within the territorial waters of Somalia, in a manner consistent with action permitted on the high seas with respect to piracy under relevant international law, all necessary means to repress acts of piracy and armed robbery. The initial authorization lasted for six months from June Resolution 1838, adopted in October 2008, called on states with military capabilities in the region to contribute to anti-piracy efforts and clarified the standing of the authorization contained in Resolution 1816 with respect to international law. At the request of the TFG, the mandate established in Resolution 1816 was extended for 12 months in December 2008 in Resolution In December 2008, Resolution 1851 expanded the mandate by authorizing states and regional organizations that are acting at the TFG s request to undertake all necessary 314 TRANSNATIONAL ORGANIZED CRIME THREAT ASSESSMENT
321 ENDNOTES measures that are appropriate in Somalia [italics added] for the purpose of suppressing acts of piracy and armed robbery at sea. Resolution 1846 authorized the provision of technical assistance to TFG personnel and forces to enhance the capacity of these States to ensure coastal and maritime security in accordance with procedures outlined in Resolution Under paragraphs 11 and 12 of Resolution 1722, the supply of technical assistance to Somali security sector institutions is authorized provided that prior case-by-case notification is made to the U.N. arms embargo Committee for Somalia. Resolution 1851 provides similar authorization to weapons and military equipment destined for the sole use of Member States and regional organizations undertaking authorized antipiracy operations in Somali waters. The transfer of weaponry to Somali maritime security forces would require separate authorization from the Security Council. The African Union s Peace, Security Council and the TFG have requested that the broader U.N. arms embargo be amended or lifted in order to improve the capabilities of forces fighting Islamist insurgents. 42 Kenya will try Somali pirates, BBC, April SC Resolution 1816 (June 2008) authorized states acting in cooperation with and with prior notification of the TFG to enter the territorial waters of Somalia for the purpose of repressing acts of piracy and armed robbery at sea and to use, within the territorial waters of Somalia, in a manner consistent with action permitted on the high seas with respect to piracy under relevant international law, all necessary means to repress acts of piracy and armed robbery. The initial authorization lasted for six months from June Resolution 1838, adopted in October 2008, called on states with military capabilities in the region to contribute to anti-piracy efforts and clarified the standing of the authorization contained in Resolution 1816 with respect to international law. At the request of the TFG, the mandate established in Resolution 1816 was extended for 12 months in December 2008 in Resolution In December 2008, Resolution 1851 expanded the mandate by authorizing states and regional organizations that are acting at the TFG s request to undertake all necessary measures that are appropriate in Somalia [italics added] for the purpose of suppressing acts of piracy and armed robbery at sea. Resolution 1846 authorized the provision of technical assistance to TFG personnel and forces to enhance the capacity of these States to ensure coastal and maritime security in accordance with procedures outlined in Resolution Under paragraphs 11 and 12 of Resolution 1722, the supply of technical assistance to Somali security sector institutions is authorized provided that prior case-by-case notification is made to the U.N. arms embargo Committee for Somalia. Resolution 1851 provides similar authorization to weapons and military equipment destined for the sole use of Member States and regional organizations undertaking authorized antipiracy operations in Somali waters. The transfer of weaponry to Somali maritime security forces would require separate authorization from the Security Council. The African Union s Peace, Security Council and the TFG have requested that the broader U.N. arms embargo be amended or lifted in order to improve the capabilities of forces fighting Islamist insurgents. 44 Kenya will try Somali pirates, BBC, April 16, Chapter 10 - Cybercrime 1 One estimate places the number of Internet users at some 1.5 billion people in For recent statistics see: itu.int/itu-d/icteye.default.asp. 2 For a brief history of the Internet, including its military origins, see: Leiner, Cerf, Clark, Kahn, Kleinrock, Lynch, Postel, Roberts, Wolff, A Brief History of the Internet, available at: 3 Regarding approaches to define and categorize cybercrime see: Australian Institute for Criminology, Cybercrime, Definition and General Information available at: aic.gov.au/topics/cybercrime/definitions.html; Council of Europe, Explanatory Report to the Convention on Cybercrime, No. 8.; Gordon/Ford, On the Definition and Classification of Cybercrime, Journal in Computer Virology, Vol. 2, No. 1, 2006, page 13-20; Chawki, Cybercrime in France: An Overview, 2005, December 2005, Wilson, Botnets, Cybercrime, and Cyberterrorism: Vulnerabilities and Policy Issues for Congress, Congressional Research Service, January 2008, page 4; Cybercrime, Report of the Parliamentary Joint Committee on the Australian Crime Commission, 2004, page 5; Hayden, Cybercrime s impact on Information security, Cybercrime and Security, IA-3, page 3; Hale, Cybercrime: Facts & Figures Concerning this Global Dilemma, CJI 2002, Vol. 18; Forst, Cybercrime: Appellate Court Interpretations, 1999, page 1. 4 Canadian Security Intelligence Service, Transnational criminal activity: a global context, 2000; Choo, Trends in Organized Crime, 2008, page Ealy, A New Evolution in Hack Attacks: A General Overview of Types, Methods, Tools, and Prevention, page 9. 6 Arthur, Charles, Alleged controllers of Mariposa botnet arrested in Spain, Guardian, 3 March In order to limit the availability of such tools, some countries criminalize the production and offer of such tools. An example of such a provision can be found in Art. 6 of the European Convention on Cybercrime. 8 See Development Gateway s Special Report, Information Society Next Steps?, 2005, available at: developmentgateway.org/special/informationsociety. 9 Presentation of Tom Ilube at the Wilton Park Conference Tackling Organised Crime: Assessing the Impact of the Economic Crisis, 26 June For more details on the automation of spam mails and the challenges for law enforcement agencies, see: Berg, The Changing Face of Cybercrime New Internet Threats create Challenges to law enforcement agencies, Michigan Law Journal 2007, page Ealy op. cit. p. 9 et seq. 12 The Online-Community HackerWatch publishes regular reports on hacking attacks. Based on their sources, more than 250 million incidents were reported in only one month (August 2007). Source: 13 See CC Cert, Overview of Attack Trends, 2002, page The Mariposa botnet. See Arthur, op.cit. 15 Nearly 50% of all fraud complains reported to the United States Federal Trade Commission are related to a amount paid of less than US$25. See Consumer Fraud and Identity Theft Complain Data January December 2006, Federal Trade Commission, available at: pubs/top10fraud2006.pdf. 16 This includes losses due to intellectual property theft, and involves losses to companies, rather than gains to cybercriminals. See: 009/ _063500_j.html. 17 See footnote Finklea, Identity Theft: Trends and Issues, CRS, 2009, R40599, page Martin, Phishing for Anwers: Exploring the Factors that Influence a Participants Ability to Correctly Identify , 2008, page Consumer Fraud and Identity Theft Complaint Data, January December 2005, Federal Trade Commission, Credit card information can be exploited electronically (by placing orders online, for example) or by imprinting this information on blank credit cards. In both cases, the problem remains of cashing out on goods so acquired, but there are groups who specialize in this process. Large networks are also required for extracting cash advances, which typically have a daily limit and may require secondary forms of identification. 22 Symantec, Report on the Underground Economy, July 07 June 08, 2008, page See: Epstein/Brown, Cybersecurity in the Payment Card Industry, University of Chicago Law Review, Vol. 75, 2008, page The following section describes -based phishing attacks, compared to other phishing scams, which may, for example, be based on voice communications. See: Gonsalves, Phishers Snare Victims with VoIP, Regarding the different phases of phishing see: OECD Scoping Paper on Online Identity Theft, Ministerial Background Case studies of transnational threats 315
322 ENDNOTES Report, DSTI/CP(2007)3/FINAL, page APWG Phishing Activity Trends Report, 1st Half 2009, Page Ibid p Phishing shows a number of similarities to spam s. It is thus likely that organised crime groups that are involved in spam are also involved in phishing scams, as they make use of the same spam databases. Regarding spam, see above: Offenders have developed advanced techniques to prevent users from realising that they are not on the genuine website. For an overview about what phishing mails and the related spoofing websites look like, see: phishing_archive/phishing_archive.html. 29 Martin, op. cit., page See Dhamija/Tygar/Hearst, Why Phishing Works, page 1, available at: why_phishing_works.pdf; that refers to Loftesness, Responding to Phishing Attacks, Glenbrook Partners (2004). 31 Gercke, Criminal Liability for Phishing and Identity Theft, Computer und Recht, 2005, page 606 et. seq. 32 APWG, Phishing Activity Trends Report, 1st Half 2009, Page For more details see: Techniques of Identity Theft, CIPPIC Working Paper No. 2 (ID Theft Series), 2007, page Regarding the use of malicious software in phishing cases see: Federal Deposit Insurance Corporation, Putting and End to Account-Hijacking Identity Theft, 2004, page 10; Emigh, Online Identity Theft: Phishing Technology, Chokepoints and Countermeasures, ITTC Report on Online Identity Theft Technology and Countermeasures, 2005, page 8 et seq, Scoping Paper on Online Identity Theft, OECD Ministerial Background Report, DSTI/CP/2007)3/FINAL, page 16 et seq. 35 Paget, Identity Theft, McAfee White Paper, 2007, page Regarding the various installation processes see The Crimeware Landscape: Malware, Phishing, Identity Theft and Beyond, page 21 et seq. - available at: APWG_CrimewareReport.pdf. 37 See: The Crimeware Landscape: Malware, Phishing, Identity Theft and Beyond, page 4 et seq. - available at: antiphishing.org/reports/apwg_crimewarereport.pdf. 38 In the early years of IT development, the term hacking was used to describe the attempt to get more out of a system (software or hardware) than it was designed for. Within this context, the term hacking was often used to describe a constructive activity. 39 See Levy, Hackers, 1984; Hacking Offences, Australian Institute of Criminology, 2005 available at: gov.au/publications/htcb/htcb005.pdf; Taylor, Hacktivism: In Search of lost ethics? in Wall, Crime and the Internet, 2001, page See the statistics provides by HackerWatch. The Online-Community HackerWatch publishes reports about hacking attacks. Based on their sources, more than 250 million incidents were reported Biegel, Beyond our Control? The Limits of our Legal System in the Age of Cyberspace, 2001, page 231 et. seq. in the month of August Source: 41 See: Techniques of Identity Theft, CIPPIC Working Paper No. 2 (ID Theft Series), 2007, page 19; Information Security, Agencies Report Progress, but Sensitive Data Remain at Risk, Statement of G. C. Wilshusen, Director, Information Security Issues, 2007, GAO Document: GAO-07_935T, page Putting and End to Account-Hijacking Identity Theft, Federal Deposit Insurance Corporation, 2004, page 10; Identity Crime, Final Report, Model Criminal Law Officers Committee of the Standing Committee of Attorneys-General, 2008, page 5; Paget, Identity Theft, McAfee White Paper, 2007, page 6; Finklea, Identity Theft: Trends and Issues, CRS, 2009, R40599, page Hacker Pleads Guilty in Vast Theft of Credit Numbers, New York Times, Regarding the relation between identity-related offences and money laundering see: Results of the second meeting of the Intergovernmental Expert Group to Prepare a Study on Fraud and the Criminal Misuse and Falsification of Identity, Report to the Secretary-General, 2007 E/CN.15/2007/8/Add. 3, page UNODC, Fraud and the criminal misuse and falsification of identity, 2007; Uniting against Terrorism: Recommendations for a Global Counter-Terrorism Strategy, , A/60/825, Page Report on Identity Theft, A Report to the Ministry of Public Safety Canada and the Attorney General of the United States, Bi-national Working Groud on Cross-Border Mass Marketing Fraud, 2004; Paget, Identity Theft McAfee White Paper, 2007, page Brenner, Organized Cybercrime, North Carolina Journal of Law & Technology, 2002, Issue 4, page Choo, Trends in Organized Crime, 2008, page See for example: Great Britain Crown Prosecution Service, Convictions for internet rape plan, Media release, Ward, Boom times for hi-tech fraudsters, BBC News, ; Regan, DOJ Busts up Global Phishing Ring, Charges 28, E-Commerce Times, Cybersource, Sixth annual UK on-line fraud report. London: Cybersource, APWG, Phishing Activity Trends Report, 1st Half 2009, Page Ibid. 54 Symantec, Global Internet Security Threat Report, Trends for 2008, Vol. XIV, 2009, page Internet Crime Complaint Center, 2008 Internet Crime Report: pdf. 56 US District Court, District of New Jersey, indictment. See: 57 US District Court, District of Massachusetts, indictment. See: Press%20Release%20Files/IDTheft/Gonzalez,%20Albert%20 -%20Indictment% pdf. 58 US District Court, District of New Jersey, indictment. See: 59 Times Newsweekly, Fraud ring smashed, indictment names 48, 21 May Federal Trade Commission, Identity Theft Survey Report, Similarly, of some 73,000 complaints to the US national Internet Crime Complaint Center in 2008, the most commonly reported offences were non-delivery of purchased goods and auction fraud, accounting for 57% of all complaints. Only 2.5% involved identity theft (about 1800 complaints), slightly fewer than complaints of advance fee fraud. Reported losses to all forms of computer crime that year totalled some US$265 million. If the value of the losses were proportional to the number of complaints, the loss due to reported identity theft would be US$6,625,000. What share this would represent of all losses is unclear. See Internet Crime Complaint Center, 2008 Internet Crime Report: annualreport/2008_ic3report.pdf. 61 According to the Javelin Strategy & Research 2007 Identity Fraud Survey, see: This trend also appears to be born out for cyber identity theft in the work of Cybersource, 2010, op cit. 62 Paget F., Identity Theft, McAfee White Paper, page 10, The table below publishes the new estimate for the cost of identity fraud to the UK Economy billion The first estimate of the cost of identity fraud came from the Cabinet Office report Identity Fraud: A Study in 2002: 1.3 billion. In February 2006 an updated figure of 1.7 billion, was published, with a breakdown between organisations, following work by the IFSC. The Government made it clear that the 1.7 billion estimate was a one-off update and future costs exercises would be based on a new more robust methodology that was being devised by the IFSC. economy_ pdf. 64 Public Safety and Emergency Preparedness Canada, Report on 316 TRANSNATIONAL ORGANIZED CRIME THREAT ASSESSMENT
323 ENDNOTES Identity Theft, October Symantec, op. cit. 66 For comparative purposes, licit credit card transactions were valued at just over US$2.1 trillion in See Symantec Global Internet Security Threat Report, Trends for 2008, Vol. XIV, 2009, page Bloxsome/Kuhn/Pope/Voges, The Pornography and Erotica Industry: Lack of Research and Need for a Research Agenda, Griffith University, Brisbane, Australia: 2007 International Nonprofit and Social Marketing Conference, Sep 2007, page Regarding the risk of detection with regard to non Internetrelated acts see: Lanning, Child Molesters: A Behavioral Analysis, 2001, page Carr, Child Abuse, Child Pornography and the Internet, NCH, 2004, page Sexual Exploitation of Children over the Internet, Report for the use of the Committee on Energy and Commerce, U.S. House of Representatives, 109th Congress, 2007, page 8 et seq. 71 Carr, op. cit., p See in this context for example: Carr, Child Abuse, Child Pornography and the Internet, 2004, page Bunzeluk, K, Child sexual abuse images: An analysis by Cybertip.ca. Winnipeg: Canadian Centre for Child Protection, November 2009, p Healy, Child Pornography: An International Perspective, 2004, page Eneman, A Critical Study of ISP Filtering Child Pornography, 2006, page IWF, 2009 Annual and Charity Report, page IWF, 2008 Annual and Charity report. 78 Wolak/Mitchell/Finkelhor, Internet Sex Crimes Against Minors: The Response of Law Enforcement, 2003, page 21; Sexual Exploitation of Children over the Internet, Report for the use of the Committee on Energy and Commerce, U.S. House of Representatives, 109th Congress, 2007, page CNN, Child porn gang face jail, 13 February Sexual Exploitation of Children over the Internet, Report for the use of the Committee on Energy and Commerce, U.S. House of Representatives, 109th Congress, 2007, page Ibid. 82 Ibid p For more information, see Gercke, Understanding Cybercrime: A Guide for Developing Countries, ITU, 2009, page 33; Wilson, Banking on the Net: Extending Bank Regulations to Electronic Money and Beyond. 84 Smith, Child pornography operation occasions scrutiny of millions of credit card transactions, available at: de/english/newsticker/news/print/ Regarding the use of electronic currencies in money-laundering activities, see: Ehrlich, Harvard Journal of Law & Technology, Volume 11, page Child Pornography and Pedophilia: Report Made by the Permanent Subcommittee on Investigations, U.S. Senate, 99th Congess, 1986, page Data provided by the Internet Watch Foundation reveals that just 10 registries or registrars accounted for 76% of all the commercial child sexual abuse domains reported during This shows a high degree of concentration. 88 Healy, Child Pornography: An International Perspective, 2004, page This figure is not limited to child pornography, but pertains to internet sex crimes against minors in general. See Wolak/ Mitchell/Finkelhor, Internet Sex Crimes Against Minors: The Response of Law Enforcement, 2003, page Sexual Exploitation of Children over the Internet, Report for the use of the Committee on Energy and Commerce, U.S. House of Representatives, 109th Congress, 2007, page Wolak et al 2005 op cit. 92 As quoted in ibid. See also Sullivan, Internet Traders of Child Pornography: Profiling Research Update, 2007, page 2; Webb/Craissati/Keen, Characteristics of Internet Child Pornography Offenders: A Comparison with Child Molesters, Sex Abuse, 2007, Vol. 19, page 456; Wolak/Finkelhor/Mitchell, Child-Pornography Possessors Arrested in Internet-Related Crime Findings From the National Juvenile Online Victimization Study, 2005, page vii. DPA, Kinderpornographie- Bilderflut im Internet, Sullivan, C. Internet traders of child pornography: profiling research. Censorship Compliance Unit. New Zealand. 2005, as quoted in Quayle et al 2008 op cit. 94 Hernandez, A, Psychological and Behavioral Characteristics of Child Pornography Offenders in Treatment. Paper prepared for the Global Symposium examining the relationship between online and offline offenses and preventing the sexual exploitation of children, The University of North Carolina at Chapel Hill, April 5-7, Baartz, D. Australians, the Internet and technology-enabled child sex abuse: A statistical profile. Australian Federal Police. 2008, as cited in Quayle et al op cit. 96 E. Quayle, personal communication, 20 November Healy, Child Pornography: An International Perspective, 2004, page Ibid. 99 Quayle, E., L. Loof, and T. Palmer, Child Pornography and Sexual Exploitation of Children Online. Paper submitted by ECPAT International to the World Congress III against Sexual Exploitation of Children and Adolescents, Rio de Janeiro, Brazil, November 2008, p ASACP Efforts Help Stop CP Criminals from Abusing Adult Industry, ASACP press release, Rights of the Child, Commission on Human Rights, 61 st session, E/CN.4/2005/78, page 8, also see Healy, Child Pornography: An International Perspective, 2004, page ECPAT, Regional Overview on Child Sexual Abuse Images through the Use of Information and Communication Technologies in Belarus, Moldova, Russia and Ukraine. ECPAT: Bangkok, Sexual Exploitation of Children over the Internet, Report for the use of the Committee on Energy and Commerce, U.S. House of Representatives, 109th Congress, 2007, page Wolak/ Finkelhor/ Mitchell, Child-Pornography Possessors Arrested in Internet-Related Crimes: Findings From the National Juvenile Online Victimization Study, 2005, page Ibid. 106 Carr 2004 op cit, p Bialik, C. Measuring the child porn trade, Wall Street Journal, 18 April Ernie Allen in Protecting the Children, The ETA joins in the fight against child pornography, Transation Trends, April 2007, page 32; Child Pornography among fastest growing Internet businesses, MCMEC Press Release, Ferraro/ Casey, Investigating Child Exploitation and Pornography, 2005, page 2; Cassell Bryan-Low, Dangerous Mix: Internet Transforms Child Porn Into Lucrative Criminal Trade Company in Belarus Collected Millions From Pedophiles; A Landmark Prosecution Agent s Rendezvous in Paris, Wall Street Journal, Jan. 17, 2006; Sexual Exploitation of Children over the Internet, Report for the use of the Committee on Energy and Commerce, U.S. House of Representatives, 109th Congress, 2007, page 2; ECPAT, Violance against Children in Cyberspace, 2005, page 31; Choo/Smith/McCusker, Future directions in technology-enabled crime: , Australian Institute of Criminology, Research and Public Policy series, No Lawrence, S. and C. Giles, Accessibility of information on the web. Nature, Vol 400, 8 July 1999, p Ackerman, D. How big is porn? Forbes, 25 May 2001, citing a report by Forrester Research. 111 One 2007 media source cites an unsupported estimate of US$3 billion. See Mooallem, J. A disciplined business, New York Times, 29 April Reuters, China says 5,394 arrested in Internet porn crackdown, 31 December One study suggests 300. Branwyn, G., How the porn sites do Case studies of transnational threats 317
324 ENDNOTES it. The Industry Standard, March 12, Ibid. 115 Ibid. 116 There have also been examples from East Europe. One Ukrainian operation, later moved to Russia to avoid detection, was fronted as a modeling agency, and involved as many as 500 girls. When it was finally taken down, the site was said to be generating US$150,000 per month. See ECPAT 2008 op cit. 117 Wortley/Smalbone, Child Pornography on the Internet, US Department of Justice, Problem-Oriented Guides for Police, Problem-Specific Guide Series No. 41, 2006, page Endrass/Urbaniok/Hammermeister/Benz/Elbert/Laubacher/ Rossegger, The consumption of Internet child pornography and violent sex offending, BMC Psychatry, 2009, Vol. 9, page Wortley/Smalbone, op cit. 120 Attorney General Ashcroft Announces the successful conclusion of operation Avalanche, US Department of Justice, Press release, 08. August 2001; Wortley/Smalbone, Child Pornography on the Internet, US Department of Justice, Problem-Oriented Guides for Police, Problem-Specific Guide Series No. 41, 2006, page Examples from East Europe also suggest low client volumes per site. One man in Belarus was arrested in 2006 for selling pictures for his collection of some 30,000 images. He had 80 clients from around the world in the six months that he was vending. See ECPAT 2008 op cit. 122 Laville, S., Legal challenge to web child abuse inquiry, Guardian, 2 July Walker, A., J. Flatley, C. Kershaw, and D, Moon, Crime in England and Wales 2008/09: Findings from the British Crime Survey and police recorded crime. Home Office: London, July 2009, p Wallace, M, Police-reported crime statistics in Canada Juristat, Vol. 29, No. 3, July 2009, p AuCoin, K., Children and youth as victims of violent crime, Juristat, Vol 25, No 1, Wallace, M, op. cit. 127 Motivans, M. and T. Kyckelhahn, Federal Prosecution of Child Sex Exploitation Offenders, 2006, Bureau of Justice Statistics, December This figure is close to a national estimate for the total number of Internet-related child pornography arrests in 2000 (1,713). See Wolak et al 2005 op cit. 128 For example, the Internet Crimes Against Children Task Force Program, which helps state and local law enforcement agencies develop an effective response to cyber enticement and child pornography cases, was funded for US$85 million between 2003 and 2008, and received US$75 million in FY asp?pi= In general, estimates based on the number of images available on the market can be misleading. A 15-minute video contains more than 22,500 pictures at a rate of five frame per second, all of which could be presented or counted as stills, and there is evidence that this does happen (see Wolak et al below). The 750,000 image Wonderland database, some 1200 individual victims could be identified. Although many may have been taken in a manner where the victim s identity was concealed, this suggests a ratio of 625 images per victim. 130 De Saint Maur, Sexual Abuse of Children on the Internet: A New Challenge for Interpol, 1999, page Rights of the Child, Commission on Human Rights, 61 st session, E/CN.4/2005/78, page Webb/Craissati/Keen, Characteristics of Internet Child Pornography Offenders: A Comparison with Child Molesters, Sex Abuse, 2007, Vol. 19, page Wolak, J., D. Finkelhor, and K. Mitchell, Child pornography possessors arrested in Internet-related crimes: Findings from the National Juvenile Online Victimisation Survey. Washington, D.C., National Center for Missing and Exploited Children, 2005, p Ibid. 135 Bunzeluk 2009, op cit, p. 10. Chapter 11 - Regions under stress 1 Secretary-General Ban Ki-moon, Remarks to the Summit of the African Union An Agenda for Prosperity and Peace, Addis Ababa, 31 January S/PRST/2010/4. 3 The Kimberley Process (initiated in 2000 by UN resolution A/RES/55/56) was an initiative to address the illicit trade in diamonds originating in conflict areas. Licit players in the industry came up with a system to certify the origin of rough diamonds. 4 Preliminary estimates. 5 Cannabis, a much more widely consumed drug, could be worth more if more of the drug were trafficked internationally and sold commercially. But surveys in the biggest consumer countries indicate that a majority of users rely on local and less formal sources of supply. 6 Economist Intelligence Unit, Country Profile Colombia 2008, London Ibid. 8 Economist Intelligence Unit, Country Profile Peru 2008, London Jorge Restrepo Fontalvo (Centro de Estudios Policiales, Universidades Santo Tomás, Libre, Sergio Arboleda y Autónoma), Estudios Estadisticos, Cincuenta años de criminalidad registrada por la Policía Nacional, ISSN Revista Criminalidad, Volumen 50, Número 1, pp ; Ministerio de educación superior, Universidad de La Habana, Centro de Estudios de Salud y Bienestar Humano, Violencia en Colombia: La mortalidad por homicidios entre , La Habana Jorge Restrepo Fontalvo (Centro de Estudios Policiales, Universidades Santo Tomás, Libre, Sergio Arboleda y Autónoma), Estudios Estadisticos, Cincuenta años de criminalidad registrada por la Policía Nacional y El Homicidio: Análisis Criminológico, ISSN Revista Criminalidad, Volumen 50, Número 1; UNODC, United Nations Survey on Crime Trends and the Operations of Criminal Justice Systems, various years. 11 Colombia (3.7) and showed better results than Mexico (3.3), which suffered from the emergence of domestic drug cartels or the neighbouring Venezuela (1.9) which is now a key transit country for Colombian produced cocaine. (Source: Transparency International, Corruption Perception Index, 2009). 12 UNODC, Colombia Coca Cultivation Survey, June Ibid. 14 World Customs Organization, Customs and Drugs Report 2008, Brussels, June Maritime Analysis Operation Centre, Statistical Analysis Report, Lisbon The value of the cocaine trafficked by Colombian traffickers to Mexico (including minor quantities from from Peru and Bolivia) had a farm-gate value of US$0.6 billion in the Andean countries in The value at the sea border in Colombia was close to US$1 billion, suggesting that local traffickers (mostly Colombians) made gross profits of some US$0.4 billion. Trafficked from Colombia to Mexico, the value taking seizures into account - increased to US$3.3 billion. The gross profits amounted to around US$2.4 billion. Assuming that 80% of this traffic is organized by Colombian drug trafficking groups, their gross profits amounted to US$1.9 billion in The share of Colombian drug traffickers in the USA has fallen strongly over the last 15 years to just 2.2% (in terms of persons arrested). But the cocaine market in the USA (US$38 billion in 2008) is huge, and so are cocaine related gross profits (US$29.5 billion). Applying the proportion of 2.2% to the total amount of gross trafficking profits made in the USA the Colombian drug traffickers may have generated a further US$0.6 billion All of this suggests that Colombian drug traffickers made some US$3 billion in gross profits ship- 318 TRANSNATIONAL ORGANIZED CRIME THREAT ASSESSMENT
325 ENDNOTES ping cocaine from the Andean region to North America while farmers make some US$0.6 billion. High profits are also made in shipping cocaine to Europe. The value of the cocaine destined for Europe amounted to US$34 billion in 2008 of which the internationally operating cocaine traffickers, shipping the cocaine from the Andean region to Europe, reaped some US$8.3 billion in gross profits in Colombian trafficking organizations play a significant role in many of these trafficking activities. Assuming (based on the analysis of Spanish arrest statistics) that at least 30% of all cocaine shipments to Europe are directly organized by Colombian groups, Colombian trafficking groups would have generated some US$2.5 billion. In addition, there are reports that Colombian traffickers organized cocaine shipments to West Africa (accounting for 30% of total shipments to Europe in 2007 and 17% in 2008) for subsequent deliveries to Europe for which the African trafficking groups received about one third in kind. This suggests that Colombian groups may have earned another US$0.5 billion in gross profits out of these activities. Thus, Colombian groups may have earned, in total, some US$3 billion out of trafficking cocaine to Europe in UNODC, 2008 Afghanistan Opium Survey, November Hewitt, J., J. Wilkenfeld and T. Gurr, Peace and Conflict Center for International Development and Conflict Management, University of Maryland, Vincent, L., Guinea-Bissau: Cocaine and coups haunt gagged nation. Paris: Reporters without Borders, November BBC, Fear after Bissau death threats, 1 August Commonwealth Secretariat, Nigeria Country Profile. London, The Nigerian government benefits from oil and gas production through a variety of means: the share in each joint venture awarded to the Nigerian National Petroleum Corporation, the signature bonuses, royalties and taxes. The federal Nigerian government in Abuja and the oil companies do not publish full details of their revenue sharing formula. However, some sources suggest that at an oil price of $50 a barrel, the government receives $44.13 (88%) and the oil company $1.87 (3.7%), with $4 (8.3%) to cover technical costs. The government therefore loses a lot more from its budget than the oil companies from the theft of oil. See Von Kemedi, Fuelling the Violence: Non-State Armed Actors (Militia, Cults, and Gangs) in the Niger Delta p. 22. All state revenues from the oil industry are taken by Abuja, which then distributes a proportion to state governments. The oil producing states share of this income has varied over the past 40 years but currently stands at 13% of official income. Many Niger Delta politicians (as well as the Movement for the Emancipation of the Niger Delta) demand a 50% share. 22 Christian Science Monitor, Nigeria militans call of truce in oil-rich Niger Delta, 31 January The rule of law indicator measures the extent to which agents have confidence in and abide by the rules of society, in particular the quality of contract enforcement, the police, and the courts, as well as the likelihood of crime and violence La Ceiba has been noted as a major drug trafficking port by the US Drug Enforcement Administration as early as See: 26 BBC, Guatemala fears Mexico drug spillover, 17 December 2008: 27 International Federation for Human Rights, Observatory for the Protection of Human Rights Defenders Annual Report Guatemala, 18 June UNODC, Addiction, Crime and Insurgency: the transnational threat of Afghan opium, October 2009, p Ibid., p For example, in May 2007, Dubai Police arrested two gangs reported to have laundered billions of dollars through the Emirate. See 7Days, Dubai: cartels smashed, 17 May, 2007, 31 Afghanistan Ministry of Commerce and Industry Strategy Paper, March 2007; see also, State Building, Sustaining Growth, and Reducing Poverty: a Country Economic Report, World Bank, In addition to all other illicit activities such as human trafficking, small arms trafficking, drug cultivation, bribery, oil smuggling et cetera. 33 Buddenberg, Doris and William A. Byrd (editors), Afghanistan s Drug Industry: Structure, Functioning, Dynamics, and Implications for Counter-Narcotics Policy. UNODC and the World Bank, 2006, p Ibid., p UNODC, Addiction, Crime and Insurgency: the transnational threat of Afghan opium, October 2009, p UNODC, 2009 World Drug Report, June 2009, p.96; see also Information Bulletin No 60, CARICC, November 9, Ibid., p ISAF commander congratulates Ministry of Interior for likely world s largest seizure of narcotics, June , ISAF Public Affairs Office, pressreleases/2008/06-june/pr html. 39 UNODC, Addiction, Crime and Insurgency: the transnational threat of Afghan opium, October 2009, pp UNODC, 2009 Afghanistan Opium, December It is estimated that the Taliban pocketed around $ million from the opiate trade between 2005 and 2008 through direct taxation of farmers and traffickers, see UNODC, Addiction, Crime and Insurgency: the transnational threat of Afghan opium, October 2009, p Ibid. 43 Ibid. p Michael Erwin, The Insurgent-Narcotic Nexus in Helmand Province, CTC Sentinel, Vol. 2, No. 9. August, Ibid. 46 Iqbal Khattak, Taliban collecting taxes to raise funds for jihad, Daily Times, August 16, Central Asia: rising violence points to IMU revival, EW Flash, August , OCHA. 48 UNODC, Addiction, Crime and Insurgency: the transnational threat of afghan opium, October Statement made by Ralf Mutschke, Assistant Director, Criminal Intelligence Directorate, INTERPOL, The Threat Posed by the Convergence of Organized Crime, Drugs Trafficking and Terrorism. US House of Representatives Committee on the Judiciary, Subcommittee on Crime, December 13, The listed groups are: Polish, Russian, Romanian, Vietnamese, Turkish, Nigerian, Lebanese, Italian and Lithuanian, in addition to German. See Bundeskriminalamt, Organisierte Kriminalität Bundeslagebild 2008, Wiesbaden: BKA, For example, they are not listed in the 2008 German response to the UNODC Annual Reports Questionnaire, which states, For all drug types, the major group of suspects was formed by German nationals. The list of non-german suspects is topped by Turkish nationals. In the area of organized heroin trade, groups dominated by Turkish nationals are of particular importance. 52 Illegaler Handel mit und Schmuggel von Heroin nach 29 BtMG does not include a small number of cases under 30 (1) 4 (illegal import). 53 Data from the UN GIFT project. 54 International Monetary Fund, World Economic Outlook: Crisis and Recovery, April Final Report of the Commission of Experts Established Pursuant to Security Council Resolution 780 (1992). S/1994/ May 1994, chapter 4, section F. 56 Mendelson, S. Barracks and Brothel: Peacekeepers and Human Trafficking in the Balkans. Washington, D.C.: Centre for Strategic and International Studies, See, for example, Jackson, M. The rise and decay of the socialist economy in Bulgaria. Journal of Economic Perspectives. Case studies of transnational threats 319
326 ENDNOTES Vol 5, No 4, 1991, p UNODCCP, Global Illicit Drug Trends 2002, ODCCP Studies on Drugs and Crime, New York For a review of the historical development of opium poppy cultivation in Myanmar over the last 2 centuries see UNOD- CCP, Myanmar How did Myanmar become a major supplier of illicit Opium?, in Global Illicit Drug Trends 2001, ODCCP Studies on Drugs and Crime, New York 2001, pp and T. Pietschmann, A Century of International Drug Control, Bulletin on Narcotics, Volume LIX, Nos. 1 and 2, 2007, pp Khun Sa Myanmar drug trafficker and militant separatist, born Feb. 1934, died October (Encyclopedia Britannica). 61 USA Department of State, 2009 International Narcotics Control Strategy Report, February UNODC, 2009 Patterns and Trends of Amphetamine-Type Stimulants and Other Drugs in East and South-East Asia (and neighbouring regions). Vienna, November 2009, pp Myanmar s purchasing power adjusted per capita GDP amounted to just US$904 in 2007, the second lowest rate in Asia after Timor-Leste (US$717), lower than per capita GDP reported from Nepal (US$1,049), Afghanistan (US$1,054) or Bangladesh (US$1,241) and less than half the GDP per capita in neighbouring Laos (US$2,165) or in neighbouring India (US$2,753), one sixth of GDP per capita of neighbouring China or of Asia as a whole (US$5,837), or one ninth of GDP per capita of neighbouring Thailand (US$8,135) UNDP, Human Development Report 2009, New York, The Economist Intelligence Unit, Myanmar (Burma), Country Profile 2006, London UNODC, Opium Poppy Cultivation in South East Asia, December Ibid. 67 Heroin prices in Ruili, a Chinese border town that serves as a major entry point for heroin from Myanmar, were reported by the Chinese Public Security Bureau to have amounted to some Yuan 36,000 per kg in 2004 (Maw Seng, China Alarmed at Heroin Influx from Burma, The Irrawaddy, March 2, US DEA reported slightly higher prices of around US$5,000 per 0.7 kg of opium in 2003 in the Chinese border regions with Myanmar in 2003, equivalent to some US$7,100 per kg). Opium farm-gate prices in Myanmar more than doubled between 2004 and 2009 (from US$153 to US$317 per kg) suggesting that heroin prices in the Chinese border regions with Myanmar may have doubled as well to some Yuan 72,000 or US$10,500. Wholesale heroin prices for Thailand were officially reported to UNODC at between US$12,000 and US$15,000 per kg in Applying a 10:1 ratio for the transformation of opium into heroin and a tentative typical heroin export price of around US$11,000 per kg - based on information that the majority of the heroin is sold to China and that Myanmar drug traffickers, exporting to the border regions of Thailand could only fetch prices at the lower end of the price scale heroin sales could have generated around US$360 million for traffickers in Myanmar in 2009 (range: US$140 to US$500 million). 68 This estimate was provided by the Economist Intelligence Unit (EIU, Myanmar Country Report, January 2010). Neither IMF or World Bank have provided any GDP estimates for recent years. 69 Statistics from the Office de Géologie et des Mines du Rwanda (Rwanda Geology and Mines Authority) indicate that, based on customs declaration nearly half the minerals exported (by weight) from Rwanda in 2008 were re-exports; not of Rwandan origin. See data supplied by Global Witness, in Faced with a gun, what can you do? War and the militarisation of mining in eastern Congo, July 2009, p World Gold Council, Gold demand trends, February More than half the world s tin is used for solders in the electronics industry. In the mid-2000s, EU directives banned the use of lead in such solders, causing a spike in demand. 72 Division des Mines, quoted in Global Witness, Faced with a gun, what can you do? War and the militarization of mining in Eastern Congo, July 2009, p Ibid. 74 According to official statistics (exact source unknown), quoted in United Nations Security Council, Final report of the Group of Experts on the Democratic Republic of the Congo, S/2009/603, 23 November 2009, para Communities and Small-scale Mining (CASM), Walikale: Artisanal Cassiterite Mining and Trade in North Kivu, June United Nations Security Council, Final report of the Group of Experts on the Democratic Republic of the Congo, S/2009/603, 23 November The DRC Senate report is often referred to as the Rapport Mutamba Dibwe, after the president of the commission of inquiry. It was published on 24 September 2009 and is available online at bc9kb2nzl1jey29uz29fcmfwcg9ydc1taw5lcy1zzw5hd HJkYw==,6.pdf. 78 United Nations Security Council, Final report of the Group of Experts on the Democratic Republic of the Congo, S/2009/603, 23 November Global Witness, Faced with a gun, what can you do? War and the militarization of mining in Eastern Congo, July 2009, p Ibid p Pole Institute, Rules for Sale: Formal and informal cross-border trade in Eastern DRC, May The Congolese government and the main armed groups signed a peace agreement, and a transitional constitution gave way to an interim government (pending elections), led by Joseph Kabila. 83 For example, a discussion paper published by the Gomabased Pole Institute notes that The economic dimension of conflict in Kivu is about rights of access to land and control of trade routes, not about minerals.( ) Conflict is linked to nationality and ethnicity and to political and administrative power. Pole Institute, Minerals and conflict in eastern DRC: A discussion paper, July United Nations Security Council, Final report of the Group of Experts on the Democratic Republic of the Congo, S/2008/773, 12 December 2008, para During the integration, only 2,542 weapons were handed in from the 6,006 CNDP ex-combatants identified in the integration process. Only 687 arms were handed over from the 2,872 PARECO elements identified. United Nations Security Council, Interim report of the Group of Experts on the Democratic Republic of the Congo, S/2009/253, 18 May 2009 (para 32). 86 United Nations Security Council, Final report of the Group of Experts on the Democratic Republic of the Congo, S/2009/603, 23 November Moreover, according to the United Nations Group of Experts, most senior officials still consider General Nkunda their leader, in spite of his incarceration (United Nations Security Council, Interim report of the Group of Experts on the Democratic Republic of the Congo, S/2009/253,18 May 2009). 88 United Nations Security Council, Final report of the Group of Experts on the Democratic Republic of the Congo, S/2009/603, 23 November The most recent ones are S/2008/773, S/2009/253 and S/2009/ United Nations Security Council, Final report of the Group of Experts on the Democratic Republic of the Congo, S/2008/773, 12 December United Nations Security Council, Interim report of the Group of Experts on the Democratic Republic of the Congo, S/2009/253, 18 May 2009, para From September 2007 September 2008, CNDP made at least US$700,000 from the control of Bunagane border crossing post; the figure is probably much higher. S/2008/ United Nations Security Council, Interim report of the Group of Experts on the Democratic Republic of the Congo, S/2009/253, 18 May 2009, para Global Witness, Faced with a gun, what can you do? War and 320 TRANSNATIONAL ORGANIZED CRIME THREAT ASSESSMENT
327 ENDNOTES the militarisation of mining in eastern Congo, July 2009, p United Nations Security Council, Final report of the Group of Experts on the Democratic Republic of the Congo, S/2008/773, 12 December 2008, para ICC-International Maritime Bureau, Piracy and armed robbery against ships: 2009 annual report, January International Expert Group on Piracy off the Somali Coast, Piracy off the Somali Coast: Final report (main document), p Larger vessels, often fishing trawlers. 99 ICC-International Maritime Bureau, Piracy and armed robbery against ships: 2009 annual report, January Guns were confirmed used in 181 of the 217 attacks by Somali pirates in The figure could be even higher, due to several Not stated reports. In most other countries where piracy occurs, the use of guns is relatively rare, with the exception of Nigeria. 101 International Expert Group on Piracy off the Somali Coast, Piracy off the Somali Coast: Final report (main document), p ICC-IMB annual reports for 2008 and International Expert Group on Piracy off the Somali Coast, Piracy off the Somali Coast: Final report (main document), p Congressional Research Service, Piracy off the Horn of Africa, April 2009, p Robert Wright, Somali pirates free tanker after record ransom, Financial Times, 18 January There are two reports that give different values for the ransom paid figure. UN Data, World Statistics Pocketbook. 107 International Expert Group on Piracy off the Somali Coast, Piracy off the Somali Coast: Final report (main document), p United Nations Security Council, Report of the Secretary- General pursuant to Security Council resolution 1846 (2008), S/2009/146, 16 March 2009, para United Nations Security Council, Report of the Secretary- General pursuant to Security Council resolution 1846 (2008), S/2009/146, 16 March Paula Cristina Roque, The battle for Mogadishu: Revealing Somalia s fluid loyalties and identities, African Security Review, vol. 8, no. 3, p United Nations Security Council, Report of the Secretary-General on the situation in Somalia, S/2009/373, 20 July 2009.* 112 Ibid. 113 International Expert Group on Piracy off the Somali Coast, Piracy off the Somali Coast: Final report (main document), p United Nations Security Council, Report of the Secretary-General on the situation in Somalia, S/2009/684, 8 January 2010, para The most recent being the fatal shooting of an MP in Bossaso on 20 January Reuters/AlertNet, who reported the story, concluded that insecurity is rising in this region. 116 ReliefWeb, Gunman kills legislator in Somalia s Puntland, 20 January International Expert Group on Piracy off the Somali Coast, Piracy off the Somali Coast: Final report (detailed recommendations), p United Nations Security Council, Report of the Secretary-General on the situation in Somalia, S/2009/684, 8 January Although Puntland has recently made efforts to speed up prosecutions of suspected pirates (S/2009/684). 120 Freedom C. Onuoha, Sea piracy and maritime security in the Horn of Africa: The Somali coast and Gulf of Aden in perspective, African Security Review, vol. 18, no. 3, p Both these groups include foreign fighters and are supported by Al-Qaida. 122 International Expert Group on Piracy off the Somali Coast, Piracy off the Somali Coast: Final report (main document), p Ibid. 124 Ibid., p The estimated income of Puntland pirates was some US$30 million in 2008, whereas the Government s budget was only US$10 million. 126 International Expert Group on Piracy off the Somali Coast, Piracy off the Somali Coast: Final report (main document), p S/PRST/2010/4. Case studies of transnational threats 321
328
Issue: Strengthening measures regarding international security as a way of combating transnational organized crimes
 Forum: United Nations Office of Drugs and Crime Issue: Strengthening measures regarding international security as a way of combating transnational organized crimes Student Officer: Yin Lett Win Position:
CONCLUSION TOC VALUE ESTIMATES DISCUSSED IN THIS REPORT COMPARED 38,000
 This report has been framed as a threat assessment, so it is fair to ask: which transnational organized crime flow poses the greatest global threat? Throughout the report, when feasible, an estimated dollar
AFGHAN OPIATES TRAFFICKING
 AFGHAN OPIATES TRAFFICKING THROUGH THE SOUTHERN ROUTE March 2014 Afghan Opiate Trade Project Statistics And Surveys Section Afghan Opiate Trade Project (AOTP) Main Objectives: Global threat/risk and response
A large amount of cocaine seized at the Port of Koper - information from the joint press conference of the Monday, 09 June :00
 At today's press conference, organised by the General Police Directorate and the Customs Office of the RS in cooperation with the Croatian Police, which was held at the headquarters of the Croatian Police
THE EU S GLOBAL ENGAGEMENT TO COUNTER SMUGGLING AND TRAFFICKING NETWORKS
 EUROPEAN UNION THE EU S GLOBAL ENGAGEMENT TO COUNTER SMUGGLING AND TRAFFICKING NETWORKS Fighting and preventing human smuggling and trafficking is one of the priorities of the European Union and crucial
Drugs and Crime. Class Overview. Illicit Drug Supply Chain. The Drug Supply Chain. Drugs and Money Terrorism & the International Drug Trade DRUG GANGS
 Drugs and Crime Drug Trafficking & Distribution Class Overview The Drug Supply Chain Cultivation Production Transportation Distribution Drugs and Money Terrorism & the International Drug Trade Illicit
The extent of trafficking with children
 The extent of trafficking with children UNICEF estimates that around 1.2 million children are trafficked every year. Just to Western Europe there are between 120 000 and 500 000 women and children brought
Trademarks FIGURE 8 FIGURE 9. Highlights. Figure 8 Trademark applications worldwide. Figure 9 Trademark application class counts worldwide
 Trademarks Highlights Applications grew by 16.4% in 2016 An estimated 7 million trademark applications were filed worldwide in 2016, 16.4% more than in 2015 (figure 8). This marks the seventh consecutive
Intelligence brief 19 March 2014
 Intelligence brief 19 March 2014 Maritime insecurity in the Gulf of Guinea Summary 1. Maritime insecurity incorporates a range of criminal activities, including piracy, smuggling and illegal fishing. 2.
United Nations Office on Drugs and Crime (UNODC) (May 2014-April 2015)
 (May 2014-April 2015)") United Nations Office on Drugs and Crime (UNODC) (May 2014-April 2015) UNODC assists the African Union in the implementation of its Drug Control Plan 2013-2018. UNODC has expanded its cooperation with
United Nations Office on Drugs and Crime (UNODC) (May 2014-April 2015) UNODC assists the African Union in the implementation of its Drug Control Plan 2013-2018. UNODC has expanded its cooperation with
Towards the 5x5 Objective: Setting Priorities for Action
 Towards the 5x5 Objective: Setting Priorities for Action Global Remittances Working Group Meeting April 23, Washington DC Massimo Cirasino Head, Payment Systems Development Group The 5x5 Objective In many
Levels and trends in international migration
 Levels and trends in international migration The number of international migrants worldwide has continued to grow rapidly over the past fifteen years reaching million in 1, up from million in 1, 191 million
I. INTERDICTIONS OF ILLICIT DRUGS AND FIREARMS SMUGGLING IN 2006
 I. INTERDICTIONS OF ILLICIT DRUGS AND FIREARMS SMUGGLING IN 6 1. (1) Summary A total of 78 cases of interdiction of illicit drugs were reported in 6 (111% of the previous year's level). The amount of seizure
I N T R O D U C T I O N
 REFUGEES by numbers 2002 I N T R O D U C T I O N At the start of 2002 the number of people of concern to UNHCR was 19.8 million roughly one out of every 300 persons on Earth compared with 21.8 million
Presentation 1. Overview of labour migration in Africa: Data and emerging trends
 ARLAC Training workshop on Migrant Workers, 8 September 1st October 015, Harare, Zimbabwe Presentation 1. Overview of labour migration in Africa: Data and emerging trends Aurelia Segatti, Labour Migration
MIGRATION TRENDS IN SOUTH AMERICA
 South American Migration Report No. 1-217 MIGRATION TRENDS IN SOUTH AMERICA South America is a region of origin, destination and transit of international migrants. Since the beginning of the twenty-first
Chapter 18 Development and Globalization
 Chapter 18 Development and Globalization 1. Levels of Development 2. Issues in Development 3. Economies in Transition 4. Challenges of Globalization Do the benefits of economic development outweigh the
Conference of the Parties to the United Nations Convention against Transnational Organized Crime
 United Nations CTOC/COP/WG.4/2015/6 Conference of the Parties to the United Nations Convention against Transnational Organized Crime Distr.: General 26 November 2015 Original: English Report on the meeting
FACTS. Smuggling of migrants The harsh search for a better life. Transnational organized crime: Let s put them out of business
 Smuggling of migrants The harsh search for a better life The smuggling of migrants is a truly global concern, with a large number of countries affected by it as origin, transit or destination points. Profit-seeking
REMITTANCE PRICES W O R L D W I D E
 Public Disclosure Authorized Public Disclosure Authorized Public Disclosure Authorized Public Disclosure Authorized REMITTANCE PRICES W O R L D W I D E PAYMENT SYSTEMS DEVELOPMENT GROUP FINANCIAL AND PRIVATE
Monthly Migration Movements Afghan Displacement Summary Migration to Europe November 2017
 Monthly Migration Movements Afghan Displacement Summary Migration to Europe November 2017 Introduction This month the CASWA 4Mi paper analyses 89 questionnaires collected from Afghans who have migrated
The National Police Immigration Service (NPIS) forcibly returned 412 persons in December 2017, and 166 of these were convicted offenders.
 forcibly returned 412 persons in December 2017, and 166 of these were convicted offenders.") Monthly statistics December 2017: Forced returns from Norway The National Police Immigration Service (NPIS) forcibly returned 412 persons in December 2017, and 166 of these were convicted offenders. The
Monthly statistics December 2017: Forced returns from Norway The National Police Immigration Service (NPIS) forcibly returned 412 persons in December 2017, and 166 of these were convicted offenders. The
Stopping the Destructive Spread of Small Arms
 AP Photo/Farah Abdi Warsameh Stopping the Destructive Spread of Small Arms How Small Arms and Light Weapons Proliferation Undermines Security and Development Rachel Stohl and EJ Hogendoorn March 2010 www.americanprogress.org
Airport Communication Project (AIRCOP)
") Real time operational communication between international airports to fight transnational organized crime, including drug trafficking, and terrorism. Airport Communication Project (AIRCOP) AVSEC WORLD
Real time operational communication between international airports to fight transnational organized crime, including drug trafficking, and terrorism. Airport Communication Project (AIRCOP) AVSEC WORLD
New trends in the expansion of Western Balkan Organized Crime
 DIRECTORATE GENERAL FOR INTERNAL POLICIES POLICY DEPARTMENT C: CITIZENS' RIGHTS AND CONSTITUTIONAL AFFAIRS JUSTICE, FREEDOM AND SECURITY New trends in the expansion of Western Balkan Organized Crime NOTE
Global Trends in Location Selection Final results for 2005
 Global Business Services Plant Location International Global Trends in Location Selection Final results for 2005 September, 2006 Global Business Services Plant Location International 1. Global Overview
Europol External Strategy. Business Case: Cooperation with Mexico
 A EX 4 The Hague, 4 April 2012 File no. 2642-48 EDOC # 596028 v7 Europol External Strategy Business Case: Cooperation with Mexico 1. Aim The purpose of this Business Case is to provide additional information
The UK in the international mobilities: A country well-integrated in communication networks
 I. The UK in the international mobilities: Since the last 50 decades, the number of migrants has rapidly increased: 75 million of international migrants in 1965, à 111 millions in 1985, 165 millions in
HUMAN RESOURCES IN R&D
 HUMAN RESOURCES IN R&D This fact sheet presents the latest UIS S&T data available as of July 2011. Regional density of researchers and their field of employment UIS Fact Sheet, August 2011, No. 13 In the
ISU-ISU KEAMANAN NON-TRADISIONAL DI ASIA TENGGARA PASKA PERANG DINGIN. Dewi Triwahyuni
 ISU-ISU KEAMANAN NON-TRADISIONAL DI ASIA TENGGARA PASKA PERANG DINGIN Dewi Triwahyuni Paska Perang Dingin, isu-isu keamanan tradisional masih menjadi isu utama di Asia tenggara, namun isu-isu keamanan
Contracting Parties to the Ramsar Convention
 Contracting Parties to the Ramsar Convention 14/12/2016 Number of Contracting Parties: 169 Country Entry into force Notes Albania 29.02.1996 Algeria 04.03.1984 Andorra 23.11.2012 Antigua and Barbuda 02.10.2005
Migration and Developing Countries
 Migration and Developing Countries Jeff Dayton-Johnson Denis Drechsler OECD Development Centre 28 November 2007 Migration Policy Institute Washington DC International migration and developing countries
The Instrument for Stability
 European External Action Service The Instrument for Stability Fight against organised crime on the cocaine route European Security Strategy 2003 ESS Report 2008 Organised Crime: Europe is a prime target
The Role of the European Union in the global governance of Transnational Organized Crime
 The Role of the European Union in the global governance of Transnational Organized Crime Organized by the Center for European Studies of the University of Michigan 30th March 2015 Juan Pablo Soriano Faculty
GLOBAL RISKS OF CONCERN TO BUSINESS WEF EXECUTIVE OPINION SURVEY RESULTS SEPTEMBER 2017
 GLOBAL RISKS OF CONCERN TO BUSINESS WEF EXECUTIVE OPINION SURVEY RESULTS SEPTEMBER 2017 GLOBAL RISKS OF CONCERN TO BUSINESS Results from the World Economic Forum Executive Opinion Survey 2017 Survey and
Organised environmental crime in the EU Member States
 Page I Management Summary The present study Organised 1 Environmental Crime in the 15 EU Member States provides - a research of cases of organised environmental crime in the EU Member States, - an analyses
Conference of the Parties to the United Nations Convention against Transnational Organized Crime
 United Nations CTOC/COP/WG.6/2015/3 Conference of the Parties to the United Nations Convention against Transnational Organized Crime Distr.: General 18 June 2015 Original: English Working Group on Firearms
World Economic and Social Survey
 World Economic and Social Survey Annual flagship report of the UN Department for Economic and Social Affairs Trends and policies in the world economy Selected issues on the development agenda 2004 Survey
The NPIS is responsible for forcibly returning those who are not entitled to stay in Norway.
 Monthly statistics December 2014: Forced returns from Norway The National Police Immigration Service (NPIS) forcibly returned 532 persons in December 2014. 201 of these returnees had a criminal conviction
GENERALIZED SYSTEM OF PREFERENCES HANDBOOK ON THE SCHEME OF HUNGARY
 GENERALIZED SYSTEM OF PREFERENCES HANDBOOK ON THE SCHEME OF HUNGARY GENERALIZED SYSTEM OF PREFERENCES HANDBOOK ON THE SCHEME OF HUNGARY (INT/97/A06) UNCTAD Technical Cooperation Project on Market Access,
Portugal Security Report for 2017 (RASI)
") Portugal Security Report for 2017 (RASI) Overall The Annual Homeland Security Report (RASI) for 2017, has been presented to the Assembly of the Republic. Total crime for 2017 stood at 341,950 reported
Portugal Security Report for 2017 (RASI) Overall The Annual Homeland Security Report (RASI) for 2017, has been presented to the Assembly of the Republic. Total crime for 2017 stood at 341,950 reported
Summary of the Results
 Summary of the Results CHAPTER I: SIZE AND GEOGRAPHICAL DISTRIBUTION OF THE POPULATION 1. Trends in the Population of Japan The population of Japan is 127.77 million. It increased by 0.7% over the five-year
TRANSNATIONAL CRIME - A THREAT TO REGIONAL ECONOMIC SECURITY
 TRANSNATIONAL CRIME - A THREAT TO REGIONAL ECONOMIC SECURITY Ph.D. Professor Florin TUDOR 1 Abstract: Transnational organized crime has become a key issue in international affairs and, unfortunately, one
Delays in the registration process may mean that the real figure is higher.
 Monthly statistics December 2013: Forced returns from Norway The National Police Immigration Service (NPIS) forcibly returned 483 persons in December 2013. 164 of those forcibly returned in December 2013
International Emigrants
 International Emigrants This map shows the proportion of the world s international emigrants coming from each territory. The map indicates that emigrants origins are not dominated by any single region.
EU MIGRATION POLICY AND LABOUR FORCE SURVEY ACTIVITIES FOR POLICYMAKING. European Commission
 EU MIGRATION POLICY AND LABOUR FORCE SURVEY ACTIVITIES FOR POLICYMAKING European Commission Over the past few years, the European Union (EU) has been moving from an approach on migration focused mainly
AMNESTY INTERNATIONAL REPORT 1997
 EMBARGOED UNTIL 0001 HRS GMT, WEDNESDAY 18 JUNE 1997 AMNESTY INTERNATIONAL REPORT 1997 Annual Report Statistics 1997 AI INDEX: POL 10/05/97 NOTE TO EDITORS: The following statistics on human rights abuses
Shares of data by source of information for the 2016 Global Report. edition
 Annex I: Methodology and data coverage The quantitative and qualitative information that form the basis of the Global Report was collected by UNODC in two ways: through a dedicated questionnaire 1 distributed
Diaspora Bonds for Education
 Diaspora Bonds for Education Suhas Ketkar Vanderbilt University & Dilip Ratha The World Bank Diaspora Bonds: Introduction Definition: Bonds issued by a country to its own Diaspora to tap in their wealth
Translation from Norwegian
 Statistics for May 2018 Forced returns from Norway The National Police Immigration Service (NPIS) forcibly returned 402 persons in May 2018, and 156 of these were convicted offenders. The NPIS is responsible
THIRD PART INTERNATIONAL COOPERATION 81
 THIRD PART INTERNATIONAL COOPERATION 81 Annual Report 2007 International cooperation Even in 2007, the D.C.S.A. aim of strengthening international cooperation relations was achieved: in fact, only the
DURABLE SOLUTIONS AND NEW DISPLACEMENT
 CHAPTER III DURABLE SOLUTIONS AND NEW DISPLACEMENT INTRODUCTION One key aspect of UNHCR s work is to provide assistance to refugees and other populations of concern in finding durable solutions, i.e. the
Crime and instability. Case studies of transnational threats
 Crime and instability Case studies of transnational threats February 2010 Copyright 2010, United Nations Office on Drugs and Crime (UNODC) Acknowledgements This report was prepared by the Studies and Threat
Middle School Level. Middle School Section I
 017 Montessori Model UN New York Conference Matrix DISEC ECOFIN SOCHUM LEGAL SPECPOL UNGA5 UNSC Japan 14 People s Republic of China 14 Republic of Angola 14 Republic of France 14 Russian Federation 14
The National Police Immigration Service (NPIS) returned 444 persons in August 2018, and 154 of these were convicted offenders.
 returned 444 persons in August 2018, and 154 of these were convicted offenders.") Monthly statistics August 2018 Forced returns from Norway The National Police Immigration Service (NPIS) returned 444 persons in August 2018, and 154 of these were convicted offenders. The NPIS is responsible
Monthly statistics August 2018 Forced returns from Norway The National Police Immigration Service (NPIS) returned 444 persons in August 2018, and 154 of these were convicted offenders. The NPIS is responsible
Asia-Pacific to comprise two-thirds of global middle class by 2030, Report says
 Strictly embargoed until 14 March 2013, 12:00 PM EDT (New York), 4:00 PM GMT (London) Asia-Pacific to comprise two-thirds of global middle class by 2030, Report says 2013 Human Development Report says
The National Police Immigration Service (NPIS) forcibly returned 375 persons in March 2018, and 136 of these were convicted offenders.
 forcibly returned 375 persons in March 2018, and 136 of these were convicted offenders.") Statistics March 2018: Forced returns from Norway The National Police Immigration Service (NPIS) forcibly returned 375 persons in March 2018, and 136 of these were convicted offenders. The NPIS is responsible
Statistics March 2018: Forced returns from Norway The National Police Immigration Service (NPIS) forcibly returned 375 persons in March 2018, and 136 of these were convicted offenders. The NPIS is responsible
Con!:,rressional Research Service The Library of Congress
 ....... " CRS ~ort for_ C o_n~_e_s_s_ Con!:,rressional Research Service The Library of Congress OVERVIEW Conventional Arms Transfers in the Post-Cold War Era Richard F. Grimmett Specialist in National
GOALS 9 ISSUE AREAS. page 7. page 5. page 6. page 8. page 1 page 2. page 9
 The Stable Seas Maritime Security Index is a first-of-its-kind effort to measure and map a range of threats to maritime governance and the capacity of nations to counter these threats. By bringing diverse
Share of Countries over 1/3 Urbanized, by GDP per Capita (2012 $) 1960 and 2010
 1960 and 2010") Share of Countries over 1/3 Urbanized, by GDP per Capita (2012 $) 1960 and 2010 Share Urbanized 0.2.4.6.8 1 $0-1000 $1000-2000 $2000-3000 $3000-4000 $4000-5000 1960 2010 Source: World Bank Welfare Economics
Share of Countries over 1/3 Urbanized, by GDP per Capita (2012 $) 1960 and 2010 Share Urbanized 0.2.4.6.8 1 $0-1000 $1000-2000 $2000-3000 $3000-4000 $4000-5000 1960 2010 Source: World Bank Welfare Economics
MIGRATION IN SPAIN. "Facebook or face to face? A multicultural exploration of the positive and negative impacts of
 "Facebook or face to face? A multicultural exploration of the positive and negative impacts of Science and technology on 21st century society". MIGRATION IN SPAIN María Maldonado Ortega Yunkai Lin Gerardo
Questions and answers on the EU Action Plan against Wildlife Trafficking
 EUROPEAN COMMISSION MEMO Brussels, 26 February 2016 Questions and answers on the EU Action Plan against Wildlife Trafficking Today the European Commission adopted an EU Action Plan to crack down wildlife
21 ST AFRICAN REGIONAL CONFERENCE (GABORONE, BOTSWANA 16 FEBRUARY 2011) REMARKS RONALD K. NOBLE INTERPOL SECRETARY GENERAL
 REMARKS RONALD K. NOBLE INTERPOL SECRETARY GENERAL") 21 ST AFRICAN REGIONAL CONFERENCE (GABORONE, BOTSWANA 16 FEBRUARY 2011) REMARKS BY RONALD K. NOBLE INTERPOL SECRETARY GENERAL Excellency, Acting Minister of Defence, Justice and Security, Mr Edwin Jenamiso
21 ST AFRICAN REGIONAL CONFERENCE (GABORONE, BOTSWANA 16 FEBRUARY 2011) REMARKS BY RONALD K. NOBLE INTERPOL SECRETARY GENERAL Excellency, Acting Minister of Defence, Justice and Security, Mr Edwin Jenamiso
Payments from government to people
 3 PAYMENTS Most people make payments such as for utility bills or domestic remittances. And most receive payments such as wages, other payments for work, or government transfers. The 2017 Global Findex
A Rights- based approach to Labour Migration
 A Rights- based approach to Labour Migration www.itcilo.org International Training Centre of the ILO 1 Question 1 What is the definition of Labour Migration : A = Defined as the movement of people from
NATIONAL SOUTHWEST BORDER COUNTERNARCOTICS STRATEGY Unclassified Summary
 NATIONAL SOUTHWEST BORDER COUNTERNARCOTICS STRATEGY Unclassified Summary INTRODUCTION The harsh climate, vast geography, and sparse population of the American Southwest have long posed challenges to law
Mechanism for the Review of Implementation of the United Nations Convention against Corruption: country pairings for the second review cycle
 Mechanism for the Review of Implementation of the United Nations Convention against Corruption: country pairings for the second review cycle In the first year, a total of 29 reviews will be conducted.
UNHCR PRESENTATION. The Challenges of Mixed Migration Flows: An Overview of Protracted Situations within the Context of the Bali Process
 Bali Process on People Smuggling, Trafficking in Persons and Related Transnational Crime Senior Officials Meeting 24-25 February 2009, Brisbane, Australia UNHCR PRESENTATION The Challenges of Mixed Migration
17th Asian Regional Conference Colombo, Sri Lanka, February 2002
 17th Asian Regional Conference Colombo, Sri Lanka, 18-22 February 2002 by Mr. Willy Deridder Executive Director, INTERPOL General Secretariat Ladies and Gentlemen It is an honour for me to address you
Exemplar for Internal Achievement Standard. Geography Level 2
 Exemplar for Internal Achievement Standard Geography Level 2 This exemplar supports assessment against: Achievement Standard 91246 Explain aspects of a geographic topic at a global scale An annotated exemplar
SCALE OF ASSESSMENT OF MEMBERS' CONTRIBUTIONS FOR 1994
 International Atomic Energy Agency GENERAL CONFERENCE Thirtyseventh regular session Item 13 of the provisional agenda [GC(XXXVII)/1052] GC(XXXVII)/1070 13 August 1993 GENERAL Distr. Original: ENGLISH SCALE
Global Prevalence of Adult Overweight & Obesity by Region
 Country Year of Data Collection Global Prevalence of Adult Overweight & Obesity by Region National /Regional Survey Size Age Category % BMI 25-29.9 %BMI 30+ % BMI 25- %BMI 30+ 29.9 European Region Albania
Trends in transnational crime routes
 An estimated 3,600 organized crime groups are active within the European Union. 1 These underground networks are becoming increasingly internationalized and professionalized. They thrive on advancements
Ontario Model United Nations II. Disarmament and Security Council
 Ontario Model United Nations II Disarmament and Security Council Committee Summary The First Committee of the United Nations General Assembly deals with disarmament, global challenges and threats to peace
Africa-Asia Pacific Symposium on Strengthening Legal Frameworks to Combat Wildlife Crime
 In partnership with Africa-Asia Pacific Symposium on Strengthening Legal Frameworks to Combat Wildlife Crime United Nations Inter-Agency Task Force on Illicit Trade in Wildlife and Forest Products Bangkok,
Conference of the Parties to the United Nations Convention against Transnational
 United Nations Conference of the Parties to the United Nations Convention against Transnational Organized Crime Distr.: General 29 June 2012 Original: English Sixth session Vienna, 15-19 October 2012 Item
Conference of the Parties to the United Nations Convention against Transnational Organized Crime
 United Nations CTOC/COP/WG.7/2013/5 Conference of the Parties to the United Nations Convention against Transnational Organized Crime Distr.: General 19 November 2013 Original: English Working Group on
LIST OF CHINESE EMBASSIES OVERSEAS Extracted from Ministry of Foreign Affairs of the People s Republic of China *
 ANNEX 1 LIST OF CHINESE EMBASSIES OVERSEAS Extracted from Ministry of Foreign Affairs of the People s Republic of China * ASIA Chinese Embassy in Afghanistan Chinese Embassy in Bangladesh Chinese Embassy
I. LEVELS AND TRENDS IN INTERNATIONAL MIGRANT STOCK
 I. LEVELS AND TRENDS IN INTERNATIONAL MIGRANT STOCK A. INTERNATIONAL MIGRANT STOCK BY DEVELOPMENT GROUP The Population Division estimates that, worldwide, there were 214.2 million international migrants
Number of citizenships among victims detected in destination countries, by region of destination,
 EXECUTIVE SUMMARY 1) NO COUNTRY IS IMMUNE FROM TRAFFICKING IN PERSONS Victims are trafficked along a multitude of trafficking flows; within countries, between neighbouring countries or even across different
IOM International Organization for Migration OIM Organisation Internationale pour les Migrations IOM Internationale Organisatie voor Migratie REAB
 IOM International Organization for Migration OIM Organisation Internationale pour les Migrations IOM Internationale Organisatie voor Migratie REAB Return and Emigration of Asylum Seekers ex Belgium Statistical
SLOW PACE OF RESETTLEMENT LEAVES WORLD S REFUGEES WITHOUT ANSWERS
 21 June 2016 SLOW PACE OF RESETTLEMENT LEAVES WORLD S REFUGEES WITHOUT ANSWERS Australia and the world s wealthiest nations have failed to deliver on promises to increase resettlement for the world s neediest
CLOSING SPEECH COMMISSIONER KOVACS. It is really a pleasure for me to be here today to close this successful event
 CLOSING SPEECH COMMISSIONER KOVACS INTRODUCTION It is really a pleasure for me to be here today to close this successful event and to address you as operational customs officials from the 25 Member States
2011 National Household Survey Profile on the Town of Richmond Hill: 1st Release
 2011 National Household Survey Profile on the Town of Richmond Hill: 1st Release Every five years the Government of Canada through Statistics Canada undertakes a nationwide Census. The purpose of the Census
A Note on International Migrants Savings and Incomes
 September 24, 2014 A Note on International Migrants Savings and Incomes Supriyo De, Dilip Ratha, and Seyed Reza Yousefi 1 Annual savings of international migrants from developing countries are estimated
3/21/ Global Migration Patterns. 3.1 Global Migration Patterns. Distance of Migration. 3.1 Global Migration Patterns
 3.1 Global Migration Patterns Emigration is migration from a location; immigration is migration to a location. Net migration is the difference between the number of immigrants and emigrants. Geography
The Future of Migration: Building Capacities for Change
 The Future of Migration: Building Capacities for Change World Migration Report 2010 International Organization for Migration (IOM) 1 Key Messages The WMR 2010 seeks to help States, regional and international
Definition of Key Terms
 Forum: The General Assembly 2 Issue: Student Officer: Position: The issue of remittance economies and protecting foreign worker rights Lyndsey Kong Assistant President Definition of Key Terms Remittance
BULGARIAN TRADE WITH EU IN THE PERIOD JANUARY - MARCH 2016 (PRELIMINARY DATA)
") BULGARIAN TRADE WITH EU IN THE PERIOD JANUARY - MARCH 2016 (PRELIMINARY DATA) In the period January - March 2016 Bulgarian exports to the EU grew by 2.6% in comparison with the same 2015 and amounted to
BULGARIAN TRADE WITH EU IN THE PERIOD JANUARY - MARCH 2016 (PRELIMINARY DATA) In the period January - March 2016 Bulgarian exports to the EU grew by 2.6% in comparison with the same 2015 and amounted to
IV. URBANIZATION PATTERNS AND RURAL POPULATION GROWTH AT THE COUNTRY LEVEL
 IV. URBANIZATION PATTERNS AND RURAL POPULATION GROWTH AT THE COUNTRY LEVEL Urbanization patterns at the country level are much more varied than at the regional level. Furthermore, for most countries, the
BULGARIAN TRADE WITH EU IN THE PERIOD JANUARY - FEBRUARY 2017 (PRELIMINARY DATA)
") BULGARIAN TRADE WITH EU IN THE PERIOD JANUARY - FEBRUARY 2017 (PRELIMINARY DATA) In the period January - February 2017 Bulgarian exports to the EU increased by 9.0% to the same 2016 and amounted to 4 957.2
BULGARIAN TRADE WITH EU IN THE PERIOD JANUARY - FEBRUARY 2017 (PRELIMINARY DATA) In the period January - February 2017 Bulgarian exports to the EU increased by 9.0% to the same 2016 and amounted to 4 957.2
UN WOMEN BACKGROUND GUIDE CHAIRS AARYA TAVSHIKAR ADITI KALIA LEXINGTON MODEL UNITED NATIONS CONFERENCE
 UN WOMEN BACKGROUND GUIDE CHAIRS AARYA TAVSHIKAR ADITI KALIA LEXINGTON 1 AWARDS CRITERIA: Delegates should put forward the best possible solutions to the problem at hand, through sponsoring or signing
Mechanism for the Review of Implementation of the United Nations Convention against Corruption: country pairings for the second review cycle
 Mechanism for the Review of Implementation of the United Nations Convention against Corruption: country pairings for the second review cycle In the first year, a total of 29 reviews will be conducted.
VISION IAS
 VISION IAS www.visionias.in (Major Issues for G.S. Advance Batch : 2015) GLOBAL REFUGEE CRISIS Table of Content 1 Introduction... 2 2 Worst Affected Regions... 2 3 Refugee Crisis: a shared responsibility...
Country pairings for the second cycle of the Mechanism for the Review of Implementation of the United Nations Convention against Corruption
 Country pairings for the second cycle of the Mechanism for the Review of Implementation of the United Nations Convention against Corruption In year 1, a total of 29 reviews will be conducted: Regional
CHAPTER 12: The Problem of Global Inequality
 1. Self-interest is an important motive for countries who express concern that poverty may be linked to a rise in a. religious activity. b. environmental deterioration. c. terrorist events. d. capitalist
The Strategic Marketing Institute Working Paper
 The Strategic Marketing Institute Working Paper Spending on Food: Implications for Michigan Agriculture William A. Knudson 1-1003 October 2003 Introduction Researchers at the Economic Research Service
Return of convicted offenders
 Monthly statistics December : Forced returns from Norway The National Police Immigration Service (NPIS) forcibly returned 869 persons in December, and 173 of these were convicted offenders. The NPIS forcibly
Trafficking in Persons
 p. 1 Trafficking in Persons United Nations Expert Group Meeting on International Migration and Development (July, 2005) by Irena Omelaniuk Migration Adviser, The World Bank Trafficking Defined p. 2-3(A)
ACE GLOBAL A Snapshot
 ACE GLOBAL A Snapshot FACTS Present in 46 countries worldwide Provide asset Management to 172 financial institutions Total assets in excess of US$ 9 billion More than 4,800 employees HISTORY ACE GLOBAL,