Simcoe County Census 2016 Update. Prepared by Research Analyst
|
|
|
- Rachel Lyons
- 6 years ago
- Views:
Transcription

1 Simcoe County Census 2016 Update Prepared by Research Analyst


2 Census 2016 Update 1. Census Population Growth 3. Children 0-6 years 4. Census Families 5. Median Household Income 6. Prevalence of Low-Income 7. Language 8. Immigrant Population 9. Next Census releases 10. Community Reports / Data 11. Simcoe Community Data web Page

3 Background 2016 Census is the most recent detailed enumeration of the Canadian residents. Response Rate was 98%! Statistics Canada has been releasing data during 2017 year Social Policy and Planning Research Team is working on the most recent updates for Simcoe County and its municipalities.


4 Population Growth POPULATION GROWTH % +4.6% +7.5% Simcoe County Population growing faster compared to Canada and Ontario overall Canada Ontario Simcoe 446,063 TOTAL POPULATION IN SIMCOE COUNTY 2011 AND ,650 Simcoe s population grew by 7.5% between 2011 and 2016, from 445,063 to 479,
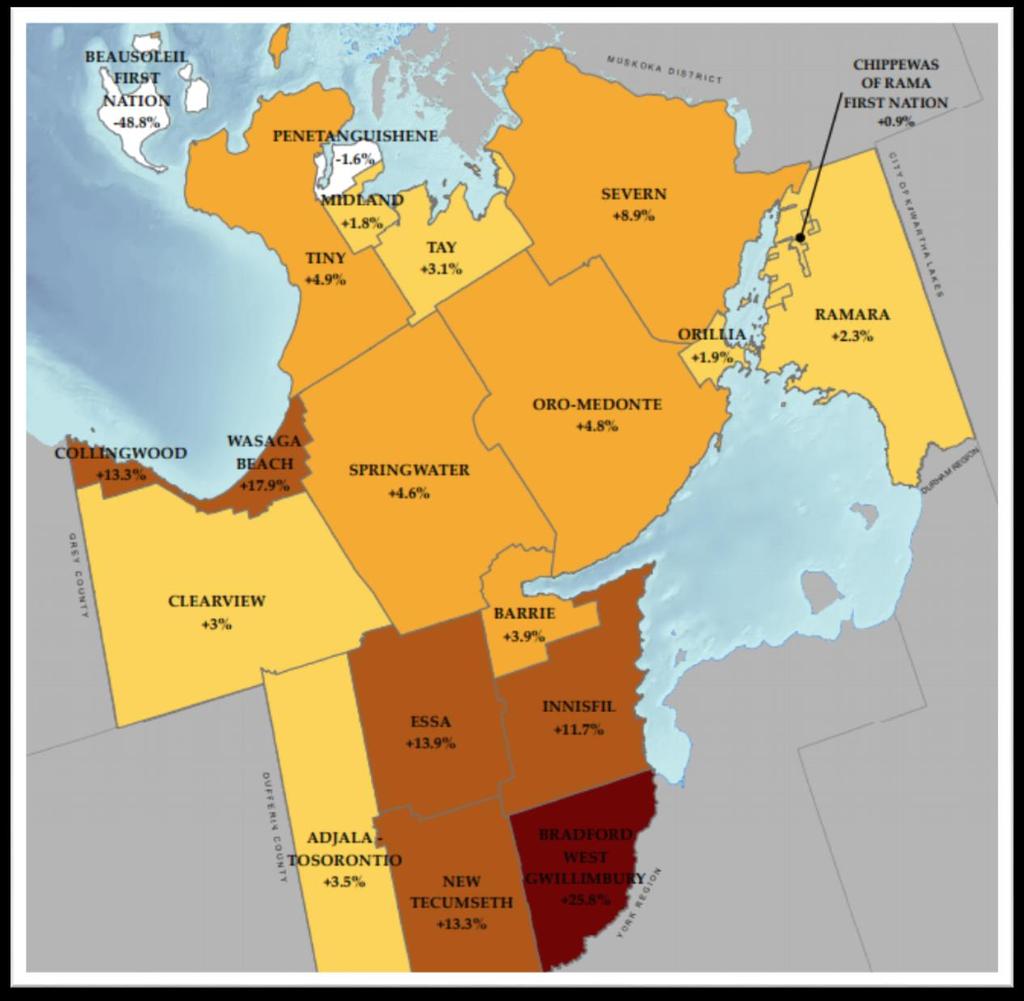
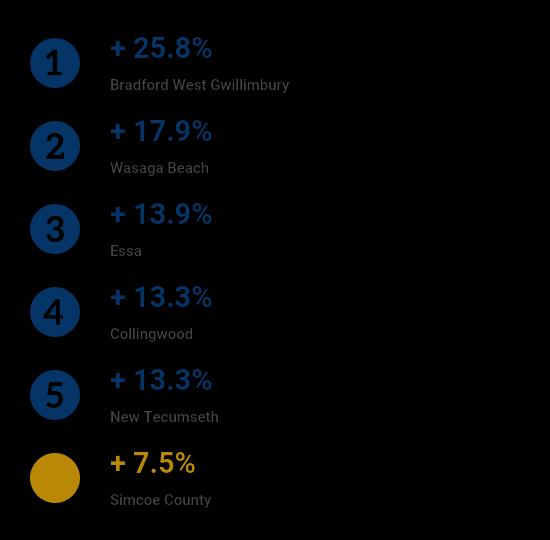
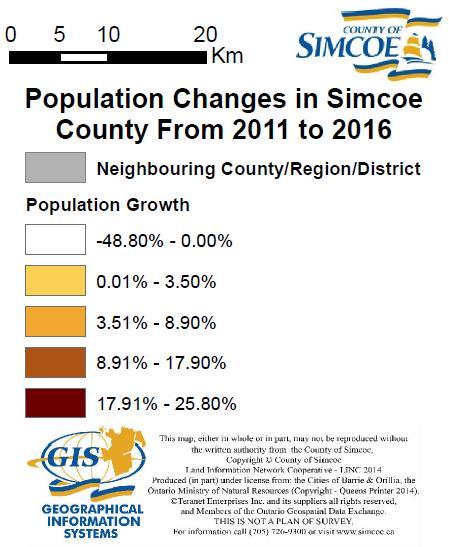
5 Population Growth in Simcoe County,
6 Children 0-6: Growth Population Growth in Simcoe County and Ontario 0-6 years Ontario Simcoe County Bradford West Gwillimbury Essa Wasaga Beach Innisfil Severn New Tecumseth Clearview Collingwood Tiny Tay Midland Springwater Ramara Adjala-Tosorontio Oro-Medonte Orillia Barrie Penetanguishene -9% -1% -3% -4% -4% 1% 6% 6% 5% 3% 2% 2% 0% 9% 18% 18% 16% 14% 14% 44%


7 Children 0-6: Share Overall, 7.3% of the total population living in Simcoe County are children aged 0-6 years Simcoe s municipalities with the highest proportion of children 0-6 years: 10.2 % Bradford West Gwillimbury 8.2% Essa 7.9% Barrie

8 Census Families In 2016 the family structure remained approximately the same compared to 2011 Out of total number of Census Families living in private households, 68% were married couples, 15% - common-low couples, and the rest 16% were loneparent families Common-law couples 16% Lone-parent families 15% Married Couples 68% 'Census family' is defined as a married couple and the children, if any, of either and/or both spouses; a couple living common law and the children, if any, of either and/or both partners; or a lone parent of any marital status with at least one child living in the same dwelling and that child or those children. All members of a particular census family live in the same dwelling. A couple may be of opposite or same sex.

9 Median Household Income Median total Income of Private Households in 2015 ($) Adjala-Tosorontio $100,523 Springwater $99,553 Oro-Medonte $95,667 Bradford West Gwillimbury $93,254 Essa $87,243 New Tecumseth $85,988 Innisfil $83,516 Clearview $78,519 Barrie $77,904 Severn $77,009 Ramara $72,160 Tiny $69,915 Tay $65,190 Collingwood $64,369 Wasaga Beach $62,150 Penetanguishene $59,738 Orillia $55,802 Midland $54,878 Mnjikaning First Nation $44,800 Christian Island (Combined) $32,608 Simcoe $76,489 Ontario $74,287 Canada $70,336


10 Prevalence of Low-Income Overall the prevalence of Low-Income in Simcoe County is lower than in Ontario and Canada, but slightly increased since 2005 The prevalence of low-income among children 0-5 years old increased by 4% in 2015 compared to 2005, and is by 5% higher than the prevalence of lowincome among the total population of Simcoe County Prevalence of Low-Income (LIM-AT) Simcoe Ontario Canada Simcoe Ontario Canada Total Population Age Group Prevalence of Low-Income ia the proportion or percentage of units whose income falls below a specified low-income line. For the 2016 Census, the reference period is the calendar year 2015 for all income variables.


11 Low-Income and Lone-Parents Individuals Living in Low- Income Households, 2016 Proportion of Lone-Parent Families, 2016

 as")


12 Language 89.8% of the population of Simcoe County reported an official language (English or French) as being their mother tongue The number of people who reported a non-official mother tongue rose from 38,470 in 2011 to 47,750 in This is an increase of 9,280 people or 24.1%. Top-five immigrant mother-tongues in Simcoe County in 2016: 1. Italian 5, German 4, Portuguese 4, Spanish 3, Polish 3,300


13 Immigrant Population 77, % Population 0 to 14 Years in Simcoe County 1, % % % Non Immigrants Immigrants Recents Immigrants 2011 to 2016 Immigrant refers to a person who is, or who has ever been, a landed immigrant or permanent resident. Such a person has been granted the right to live in Canada permanently by immigration authorities. *Immigrants who have obtained Canadian citizenship by naturalization are included in this group. Recent immigrant refers to an immigrant who first obtained his or her landed immigrant or permanent resident status between January 1, 2011 and May 10, Refugee includes immigrants who were granted permanent resident status on the basis of a well-founded fear of returning to their home country.


14 Country of Birth Immigrants Recent Immigrants Top 3 Countries of Origin in Simcoe County in 2016 Top 3 Countries of Origin in Simcoe County in United Kingdom: 13,410 or 21.8% of immigrants 2. Italy: 3,785 or 6.1% of immigrants 3. Germany: 3,515 or 5.7% of immigrants 1. Philippines: 480 or 11.7% of recent immigrants 2. China: 365 or 8.9% of recent immigrants 3. India: 350 or 8.5% of recent immigrants


15 More to come! Remaining census data release schedule November 29: Education Labour Journey to work Language of work Mobility and migration


16 Administrative & Community Reports

17 simcoe.ca/communitydata Visit simcoe.ca/communitydata web page for more Simcoe County reports and local data Census reports Interactive graphs Thematic Maps Administrative data reports Community Engagement reports
We hope you find this report useful. It is available online at the websites of each of the contributing organizations:
 1 Over half of Ontario s population lives and works in the province s central region. With high rates of immigration, commuting and re-location based on life stage, the region is often on the move. In
CITY OF MISSISSAUGA. Overview 2-1. A. Demographic and Cultural Characteristics
 Portraits of Peel Overview 2-1 A. Demographic and Cultural Characteristics Population: Size, Age and Growth 2-2 Immigrants 2-3 Visible Minorities 2-4 Language 2-5 Religion 2-6 Mobility Status 2-7 B. Household
BRAMALEA. Overview A. Demographic and Cultural Characteristics
 The Social Planning Council of Peel Portraits of Peel BRAMALEA Overview 13-1 A. Demographic and Cultural Characteristics Population: Size, Age and Growth 13-2 Immigrants 13-3 Visible Minorities 13-4 Language
Local Immigration Partnership Community Settlement Strategy
 2012 Local Immigration Partnership Community Settlement Strategy V1 Table of Contents Message from the Chief Administrative Officer Message from the Partnership Council Simcoe County Local Immigration
Highlands A District Municipality in Capital Regional District
 Produced by Stats for Global NonResponse Rate: 33 Population Total Immigrants Change in Change in Immigrants Population Number Percent Population Number Percent 1991 1,94 1991 to 1996 329 1996 1,423 21
Ward 16 River. City of Ottawa Ward Profiles 2011 Census and National Household Survey POPULATION* 45, ,390. Total City of Ottawa Population
 POPULATION* Total Ward Population 45,795 +2.0% 2006-2011 Total City of Ottawa Population 883,390 +8.8% 2006-2011 Population by Age Group Ward 16 City of Ottawa 2006 2011 06-11 2006 2011 06-11 Age Group
2011 National Household Survey Profile on the Town of Richmond Hill: 1st Release
 2011 National Household Survey Profile on the Town of Richmond Hill: 1st Release Every five years the Government of Canada through Statistics Canada undertakes a nationwide Census. The purpose of the Census
2011 CENSUS & NATIONAL HOUSEHOLD SURVEY CITY OF BRAMPTON - WARD 1 PROFILE
 CENSUS & NATIONAL HOUSEHOLD SURVEY CITY OF BRAMPTON WARD 1 PROFILE WARD HIGHLIGHTS Population 53,130 Population 51.0% Females Population by Age Group 9% 20% 014 10.14% of total population 36 Median Age
2011 CENSUS & NATIONAL HOUSEHOLD SURVEY CITY OF BRAMPTON - WARD 3 PROFILE
 2011 CENSUS & NATIONAL HOUSEHOLD SURVEY CITY OF BRAMPTON WARD 3 PROFILE WARD HIGHLIGHTS Population 47,500 2011 Population 50.7% Females 2011 Population by Age Group 13% 18% 014 9.07% of total population
North York City of Toronto Community Council Area Profiles 2016 Census
 Bar Chart showing the rate of population growth between the years 2006 and 2016 for the Ward compared to the City of based on the 2006 and data. For more information, please contact Michael Wright at 416-392-7558
Verdun borough HIGHLIGHTS. In 1996, the Verdun borough had a population of 59,714. LOCATION
 Socio-economic profile borough February 2002 HIGHLIGHTS In 1996, the borough had a population of 59,714. LOCATION Between 1991 and 1996, the population of the borough declined by 2.6%. One-person households
Township of Georgian Bay 2018 Municipal Election Procedures
 Township of Georgian Bay Municipal Election Procedures Version: D Published: July 12, Please Note: Some legislated changes to the Municipal Election Act are not in effect until later in (outlined in red
2011 CENSUS & NATIONAL HOUSEHOLD SURVEY CITY OF BRAMPTON - WARD 4 PROFILE
 2011 CENSUS & NATIONAL HOUSEHOLD SURVEY CITY OF BRAMPTON WARD 4 PROFILE WARD HIGHLIGHTS Population 9.51% of total population 49,850 2011 Population 34 Median Age 50.5% Females 49.5% Males 2011 Population
2011 CENSUS & NATIONAL HOUSEHOLD SURVEY CITY OF BRAMPTON - WARD 10 PROFILE
 2011 CENSUS & NATIONAL HOUSEHOLD SURVEY CITY OF BRAMPTON WARD 10 PROFILE WARD HIGHLIGHTS Population 10.72% of total population 56,185 2011 Population 33 Median Age 50.1% Females 49.9% Males 2011 Population
Canada at 150 and the road ahead A view from Census 2016
 Canada at 150 and the road ahead A view from Census 2016 Dr. Doug Norris Senior Vice President and Chief Demographer 2017 Environics Analytics User Conference November 8, 2017 Canada continues to lead
Ward 4 Etobicoke Centre City of Toronto Ward Profiles 2016 Census
 Bar Chart showing the rate of population growth between the years 2006 and 2016 for the Ward compared to the City of based on the 2006 and data. For more information, please contact Michael Wright at 416-392-7558
Nelson A City in Central Kootenay Regional District
 Produced by Stats for Global NonResponse Rate: 28.3 Population Total Immigrants Change in Change in Immigrants Population Number Percent Population Number Percent 1991 8,849 1,175 13.3 1991 to 1996 736
Town of Gravenhurst 2018 Municipal Elections Procedures. Version: B
 Town of Gravenhurst 2018 Municipal Elections Procedures Version: B Published: April 16, 2018 2018 Municipal Election Procedures Page 1 Last Revision Date: March 9, 2018 INDEX Welcome Candidates, Third
Kaslo A Village in Central Kootenay Regional District
 Produced by Stats for Global NonResponse Rate: 46.8 Population Total Immigrants Change in Change in Immigrants Population Number Percent Population Number Percent 1991 863 15 17.4 1991 to 1996 2 15 1.
people/hectare Ward Toronto
 Bar Chart showing the rate of population growth between the years 2006 and 2016 for the Ward compared to the City of based on the 2006 and data. For more information, please contact Michael Wright at 416-392-7558
Ward 14 Parkdale-High Park City of Toronto Ward Profiles 2016 Census
 Bar Chart showing the rate of population growth between the years 2006 and 2016 for the Ward compared to the City of based on the 2006 and data. For more information, please contact Michael Wright at 416-392-7558
Logan Lake A District Municipality in Thompson-Nicola Regional District
 A District Municipality in ThompsonNicola Regional District Produced by Stats for Global NonResponse Rate: 48.9 Population Total Immigrants Change in Change in Immigrants Population Number Percent Population
CENSUS RESULTS WARD 9 PROFILE
 2011 CENSUS RESULTS WARD 9 PROFILE Town of Halton Hills City of Brampton Hwy. 407 Finch Ave. Town of Milton Hwy. 407 ETR Ninth Line 10 Derry Rd. Winston Churchill Blvd. 9 Erin Mills Pkwy. Mississauga Rd.
Study Area Maps. Profile Tables. W Broadway & Cambie St, Vancouver, BC Pitney Bowes 2016 Estimates and Projections. W Broadway & Cambie St
 Powered by PCensus Page 1 Study Area Maps Profile Tables 2016 Demographic Snapshot Population Trends Household Trends Population by Age and Sex Comparison Population by Age and Sex Household Maintainers
North Vancouver, City of A City in Greater Vancouver Regional District
 Global Non-Response Rate: 25.8 Population Total Immigrants Change in Change in Immigrants Population Number Percent Population Number Percent 1991 38,436,8 28.2 1991 to 1996 3,39 2,46 22.7 1996 41,475
2016 Census Bulletin: Immigration & Ethnic Diversity
 2016 Census Bulletin: Immigration & Ethnic Diversity Kingston, Ontario Census Metropolitan Area (CMA) The 2016 Census Day was May 10, 2016. On October 25, 2017, Statistics Canada released its sixth data
TIEDI Labour Force Update September 2012
 The Toronto Immigrant Employment Data Initiative (TIEDI) s Labour Force Update aims to provide upto-date labour market data on immigrants. This monthly report relies on data from the Labour Force Survey
The population universe (target population) of the 2011 Census includes the following groups:
 of the 2011 Census includes the following groups:") Glossary DEMOGRAPHICS Population The population universe includes variables that provide information about individuals, covering demographic characteristics and language. See Figure 16 for a list of these
Glossary DEMOGRAPHICS Population The population universe includes variables that provide information about individuals, covering demographic characteristics and language. See Figure 16 for a list of these
2017 Simcoe County Emergency Shelter Database Analysis. For Period of January 1, 2017 December 31, 2017
 2017 Simcoe County Emergency Shelter Database Analysis For Period of January 1, 2017 December 31, 2017 Prepared by: Victoria Chapman, Research Analyst March 2018 Table of Contents Background... 4 Homelessness
CENSUS RESULTS WARD 8 PROFILE
 2011 CENSUS RESULTS WARD 8 PROFILE Town of Halton Hills City of Brampton Hwy. 407 Finch Ave. Town of Milton Hwy. 407 ETR Ninth Line 10 Derry Rd. Winston Churchill Blvd. 9 Erin Mills Pkwy. Mississauga Rd.
Ward 17 Davenport City of Toronto Ward Profiles 2016 Census
 Bar Chart showing the rate of population growth between the years 2006 and 2016 for the Ward compared to the City of based on the 2006 and data. For more information, please contact Michael Wright at 416-392-7558
Dufferin Grove: Neighbourhood Profile
 I. Population and Age Population 21 Neighbourhood Population: 12693 12% of Catchment Area Population: Change in population growth (1996-21): # 145 % 1% same as pop change in the catchment area Population
Chairman and Members of the Planning and Development Committee. Thomas S. Mokrzycki, Commissioner of Planning and Building
 CD.15.DAT DATE: TO: FROM: SUBJECT: Chairman and Members of the Planning and Development Committee Thomas S. Mokrzycki, Commissioner of Planning and Building Mississauga: A City of Many Cultures MEETING
CENSUS RESULTS WARD 3 PROFILE
 2011 CENSUS RESULTS WARD 3 PROFILE Town of Halton Hills City of Brampton Hwy. 407 Finch Ave. Town of Milton Hwy. 407 ETR Ninth Line 10 Derry Rd. Winston Churchill Blvd. 9 Erin Mills Pkwy. Mississauga Rd.
Immigrants Economic Integration: Successes and Challenges
 Social Planning Council of Ottawa REPORT SUMMARY Immigrants Economic Integration: Successes and Challenges A Profile of Immigrants in Ottawa Based on the 2006 Census June 2009 Suggested Donation: $20.00
TIEDI Labour Force Update January 2013
 The Toronto Immigrant Employment Data Initiative (TIEDI) s Labour Force Update aims to provide upto-date labour market data on immigrants. This monthly report relies on data from the Labour Force Survey
Lake Cowichan A Town in Cowichan Valley Regional District
 Global NonResponse Rate: 28 Population Total Change in Change in Population Number Percent Population Number Percent 1991 2,241 295 13.2 1991 to 1996 615 15 5.1 1996 2,856 28 9.8 1996 to 21 29 2 7.1 21
Skeena-Queen Charlotte A Regional District in British Columbia
 Global NonResponse Rate: 34.7 Population Total Immigrants Change in Change in Immigrants Population Number Percent Population Number Percent 1991 24,287 3,125 12.9 1991 to 1996 58 27 8.6 1996 24,795 2,855
Bostwick Neighbourhood Profile
 Bostwick Profile For further information contact: John-Paul Sousa Planning Research Analyst Direct: (519) 661-2500 ext. 5989 I email: jpsousa@london.ca Page 1 Page 2 Population Characteristics & Age Distribution
Lake Country A District Municipality in Central Okanagan Regional District
 Produced by Stats for Population Total Immigrants Change in Change in Immigrants Population Number Percent Population Number Percent 1991 1991 to 1996 1996 9,7 1,275 14.2 1996 to 1 26 7 5.5 1 9,267 1,345
Visit our Publications and Open Data Catalogue to find our complete inventory of our freely available information products.
 Welcome to Mississauga Data This report and other related documents can be found at www.mississauga.ca/data. Mississauga Data is the official City of Mississauga website that contains urban planning related
CENSUS RESULTS WARD 10 PROFILE
 2011 CENSUS RESULTS WARD 10 PROFILE Town of Halton Hills City of Brampton Hwy. 407 Finch Ave. Town of Milton Hwy. 407 ETR Ninth Line 10 Derry Rd. Winston Churchill Blvd. 9 Erin Mills Pkwy. Mississauga
Quesnel A City in Cariboo Regional District
 Produced by Stats for Global NonResponse Rate:.4 Population Total Immigrants Change in Change in Immigrants Population Number Percent Population Number Percent 1991 8,8 1,35 16.4 1991 to 1996 26 5.4 1996
Victoria A City in Capital Regional District
 Produced by Stats for Global Non-Response Rate: 24.6 Population Total Immigrants Change in Change in Immigrants Population Number Percent Population Number Percent 1991 71,228 14,665 20.6 1991 to 1996
Spallumcheen A District Municipality in North Okanagan Regional District
 Produced by Stats for Global NonResponse Rate: 45.4 Population Total Immigrants Change in Change in Immigrants Population Number Percent Population Number Percent 1991 4,717 66 14. 1991 to 1996 65 155
CENSUS BULLETIN #5 Immigration and ethnocultural diversity Housing Aboriginal peoples
 CENSUS BULLETIN #5 Immigration and ethnocultural diversity Housing Aboriginal peoples October 25, 217 Bulletin Highlights: 86.1 per cent of the Brampton s 216 surveyed population held a Canadian citizenship
Township of Muskoka Lakes 2018 Municipal Election Procedures. Version: 1
 Township of Muskoka Lakes 2018 Municipal Election Procedures Version: 1 Published: December 22, 2017 Page 1 INDEX INDEX... 1 Welcome Candidates, Third Party Advertisers and Electors... 4 A. INTRODUCTION...
Town of Gravenhurst 2018 Municipal Elections Procedures. Version: A
 Town of Gravenhurst 2018 Municipal Elections Procedures Version: A Published: December 15, 2017 Page 1 INDEX INDEX... 1 Welcome Candidates, Third Party Advertisers and Electors... 3 A. INTRODUCTION...
TIEDI Labour Force Update May 2011
 The Toronto Immigrant Employment Data Initiative (TIEDI) s Labour Force Update aims to provide upto-date labour market data on immigrants. This monthly report relies on data from the Labour Force Survey
Fanshawe Neighbourhood Profile
 Fanshawe Profile For further information contact: John-Paul Sousa Planning Research Analyst Direct: (519) 661-2500 ext. 5989 I email: jpsousa@london.ca Page 1 Page 2 Population Characteristics & Age Distribution
Scarborough City of Toronto Community Council Area Profiles 2016 Census
 Bar Chart showing the rate of population growth between the years 2006 and 2016 for the Ward compared to the City of based on the 2006 and data. For more information, please contact Michael Wright at 416-392-7558
Saanich A District Municipality in Capital Regional District
 Produced by Stats for Population Total Immigrants Change in Change in Immigrants Population Number Percent Population Number Percent 1991 95,583 20,285 21.2 1991 to 1996 5,805 755 3.7 1996 101,388 21,040
Castlegar A City in Central Kootenay Regional District
 Produced by Stats for Population Total Immigrants Change in Change in Immigrants Population Number Percent Population Number Percent 1991 6,579 885 13.5 1991 to 1996 448 45 5.1 1996 7,27 93 13.2 1996 to
IMMIGRANTS AND VISIBLE MINORITIES IN PEEL
 THE SOCIAL PLANNING COUNCIL OF PEEL ISSN #1198-5976 I n f o S h a r e VOLUME 11, NUMBER 1 MAY 2003 IMMIGRANTS AND VISIBLE MINORITIES IN PEEL Information on cultural diversity within a population is important
Fort St. James A District Municipality in Bulkley-Nechako Regional District
 A District Municipality in BulkleyNechako Regional District Produced by Stats for Global NonResponse Rate: 36.9 Population Total Immigrants Change in Change in Immigrants Population Number Percent Population
TIEDI Labour Force Update December 2012
 The Toronto Immigrant Employment Data Initiative (TIEDI) s Labour Force Update aims to provide upto-date labour market data on immigrants. This monthly report relies on data from the Labour Force Survey
Harrison Hot Springs A Village in Fraser Valley Regional District
 Global NonResponse Rate: 42.4 Population Total Immigrants Change in Change in Immigrants Population Number Percent Population Number Percent 1991 655 17 26. 1991 to 1996 243 3 17.6 1996 898 2 22.3 1996
CENSUS RESULTS WARD 7 PROFILE
 2011 CENSUS RESULTS WARD 7 PROFILE Town of Halton Hills City of Brampton Hwy. 407 Finch Ave. Town of Milton Hwy. 407 ETR Ninth Line 10 Derry Rd. Winston Churchill Blvd. 9 Erin Mills Pkwy. Mississauga Rd.
Census 2016 Summary Results Part 1
 Census 2016 Summary Results Part 1 Press conference, Government Buildings 6 th April 2017 Reminder Census Day : Sunday April 24 th 2016 Just over 2 million dwellings visited by 5,000 staff Preliminary
CENSUS RESULTS WARD 6 PROFILE
 2011 CENSUS RESULTS WARD 6 PROFILE Town of Halton Hills City of Brampton Hwy. 407 Finch Ave. Town of Milton Hwy. 407 ETR Ninth Line 10 Derry Rd. Winston Churchill Blvd. 9 Erin Mills Pkwy. Mississauga Rd.
Grand Forks A City in Kootenay-Boundary Regional District
 A City in KootenayBoundary Regional District Produced by Stats for Global NonResponse Rate: 45.8 Population Total Immigrants Change in Change in Immigrants Population Number Percent Population Number Percent
Creston A Town in Central Kootenay Regional District
 Produced by Stats for Global NonResponse Rate: 32.4 Population Total Immigrants Change in Change in Immigrants Population Number Percent Population Number Percent 1991 4,27 655 15.6 1991 to 1996 69 175
Evolution of Immigration and Projections of Net Migration for Canada
 Evolution of Immigration and Projections of Net Migration for Canada Session 141: Social Insurance Projections Migration 2 Michel Montambeault 1 Presentation Recent Statistics on Canadian Immigration Recent
North Okanagan A Regional District in British Columbia
 Population Total Immigrants Change in Change in Immigrants Population Number Percent Population Number Percent 1991 61,744 7,855 12.7 1991 to 1996 9,863 685 8.7 1996 71,67 8,54 11.9 1996 to 1 1,6-28 -
Planning Study Area 1 Burnaby Heights
 Neighbourhood Profiles 2006 Census Planning Study Area 1 Heights is bounded by Burrard Inlet to the north, Willingdon Avenue to the east, Hastings Street to the south and Boundary Road to the west. PLANNING
Port McNeill A Town in Mount Waddington Regional District
 Produced by Stats for Global NonResponse Rate: 35.1 Population Total Immigrants Change in Change in Immigrants Population Number Percent Population Number Percent 1991 2,641 225 8.5 1991 to 1996 284 5
Changing Faces Profile of Burlington Newcomers. November 2010
 Changing Faces Profile of Burlington Newcomers November 2010 2010 Community Development Halton, all rights reserved. Copies of this document may be reproduced non-commercially for the purpose of community
2016 Census: Release 5 Immigration and ethnocultural diversity, Housing and the Aboriginal population
 2016 Census: Release 5 Immigration and ethnocultural diversity, Housing and the Aboriginal population Dr. Doug Norris Senior Vice President and Chief Demographer November 2, 2017 Today s presenter Dr.
Enderby A City in North Okanagan Regional District
 Produced by Stats for Global NonResponse Rate: 44.3 Population Total Immigrants Change in Change in Immigrants Population Number Percent Population Number Percent 1991 2,128 23.8 1991 to 1996 626 3 13.
Post-Secondary Education, Training and Labour January New Brunswick Analysis 2016 Census Topic: Immigration
 Post-Secondary Education, Training and Labour January 2018 New Brunswick Analysis 2016 Census Topic: Contents General Information... 2 Overview... 2 Population... 2 Demographics... 3 Sub-Provincial...
City of Surrey. Preface. Citizenship and Immigration Fact Sheet
 City of Citizenship and Immigration Fact Sheet Preface Statistics Canada conducts its Census of Population every five years with the most recent census having occurred in 2006. The Census provides information
Tracking Trends in Kingston
 Tracking Trends in Photo: 22, Courtesy of City Hall Total Population: 152,358 Population Changes for CMAs, 21 to 26 25 19.2 2 15 1 11.6 9.2 8.9 8.2 6.6 59 5.9 55 5.5 54 5.4 51 5.1 51 5.1 5 5. 46 4.6 3.8
Strathcona A Regional District in British Columbia
 Produced by Stats for Population Total Immigrants Change in Change in Immigrants Population Number Percent Population Number Percent 1991 - - - 1991 to 1996 - - - 1996 - - - 1996 to 1 - - - 1 - - - 1 to
Immigrant Seniors in British Columbia
 Immigrant Seniors in British Columbia December 2010 Immigrant Seniors in British Columbia Most people who immigrate as seniors come to B.C. to reunite with their families. In fact, 86.2% of the 5,733 new
Immigrant and Temporary Resident Children in British Columbia
 and Temporary Resident Children in British Columbia January 2011 During the five-year period from 2005 to 2009, on average, approximately 40,000 immigrants arrived in B.C. annually and approximately 7,900
(Note: These are inititial neighbourhood estimates and are subject to change.) SCARBOROUGH SHORELINE. NEI Score. 1,500 Female 53%
 SCARBOROUGH SHORELINE. NEI Score. 1,500 Female 53%") 0-4 5-9 10-14 15-19 20-24 25-29 30-34 35-39 40-44 45-49 50-54 55-59 60-64 65-69 70-74 75-79 80-84 85-89 90-94 95-99 100+ 2011 Neighbourhood Demographic Estimates HIGHLAND CREEK WEST HIGHLAND CREEK KINGSTON
0-4 5-9 10-14 15-19 20-24 25-29 30-34 35-39 40-44 45-49 50-54 55-59 60-64 65-69 70-74 75-79 80-84 85-89 90-94 95-99 100+ 2011 Neighbourhood Demographic Estimates HIGHLAND CREEK WEST HIGHLAND CREEK KINGSTON
Osoyoos A Town in Okanagan-Similkameen Regional District
 A Town in OkanaganSimilkameen Regional District Produced by Stats for Global NonResponse Rate: 38.5 Population Total Immigrants Change in Change in Immigrants Population Number Percent Population Number
(Note: These are inititial neighbourhood estimates and are subject to change.) C P R. NEI Score. Female 52%
 C P R. NEI Score. Female 52%") 0-4 5-9 10-14 15-19 20-24 25-29 30-34 JANE ST 35-39 40-44 45-49 50-54 55-59 60-64 65-69 70-74 75-79 80-84 85-89 90-94 95-99 100+ 2011 Neighbourhood Demographic Estimates EGLINTON AVE W JANE ST WESTON RD
0-4 5-9 10-14 15-19 20-24 25-29 30-34 JANE ST 35-39 40-44 45-49 50-54 55-59 60-64 65-69 70-74 75-79 80-84 85-89 90-94 95-99 100+ 2011 Neighbourhood Demographic Estimates EGLINTON AVE W JANE ST WESTON RD
Burnaby A City in Greater Vancouver Regional District
 Produced by Stats for Global Non-Response Rate: 23.6 Population Total Change in Change in Population Number Percent Population Number Percent 1991 158,858 49,5 31.2 1991 to 1996,351 24,5 49.1 1996 179,9
City Windsor 1981 Canada Census WARD 1
 City Windsor 1981 Canada Census March 2, 2012 Table of Contents... 3 POPULATION BY AGE... 4 LANGUAGE/RELIGION... 5 ETHNICITY/MOBILITY... 6 BIRTHPLACE / IMMIGRATION... 7 EDUCATION / LABOUR FORCE... 8 INDUSTRY
Nanaimo A City in Nanaimo Regional District
 A City in Regional District Produced by Stats for Population Total Immigrants Change in Change in Immigrants Population Number Percent Population Number Percent 1991 6,129 8,885 14.8 1991 to 1996,1 2,44
NATIONAL HOUSEHOLD SURVEY: LABOUR FORCE, EMPLOYMENT, AND INCOME
 Clause No. 15 in Report No. 1 of was adopted, without amendment, by the Council of The Regional Municipality of York at its meeting held on January 23, 2014. 15 2011 NATIONAL HOUSEHOLD SURVEY: LABOUR FORCE,
People. Population size and growth. Components of population change
 The social report monitors outcomes for the New Zealand population. This section contains background information on the size and characteristics of the population to provide a context for the indicators
COMMUNITY PROFILE BURNABY
 COMMUNITY PROFILE BURNABY Burnaby Demographics I Page 1 BURNABY IMMIGRANT DEMOGRAPHICS Your quick and easy look at facts and figures around immigration. Newcomers are an important and growing part of your
Cache Creek A Village in Thompson-Nicola Regional District
 A Village in ThompsonNicola Regional District Produced by Stats for Global NonResponse Rate: 39.1 Population Total Immigrants Change in Change in Immigrants Population Number Percent Population Number
The Chinese Community in Canada
 Catalogue no. 89-621-XIE No. 001 ISSN: 1719-7376 ISBN: 0-662-43444-7 Analytical Paper Profiles of Ethnic Communities in Canada The Chinese Community in Canada 2001 by Colin Lindsay Social and Aboriginal
City of Montréal HIGHLIGHTS. En 1996, the ville de Montréal had a population of 1,775,788.
 Socio-economic profile City of Montréal February 2002 HIGHLIGHTS En 1996, the ville de Montréal had a population of 1,775,788. Between 1991 and 1996, the population of Montréal increased by 0.01%. One-person
RECENT IMMIGRANTS IN METROPOLITAN AREAS. Regina. A Comparative Profile Based on the 2001 Census April 2005
 RECENT IMMIGRANTS IN METROPOLITAN AREAS Regina A Comparative Profile Based on the 2001 Census April 2005 Produced by Strategic Research and Statistics For additional copies, please visit our website: Internet:
Immigration and Ethno-Cultural Diversity
 2016 London Census: Fact Sheet 7 Immigration and Ethno-Cultural Diversity On October 25, 2017 Statistics Canada released the 2016 Census data on Immigration and Ethno-Cultural Diversity. This summary highlights
Ontario Municipal Board Commission des affaires municipales de l Ontario
 Commission des affaires municipales de l Ontario ISSUE DATE: December 29, 2016 CASE NO.: PROCEEDING COMMENCED UNDER subsection 17(40) of the Planning Act, R.S.O. 1990, c. P.13, as amended Failure to announce
View Royal A Town in Capital Regional District
 Produced by Stats for Global NonResponse Rate: 18.4 Population Total Immigrants Change in Change in Immigrants Population Number Percent Population Number Percent 1991 5,996 9 15.6 1991 to 1996 445 315
Northern Rockies Regional Municipality A Regional Municipality in Northern Rockies Regional District
 Produced by Stats for Global NonResponse Rate: 39.2 Population Total Immigrants Change in Change in Immigrants Population Number Percent Population Number Percent 1991 1991 to 1996 1996 1996 to 21 21 21
Social and Demographic Trends in Burnaby and Neighbouring Communities 1981 to 2006
 Social and Demographic Trends in and Neighbouring Communities 1981 to 2006 October 2009 Table of Contents October 2009 1 Introduction... 2 2 Population... 3 Population Growth... 3 Age Structure... 4 3
COMMUNITY PROFILE COQUITLAM. Coquitlam Immigrant Demographics I Page 1
 COMMUNITY PROFILE COQUITLAM Coquitlam Demographics I Page 1 COQUITLAM IMMIGRANT DEMOGRAPHICS Your quick and easy look at facts and figures around immigration. Newcomers are an important and growing part
TOWNSHIP OF LANGLEY, B.C Township of Langley Immigrant Demographics I
 Immigrant demographics TOWNSHIP OF LANGLEY, B.C. - 2018 Township of Langley Immigrant Demographics I Page 1 TOWNSHIP OF LANGLEY IMMIGRANT DEMOGRAPHICS Your quick and easy look at facts and figures around
Immigrant DELTA, B.C Delta Immigrant Demographics I
 Immigrant demographics DELTA, B.C. - 2018 Immigrant Demographics I Page 1 DELTA IMMIGRANT DEMOGRAPHICS Your quick and easy look at facts and figures around immigration. Newcomers are an important and growing
East Kootenay A Regional District in British Columbia
 Produced by Stats for Global Non-Response Rate: 35.5 Population Total Immigrants Change in Change in Immigrants Population Number Percent Population Number Percent 1991 52,368 5,9 11.3 1991 to 1996 3,998-55
Powell River A City in Powell River Regional District
 A City in Regional District Produced by Stats for Population Total Immigrants Change in Change in Immigrants Population Number Percent Population Number Percent 1991 12,991 1,965 15.1 1991 to 1996 14 4
November 23,1999. Meeting 1999/41 CORPORATION OF THE TOWN OF BRADFORD WEST GWILLIMBURY MINUTES
 CORPORATION OF THE TOWN OF BRADFORD WEST GWILLIMBURY Meeting 1999/41 MINUTES November 23,1999 Members Present: Mayor Frank Jonkman Deputy Mayor Bud Brown Councillor Brian Bonany Councillor Peter Dykie
COMMUNITY PROFILE TOWNSHIP OF LANGLEY. Township of Langley Immigrant Demographics I Page 1
 COMMUNITY PROFILE TOWNSHIP OF LANGLEY Township of Langley Demographics I Page 1 TOWNSHIP OF LANGLEY IMMIGRANT DEMOGRAPHICS Your quick and easy look at facts and figures around immigration. Newcomers are