Results from a city victim survey and in depth interviews on violence against women
|
|
|
- Victor Cook
- 6 years ago
- Views:
Transcription
1
2 CRIME IN DAR ES SALAAM Results from a city victim survey and in depth interviews on violence against women Prepared for the Dar es Salaam Safer Cities project and UN Habitat Victim survey by Rory Robertshaw, Antoinette Louw & Aki Stavrou In depth interviews on violence against women by Lizette Meyer & Antoinette Louw Institute for Security Studies, Pretoria & DRA Development, Durban July
3 TABLE OF CONTENTS TABLE OF CONTENTS...3 LIST OF TABLES AND GRAPHS...4 BACKGROUND...8 EXECUTIVE SUMMARY...9 PART 1: CITY VICTIM SURVEY...13 SURVEY METHODOLOGY...13 Stage 1: refinement/adaptation of questionnaire, selection of areas...13 Stage 2: TRAINING and piloting...15 FEAR OF CRIME...18 Feelings of safety in areas of residence...18 Perceptions about changing crime levels...21 What people fear...21 PERCEPTIONS ON HOW TO IMPROVE SAFETY...23 Types of protection measures used...24 Government interventions and the need for better policing...25 What individuals and communities can do to enhance safety...28 REPORTING CRIME...30 Rates of Reporting...32 Understanding reporting in Dar es Salaam...33 REPORTING AND SATISFACTION WITH POLICE...33 HELP SEEKING BEHAVIOUR AMONG CRIME VICTIMS...39 LEVELS OF CRIME IN DAR ES SALAAM...41 CRIME PROFILES...46 home BURGLARY...46 Vehicle Crime...51 Assault...53 crop theft, livestock theft & farm equipment theft...60 Murder...65 SIMPLE THEFT...65 ROBBERY
4 LIST OF TABLES AND GRAPHS 1. Survey Areas Interviews per generic area Age and Gender breakdown How safe people feel walking in their areas of residence (%) People who felt very unsafe walking in their areas after dark in Dar es Salaam es and selected South African cities People who felt very unsafe after dark in particular parts of the city (n= 1004) Views from people living in different parts of the city about whether the crime level changed compared to previous years (%) Types of protection measures used and whether they make people feel very safe What government should do to make Dar es Salaam safer (n=1012) Rating of the police service compared to previous years (n=1012) How long it takes people to reach the nearest police station or post How often a police officer is seen on duty in the neighbourhood How safe people feel after dark in their neighbourhoods in relation to how often they see a police officer on duty in their area (%) How often people living in different parts of the city see a police officer on duty in their neighbourhood (%) What individuals can do to make Dar es Salaam es safer Reporting Rates by Crime Type for Dar es Salaam and Durban, SA Insurance Cover Held By Crime Victims in Dar es Salaam Reasons for Not Reporting the Theft of Vehicle Parts Reasons for Not Reporting Burglary Reasons for Not Reporting Simple Theft Reasons for Not Reporting Robbery Reasons for Not Reporting Assault
5 24. Reasons for Not Reporting Crop Theft Satisfaction with Police among Reporting Victims of Burglary Reasons for Satisfaction or Dissatisfaction among Burglary Victims Satisfaction with Police among Reporting Victims of Assault Reasons for Satisfaction or Dissatisfaction among Assault Victims Who Victims of Burglary Sought Help from Who Victims of Simple Theft Sought Help from Who Victims of Assault Sought Help from Percentage of Respondents who were Victims of Different Crimes at least Once over past 5 years Rates of Repeat Victimisation for Different Crimes in Durban (1993-7) Repeat Victimisation Rates for Burglary over a five year period Repeat Victimisation Rates for Simple Theft over a five year period Repeat Victimisation Rates for Vehicle Part Theft over a five year period Repeat Victimisation Rates for Crop Theft over a five year period Repeat Victimisation Rates for Livestock Theft over a five year period Repeat Victimisation Rates for Assault over a five year period Victim profile for home burglary Percentage of Burglaries were items were Stolen Month of the Year during which Burglary Took Place Day of the Week during which Burglary Took Place Time of Day during which Burglary Took Place Percentage of burgled households which had household members present at the time of the burglary Use of Violence during Burglary Type and Occurrence of Weapon Use during Burglary Victim profile for vehicle part theft Types of Vehicles Targeted for Vehicle Part Theft Month of the Year during which Vehicle Part Theft Took Place
6 51. Hour of the Day during which Vehicle Part Theft Took Place Place Where Vehicle Part Theft Took Place From Victim profile of assault Month of the Year during which Assault Took Place Day of the Week during which Took Place Time of Day during which Assault Took Place Place where Assault Occurred What Respondents were doing at the Time of the Assault Use of Weapons during Assaults Were the Offenders Known to the Victims of Assault Relationship of Offender to Victim in Assaults were Victim knew Offender Victim profile of crop theft Victim profile of livestock theft Victim profile of farm equipment theft Monthly Distribution of Livestock Theft Month of the Year during which Livestock Theft Took Place Weekly Distribution of Livestock Theft Distribution of Livestock Theft over the course of the Day Distribution of Farm Equipment Theft over the course of the Day Distribution of Crop Theft over the course of the Day Number of animals stolen during livestock thefts Type of Equipment of Stolen During Farm Equipment Theft Who Victims of Livestock Theft felt were Responsible for the Thefts Victim profile of simple theft Graph Type of Item Stolen during Simple Thefts Month of the Year during which Simple Theft Occurred Day of the Week during which Simple Theft Occurred Hour of the Day during which Simple Theft Occurred Where Simple Theft occurred What were Simple Theft Victims doing at the Time of the Theft
7 81. Whether Simple Theft Victims were Alone when the Incident Occurred Victim profile of robbery Percentage of Robberies which were successful Day of the Week on which Robbery Took Place Time of Day which Robbery Took Place Percentage of Victims who were Alone when Robbery Took Place Where Robbery Took Place What Victims was doing When Robbery Took Place What was Stolen During Robbery Use of Violence and Threats During Robberies Use and Type of Weapon during Robberies Percentage of Victims Sustaining Injuries During Robberies
8 BACKGROUND Information is essential for the planning, design and monitoring of a crime reduction strategy. Information is needed not only about crime levels but also about resource availability, capacity and the views of the people in the area about the issues. Victim surveys are one way of gathering some of this information. They supplement police statistics by providing data on unreported crimes. They also show who is more at risk of crime, some of the impacts of crime and most importantly, public perception about the priority issues in their area. The Institute for Security Studies has conducted four city victim surveys in recent years in South Africa in order to provide city governments with data for designing crime reduction strategies. The ISS has also conducted specialised surveys on crime in rural areas and on violence against women to assist national and provincial government as well as non-state practitioners in planning for better crime reduction. In February and March 2000 two surveys were conducted in Dar es Salaam for the Safer Cities project a city victim survey and in depth inteviews on violence against women. The format of the ISS surveys was used as a framework and adapted to suit local conditions. The results of these surveys are presented below. 8
9 EXECUTIVE SUMMARY BACKGROUND In March 2000 two studies were conducted into crime and violence in Dar es Salaam a victim survey and a series of in-depth interviews on violence against women. The studies were initiated by the Safer City project in Dar es Salaam and UN Habitat in Nairobi to gain an understanding of crime levels in communities within the city council s area of jurisdiction to assist in the development of a crime reduction strategy for the city. Based on similar methodologies as those used in South African cities for gathering crime information and supplementing police statistics, the study consisted of a household victim survey of interviews and 42 in-depth interviews with women who had experienced violence and abuse. The questionnaires, refined through the experiences and results of surveys conducted in South Africa, were adapted to the Dar es Salaam environment. CRIME LEVELS The most prevalent crime in Dar es Salaam is burglary. High levels of burglary were recorded by the victim survey, with 43% of victims saying their household was burgled over the past five years. Simple theft is the second most common crime in the city with 32% of people having been victimised. Other categories of theft, namely crop and livestock theft, that occur largely in the city s rural districts were reported by 2 of all respondents. Vehicle theft and car hijacking rates were particularly low in Dar es Salaam although theft of vehicle parts was more common, with 19% of respondents saying they experienced this crime. Violent crimes were less prevalent than the property crimes mentioned above. 16 % of people said they assaulted and 14% reported being robbed in the past five years. Only 1% of respondents said a member of their household was murdered during this time. With the exception of assault, violent crime in Dar es Salaam was less prevalent than in South African cities where similar victim surveys have been conducted. The high levels of assault in Dar es Salaam are cause for concern. REPORTING TO THE POLICE Car theft followed by other serious property crimes were the offences most likely to be reported to the police. Reporting rates for violent crimes were relatively low. Those crimes that occur mainly in the rural areas such as crop theft were the least likely to be reported. The need to claim insurance benefits does not appear to be the main motivation for reporting crimes against property. Factors such as the perceived seriousness of the crime, the experience of violence and access to the police also influence reporting patterns. BURGLARY People living in new or established suburbs were more at risk of burglary than people living elsewhere in Dar es Salaam. Generally people with higher income and those owning houses were more at risk. Burglaries are likely to happen during the times when people are usually at home. Half of all burglaries took place on Fridays and Saturdays and the majority of cases occurred between midnight and 6h00. In 78% of incidents, victims reported that someone was at home when the burglary was committed. Levels of violence experienced and subsequent injuries sustained were consequently high. 9
10 SIMPLE THEFT Young women were particularly at risk of simple theft as were residents living in the inner city. Simple theft occurred most often on Saturdays and between 12h01 and 18h00 and accessories such as jewellery followed by money were the likely targets of these thefts. Victims tended to be alone when the thefts occurred. The likely location was streets outside shops and offices or streets in residential areas. THEFT OF LIVESTOCK, CROPS AND FARM EQUIPMENT Of these predominantly rural crimes, livestock theft was experienced by 2 of respondents, crop theft by 19% and farm equipment theft 7%. These crimes happened primarily in the rural parts of the city and to a limited extent in the new suburbs. Those most at risk are older people who own their homes, have little education and are employed in the informal sector. Seasonal distribution of crop theft follows the growing cycle of crops, whereas livestock and farm equipment theft were evenly distributed with end of year peaks. Farm equipment was usually stolen in the daytime and livestock at night. Crop thefts were more evenly distributed throughout the day. All three types of theft typically happened over the weekend and violence was infrequent. THEFT OF VEHICLE PARTS Men were more at risk of vehicle part theft than women as were home owners and wealthier, more educated people. Residents living in the inner city were more vunerable than those living elsewhere. These thefts occurred throughout the day, with the least likely time being the early hours of the morning. Residential streets and public parking lots were the areas most often cited as the place where thefts occurred. ASSAULT Victim profiles showed, unusually, that people living in established suburbs and those with a secondary school education were most at risk of assault. Assault took two main forms that which happened in the home (58%) and in places of entertainment (18%). Typically the offender was known to the victim. Offenders were most often partners (33%) or neighbours (36%). Assault occurred mostly on Fridays, Saturdays and in particular Sundays between midday and 06h00. The vast majority of assault resulted in injury. Physical strength was mostly used (as opposed to other weapons) and most victims were treated in a hospital for their injuries. ROBBERY People living in new or emerging suburbs and with a post high school qualification and formal employment were most at risk of robbery. These crimes commonly occurred at night over the weekend. Victims reported that the likely location for robbery was in residential streets, while they were walking alone. Money was most likely to be taken during the robbery. Violence was used during 69% of attacks, with knives followed by physical strength being the most likely weapons. Injuries were nevertheless limited. FEAR OF CRIME Nearly two thirds of people felt unsafe in their areas after dark lower levels of anxiety about crime compared to South African cities. Women, young people between years, those with the least education and those living in new suburbs and established suburbs felt least safe after dark in their areas of residence. Two thirds said crime had increased compared to previous years and people living in new suburbs and established suburbs were twice as likely to say this than residents from the inner city or rural settlements. Over half the respondents 10
11 accurately estimated that housebreaking and theft followed by mugging were the most common crimes in Dar es Salaam. These were also the two crime categories feared by most people in the city. PERCEPTIONS ON POLICING AND SAFETY Most people (8) use some form of protection against crime, mostly burglar guards, fences/walls, a dog and a weapon. Although these measures are not sophisticated, 68% said they felt fairly safe as a result of using them. Over half (56%) said government should provide more visible police and security guards and a better distribution of police posts to enhance safety. People were most likely to think that compared to previous years policing has stayed the same (44%), while 39% thought it had become worse. Access to the police is less of a problem than the lack of visible policing and patrols, with 36% saying they never see a police officer on duty and 17% reporting seeing an officer less than once a month. Visible policing should be targeted in the suburbs. In new suburbs 62% said they never see the police and 48% in established suburbs said the same. These people were much more likely than those in other parts of the city to think crime has increased. They also display high levels of fear of crime. When asked about how individuals can improve safety, 62% said they could co-operate with or join the police, security guards, Sungu Sungu or neighbourhood watch organisations. People seem more inclined to support Sungu Sungu type initiatives than the police. Despite this and the fact that 53% think these community initiatives improve safety, only 25% said they exist in their neighbourhoods. Between 14% and a quarter said there was nothing they could do to improve safety. None mentioned taking precautions or being more alert which suggests a limited knowledge about crime prevention and risk avoidance behaviour. IN-DEPTH INTERVIEWS ON VIOLENCE AGAINST WOMEN The survey covered economic, emotional, physical and sexual abuse and survivors were randomly selected by trained interviewers on the basis that they had experienced some form of abuse. Respondents were asked about the nature and consequences of the most serious incident of abuse as well as details of abusers, the physical and emotional impact of abuse, experiences with professional and informal service providers, and their general perceptions of safety. Most of the 42 women interviewed said they had been economically abused (79%), with almost as many describing emotional abuse (76%) and 71% describing physical abuse. Nearly half the survivors (45%) said they had been sexually abused at some point in their lives. These figures suggest that many of the women had experienced all four types of abuse. The results confirm that abuse occurs in those environments in which women should be safest the home and is perpetrated by people who women know, trust, and often depend on, namely partners and spouses. This was confirmed by the fact that just over half the women said they felt unsafe in their own homes and as many thought their own homes are the most unsafe place to be in Dar es Salaam. Although the vast majority of survivors of all types of abuse believed that what had happened to them was a crime, the nature of abuse suggests that it has become normalised. Abuse is ongoing and is often witnessed by others (such as relatives and children). This raises 11
12 questions about how others present respond to the abuse and are affected by it. The ongoing nature of abuse also heightens its negative impact. Abusers were ordinary men with profiles unlike that of other violent offenders who are mostly young underemployed men between 15 and 25 years. Abusers were likely to be married, employed, of all ages, and to have abused others before. (The profile of sexual abusers more closely resembles that of other violent offenders than was the case for other abuse types. Most survivors of sexual abuse said the abuser was between 21 and 30 years.) Survivors of all types of abuse were likely to have between aged 18 to 30 years when the abuse occurred, although sexual abuse survivors were likely to be younger than survivors of other types of abuse. Most survivors of emotional, physical and sexual abuse described symptoms of Post Traumatic Stress Disorder and many had considered suicide and had attempted suicide. The impact of this emotional distress on the ability of survivors to work, take care of their children and maintain relations with partners is likely to be negative. Most of the women did tell someone about the abuse soon after it happened. Informal, personal sources of assistance were most popular with 62% of survivors turning to family and 48% to friends. Many survivors sought help from medical professional (44%) and police (39%) and were generally satisfied with the treatment they received. Only 15% went to a social worker and 14% to a counsellor. Although a majority of women were satisfied with treatment by the police, few said that standard police procedures for dealing with survivors of violence were followed. This suggests that knowledge about rights and the treatment that survivors should receive from the police was poor among the survivors interviewed. 12
13 PART 1: CITY VICTIM SURVEY SURVEY METHODOLOGY Key point Victim surveys are generally needed for gathering information, which complements police crime statistics and may be of value for the city in the planning of crime prevention. The Dar es Salaam victimisation survey was initiated to gain an understanding of the levels of crime and violence in different communities within the Dar es Salaam City Council (DCC). This entailed: The collection, collation and synthesis of all existing and available information on types of communities and residential areas located in the city area. The development of broad profiles of the identified ward areas within the city of Dar es Salaam. The development of the necessary sampling formulae and refinement and adaptation of the questionnaire to the Dar es Salaam environment/reality. A street scan was initiated to identify the ratio of victims to non-victims of crime by residential area in randomly selected ward areas. Thereafter a household victimisation survey was carried out. The survey included: street scan of 2,400 interviews household survey of 1000 interviews 42 in-depth interviews with abused women STAGE 1: REFINEMENT/ADAPTATION OF QUESTIONNAIRE, SELECTION OF AREAS A reference group was formed consisting of: Field manager Research advisor Gender representative from TAMWA Representative from the Police Crime Prevention Unit Dar es Salaam City Solicitor Co-ordinator for Safer Cities: Dar es Salaam Deputy co-ordinator for Safer Cities: Dar es Salaam The questionnaires, refined through the experiences and results of the victimisation surveys conducted in South Africa, were adapted to the Dar es Salaam environment/reality. It was decided that the research would represent the various area types within the city. Since there are very few areas within Dar es Salaam that do not have a residential population, all geographic localities were included in the sample framework. The reference group divided Dar es Salaam s 73 Wards according to whether they were in the city centre, established 13
14 suburbs, emerging suburbs or predominately rural areas. A quota was assigned to each and a sample of 20 randomly chosen. Interviews were only held with respondents over 18 years. 14
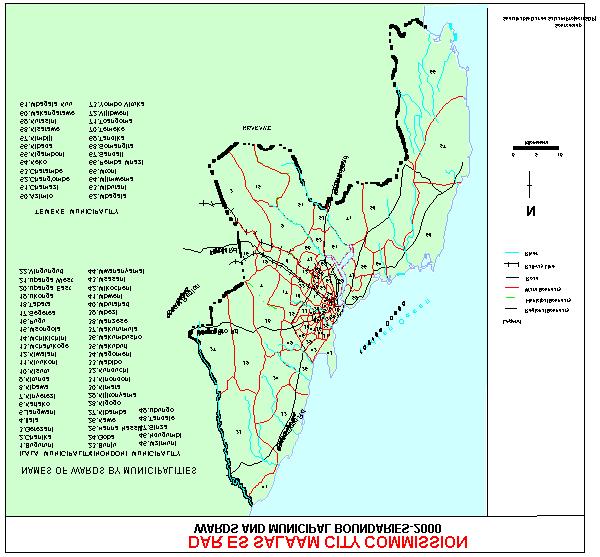
15 1. Survey Areas # Generic area category Municipalities Ward 1 inner city Ilala Kariakoo (Kivukoni - fish market, street scan) 2 inner city Ilala Kisutu (Gerezani - industrial centre, street scan) 3 inner city Ilala Mchafukoge 4 inner city Ilala Upanga West 5 established suburb Ilala Buguruni 6 established suburb Temeke Keko 7 established suburb Temeke Azimio 8 established suburb Temeke Tandika 9 established suburb Kinondoni Mikocheni 10 established suburb Kinondoni Kawe 11 established suburb Kinondoni Kijitonyama 12 established suburb Kinondoni Manzese 13 New suburb Ilala Segerea 14 New suburb Temeke Mjimwema 15 New suburb Temeke Yombo Vituka 16 New suburb Kinondoni Mbezi 17 rural settlement Ilala Kitunda 18 rural settlement Temeke Somangira 19 rural settlement Temeke Kisarawe 20 rural settlement Kinondoni Mbweni 2. Interviews per generic area Area Inner city Established suburb Emerging suburb Rural settlement TOTAL Number of interviews 480 scan interviews, 200 household interviews 960 scan interviews, 400 household interviews 480 scan interviews, 200 household interviews 480 scan interview, 200 household interview 2,400 scan interviews, 1,000 household interviews A street scan was initiated which provided a profile of both victims and non-victims in the city by age, gender, crime type, victimisation level, as well as repeat victimisation and multiple victimisation and for determining victim ratios (no sexual crimes were included). STAGE 2: TRAINING AND PILOTING Fieldworkers were selected from unemployed youth that had applied for university courses and were awaiting acceptance. A two-day in-house training course was held with the fieldworkers, followed by one-day of in-field training. Debriefing was held after each pilot. Although the questionnaires were in English, all the interviews were conducted in Kiswahili. Considerable time was spent during the in-house training assuring uniformity across all team members. These sessions were led by the Safer Cities Dar es Salaam project team. The pilot study of the street scan and household survey functioned as a training tool for refining interview techniques and measuring the length of the questionnaire. During the household pilot study 22 questionnaires were administered (one per field worker). The length 15
16 of the survey was approximately 45 minutes, but if respondents had been victims of more than one crime the interviews could take as long as 1 and ½ hours. Fieldworkers often had difficulty in terminating the interviews. In South Africa it was shown that the success rate, both in terms of selecting respondents and the time taken to execute the sub-sample, was much higher among enumerators dressed in an identifiable uniform. The field team was kitted out in a T-shirt bearing the logo of Safer Cities Dar es Salaam. In this scan survey 2,400 people were approached in the 20 selected wards in Dar es Salaam. At each sampling node, 120 respondents were approached in two age categories (18 35, 35+), of which half were female and half male. Prior to approaching the respondents, no distinction was made between victims and non-victims. The only screening criterion was age. In each ward a sample point was chosen: Markets (fish markets, second hand clothing market, fruit and vegetable markets) Transport nodes (bus terminals and bus stands) Hospitals, health and welfare centres Industrial centres Education centres In the more detailed household survey on the experience and perception of crime, 1,000 respondents were approached. In this survey the same 20 ward areas were selected, with the exception of two areas, which were replaced in the household survey by other areas as they were not residential areas (Kivukoni was replaced by Kariakoo and Gerezani was replaced by Kisutu). The Ward Executive Officer (WEO) supplied each fieldworker with a list of the plot and flat numbers in their respective areas. The field worker was then able to randomly choose which households would be approached and In a block of flats only two households were to be interviewed. In each ward area 50 respondents were interviewed in three age categories divided as in the table below: 3. Age and Gender breakdown Age Male Female Nr. of interviews years years Total A respondent selection technique ensuring that the selection process was both random and rigorously implemented was constructed. During the fieldwork stage, visits were made to 117 (11%) of the interviewed respondents to ensure that standards were being adhered to. Household interviews were conducted during the day and in the evening, including weekends, to ensure that the views of a broad cross-section of people was collected, including those working during the day 16
17 17
18 FEAR OF CRIME Key points Nearly two thirds of people (61%) felt unsafe in their areas after dark. Fear of crime is low in Dar es Salaam compared to South African cities. Women, young people between years, those with the least education and those living in new suburbs and established suburbs felt least safe after dark in their areas of residence. Two thirds (62%) said crime had increased compared to previous years. People living in new suburbs and established suburbs were twice as likely to say crime had increased than were residents from the inner city or rural settlements. These perceptions probably provide an accurate picture of how crime levels in the city are changing. 56% of people accurately estimated that housebreaking and theft followed by mugging (3) were the most common crimes in Dar es Salaam. These were also the two types of crime feared by most people in the city. Dealing with perceptions of crime, particularly anxiety and fear of crime, is as important as reducing crime levels. Fear of crime affects quality of life and can also have negative economic and political consequences. It can also affect people s willingness to interact and work with government, particularly the police, but also with local government crime prevention practitioners. Public perceptions of crime are rarely based on statistical information about crime levels or the risk of crime. Instead factors like actual victimisation, general impressions of the city environment, the media, interaction with colleagues, friends and family, perceptions about government s ability to provide safety and the extent to which people feel helpless against crime, determine public perception. In order to assess fear of crime both victims and non-victims in Dar es Salaam were asked: how safe they felt walking in their area during the day and after dark, which crimes they think occur most often in their area, and which crimes they fear the most. FEELINGS OF SAFETY IN AREAS OF RESIDENCE The vast majority of people in the city felt safe (94%) walking in their areas during the day. Only 6% said they felt unsafe. Unsurprisingly the opposite was true after dark: 61% felt unsafe walking in their neighbourhoods and 38% felt safe (Table 4). 4. How safe people feel walking in their areas of residence (%) During the day n=1012 After dark n=1012 Very safe
19 Fairly safe A bit unsafe 4 30 Very unsafe 2 31 Total This trend for people to feel safer during the day than after dark is common throughout the world. Compared to South African cities, fear of crime is low in Dar es Salaam. In Johannesburg where crime levels and fear of crime are the highest of all South African cities, as many as two thirds of people felt very unsafe walking in their neighbourhoods after dark i. Even in Cape Town the city where South Africans felt most safe anxiety about crime is higher than in Dar es Salaam (Graph 5) 5. People who felt very unsafe walking in their areas after dark in Dar es Salaam es and selected South African cities % of respondents Dar es Salaam Cape Town Durban Pretoria Johannesburg Fear of crime does not affect everyone to the same extent. It is likely to be highest among those people who think they have the greatest chance of victimisation, but also among those who worry most about the consequences of crime, whether psychological, social, physical or economic. Typically it is women, the aged and the poor who fear crime the most. These trends have been illustrated by similar victim surveys in South Africa and abroad. In Dar es Salaam this trend is clearly evident for gender only. A quarter of men (25%) said they felt very unsafe in their area after dark, compared to 37% of women. When compared across age categories it was surprising that those over 40 years of age were least likely to feel very unsafe after dark: 29% said this was the case compared to 3 of those between years and 37% of people aged between Thus contrary to the trend elsewhere, the youngest people in Dar es Salaam fear crime the most. Other demographic variables were also significant. Those with no education or very little education tended to feel less safe than those with more education: 35% with no schooling or primary schooling only felt very unsafe after dark compared to 32% with secondary school and 17% of respondents with a post high school qualification. People living in suburbs were also much more likely to feel unsafe than those living in the inner city or rural settlements (Graph 6). This is probably because people in suburbs are wealthier and thus more at risk of property crime than those living in other parts of the city. In addition, the survey also shows that these residents were much more likely than those in other 19
20 parts of the city to believe that crime in their area had increased compared to previous years. This perception would fuel the fear of crime. In South African cities by comparison, people living in suburbs often feel more safe than other city residents. In Pretoria for example, 7 of informal settlement residents and 64% of township residents felt very unsafe after dark, compared to only 42% of those living in the suburbs ii. This can be attributed to the high levels of violent crime in South African cities and the fact that people living in the poorer parts of the city are much more at risk of violence than their wealthier counterparts. In addition, the capacity of the police is significantly greater in wealthier areas where residents also have the added benefit of being able to afford elaborate private security systems to protect themselves and their property. 6. People who felt very unsafe after dark in particular parts of the city (n= 1004) % of respondents New suburb Established suburb Inner city Rural settlement Although less significant than the variables outlined above, employment status also affected levels of anxiety about crime. People who are unemployed were most likely to feel very unsafe after dark (35%), followed by those dependent on other income (31%), those in formal employment (31%) and those in informal employment (29%). It is possible that the unemployed feel least safe because they are least able to protect themselves from crime, either through physical measures to safeguard their property or the ability to choose safer transport routes, places to live, places of recreation etc. Also of interest is the fact that across all major crime categories except for robbery, repeat victims (people who had been a victim of a particular type of crime on more than one occasion) felt safer than those who had been victimised once only and even those who had never been a victim of crime. This may suggest resilience to the fear of crime that develops among repeat victims. Key Points Who fears crime most? Women The youth (aged between years) Those with the least education 20
21 Those living in new suburbs followed by those in established suburbs The unemployed People who have been a victim once only followed by those who have never been victimised PERCEPTIONS ABOUT CHANGING CRIME LEVELS The majority of people in Dar es Salaam believe that compared to previous years, the level of crime in their area increased (62%). Only 19% said they thought crime had decreased and 15% said levels had remained the same. A few people (4%) were unsure. It is a common trend that most people interviewed in victim surveys believe that crime has increased compared to previous years. In South Africa for example, 76% of people in Pretoria thought that crime had increased compared to previous years iii. This type of trend has even been recorded in situations when the actual crime level has been declining. This suggests that perceptions about crime may be shaped more by subjective judgements than by information about the actual situation. Without reliable information from crime levels over the past few years in Dar es Salaam however, it is difficult to establish whether or not this applies to the city. One indication that public perception here indeed reflects real changes in crime levels is the significant difference in views between residents living in different parts of the city. People living in new suburbs and established suburbs were twice as likely to say the crime level has increased compared to previous years than were residents from the inner city or rural settlements (Table 7). Those from rural settlements were much more likely than people from other parts of the city to believe that crime has decreased. These variations suggest that in Dar es Salaam public perception may well be an accurate indicator of changing crime levels in the city. 7. Views from people living in different parts of the city about whether the crime level changed compared to previous years (%) Inner city Established suburb n=383 New suburb Rural settlement n=197 n=196 n=198 Crime increased Crime decreased Stayed the same Total WHAT PEOPLE FEAR Respondents were first asked what type of crime they thought occurred most often in their area. Over half identified housebreaking and theft as the most common crimes (56%) followed by mugging (3). Interestingly, these are according to the victimisation rate recorded by the survey indeed the two most prevalent crimes in Dar es Salaam (see later section). This suggests that even in the absence of widely publicised crime statistics, people are able to identify the most common crime types. Of the few remaining respondents, 5% said they did not know which crimes occurred most often. 3% mentioned gang related crime, 2% robbery and 1% each for rape, murder, child 21
22 abuse, assault and car hijacking. No respondents mentioned other property crimes such as theft of livestock, crop theft or theft of vehicle parts, which according to the actual victimisation rates are among the most prevalent crime types in the city. It is however possible that this is the result of the way in which this particular question was administered in the interview process. When asked which crime types they feared the most in the area where they live, respondents were most likely to say housebreaking and theft (37%) followed by mugging (23%). Since these are the two crimes also identified as most prevalent, people probably fear those crimes they believe they have the greatest chance of becoming a victim of. However, the role of other factors such as anxiety about the consequences of crime, are also demonstrated by the data: 9% of people said the crime they feared the most was murder and 5% said it was rape. Although the actual risk of victimisation of murder is very low in Dar es Salaam (only 1% of people reported a murder in their immediate family in the past five years) nearly one in ten people fear this crime more than any other. Although anxiety about crime does not always match the actual risk of crime, fears should not be regarded as irrational. In the United Kingdom where crime levels are comparatively low, the Home Office has concluded that fears are usually highest among those living in areas where the chances of victimisation are the greatest, and among those with the most direct and indirect experience of crime iv. Rather than accusing people of worrying too much fears should be addressed where they occur. 22
23 PERCEPTIONS ON HOW TO IMPROVE SAFETY Key points 8 of people use some form of protection against crime and violence, mostly burglar guards, fences/walls, a dog and a weapon. Although these measures are relatively simple, 68% said they felt fairly safe as a result of using them. 56% thought government should provide more visible police and security guards and a better distribution of police posts. 44% said that compared to previous years policing has stayed the same; 39% thought it has become worse. Access to the police is less of a problem (two thirds reach the police within half an hour) than the lack of visible policing and patrols: 36% never see a police officer on duty and 17% said they an officer less than once a month. Visible policing should be targeted in the suburbs. In new suburbs 62% said they never see the police and 48% in established suburbs said the same. These people were much more likely than those in other parts of the city to think crime has increased. They also display high levels of fear of crime. When asked about how individuals can improve safety, 62% said they could cooperate with or join the police, security guards, Sungu Sungu or neighbourhood watch organisations. This shows the inability of the police to fulfil this visible guarding role and that the need for some security presence is a priority. People seem more inclined to support Sungu Sungu type initiatives than the police. Despite this and the fact that 53% think these community initiatives improve safety, only 25% said they exist in their neighbourhoods. Further information is needed on why they are not more popular and whether they are indeed effective. Between 14% and a quarter said there was nothing they could do to improve safety. None mentioned taking precautions or being more alert which suggests a limited knowledge about crime prevention and risk avoidance behaviour. All respondents, victims and non-victims, were asked a range of questions about possible measures to improve their personal safety as well as that of the city generally. This data provides an important guide for officials in their planning of crime reduction strategies. It reveals what people are currently doing to enhance their safety as well as what they believe the city government s priorities in this regard should be. These perceptions are important for a crime prevention strategy not only because they indicate what the public want most, but also because they assist in the management of public relations around the strategy. The following issues are covered in this section: what people do to protect themselves from crime and violence, whether these measures make their users feel safer and how they could be improved what government should do to make Dar es Salaam safer access to, and attitudes about, policing in the city what individuals can do to make Dar es Salaam safer 23
24 TYPES OF PROTECTION MEASURES USED The vast majority of people in Dar es Salaam (8) use some form of protection against crime and violence. The remaining 2 a significant minority had no means of protection. A wide variety of measures were used. The most common type of protection was burglar guards, followed by fences/walls, a dog and a weapon. These are cheaper than devices such as burglar alarms and services such as armed response which were used by comparatively few people (Graph 8). 8. Types of protection measures used and whether they make people feel very safe. Armed response Burglar alarm Razor wire/broken bottles Traditional methods Neighbourhood watch Security guard Security door Carry a weapon Dog High fence/wall Burglar guards % of respondents % using each measure % that said the measure made them feel 'very safe' Over two thirds of respondents said the protection measures they used made them feel fairly safe (68%). For the rest, 14% said they still felt a bit unsafe and 5% felt very unsafe, while 13% felt very safe. This suggests that the devices currently used although fairly simple enhance feelings of safety among the vast majority of people. The measures most likely to make people feel very safe were a high fence/wall, burglar guards, a security guard and a dog (graph 8). Interestingly although 12% of people said they carried a weapon, only 5% said this made them feel very safe. The overall level of safety provided by these measures may partly explain why, when asked what else they could do to improve their own safety, most respondents (66%) said there was nothing else they could do. Alternatively, it may also be true that people are unaware of how else to become involved in crime reduction, or that they believe it is government s job rather than their own, to provide security. Those with formal and informal employment were less likely to say there was nothing they could do (6 and 63% respectively) than those dependent on other income (7) and unemployed (71%). Nevertheless affordability is not the key determinant since a majority of employed respondents still maintained there was nothing they could do to improve their safety. Among the 34% who did have ideas about how to further enhance their safety, most said they could participate in community based initiatives such as Sungu Sungu, neighbourhood 24
25 watches or police patrols. The remainder mentioned carrying a gun or other weapon followed by more conventional target hardening measures such as building high walls, installing better lighting and burglar guards. GOVERNMENT INTERVENTIONS AND THE NEED FOR BETTER POLICING In response to an open-ended question about what government should do to make Dar es Salaam a safer city in which two suggestions were allowed most respondents called for more visible police (and security guards) and a better distribution of police posts. Associated with this call for improved policing was the need for government to end bribery and corruption among police members (Graph 9). After more visible law enforcement, a common request was for better economic support from government in the form of job creation and the provision of loans and training for the youth. 9. What government should do to make Dar es Salaam safer (n=1012) Stop drug trafficking 0 Distribute & licence weapons Development 3 4 Join Sungu Sungu/neighbourhood watch Build prisons/punish offenders Second suggestion First suggestion Improve infrastructure 8 10 End bribery & corruption 8 14 Provide jobs/loans/youth training Distribute police posts & sec guards % respondents The results clearly indicate that people want better and more visible policing. Since a city level crime reduction strategy will need to focus on issues other than just policing, these views must be considered in the planning of the strategy and how it is marketed to various constituencies. Victim surveys conducted in South African cities revealed similar tendencies, with the vast majority of residents in Johannesburg, Durban, Cape Town and Pretoria calling for better policing and law enforcement and more resources for the police v. One significant difference between the South African cities and Dar es Salaam however is that residents in the former were much more likely than those in Dar es Salaam to say that harsher punishment for offenders was required. In South Africa, these views are probably more symptomatic of the 25
26 need for speedier and more effective processing of offenders by the criminal justice system than about actual sentencing policy. In Dar es Salaam, the need for government to improve policing is confirmed by the view of nearly half the respondents that compared to previous years policing in their areas of residence has stayed the same (Graph 10). Over a third, thought that the standard of policing had become worse and only 17% said it was better than in previous years. Bearing in mind that 62% of people in the city estimated that crime in their area had increased compared to previous years, it is possible that people believe the level and effectiveness of the police has not kept up with the increasing levels of crime. These results however differ depending on the area of residence of the respondent. For rural and inner city resident they were much more likely to feel that policing had improved, with 33 % and 35 % respectively of these group indicating better policing. Alternatively, for established suburb and new suburb residents there was a much stronger tendency to feel policing had worsened with 62 % and 49 % respectively of these groups indicating this response. Likewise for these two groups only 5 % of respondents indicated that policing had improved. There is a close overlap with the finding presented here and the frequency of police seen on duty by respondents in their areas of residence (see below). 10. Rating of the police service compared to previous years (n=1012) % of respondents Better Stayed the same Worse The aspect of policing that probably needs most attention in Dar es Salaam is visible policing and patrols. When asked what government should do to maker Dar es Salaam safer, most people mentioned a better distribution of police posts. However more detailed questions about the access that people currently have to a police station or post suggests that it is the visibility of the police rather than public access to the police that is the problem. Access to the police was assessed through several questions about the distance to the nearest police station or post, how people get there, how long it takes them and whether they have a working telephone in their home. The vast majority of respondents (87%) live within 6km from the nearest police station or police post. Although most (68%) have to walk in order to reach the police, two thirds get there within half an hour with nearly half saying it takes them only 10 minutes (Graph 11)
27 12. How long it takes people to reach the nearest police station or post % respondents Up to 10 mins mins mins > 1 hour Access via telephone is limited, since only 36% of people have a phone in their home and only 32% said their phone was in working order. In addition, because some police stations and most police posts do not have telephones, whether or not members of the public have a telephone becomes irrelevant as a measure of access to the police. Despite poor telephonic access, the data suggests that people in Dar es Salaam can generally reach the police at a police station or post fairly quickly. Of more concern is that many people living in Dar es Salaam rarely if ever see a police officer on duty in their neighbourhood. Over a third never see a police officer on duty and 17% said they saw an officer less than once a month. Thus for over half the respondents, seeing a police officer on duty is a rare occurrence (Graph 12). 13. How often a police officer is seen on duty in the neighbourhood Never 36 Less than once a month 17 At least once a month 14 At least once a week 19 At least once a day % respondents These findings suggest that, when asking government to improve policing, people in Dar es Salaam are referring more to the need for visible police patrols than for the building of more police stations or posts. A visible police presence may help to reduce some types of crime, but is more likely to reduce fear of crime. In Dar es Salaam the vast majority of people who said they never see a police officer on duty in their area felt unsafe (Table 13). This being said there was considerable differences in responses depending on the area of residents of the respondents. Whereas 48 % of established suburb residents and 62 % of new suburb residents reported never seeing police on duty only 9 % of rural residents and 13 % of 27
Public Safety Survey
 Public Safety Survey Penticton Area Final Report Rupi Kandola Niki Huitson Irwin Cohen Darryl Plecas School of Criminology and Criminal Justice University College of the Fraser Valley February 2007-1 -
Public Safety Survey
 Public Safety Survey Terrace Area Final Report Rocky Sharma Niki Huitson Irwin Cohen Darryl Plecas School of Criminology and Criminal Justice University College of the Fraser Valley February 2007-1 - Terrace
Safety first? Security, policing and justice in Tanzania. 1. Introduction
 Sauti za Wananchi Brief No. 42 July, 2017 1. Introduction Safety first? Security, policing and justice in Tanzania It is often said that the first responsibility of government is to keep people safe. The
Safer Cities: Greater Johannesburg. Crime Prevention Strategy. Acknowledgement
 Safer Cities: Greater Johannesburg Crime Prevention Strategy 26 march 1998 Draft discussion document : no 5 Acknowledgement The development of the Safer Cities: Greater Johannesburg strategy document was
Vancouver Police Community Policing Assessment Report Residential Survey Results NRG Research Group
 Vancouver Police Community Policing Assessment Report Residential Survey Results 2017 NRG Research Group www.nrgresearchgroup.com April 2, 2018 1 Page 2 TABLE OF CONTENTS A. EXECUTIVE SUMMARY 3 B. SURVEY
Vancouver Police Community Policing Assessment Report
 Vancouver Police Community Policing Assessment Report Residential Survey Results FINAL DRAFT NRG Research Group Adam Di Paula & Richard Elias www.nrgresearchgroup.com 3/17/2009 VPD Community Policing Report
CITY USER PROFILE 15 ADELAIDE CITY COUNCIL RESEARCH REPORT
 CITY USER PROFILE 15 ADELAIDE CITY COUNCIL RESEARCH REPORT CONTENTS What is the City User Profile and why do we do it? p. 03 How is CUP data collected? p. 03 What are some of the key findings from CUP
CRIME IN NAIROBI RESULTS OF A CITYWIDE VICTIM SURVEY
 CRIME IN NAIROBI RESULTS OF A CITYWIDE VICTIM SURVEY September 2002 By Aki Stavrou The findings, interpretations and conclusions in this publication do not necessarily represent the views of UN-HABITAT
Monitoring data from the Tackling Gangs Action Programme. Paul Dawson
 Monitoring data from the Tackling Gangs Action Programme Paul Dawson 1 Summary The Tackling Gangs Action Programme (TGAP) was a six-month initiative, which was announced in September 2007 to target and
2017 Citizen Survey of Police Surveys Citizen Survey Introduction 1
 Citizen Survey Introduction 1 Table of Contents 2017 Citizen Survey Introduction... 3 Respondents Profile... 4 Key Questions for 2017... 6 Key Questions Five Year Comparison... 10 Citizens Contact with
A STUDY OF VICTIM SATISFACTION WITH ALTERNATIVE MEASURES IN PRINCE EDWARD ISLAND
 A STUDY OF VICTIM SATISFACTION WITH ALTERNATIVE MEASURES IN PRINCE EDWARD ISLAND PREPARED FOR VICTIM SERVICES OFFICE OF ATTORNEY GENERAL PRINCE EDWARD ISLAND BY EQUINOX CONSULTING INC. December 2002 A
Who is most at risk? Victimisation trends in the 2007 national crime and victimisation survey INTRODUCTION
 Who is most at risk? Victimisation trends in the 2007 national crime and victimisation survey INTRODUCTION With the very high levels of crime and violence that exist in South Africa, few have not experienced
Regional Municipality of Wood Buffalo 2014 RCMP and Bylaw Services Citizen Telephone Survey Final Report
 Regional Municipality of Wood Buffalo 2014 RCMP and Bylaw Services Citizen Telephone Survey Final Report December 19, 2014 TABLE OF CONTENTS 1.0 SUMMARY OF FINDINGS 3 2.0 PROJECT BACKGROUND 8 3.0 METHODOLOGY
Public Attitudes Survey Bulletin
 An Garda Síochána Public Attitudes Survey Bulletin 218 Research conducted by This bulletin presents high level findings from the third quarter of the Public Attitudes Survey conducted between July and
The 2016 Minnesota Crime Victimization Survey
 The 2016 Minnesota Crime Victimization Survey Executive Summary and Overview: August 2017 Funded by the Bureau of Justice Statistics Grant Number 2015-BJ-CX-K020 The opinions, findings, and conclusions
Public Attitudes Survey Bulletin
 An Garda Síochána Public Attitudes Survey Bulletin 2017 Research conducted by This bulletin presents key findings from the first quarter of the Public Attitudes Survey conducted between January and March
RESULTS FROM THE AFROBAROMETER ROUND 5 SURVEY IN SWAZILAND
 WWW.AFROBAROMETER.ORG RESULTS FROM THE AFROBAROMETER ROUND 5 SURVEY IN SWAZILAND Swaziland Round 5 Release Event 1 8 November 213 What is the Afrobarometer The Afrobarometer is an independent, nonpartisan
General Survey 2015 Winnipeg Police Service A Culture of Safety for All
 General Survey 2015 Winnipeg Police Service A Culture of Safety for All THE WINNIPEG POLICE SERVICE GENERAL SURVEY, 2015 The 2015 Winnipeg Police Service public opinion survey was conducted between September
Public Attitudes Survey Bulletin
 An Garda Síochána Public Attitudes Survey Bulletin 218 Research conducted by This bulletin presents high level findings from the second quarter of the Public Attitudes Survey conducted between April and
2001 Visitor Survey. December 2001 (November 30 December 13, 2001) Cincinnatus Minneapolis, Minnesota
 Cincinnatus Minneapolis, Minnesota") December 2001 (November 30 December 13, 2001) Cincinnatus Minneapolis, Minnesota 612-331-9007 MINNEAPOLIS INSTITUTE OF ARTS Table of Contents MAJOR FINDINGS... 1 HOW THIS RESEARCH WAS CONDUCTED... 8 VISITOR
December 2001 (November 30 December 13, 2001) Cincinnatus Minneapolis, Minnesota 612-331-9007 MINNEAPOLIS INSTITUTE OF ARTS Table of Contents MAJOR FINDINGS... 1 HOW THIS RESEARCH WAS CONDUCTED... 8 VISITOR
ANNUAL SURVEY REPORT: REGIONAL OVERVIEW
 ANNUAL SURVEY REPORT: REGIONAL OVERVIEW 2nd Wave (Spring 2017) OPEN Neighbourhood Communicating for a stronger partnership: connecting with citizens across the Eastern Neighbourhood June 2017 TABLE OF
Promises of Community Policing: Assessing the Impact of Community Policing in Reducing Fear of Crime in Tanzania, a Case of Dar Es Salaam City
 Promises of Community Policing: Assessing the Impact of Community Policing in Reducing Fear of Crime in Tanzania, a Case of Dar Es Salaam City SEMBOJA, Haji Hatibu Department of Economics Senior Lecturer
PERSPECTIVES ON CRIME AND POLICING IN KENTVILLE, NOVA SCOTIA, 1997: A SURVEY OF RESIDENTS AND BUSINESS OPERATORS
 PERSPECTIVES ON CRIME AND POLICING IN KENTVILLE, NOVA SCOTIA, 1997: A SURVEY OF RESIDENTS AND BUSINESS OPERATORS Anthony Thomson Acadia University and Mark Mander Kentville Police Service MAY, 1997 I.
Op Data, 2001: Red Hook, Brooklyn
 Research A Public/Private Partnership with the New York State Unified Court System Op Data, 2001: Red Hook, Brooklyn Community Assessment and Perceptions of Quality of Life, Safety and Services Written
Public Views of Policing in England and Wales 2016/17
 July 2017 Public Views of Policing in England and Wales 2016/17 Research report for Her Majesty s Inspectorate of Constabulary (HMIC) FINAL VERSION Ipsos MORI Public Views of Policing in England and Wales
Catching up with crime and sentencing. Catching up with crime and sentencing
 Booklet Catching up with crime and sentencing Catching up with crime and sentencing Improving public attitudes to the Criminal Justice System: The impact of information What do do we we know about crime?
2009 Jamaican National Crime Victimization Survey: Preliminary Results
 2009 Jamaican National Crime Victimization Survey: Preliminary Results Dr. Scot Wortley Associate Professor Centre of Criminology University of Toronto Background The Jamaican National Crime Victimization
ANNUAL SURVEY REPORT: GEORGIA
 ANNUAL SURVEY REPORT: GEORGIA 2 nd Wave (Spring 2017) OPEN Neighbourhood Communicating for a stronger partnership: connecting with citizens across the Eastern Neighbourhood June 2017 TABLE OF CONTENTS
Telephone Survey. Contents *
 Telephone Survey Contents * Tables... 2 Figures... 2 Introduction... 4 Survey Questionnaire... 4 Sampling Methods... 5 Study Population... 5 Sample Size... 6 Survey Procedures... 6 Data Analysis Method...
ANNUAL SURVEY REPORT: ARMENIA
 ANNUAL SURVEY REPORT: ARMENIA 2 nd Wave (Spring 2017) OPEN Neighbourhood Communicating for a stronger partnership: connecting with citizens across the Eastern Neighbourhood June 2017 ANNUAL SURVEY REPORT,
THE UNIVERSITY OF HONG KONG LIBRARIES. Hong Kong Collection. gift from Hong Kong (China). Central Policy Unit
. Central Policy Unit") THE UNIVERSITY OF HONG KONG LIBRARIES Hong Kong Collection gift from Hong Kong (China). Central Policy Unit MDR Quality, Dedication & Expertise Preparedfor Central Policy Unit Household Survey on 24-hour
THE UNIVERSITY OF HONG KONG LIBRARIES Hong Kong Collection gift from Hong Kong (China). Central Policy Unit MDR Quality, Dedication & Expertise Preparedfor Central Policy Unit Household Survey on 24-hour
ANNUAL SURVEY REPORT: BELARUS
 ANNUAL SURVEY REPORT: BELARUS 2 nd Wave (Spring 2017) OPEN Neighbourhood Communicating for a stronger partnership: connecting with citizens across the Eastern Neighbourhood June 2017 1/44 TABLE OF CONTENTS
Vancouver Police Community Policing Assessment Report
 Vancouver Police Community Policing Assessment Report Business Survey Results for 2009 NRG Research Group Adam Di Paula & Richard Elias www.nrgresearchgroup.com 1/5/2010 VPD Community Policing Report-Survey
PUBLIC SURVEY 2015 Report Presentation
 PUBLIC SURVEY 2015 Report Presentation Public Survey on the Ottawa Police Service Presentation, September 28, 2015 Objectives and Methodology Objectives and Methodology Context and Objectives The Ottawa
ENVIRONMENTAL DESIGN FOR SAFER COMMUNITIES. Preventing Crime in South Africa's Cities and Towns. Mark Shaw and Antoinette Louw
 ENVIRONMENTAL DESIGN FOR SAFER COMMUNITIES Preventing Crime in South Africa's Cities and Towns Mark Shaw and Antoinette Louw Monograph No 24 May 1998 List of figures Acknowledgement Introduction Defining
MAGISTRATES AND PROSECUTORS VIEWS OF RESTORATIVE JUSTICE
 CHAPTER 5 MAGISTRATES AND PROSECUTORS VIEWS OF RESTORATIVE JUSTICE Beaty Naudé and Johan Prinsloo The success of the restorative justice approach depends not only on the support of the victims and offenders
Edmonton Police Service 2011 Citizen Survey
 Edmonton Police Service 2011 Citizen Survey May 2012 2012 Edmonton Police Service First Published 2012 Edmonton Police Service 9620 103A Avenue Edmonton, Alberta T5H 0H7 CANADA Phone (780) 421-3333 Fax
Security Issues in Nairobi Trends from the Interviewer Exercise Surveys ( )
") Security Issues in Nairobi Trends from the Interviewer Exercise Surveys ( ) Results Presentation of MSRA / GFK Verein Survey (Nairobi, May ) Background As part of the MSRA / GFK Verein interviewer training
Security Issues in Nairobi Trends from the Interviewer Exercise Surveys ( ) Results Presentation of MSRA / GFK Verein Survey (Nairobi, May ) Background As part of the MSRA / GFK Verein interviewer training
QUALITY OF LIFE QUALITY OF LIFE SURVEY 2016 Executive Summary and Research Design
 QUALITY OF LIFE QUALITY OF LIFE SURVEY 2016 Executive Summary and Research Design Quality of Life Survey 2016 Executive Summary and Research Design A joint project between the following New Zealand councils
12 Criminal Victimisation in International Perspective
 Summary Introduction and methodology This report presents the key results of the crime victim surveys that were carried out as part of the fifth sweep of the International Crime Victim Surveys conducted
ANNUAL SURVEY REPORT: AZERBAIJAN
 ANNUAL SURVEY REPORT: AZERBAIJAN 2 nd Wave (Spring 2017) OPEN Neighbourhood Communicating for a stronger partnership: connecting with citizens across the Eastern Neighbourhood June 2017 TABLE OF CONTENTS
SSRL Evaluation and Impact Assessment Framework
 SSRL Evaluation and Impact Assessment Framework Taking the Pulse of Saskatchewan: Crime and Public Safety in Saskatchewan October 2012 ABOUT THE SSRL The Social Sciences Research Laboratories, or SSRL,
Byram Police Department
 Byram Police Department 2018 Annual Report www.byrampolice.net ~ www.facebook.com/byrampd Offices (601) 372-7747 ~ Non-Emergency Dispatch (601) 372-2327 141 Southpointe Drive, Byram, MS 39272 BYRAM POLICE
Reporting domestic abuse to the Police: Your rights
 Reporting domestic abuse to the Police: Your rights Reporting domestic abuse to the Police - Your rights The police take reports of gender based violence such as domestic abuse, sexual assault, rape, stalking,
Understanding Dudley 2017 A demographic, health and socioeconomic profile of our communities. Chapter 4 Staying Safe
 Understanding Dudley 2017 A demographic, health and socioeconomic profile of our communities Chapter 4 Staying Safe Chapter 1 Executive summary Chapter 2 Population and Household Characteristics Chapter
Reconviction patterns of offenders managed in the community: A 60-months follow-up analysis
 Reconviction patterns of offenders managed in the community: A 60-months follow-up analysis Arul Nadesu Principal Strategic Adviser Policy, Strategy and Research Department of Corrections 2009 D09-85288
Rural Pulse 2019 RURAL PULSE RESEARCH. Rural/Urban Findings March 2019
 Rural Pulse 2019 RURAL PULSE RESEARCH Rural/Urban Findings March 2019 Contents Executive Summary 3 Project Goals and Objectives 9 Methodology 10 Demographics 12 Detailed Research Findings 18 Appendix Prepared
Police and Crime Needs Assessment. Karen Sleigh Chief Inspector Andy Burton
 Police and Crime Needs Assessment Karen Sleigh Chief Inspector Andy Burton January 2015 Summary of Nottinghamshire s Police and Crime Needs Assessment Annual assessment of crime and community safety in
Research methods and findings of a twoyear study on the sex work industry in Cape Town
 Research methods and findings of a twoyear study on the sex work industry in Cape Town Chandré Gould, Crime and Justice Programme, Institute for Security Studies Research Objectives To develop a reproducible
Closed and Banned Visits. Easy Read Self Help Toolkit
 Closed and Banned Visits Easy Read Self Help Toolkit About this document This document was made by CHANGE, a charity led by people with learning disabilities. This document uses easy words and pictures
Quarterly Crime Statistics Q (01-January-2011 to 31-March-2011)
") Quarterly Crime Statistics 211 (1-January-211 to 31-March-211) Authorising Officer: Commissioner Of The Bermuda Police Service Author: Analysis Unit Date: 27-Apr-211 Security Classification: This document
Quarterly Crime Statistics 211 (1-January-211 to 31-March-211) Authorising Officer: Commissioner Of The Bermuda Police Service Author: Analysis Unit Date: 27-Apr-211 Security Classification: This document
Motivations and Barriers: Exploring Voting Behaviour in British Columbia
 Motivations and Barriers: Exploring Voting Behaviour in British Columbia January 2010 BC STATS Page i Revised April 21st, 2010 Executive Summary Building on the Post-Election Voter/Non-Voter Satisfaction
City of Janesville Police Department 2015 Community Survey
 City of Janesville Police Department 2015 Community Survey Presentation and Data Analysis Conducted by: UW-Whitewater Center for Political Science & Public Policy Research Susan M. Johnson, Ph.D. and Jolly
Flash Eurobarometer 337 TNS political &social. This document of the authors.
 Flash Eurobarometer Croatia and the European Union REPORT Fieldwork: November 2011 Publication: February 2012 Flash Eurobarometer TNS political &social This survey has been requested by the Directorate-General
Key Facts and Figures from the Criminal Justice System 2009/2010. March 2011
 Key Facts and Figures from the Criminal Justice System 2009/2010 March 2011 Produced by: Matrix Evidence Ltd This booklet has been produced by Matrix Evidence Ltd. These statistics have been complied according
Youth Justice Statistics 2014/15. England and Wales. Youth Justice Board / Ministry of Justice Statistics bulletin
 Youth Justice Statistics 2014/15 England and Wales Youth Justice Board / Ministry of Justice Statistics bulletin Also available on the Gov.uk website at https://www.gov.uk/government/collections/youth-justice-statistics
Urban Crime. Economics 312 Martin Farnham
 Urban Crime Economics 312 Martin Farnham Introduction Why do we care about urban crime? Crime tends to be concentrated in center city Characteristic of impoverished areas; likely both a cause and consequence
Section One SYNOPSIS: UNIFORM CRIME REPORTING PROGRAM. Synopsis: Uniform Crime Reporting Program
 Section One SYNOPSIS: UNIFORM CRIME REPORTING PROGRAM Synopsis: Uniform Crime Reporting Program 1 DEFINITION THE NEW JERSEY UNIFORM CRIME REPORTING SYSTEM The New Jersey Uniform Crime Reporting System
Attitudes to firearms and crime in Nairobi: Results of a city survey
 Attitudes to firearms and crime in Nairobi: Results of a city survey Arms Management Programme Institute for Security Studies ISS Paper 59 July 2002 Price: R10.00 INTRODUCTION The proliferation of small
The Scope of Human Trafficking in Nairobi and its environs
 Awareness Against Human Trafficking (HAART) The Scope of Human Trafficking in Nairobi and its environs HAART Report on Survey Findings November, 2012 Please Note that the findings presented in this report
Corruption, or the abuse of entrusted power
 SMALL BRIBES, BIG CHALLENGE Extent and nature of petty corruption in South Africa Hennie van Vuuren, Institute for Security Studies hvanvuuren@issct.org.za Although grand corruption like that associated
The National Citizen Survey
 CITY OF SARASOTA, FLORIDA 2008 3005 30th Street 777 North Capitol Street NE, Suite 500 Boulder, CO 80301 Washington, DC 20002 ww.n-r-c.com 303-444-7863 www.icma.org 202-289-ICMA P U B L I C S A F E T Y
Public Awareness of the System for Complaints against the Police in Northern Ireland, 2004
 Research Report 02/2004 Public Awareness of the System for Complaints against the Police in Northern Ireland, 2004 Malcolm Ostermeyer Research Branch Office of the Police Ombudsman for Northern Ireland
Charlotte-Mecklenburg 2015 Criminal Justice System Public Perceptions Study Quantitative Report
 15105-D John J Delaney Drive Suite 325 Charlotte, NC 28277 www.voccii.com Charlotte-Mecklenburg Criminal Justice System Public Perceptions Study Quantitative Report Prepared by Voccii, LLC REVISED December
THE STATE OF TRANSPORT OPINION POLL SOUTH AFRICA: A FOUR-YEAR REVIEW ( )
") THE STATE OF TRANSPORT OPINION POLL SOUTH AFRICA: A FOUR-YEAR REVIEW (2012-2015) G Heyns and R Luke* University of Johannesburg, PO Box 524, Johannesburg, 2006 Tel: 011 5594952; Email: gjheyns@uj.ac.za
THE STATE OF TRANSPORT OPINION POLL SOUTH AFRICA: A FOUR-YEAR REVIEW (2012-2015) G Heyns and R Luke* University of Johannesburg, PO Box 524, Johannesburg, 2006 Tel: 011 5594952; Email: gjheyns@uj.ac.za
197 Total stop & searches. Positive searches (82) (includes arrests) 42% 25% Arrests (49)
 (includes arrests) 42% 25% Arrests (49)") 1 197 Total stop & searches 42% Positive searches (82) 25% Arrests (49) Population: 93% White & 7% 128 6 54 2 8 Hampshire s 74% Non-s 26% 27 35 52 65% White 31% 145 Non- During the third quarter of 218/19
1 197 Total stop & searches 42% Positive searches (82) 25% Arrests (49) Population: 93% White & 7% 128 6 54 2 8 Hampshire s 74% Non-s 26% 27 35 52 65% White 31% 145 Non- During the third quarter of 218/19
Section One SYNOPSIS: UNIFORM CRIME REPORTING PROGRAM. Synopsis: Uniform Crime Reporting System
 Section One SYNOPSIS: UNIFORM CRIME REPORTING PROGRAM 1 DEFINITION THE NEW JERSEY UNIFORM CRIME REPORTING SYSTEM The New Jersey Uniform Crime Reporting System is based upon the compilation, classification,
Police Firearms Survey
 Police Firearms Survey Final Report Prepared for: Scottish Police Authority Prepared by: TNS JN:127475 Police Firearms Survey TNS 09.12.2014 JN127475 Contents 1. Background and objectives 3 2. Methodology
Northern Ireland. 1. Police personnel, by sex, and financial resources, Rate 2005 Rate 2006
 POLICE 1. Police personnel, by sex, and financial resources, Police are part of the national security force Country has more than one police force Police or law enforcement personnel fulfill prosecutorial
Rural Pulse 2016 RURAL PULSE RESEARCH. Rural/Urban Findings June 2016
 Rural Pulse 2016 RURAL PULSE RESEARCH Rural/Urban Findings June 2016 Contents Executive Summary Project Goals and Objectives 9 Methodology 10 Demographics 12 Research Findings 17 Appendix Prepared by Russell
R Eagleton Institute of Politics Center for Public Interest Polling
 2002 SURVEY OF NEW BRUNSWICK RESIDENTS Conducted for: Conducted by: R Eagleton Institute of Politics Center for Public Interest Polling Data Collection: May 2002 02-02 EXECUTIVE SUMMARY TABLE OF CONTENTS
English summary of Brå report No. 2014:8. Offences in close relationships. A national survey
 English summary of Brå report No. 2014:8 Offences in close relationships A national survey urn:nbn:se:bra-559 2014, Brå The Swedish National Council for Crime Prevention Author: Anna Frenzel www.bra.se/english
Settling in New Zealand
 Settling in New Zealand Migrants perceptions of their experience 2015 Migrant Survey ISBN 978-1-98-851761-2 (online) May 2017 Disclaimer The Ministry of Business, Innovation and Employment has made every
An Garda Síochána. Annual Policing Plan Tipperary Division
 An Garda Síochána Annual Policing Plan 2013 Tipperary Division Ag obair le Pobail chun iad a chosaint agus chun freastal orthu / Working with Communities to Protect and Serve VISION `Excellent people delivering
Rural and Wildlife Strategy
 T Rural and Wildlife Strategy 2015-2018 Foreword One of our key commitments is that Cheshire Constabulary is here to support communities. When a crime occurs in a rural area we understand that this can
WEST VANCOUVER PUBLIC SAFETY SURVEY RESEARCH RESULTS
 WEST VANCOUVER PUBLIC SAFETY SURVEY RESEARCH RESULTS Dr. Irwin M. Cohen & Dr. Amanda V. McCormick December 2016 Introduction This report describes the results of a public safety and police satisfaction
WEST MERCIA POLICE AND CRIME COMMISSIONER S ANNUAL TOWN AND PARISH COUNCIL SURVEY 2018 SUMMARY REPORT
 WEST MERCIA POLICE AND CRIME COMMISSIONER S ANNUAL TOWN AND PARISH COUNCIL SURVEY 2018 SUMMARY REPORT Contents Section 1. About the Survey... 1 Introduction... 1 Executive summary... 1 Methodology... 2
PUBLIC ATTITUDES TOWARD THE CRIMINAL JUSTICE SYSTEM
 Statistics Canada Catalogue no. 85-002-XIE Vol. 20 no. 12 PUBLIC ATTITUDES TOWARD THE CRIMINAL JUSTICE SYSTEM by Jennifer Tufts HIGHLIGHTS n According to the 1999 General Social Survey (GSS), the majority
Communitypolicingfirstnationsa pproachestopublicsafetypractici ngtrustandcommunitypridemoha
 Communitypolicingfirstnationsa pproachestopublicsafetypractici ngtrustandcommunitypridemoha Public Safety Consultation Project: Community Perspectives on Policing and Crime within the Mohawk wkwayoflifefghjklzxcvbnmqwpri
THE VOICE OF THE COMMUNITIES OF LATIN AMERICA AND THE CARIBBEAN
 THE VOICE OF THE COMMUNITIES OF LATIN AMERICA AND THE CARIBBEAN TOWARDS THE WORLD HUMANITARIAN SUMMIT (WHS) Report of the Survey under the Consultation with the Affected Communities of Latin America and
This report is formatted for double-sided printing.
 Public Opinion Survey on the November 9, 2009 By-elections FINAL REPORT Prepared for Elections Canada February 2010 Phoenix SPI is a Gold Seal Certified Corporate Member of the MRIA 1678 Bank Street, Suite
LOUISVILLE METRO POLICE DEPARTMENT
 LOUISVILLE METRO POLICE DEPARTMENT CITIZENS ATTITUDE SURVEY Deborah G. Keeling, Ph.D. Kristin M. Swartz, Ph.D. Department of Justice Administration University of Louisville April 2014 INTRODUCTION It is
Firstly, however, I would like to make two brief points that characterise the general phenomenon of urban violence.
 Urban violence Local response Summary: Urban violence a Local Response, which in addition to social prevention measures also adopts situational prevention measures, whereby municipal agencies and inclusion
Quarterly Crime Statistics Q (01-January-2014 to 31-March-2014)
") Quarterly Crime Statistics 214 (1-January-214 to 31-March-214) Authorising Officer: Commissioner Of The Bermuda Police Service Author: Analysis Unit Date: 7-MAY-214 File Location: G:\Intelligence Briefings\INTELLIGENCE
Quarterly Crime Statistics 214 (1-January-214 to 31-March-214) Authorising Officer: Commissioner Of The Bermuda Police Service Author: Analysis Unit Date: 7-MAY-214 File Location: G:\Intelligence Briefings\INTELLIGENCE
Police/Citizen Partnerships in the Inner City
 Police/Citizen Partnerships in the Inner City By ROBERT L. VERNON and JAMES R. LASLEY, Ph.D. In increasing numbers, today's police agencies turn to community-based approaches to solve complex organizational
PUBLIC CONTACT WITH AND PERCEPTIONS REGARDING POLICE IN PORTLAND, OREGON 2013
 PUBLIC CONTACT WITH AND PERCEPTIONS REGARDING POLICE IN PORTLAND, OREGON 2013 Brian Renauer, Ph.D. Kimberly Kahn, Ph.D. Kris Henning, Ph.D. Portland Police Bureau Liaison Greg Stewart, MS, Sgt. Criminal
CUP - City User Population Research
 CUP - City User Population Research 2003-2013 Key insights from a decade of CUP surveys Contents Background... 2 Methodology... 2 Executive Summary... 3 Glossary of Terms... 4 Key Insights All City Users...
POLICE SERVICE OF NORTHERN IRELAND 2005/06 QUALITY OF SERVICE SURVEY
 POLICE SERVICE OF NORTHERN IRELAND 25/6 QUALITY OF SERVICE SURVEY Central Statistics Unit Statistics and Research Branch PSNI Lisnasharragh, NIPB, Waterside Tower 42 Montgomery Road, 31 Clarendon Road
The project was runner up in the Prevention and Intervention category at the Safer Communities Awards 2012.
 Operation Begonia Executive Summary Operation Begonia aims to identify women involved in 'on street' sex work and provide them with a tailored response in an effort to educate them away from the lifestyle.
SzW Round Security
 SzW Round 2 2015 Security 1. Over the past one year, how often, if ever, have you Never Just Once or Twice A. Felt unsafe walking in your neighborhood B. Feared crime in your own home Several Times Most
Special Eurobarometer 469. Report
 Integration of immigrants in the European Union Survey requested by the European Commission, Directorate-General for Migration and Home Affairs and co-ordinated by the Directorate-General for Communication
EMPLOYMENT AND QUALITY OF LIFE IN THE MISSISSIPPI DELTA. A Summary Report from the 2003 Delta Rural Poll
 EMPLOYMENT AND QUALITY OF LIFE IN THE MISSISSIPPI DELTA A Summary Report from the 2003 Delta Rural Poll Alan W. Barton September, 2004 Policy Paper No. 04-02 Center for Community and Economic Development
CHAPTER TWO. Research Methods
 CHAPTER TWO Research Methods To claim that research is rigorous, it is necessary to explain how the data was gathered and analysed. This chapter attempts to do that for this study, without inundating readers
Crime Trends Ward 10 - Gloucester-Southgate
 This report examines all founded Criminal Code of Canada offences that were reported to the Ottawa Police over the last 5 years. s have been categorized according to the Uniform Crime Reporting (UCR) Survey
Global Corruption Barometer 2010 New Zealand Results
 Global Corruption Barometer 2010 New Zealand Results Ben Krieble TINZ Summer Intern www.transparencynz.org.nz executive@transparency.org.nz Contents Executive Summary 3 Summary of global results 4 Summary
A Comparison of Crime in Australia and Other Countries
 AUSTRALIAN INSTITUTE OF CRIMINOLOGY No.23 A Comparison of Crime in Australia and Other Countries t r e n d s & i s s u e s in crime and criminal justice J. Walker, P. R. Wilson, D. Chappell and D. Weatherburn
The Sudan Consortium African and International Civil Society Action for Sudan. Sudan Public Opinion Poll Khartoum State
 The Sudan Consortium African and International Civil Society Action for Sudan Sudan Public Opinion Poll Khartoum State April 2015 1 Table of Contents 1. Introduction... 3 1.1 Background... 3 1.2 Sample
SENTENCING OF YOUNG OFFENDERS IN CANADA, 1998/99
 Statistics Canada Catalogue no. 85-002-XIE Vol. 20 no. 7 SENTENCING OF YOUNG OFFENDERS IN CANADA, 1998/99 by Trevor Sanders HIGHLIGHTS A relatively small number of offences represented a large proportion
Proposal. Budget sensitive. In confidence. Office of the Minister of Justice. Chair. Cabinet Social Policy Committee REFORM OF FAMILY VIOLENCE LAW
 Budget sensitive In confidence Office of the Minister of Justice Chair Cabinet Social Policy Committee REFORM OF FAMILY VIOLENCE LAW Paper Three: Prosecuting family violence Proposal 1. This paper is the
Statewide Survey on Job Approval of President Donald Trump
 University of New Orleans ScholarWorks@UNO Survey Research Center Publications Survey Research Center (UNO Poll) 3-2017 Statewide Survey on Job Approval of President Donald Trump Edward Chervenak University