Political Inclusivity and the Aspirations of Young Constituents: Identifying the Effects of a National Empowerment Policy. Stephen D.
|
|
|
- Hilda Jackson
- 6 years ago
- Views:
Transcription

1 ! CUNY GRADUATE CENTER PH.D PROGRAM IN ECONOMICS WORKING PAPER SERIES Political Inclusivity and the Aspirations of Young Constituents: Identifying the Effects of a National Empowerment Policy Stephen D. O Connell Working Paper 4 Ph.D. Program in Economics CUNY Graduate Center 365 Fifth Avenue New York, NY November 2014 I thank several colleagues for valuable comments, including Anjali Adukia, Onur Altindag, Karna Basu, Jonathan Conning, Mike Grossman, David Jaeger, Ted Joyce, Bill Kerr, Suleyman Taspinar, Wim Vijverberg, and participants at NEUDC Support for this work was kindly provided by the CUNY Doctoral Student Research Grant program. The analyses and conclusions contained herein are my own and not of any institution with which I am or may be associated. Replication files can be accessed on my website by Stephen D. O Connell. All rights reserved. Short sections of text, not to exceed two paragraphs, may be quoted without explicit permission provided that full credit, including notice, is given to the source.
2 ! Political Inclusivity and the Aspirations of Young Constituents: Identifying the Effects of a National Empowerment Policy Stephen Daniel O'Connell November 2014 JEL No: D13, H11, I21, I22, I24, I25, J16, O10, O12 ABSTRACT Using two dimensions of exogenous geographic variation in exposure to 1992 reforms that introduced seat quotas for women in local government in India, I find a one percentage-point increase in the school enrollment rate of young women for each additional year of exposure to women leaders. This effect is sizeable given a mean level of exposure of 11 years and pre-policy enrollment rates averaging 80 percent. The use of a border discontinuity identification strategy with nationally representative survey data greatly extends the generalizability of earlier studies. I also show that effects are nonlinear in cumulative exposure, appearing only several years after the introduction of reservations. School quality and schooling infrastructure do not appear to be a potential mechanism for the effect to occur; the strongest evidence is that local women leaders changed the educational aspirations of young women and possibly enhanced the support of young women in school. To this end, I provide novel empirical evidence suggesting the media to be one channel for the role-model effect to be transmitted. Stephen Daniel O'Connell Ph.D. Program in Economics Graduate Center, CUNY 365 Fifth Avenue New York, NY soconnell@gc.cuny.edu!!!
3 Many countries enact policies to proactively rectify historical inequities. Mandated seat or candidate quotas in electoral politics are a common incarnation of such efforts, having been legislated in over 90 countries as of Given the popularity of such policies, it is important to thoroughly understand the many dimensions of effects that a changed leadership composition may have on the well-being of constituents; a persistent question is whether policy aimed at enhancing individuals equality of opportunity in the social or political sphere can lead to distinctly economic improvements for members of newly-empowered groups. In this paper I examine the introduction and implementation of a national policy in India reserving elected seats in local government for women, and the relationship between exposure to women leaders and young women s educational enrollment. Credibly estimating policy effects for such a situation poses a number of challenges. Beyond likely endogeneity in policy adoption, educational decisions of women in developing countries are made amidst a complex web of factors that may be slow to change, including longheld traditions and cultural beliefs. This means that the effect of exposure to leaders on constituents human capital investment may be difficult to detect in the short term depending on the mechanism by which leaders affect the experience of constituents. To estimate long-term effects on young women s enrollment I exploit two features of the Indian experience in seat quota implementation that provide exogenous variation in exposure to women leaders across areas over a span of 15 years. I find a substantial increase in enrollment rates of young women corresponding to exogenously-determined exposure to the quota system on the order of one percentage-point increase in the female school enrollment rate for each additional year of cumulative exposure to mandated quotas, with no evidence of any effect on the enrollment of young men. These magnitudes are substantial given a national mean cumulative exposure of 11 years by 2007 and pre-policy female enrollment rates of 80 percent. One aspect of this work confirms and extends the generalizability of the analysis by Beaman et al. (2012), who found that an additional ten years of exposure to women leaders increases girls enrollment by approximately ten percentage points among children in a sample 1 Author s calculations based on data from The Quota Project, available at Accessed September
4 of 495 villages in West Bengal. 2 While I find similar effects, the difference in the scope of this analysis is a substantial contribution given India s size and many dimensions of heterogeneity. The second major contribution of this work is a set of empirical investigations of potential causal mechanisms. A substantial literature shows that leaders supply public goods and services that are preferred by members of their identity group, suggesting that if preferences for education are stronger among women then the introduction of women leaders should increase the supply of educational infrastructure or services. Using detailed administrative data on districtwise school infrastructure, I show that there is no evidence of increases in either the extensive or intensive margin of schooling infrastructure related to higher levels of exposure to seat quotas. Leaders may also have a direct, if less tangible, effect on the preferences and aspirations of constituents of the same identity group by serving as role models. I assess the reasons claimed for rural women of school-going age dropping out of school, finding longer exposure to seat quotas to be associated with a reduction in the share of female dropouts claiming a lack of personal interest in school or unspecified personal difficulties as their reason for dropping out. This suggests the reforms changed girls educational interests and aspirations, and possibly changed the schooling environment to be more conducive to the participation of young women. Overall, there is strong evidence that a policy aimed at promoting the political involvement of adult women had a distinct role in closing the educational attainment gender gap seen in younger generations, and this was possibly effected by women leaders serving as role models for younger women. Finally, even if aspirations appear to be linking seat quotas to educational enrollment, it is yet unexplored in the literature precisely how this mechanism operates: how are leaders salient to constituents? Using a comprehensive database of news articles assembled from archives of the Times of India, I provide novel empirical evidence that highlights the role of the media in making women leaders salient to their constituencies suggesting one potential channel that political empowerment operates to affect educational decisions of children. 2 There are more than 40,000 villages in West Bengal, which itself is one of the 35 states and union territories of India. 3
5 I. India s 73 rd Constitutional Amendment Act Quotas for women and other historically marginalized groups in elected bodies were first implemented in India at the national level with the 73rd and 74th Amendment to the Indian Constitution. These pieces of legislation, passed in 1992, gave national support to the formalization and implementation of an historical, decentralized governance structure known as the panchayat (or, more formally, Panchayati Raj Institutions). 3 The 73rd Constitutional Amendment Act instituted a three-tiered system of local government at the village, sub-district (block), and district levels across rural areas of the country, while the 74th Constitutional Amendment Act instituted a revised local governance structure in municipalities. 4 The Amendments were intended to provide large-scale devolution and decentralization of powers to the local bodies, stipulated that members of the local governance bodies were to be elected at five-year intervals, and provided for one-third of all seats at each governance level to be filled by women and a proportionate seat share reserved for representatives from historically marginalized social groups (Scheduled Castes/Scheduled Tribes). The 73rd Amendment stipulated that states had the responsibility to adjust or amend local elections to comply with the provisions of the Amendments, and all states amended existing laws or passed new laws to be compliant within one year. Compliant elections were eventually held in nearly all jurisdictions, and there is considerable variation in the timing of these first elections across states. This timing is plausibly exogenous due to state authorities waiting for the term of existing governing bodies to expire. That is, most state governments waited for the term of office 3 Traditionally, panchayats operated at the village level and consisted of a small number of individuals chosen by a village to oversee various local affairs. Panchayats were not standardized in their structures, organization, operations, or responsibilities, nor were they necessarily elected bodies. By the mid-20th century, the panchayat system was widely recognized to embody concealed forms of social prejudice, oppression and exploitation that were firmly rooted in local power structures (GOI 2008). In the latter half of the 20th century there was support for the revival of a reformed panchayat system and by 1989 there was strong support at the national level to give constitutional status to a broad panchayat system, leading to the 73rd and 74th Constitutional Amendment Acts being enacted in The governance structures provided for in the 73rd Amendment have come to be known as the Panchayati Raj. This terminology specifically refers to rural governance, as urban bodies have a different name, function differently, and the implementation timing of the 74 th Amendment was different from the 73 rd Amendment. Responsibilities of the Panchayat include administration of state transfer programs, planning and implementation of schemes for economic development, establishment and administration of local public goods such as educational and medical facilities, oversight of local infrastructure (water, sewage, roads, etc.) and the monitoring of civil servants (Duflo 2005). 4
6 of incumbent local officials to expire before conducting fresh elections in compliance with the provisions of the reform. 5 To the extent that data exist for earlier periods, there was only minimal involvement of women in local elected bodies prior to this reform (Mathew 2000). Figure 1 depicts the variation in state-level differences in cumulative exposure to the policy as of 2007, where darkly-shaded states correspond to those states with longer (earlier) cumulative exposure to (implementation of) reservations. Madhya Pradesh, in the center of the country, is reflected as having longer exposure due to its early implementation whereas its neighboring Chhattisgarh was one of the last states to implement the provisions of the 73 rd Amendment in Once the provisions of the reform were implemented, one-third of seats were reserved for women at any level of the governance hierarchy; for single-seat leadership positions, reservations were assigned randomly across areas (whether at the village or district level) and election cycles. This feature of rotating leadership assignment has been used to assess the effects of women leaders in a number of previous studies (Beaman et al and Iyer et al. 2012, among others). Using data from Iyer et al. (2012), Figure 2 shows the variation in cumulative exposure to district chairperson reservations as of 2007 for the states where this information is available (hereafter referred to as the ten-state sample ) in a manner similar to Figure 1, with those districts receiving more (less) exposure to women leaders more (less) heavily shaded. 6 Literature examining aspects of the Panchayati Raj and its effect on economic and social outcomes can be roughly grouped into three major strands. The first investigates how decisions of the electorate are influenced by a changed composition. Using state-level variation in India 5 In other cases, implementation timing varied less exogenously. Several states chose to incorporate provisions regarding political reservations for women prior to when the constitutional amendment was to come into effect. Andhra Pradesh provided for 22 to 25 per cent reservations for women in the Andhra Pradesh Gram Panchayats Act, 1964 (GOI 2008), while Karnataka introduced a similar level of reservation for women in Both Kerala and West Bengal restructured their institutions of local government in anticipation of the passing of the 73rd Act (in 1991 and 1992, respectively) although elections implementing these reservations were not held until after enforcement in Bihar was prevented from implementation due to legal issues regarding certain provisions of the Amendments (Iyer et al. 2012). States comprised of primarily tribal populations (Meghalaya, Mizoram and Nagaland) were explicitly excluded from the purview of the Amendments (GOI 2008). Jammu - Kashmir introduced reservations at a level consistent with the Amendments via state-level legislation in 1997, although the election of panchayats implementing the reservations provided for under its own Act has not yet taken place (GOI 2008). Jharkhand has similarly never held reserved elections. Iyer et al. (2012) and Duflo (2010) provide further details on the implementation, structure and other aspects of the Panchayati Raj. 6 Comprehensive information on seat reservations is not readily accessible from any public sources or records. For their study, the authors of Iyer et al. (2012) collected data from diverse sources, including filing Right to Information Act requests for the history of district leader reservation assignments since the implementation of the 73rd Amendment. Some states did not respond to these requests, resulting in the ten-state sample shown in Figure 2. 5
7 over four decades, Pande (2003) identifies how the mandated reservations of legislative positions for minority members of Scheduled Caste/Scheduled Tribe (SC/ST) individuals increased the redistribution of resources towards these groups, demonstrating enhanced policy influence. Besley et al. (2004) found that reservation of a leadership position for SC/ST individuals increased access among SC/ST households to infrastructure and government services. Chattopadhyay and Duflo (2004a) use information on the location of public goods to show that when an area has leadership positions reserved for SC/ST individuals, the share of public goods going to that group is significantly higher, while Chattopadhyay and Duflo (2004b) use villagelevel variation in political reservations for women to predict the type of public goods provided in 265 reserved and unreserved villages in West Bengal and Rajasthan, finding that leaders invest more in infrastructure that is directly relevant to the needs of their own gender. Overall, the group identity of leaders has shown to matter in the type of public goods provided under the purview of the governing body, and this has been established in various contexts not limited to the Indian case (e.g., Powley 2007, Washington 2008). Duflo (2005) provides an assessment of the case for political reservations for women and other historically-underrepresented groups, and, using evidence from India, concludes that reservations incur a significant reallocation of public goods toward the preferred allocation of the previously politically-underrepresented groups. Pande and Ford (2011) provide a recent comprehensive review of the literature on gender quotas. A second literature assesses how the character and actions of the new electorate may influence those groups with which they interact. Topalova and Duflo (2004) find that women leaders in India are less likely to take bribes than their male counterparts. Iyer et al. (2012) use plausibly-exogenous state-level variation in the timing of the policy implementation to investigate the effects of political representation on crime against women, finding significant evidence that political empowerment resulted in greater reporting of crimes against women. Ghani et al. (2014), following this methodology, quantify the link between the timing of reservations and changes in women engaged in India s manufacturing sector as workers and entrepreneurs and find no evidence that overall employment of women in manufacturing increased after the reforms, but strong evidence for an increase in the creation of women-owned establishments in the unorganized manufacturing sector. 6
8 The third strand of literature characterizes how leaders from newly-empowered groups may change the perceptions of their group, potentially affecting an array of social and economic outcomes. Hoff and Stiglitz (2010) develop a conceptual framework to show how changes in power, technology and contacts with the outside world matter, especially because they can lead to changes in ideology. Beaman et al. (2009) show how perceptions of women improve once men are exposed to women in leadership roles, providing substantial evidence in support of the model of attitudes and bias implicit in Hoff and Stiglitz (2010). 7 Earlier work on the relationship between political empowerment and education uses cross-sectional variation to assess longer-term impacts of politicians on educational outcomes. Clots-Figueras (2012) uses a regression discontinuity design based on closely-won elections between female and male candidates to show that the gender of politicians affects the educational levels of individuals who grow up in the districts where the politicians are elected. The author finds that the election of women politicians did increase primary school completion and that this effect was primarily found in urban and not rural areas, but that the effect was not statistically different for men versus women. Among a sample of households in 495 villages in West Bengal, Beaman et al (2012) examine the effects of randomly-rotated exposure to women in village-level leadership positions to identify effects on aspirations and educational outcomes for girls, with differences in exposure across districts of up to 15 years (three election cycles). Compared to villages that never had chairperson seats reserved for women, the gender gap in aspirations closed by 25% in parents and 32% in adolescents in villages assigned to a female leader for two election cycles (approximately ten years). The gender gap in adolescent educational attainment is erased in these villages, and girls spend less time on household chores. The authors find no evidence of changes in young women s labor market opportunities, attributing the impact of women leaders to a role model effect. In this paper I follow the above-mentioned studies in exploiting exogenous crosssectional geographic variation in exposure to leaders to identify longer-term effects of seat quotas on education. As schooling decisions may be slow to change due to the inertia of the 7 Azam and Kingdon (2012) characterize for a recent period the extent and patterns of sex bias in education in India. Notably, they find that pro-male gender bias exists in the primary school age group and increases with age. The authors also find that the extent of pro-male gender bias in educational expenditure is substantially greater in rural than in urban areas. 7
9 factors that determine them, including tradition and social/cultural beliefs, the link between the composition of local political representatives and youth schooling decisions may be more circuitous than that between the former and governance/economic factors directly under the purview of the governance bodies. Using summary data from two rounds of the Indian National Sample Survey Office s household Participation and Expenditure in Education survey, Table 1 shows the distribution of self-reported reasons for non-enrollment cited by rural Indian women dropouts of school-going age. Among 15 possible explanations for dropping out, more than 2/3 rds of respondents cite one of four reasons (as of ): that they are not personally interested in studies, that they experienced an inability to cope with the schooling environment or failure, that their parents were not interested in their studies, or general household financial constraints. While self-reported reasons for not attending school may be more likely to convey proximate rather than ultimate causes, they are nonetheless informative as to the role in India of culture and tradition and the general schooling environment in determining girls education. That is, the main constraints to girls education in this context may be less accessible to policy interventions than commonly-cited economic factors such as infrastructure/schooling provision, household duties, or participation in income-generating activities and child labor. II. Data: Reservations Implementation and School Enrollment Data on the timing of exposure to seat quotas comes from several publications documenting the implementation and progress of the 73 rd Constitutional Amendment (Mathew 1995, 2000; GOI 2008, Iyer et al. 2012). India s National Sample Survey Organisation Socio-Economic Survey Schedule 10: Employment and Unemployment provides data on enrollment. 8 The NSS data come from a survey of a representative sample of households across all Indian states and union territories approximately every five years, with the household sampling frame drawn from the most recent population census and stratified within the rural and urban areas in each district. 9 The primary analyses focus on data from thick rounds in (prior to the policy change) and Hereafter referred to as NSS data. 9 These are sometimes referred to as the NSS thick rounds. 10 Hereafter referred to only by the initial year for simplicity. 8
10 India s Employment/Unemployment schedule is akin to many household-level labor force surveys administered worldwide. Respondent households provide individual-level details on demographics, employment, income and consumption particulars for all household members. The analysis exploits variation in the usual principal activity field, which among other activities indicates whether the individual was currently attending [an] educational institution. Beyond restriction to the estimation sample of school-age children in rural areas of the country, minimal data cleaning procedures were required. All geographic definitions have been made forwards- and backwards-consistent over time to account for changes in administrative boundaries and the bifurcation of three states in Table 2 shows trends in enrollment rates for various gender, age and social groups over the period of study based on the NSS data. Since 1987 there has been close to 100 percent enrollment in lower-primary school cohorts, motivating the restriction to individuals aged nine to 17 for whom enrollment may have been affected by the policy change. Among non-sc/st population there has been substantial progress in enrollment rates in all age cohorts between 1987 and 2007, with the 9-11 and age brackets for young men improving from 91 and 78 percent to 98 and 93 percent enrollment, respectively. In all age groups, women lag in initial and ending levels, although increases in enrollment rates were greater. In panel C, I calculate the educational enrollment gap. In the youngest school-age cohort there is almost no gender gap in any of the years, while among older age cohorts the gender gap has decreased substantially from 14 percentage points in 1987 to almost zero by 2007 in the 9-11 age group, and from 28 percent to 10 percent in the age group over the same period. The SC/ST group, having started at lower enrollment levels and with a wider gender gap, saw faster increases in enrollment rates and reduction in the gender gap, although by 2007 still not reaching full parity with same-age peers. III. Within-State Effects of Exposure to District Chairperson Reservation Table 3 contains summary statistics of the cross-district variation in cumulative exposure to district chairperson reservations as of 2007 by state (as shown in Figure 2). The mean level of exposure across states is relatively similar, but there is substantial variation within-state in years 11 After several states chose to increase seat quotas for women to a minimum of 50 percent. I thus restrict my analysis to the wave due to incomparability of the policy measure and its exogeneity across states. 9
11 of exposure, reflecting the nature of the chairperson reservation assignmentsnote, however, that some states (for example, Haryana and Rajasthan) have little variation in exposure across districts while other states (Gujarat, AP, West Bengal, for example) have district exposure ranging from zero to 10 or 11 years. Table 4 investigates baseline (1987) characteristics of districts in this state sample and how these characteristics differed by their eventual (2007) cumulative number of years of chairperson reservation. I use the cutoff of five years of cumulative exposure to delineate those districts which had a woman chairperson for more than one average election cycle. Overall, there is strong balance between the districts that eventually had high versus low levels of exposure, with pre-policy enrollment rates across the two district groups not statistically distinguishable among other groups. These differences also do not change once removing state fixed effects from both the outcomes and the regressor (Panel B). 12 Alternative tests regressing the continuous exposure measure on local enrollment rates and population characteristics at the district level yield similar results. 13 Table 5 contains coefficients from an estimation of the following cross-sectional equation which relates exposure to chairperson reservations to an enrollment indicator, estimated separately for gender and social subgroups: Enrollment rate,, = δ + δ Policy exposure, + θ + ε,, (1) Enrollment rate,, is an enrollment indicator for individual i, in district j, state s, θ a vector of state fixed effects, and Policy exposure, defined in Panel A as the number of years that district j had the chairperson seat reserved for a woman as of The identifying assumption of E ε,, Policy exposure, = 0 is achieved if the seat quotas were assigned over time in a random manner, as supported by Table 4. Columns 1 and 2 of Table 5 present the coefficients of separate estimations of enrollment status for two social groups of women, while Columns 3 and 4 test for similar effects among corresponding groups of young men as a comparison. Across Columns 1 and 2, there are only differences in enrollment rates related to the policy for SC/ST women, with a coefficient of 12 The only notable exception to strong balance being that high exposure districts have higher enrollment rates for non-sc/st men and have a slightly lower SC/ST population share. 13 F-tests of district-level covariates in predicting eventual exposure across districts yield test statistics ranging from 1.35 to 1.51, consistent with the findings of Table 4. 10
12 0.014 indicating that, within state, SC/ST women of schooling age had a 1.4 percentage-point higher enrollment rate for each additional year of chairperson reservations. Among either groups of young men there is no commensurate or offsetting effect. In Panel B, the policy exposure measure is made discrete to highlight how the reservation effects are concentrated among the districts that were in the upper tail of exposure to chairperson reservations (i.e., those that had experienced closer to two election cycles of chairperson reservations, relative to those that had less than 3 years of exposure). In this case, effects are concentrated clearly among the same group (SC/ST women), implying that individuals in districts having been exposed to nearly two election cycles of reservations have a 16 percentagepoint higher enrollment rate relative to individuals in districts having the chairperson seat reserved for less than three years. Figure 4 further highlights this pattern of increasing effect after one election cycle by plotting the regression coefficients from four separate regressions similar to the specifications in Table 5, Panel B where the policy measure has been further discretized to a vector of indicators for two-year increments of exposure. While there no clear pattern for the other groups, there is an obvious upward trend in the effect apparent from the sample of SC/ST women, lending empirical support for the supposition that the link between political empowerment and educational attitudes and investment is unlikely to be discernible within a short timespan after a policy change. IV. Identifying Effects Using Border Discontinuities The following section briefly motivates and derives an estimating equation which takes advantage of discontinuities in the level of exposure across neighboring districts lying across state borders. Consider a set of administrative districts (indexed by j) within larger geographic areas (indexed by k, not necessarily states). An equation for enrollment rates across districts can be expressed as the following linear function of some policy exposure (a general version of equation (1)): Enrollment rate, = δ + δ Policy exposure, + μ + ε, (2) 11
13 Policy exposure, captures the cumulative years of exposure to the policy, which varies across districts j. The area-specific error term μ contains unobservables related to factors which are common in the area, while the district-specific disturbance term ε, captures factors determining enrollments which may be distinct across municipalities within the area but is exogenous to the policy exposure. The identifying assumption is that ε, and Policy exposure, are uncorrelated; although Table 4 presents supporting evidence, it may still be the case that area-level factors such as tradition, culture, or social norms influence unobservables related to the policy across areas, perhaps via de facto rather than de jure empowerment. The estimation of equation (1) addresses this concern if μ varies by state due to administrative factors or social and cultural norms differentiated by state. If the variance in μ instead is comprised of unobserved determinants which do not particularly correspond to administrative boundaries, another method of purging μ becomes necessary. One solution is to find areas similar in factors related to such unobservables described above, but with differing levels of policy exposure. 14 In such a case, μ will contain unobservables which correspond to similarities within a given area k based on the redefinition above. To purge the equation of μ, I difference equation (2) (for clarity and ease of exposition, I have dropped the individual subscripts for district j and instead indexed the first and second district in a pair), yielding (3): Enrollment rate, Enrollment rate, = δ + δ (Policy exposure, Policy exposure, ) + (ε, ε, ) (3) A set of areas which could be used for such an exercise are adjacent districts lying on either side of a state border, most likely to satisfy the principles of having similar unobserved factors but with differing levels of policy exposure such that Policy exposure, Policy exposure,. This strategy thus exploits district-level differences in exposure to the policy reform to identify causal effects using cross-sectional variation across districts, having purged the equation of both area-specific and state-specific unobservables. 14 Similar identification strategies have been implemented in many contexts, recently by Michalopoulos and Papaioannou (2014), Ghani et al. (2014), Jofre-Monseny (2012), Duranton et al. (2011), Naidu (2011), Dube et al. (2010), and earlier by Holmes (1998). 12
14 The data comprise the unique set of neighboring district pairs lying across state borders, with districts ordered within the pair alphabetically by state. 15 I use 2007 enrollment rates and additionally control for two vectors of state fixed effects (θ, and γ, ) and the 1987 enrollment differential (before the policy change) as a proxy for the differenced district-specific error and time-invariant differences across districts, which also yields efficiency gains. The main regressor is calculated as the difference in cumulative exposure to reservations as of 2007 (i.e., [2007 implementation year, district 1] [2007 implementation year, district 2]). This yields the following estimating equation, where a positive coefficient relates longer relative exposure to the reform to higher relative enrollment rates in 2007: Enrollment rate, Enrollment rate, = δ + δ (Policy exposure, Policy exposure, ) + δ (Enrollment rate, 1987, Enrollment rate, 1987, ) (4) + θ, + γ, + (ε, ε, ) The identifying assumption is now in terms of differences: E ε, ε, Policy exposure, Policy exposure, = 0. Table 6 contains results of the estimation of equation (4). Note that the sample size is quite small due to the restriction of the analysis to border district pairs available in the ten-state sample. Panel A indicates that, using the cross-border strategy, there is a similar (although imprecisely estimated) effect of an additional year of exposure to chairperson reservations of 0.12 (0.14). The effect becomes marginally statistically significant when discretizing the measure in Panel B where among district pair in which the differential in exposure was greater than four years, SC/ST women in the district with higher exposure had a nearly 14 percentage point higher enrollment rate than those in the district with lower exposure. 16 Given that most districts already have some level of exposure, these point estimates are comparable both conceptually and in magnitude to those in 15 A single district may have multiple neighbors, and thus may appear multiple times in the data (each instance with a different neighboring district). In the estimations, two-way clustering is implemented to correct for error term correlation in two dimensions. See Appendix A for details on the construction of the data used for the border analysis. 16 There is less variation in differences in exposure across border district pairs than there was across districts in total cumulative exposure: only a small number of district pairs (less than five percent) have a difference in exposure greater than five years; for this reason, the discretized policy regressor in Panel B is both conceptually and numerically different from that in Panel B of Table 5. The indicator for large difference captures approximately 25 percent of the district pair sample. The conclusions of the analysis are not sensitive to increasing or decreasing these cutoffs by one year. Note that for the estimations, in cases where the ordering of districts yields a negative net difference in exposure the indicator is multiplied by
15 Panel B of Table 5, which found that within states, high exposure districts (8-11 years) had a 16 percentage-point higher enrollment rate compared to unexposed districts; compared naïvely to the coefficient on the medium exposure groups of 3-7 years (0.031) this difference is of similar magnitude to the estimates in Table 6. In this estimation there is also an effect among non-sc/st women in both panels following the magnitude and pattern of increasing effect with higher exposure differential, which is plausibly driven by the purging of area-specific unobservables in addition to state fixed-effects in this specification. 17 Such correspondence of the empirical results from an internally valid identification strategy to those results derived from the border discontinuity strategy is only meaningful if the average treatment effect of the two populations is expected to be similar. In Appendix Table 1 I test for differences in observable characteristics (in terms of enrollment rates and population distributions) between the interior and border districts. That these populations are not observably different in terms of starting enrollment rates supports the argument that the average treatment effect should be similar across the two samples. 18 V. Border Discontinuity with State-Level Exposure Differences In order to use state-level implementation as exogenous identifying variation, I first look for evidence that the implementation timing across states was related to pre-period enrollment rate levels or trends. Figure 3 shows separately the initial state-level enrollment rates for the four gender/social groups in 1987 plotted against the order in which states implemented the reservations, supporting that claim that the reform implementation was exogenous to pre-period enrollment rate levels. The line in each panel is virtually flat, indicating no detectable relationship between pre-implementation enrollment rates and the subsequent timing of implementation across states. Table 7 provides empirical support for parallel time trends in enrollment rates in the ten years preceding the policy implementation by directly estimating the 17 A small sample such as that available for the specifications in Table 6 warrants substantive concerns over outliers. The conclusions from Table 6 are robust to 5% Winsorization of the dependent variable or the inclusion of an additional vector of covariates as controls (differences in the 1991 district-level values of the sex ratio, the SC/ST population share, and the rural female literacy rate). These results are available from the author upon request. 18 The border districts do have a slightly higher population share of SC/ST individuals than interior districts, which would suggest a stronger treatment effect among those groups due to higher mandated seat shares corresponding to a higher population share. The expected direction of this difference is roughly borne out in the empirical estimates. 14
16 enrollment status of individuals using data from the earliest available survey year ( ) through the year of the reform passage ( ) with a linear trend term and an interaction of this trend with the state-level year of implementation. State fixed effects absorb the main effect of differential adoption years by state, and state-clustered standard errors correct for serial correlation within states. A negative coefficient on the interaction term would indicate if states that implemented the policy earlier also had more quickly-rising enrollment rates prior to the policy change. I find no evidence of this for any of the subgroups that are the focus of the analysis. Table 8 provides summary statistics of the absolute differences across border district pairs. 19 Table 9 contains the results of the estimation of equation (4) where coefficient magnitudes can be read directly as the increase in the enrollment rate percentage points per additional differential year of exposure. 20 The results parallel those obtained in cross-border analysis for non-sc/st women: an additional year of exposure to the overall Panchayat system results in a nearly one percentage point increase (0.009) in the enrollment rate. For SC/ST women, however, there are no effects using this national sample. 21 The difference in estimated effects for SC/ST is due to the changed sample: Panel B restricts the estimation sample to the border district pairs form the ten-state sample, showing in effects among SC/ST women consistent with those found previously. 22 Panel A shows a nationally- representative effect: for each additional differential year of exposure, non-sc/st women in the more exposed district saw a nearly one percentage point increase in enrollment rates. Panel C adopts an additional strategy which instruments for the policy exposure differential based on an expected differential calculated from the expected implementation 19 There are different observation counts across measures due to some cells containing zero values in the denominator; in general, these district pairs would be jointly very small in size and thus less important in weighted regressions. In the estimations, district pairs missing values in any regressor are implicitly dropped. 20 Two things are slightly different in this specification: standard errors are clustered by border (allowing for correlation across district pairs sitting on the same state border) and the two vectors of state fixed effects have been excluded due to the policy measure being a function of state-level implementation. 21 All regressions are unweighted and are robust to weighting by the natural log of the population of the combined district pair in Results are also robust to Winsorization of the dependent variable at both 1 and 5 percent. 22 It is unclear why this might be the case. In Appendix Table 2, I compare characteristics of areas falling in the tenstate sample versus those outside the sample, with minimal observable differences across the two groups. The difference in results between the two samples suggests parameter heterogeneity across states and that arbitrary geographic restrictions of the analysis led to externally invalid estimates even when the subsample is not observably different in a way that would yield priors regarding such parameter heterogeneity. 15
17 timing based on election cycles prior to the passage of the 73 rd Amendment. To construct this expected differential, I used state-wise information on local governance elections prior to the 1993 reforms found in Mathew (2000). 23 While the magnitude of the effect is somewhat moderated, the direction and pattern of effects is still consistent with Panel A All estimates are additionally robust to the inclusion of a vector of the district pair differential in female literacy rates, sex ratios and the SC/ST population share for rural areas based on the 1991 Population Census. Fixed-effects specifications yield results nearly identical to those in Table 9, and Monte Carlo simulations based on placebo variation in state implementation timing indicate the magnitude and significance of the point estimates are unlikely to have arisen by chance (see Appendix Table 3 for details). In unreported estimations, I discretize the policy measure into groups of low, moderate and high levels of exposure differential and confirm that the largest effect magnitude is found among the same groups among district pairs having the largest exposure differentials. Figure 5 plots a semi-parametric estimation of treatment effects by disaggregated spans of exposure differentials. While the pattern is not quite as clear as Figure 4, there is again an upward-trending effect magnitude for non-sc/st women. 23 While not directly available for every state, I am able to construct the expected implementation year for a majority of states based on election cycle lengths and pre-1993 election years; the majority of these expected implementations are the same or very close to the actual effective implementation years. For states for which it is not possible to construct this information I use the actual effective implementation date. This suggests some mechanical violation of the exogeneity restriction and that caution should be taken in the interpretation of the IV estimates, which are provided merely as a robustness check rather than as a preferred strategy. 24 In Appendix B, I look for similar results for either the chairperson or state-level timing effects in a well-identified differences-in-differences framework estimating short-run policy effects. This approach has been used by several studies in the literature. Perhaps unsurprisingly, there are no discernible effects of either level of policy variation on enrollment rates. 25 These results appear to contrast with those of Clots-Figueras (2012). In particular, Clots-Figueras (2012) found that women leaders increased educational enrollment in urban but not rural areas, and among both boys and girls, and this effect occurred through greater provision of schooling infrastructure. In my paper, I find effects for girls only, and rule out schooling provision as a mechanism for this to occur. It may not be reasonable, however, to compare the two studies directly: Clots-Figueras (2012) studies a substantially earlier time period in India when enrollment rates were substantially lower and the electoral context was absent any seat quota system. For this reason, incentives regarding the provision of public goods, as well as constituents perception of women leaders, are likely to be different in the two contexts. Although the current paper studies effects of women leaders in different levels of government than those examined by Beaman et al. (2012), there is a correspondence in the magnitude and pattern of the effect of women leaders on girls educational enrollment. 16
18 VI. Discussion and Investigation of Causal Mechanisms Various mechanisms likely contribute to the circuitous link between political and economic empowerment, including infrastructure and public goods provision (Chattopadhyay and Duflo (2004a, b), gendered allocation of household resources and womens bargaining power (Schultz 2001) and/or aspirations (Beaman et al 2012). In the following section, I investigate and discuss these hypotheses as potential channels by which educational effects of a changed local leadership composition may arise. Labor market effects on bargaining and returns to education Labor market dynamics making women s work more valuable may affect educational decisions of young women in two ways: via increased incomes of adult women changing relative intrahousehold bargaining power, and by increasing the returns to education for women. A long literature has looked at gender-differentiated effects of household income as well as the role of female earnings and bargaining power on educational attainment. 26 Two recent studies provide strong evidence that seat quotas in India affected labor market opportunities for adult women, plausibly altering girls education decisions by either of the two channels above. For the private sector, Ghani et al. (2014) find strong evidence that political reservations caused an increase in women-owned establishments created in the unorganized manufacturing sector, particularly in traditional and household-based industries. In the public sector, longer cumulative exposure to women leaders increased the share of government-provided employment given to women at the introduction of a national rural employment guarantee scheme over the period of (Ghani et al. 2013). These studies jointly suggest labor market returns as one channel by which women leaders affect educational outcomes of young women Edmonds and Pavcnik (2002) use a panel dataset of Vietnamese households to show that exogenous changes in household income though rice prices cause a reduction in child labor, and these reductions are largest for girls of secondary-school age and correspond to a commensurate increase in school attendance for the group; for female bargaining power, de Carvalho Filho (2008) finds a pronounced effect of social security benefits on female child labor when benefits go to female household members. 27 Beyond bargaining power, expanded labor force activities available to women may change incentives for parents to invest in daughters. A substantial literature investigates the role of demand-side factors changing the underlying valuation of education for girls in LDCs. Munshi and Rosenzweig (2006) find that the expansion of the financial sector and other white collar industries caused enrollment in English language schools to increase for girls (but not boys). Similarly, Oster and Millet (2010) show that the introduction of a call center in towns in southern India 17
19 School provision Chattopadhyay and Duflo (2004a) find that the gender of local leaders affects the public goods provided in a community, and that women leaders direct public spending to infrastructure that is more relevant to their own gender. While it is not noted in earlier work whether there is a difference in preferences for educational infrastructure between male and female leaders, a conceptual extension of earlier work would suggest differential provision if women leaders indeed prefer educational infrastructure more so than male leaders. To investigate whether educational infrastructure provision was caused by longer exposure to the 73 rd Amendment reforms, I use data from India s District Report Cards provided by the District Information System for Education (DISE). Since , this agency has annually compiled district-level data on over 400 education-related indicators. For the purpose of parsimony, I construct a small set of variables from the DISE data to allow me to test hypotheses regarding the extensive and intensive margins of schooling infrastructure, including schools per thousand persons, new schools established per thousand persons since 1995, teachers per pupil and the share of classrooms in good condition. I also capture a set of measures related to the experience of girls in schools, particularly the share of schools that have a separate girls lavatory and the share of teachers who are female. Using the DISE data corresponding to the enrollment figures analyzed above, Table 10 shows the results of estimating equation (6) as in Table 9 using these schooling indicators as the outcome (with the same pre-period control measure based on the non- SC/ST female enrollment differential in 1987). Each column in Table 10 shows the coefficient on the difference in exposure using the dependent variable indicated. For the extensive margin, the preferred measure (rural schools per thousand rural population) does not appear to be correlated to a longer exposure gap. 28 For the intensive margin, there is also no detectable difference in schooling infrastructure, either in terms of the share of classrooms in good generated large increases in school enrolment for both boys and girls. Shastry (2010) finds that the information technology sector grew more rapidly in areas of India where English is more widely spoken, and that in turn those areas experienced increased school enrolment. Kochar (2004) showed that urban rates of return influence rural schooling, particularly amongst households who are most likely to seek urban employment. Jensen (2010a) highlights the role of perceived returns in the Dominican Republic, while Jensen (2010b) finds that knowledge (salience) of educational returns increases educational investment among girls. Other salience literature, such as Nguyen (2008), finds that role model identity matters in the effect of information on updating perceived returns: role models of similar backgrounds to students have a larger impact on outcomes than role models of dissimilar backgrounds. In this case, the gender of local leaders may make changing returns to women s educational investment more salient, thereby indirectly causing increases in educational enrollment. 28 Results of this analysis are not sensitive to inclusion or exclusion of the 1987 enrollment difference as a control. 18
20 condition or teacher-to-pupil ratios. Finally, among gender-related factors, there is no relationship between female-friendly facilities or higher female share of teachers and longer policy exposure. Overall, there is no evidence of an increase in educational infrastructure associated with longer exposure to the reform. Attitudes, social norms and aspirations Beaman et al. (2012) establish that exposure to women leaders closed the aspirations gap between adolescent boys and girls in a cross-sectional sample of 495 villages in West Bengal, India. To check whether there is evidence of this finding more broadly, I use state-level tabulations from official reports based on the NSSO s Participation and Expenditure in Education (Schedule 25.2) surveys carried out in 1995 and These surveys contain an additional module on education which asks individuals of school-going age whose primary activity is other than attending an educational institution their main reason for having dropped out. While not a replication of the approach and data used in Beaman et al. (2012), the novel survey questions allow an investigation of a similar theme with broader scope (but perhaps less specificity). In Table 1 it is apparent that there is a large reduction in the share of dropouts citing personal disinterest and inability to cope, with most of this share reduction being reallocated to parents not interested in studies and financial constraints. 29 Given that non-enrollment was lower in the latter period (Table 2), the increase depicted for these latter two dropout reasons is only in share and not in absolute levels suggesting that these factors may be the margin on which the reduction non-enrollment among rural women occurred. Figures 6 and 7 plot the reduction in the share of individuals reporting these two reasons for dropping out with the horizontal axis showing the year of the policy implementation by state. The upward sloping relationship suggests that states that implemented the policy earlier saw a larger reduction in the share of individuals reporting those two reasons for dropping out, thus linking reservations to the reduction in individuals citing those reasons for dropping out. Taken together, this analysis provides further support for the finding that the reservations affected young girls through a role model effect, changing their educational aspirations (Figure 6), and that local women leaders may have made the schooling environment more suitable to female attendees (Figure 7). 29 While a more detailed, district-level analysis is desirable, I am limited in my analysis of these data to using publicly-available summary tables, which are disaggregated only by state, location (rural/urban) and sex. 19
21 Media as a conduit for salience The majority of available evidence thus points to aspirations as the primary identifiable proximate cause of changes in the enrollment behavior of young women in the current context. However, it is yet unexplored how precisely aspirations are affected by politicians; that is, what is the conduit by which the introduction of women in politics is made salient to the younger generation? Among others, one such conduit may be the media. To test whether the media plays a role in supporting the salience of women leaders, I analyze the web archive of news media articles available on the Times of India from 2001 to The archive in total contains 560,552 valid links to articles as of August, Once downloaded, articles are inspected for geographical references in the initial lines of text based on a list of 1,200 of India s largest cities. Of these, 378,439 articles reference a specific geographic location. The articles are then assigned a reference state based on city information, and information regarding the timing of elections is matched into the data. I remove from the sample articles identifiable as coming from sports, business, fashion/style, or international sections of the paper, leaving over 345,000 articles. After dropping articles about states not part of the panchayat system (largely referencing Delhi), I am left with 244,462 articles. I next inspect the entire text of the articles for strings indicating words referring to three distinct concepts: panchayats or leaders ( panchayat, sarpanch, mukhiya, or pradhan ), school or education ( educat-, school, class, teach-, college, or university ) and women or girls ( women, woman, female, or girl ). While rudimentary, this approach nonetheless should capture the bulk of articles referring to any of these concepts, with perhaps the exception of the latter being overly general and likely more noisy by construction. 31 I use the textual information to construct three separate indicators for articles containing panchayat, education, or women words. I then use a difference-in-differences identification strategy to assess the change in the incidence of articles containing references to these concepts in state elections years versus non-election years to associated election years with differential coverage of these topics relative to non-election years. The estimating equation is: 30 Available at: accessed May-September No other words, stems or combinations have been tested to identify alternative sets of article groups referencing these concepts. 20
22 Y,, = δ + δ Election, + θ + γ + ε,, (5) Where Y,, is an indicator for article i, referencing state s in year t, Election, an indicator for there being panchayat elections in state s and year t, and θ and γ the vectors of coefficients on state and year indicators, respectively. ε,, is the disturbance term, potentially correlated within states. I estimate this specification via a linear probability model for six outcomes indicators in Y,, : separately for articles referencing the three topic groups above, as well as articles referencing three combinations of the topics: women and panchayats, school and panchayats, and women and education. 32 Table 11 contains the estimated coefficients for δ for the different outcomes, scaled in magnitude to be read as per thousand articles. Within state and controlling for national yearly shocks, Column 1 shows an increase of 10 out of every 1,000 articles that reference panchayats in elections years versus non-election years; this is not particularly surprising: media coverage of the governance system goes up in election years. Column 2 shows that the share of articles referencing schools also increases in election years by nearly the same magnitude, while column 3 shows no discernible increase in articles containing the set of words used to capture references to women (admittedly an imprecise measure). Column 4 looks at the increase in the share of articles that reference both the panchayat system and women: nearly one-fifth of the increase in the share of articles referencing panchayats is comprised of articles also referencing women, and there is a smaller and marginally significant increase in the share of articles referencing both panchayats and schools. There is no increase in articles referencing both women and schools, although this may be due to the noise in the former measure. The magnitudes seem small until the volume of new articles analyzed is considered. Given nearly 250,000 articles over the sample period, this translates to nearly 100 articles per day. Given the magnitudes above, this implies an additional article referencing panchayats per day in election years, and an additional article approximately weekly referencing panchayats and women, and panchayats and schools, in election years. The above analysis suggests popular 32 It is important to note that this analysis does not attempt to distinguish whether news media changes in response to the presence of women leaders,or demand from readers for articles on certain topics, or if news media definitively drives educational outcomes; rather the analysis looks for evidence of this channel as one allowing women leaders to be salient to the general public. 21
23 media, by making women leaders and issues of education more salient, may play a role in affecting the aspirations of young women. 33 VII. Conclusion If external validity has been a persistent and entrenched thorn in the side of the experimental literature, then development economics surely sits at a particular nexus that exacerbates such concerns, given the desire for policy advice and the increased use of RCTs yielding causal estimates for a (typically) limited population. Increased recent attention to publication dynamics in the social sciences has pushed many to the consensus that the field should seek to expand upon the generalizability of focused experimental studies, moving Angrist and Pishke s (2010) particular truth incrementally closer to the whole truth. 34 This paper makes one step in such a direction in assessing the relationship between political inclusion and economic well-being, finding that India s flagship political empowerment policy mandating representation quotas for women increased enrollment rates of girls on the order of one percentage point per year of additional policy exposure. Similar to the magnitude of effects found by Beaman et al (2012), these findings extend the generalizability of their localized estimates to the national level. These country-level findings (the first of which I am aware) in such a heterogeneous country begs further research as to the generalizability of these dynamics outside India. I contribute to existing knowledge regarding the link between political empowerment and economic outcomes in several ways. First, the effects are based on variation in exposure to women leaders at different levels of government than have been previously investigated in the context of educational investment, suggesting that the potential of elected leaders to serve as role models likely pervades the hierarchy of government and extends beyond those leaders serving a highly localized constituency. Next, semi-parametric estimations provide strong evidence that 33 Some caveats are in order. The Times of India is known to be slightly center-left in its reporting. This may skew the results upward if such leaning increases the responsiveness to reporting on local governance and/or coverage of gender issues. However, likely dominating such an effect is that the Times of India is a national English-language daily, which may be less likely to report on local elections and issues relative to regional or local newspapers thus likely understating the media s role in making leaders salient to constituents at the local level. 34 Efforts to encourage direct replications of RCT studies is one example of the field s recognition of concerns regarding external validity in the experimental literature. 22
24 educational enrollment is not responsive to the focal policy intervention in the short run, but rather takes some time to affect educational outcomes. I shed light on mechanisms providing the channel though which the effects of leaders on education are realized. The strongest findings suggest that women leaders increased the educational aspirations of girls via a role model effect, and I provide novel empirical evidence highlighting the role of the popular media as one potential channel for this role-model effect to be transmitted. I also rule out other possible channels (e.g. the extensive margin of schooling provision) that come from a reasonable extension of earlier studies on infrastructure provision. The empirical strategy undertaken provides a method for assessing the long-term impacts of mandated seat quotas in a general context and using administrative data, as it takes advantage of a design naturally arising from constraints likely to be faced if similar policies are enacted at a national level: staggered implementation arises from asynchronous election timings across jurisdictions, and randomly subjecting leadership seats to reservation is a fair and accepted method to implement such provisions for levels of the hierarchy which are comprised of only one individual. Ideally, future work will further investigate the existence of the relationship between political and economic empowerment in other countries that have implemented seat or candidate quotas. As a body of work, such results can guide policymakers as to whether political reservations may be a viable option to reduce gender or social inequality across dimensions that are historically difficult to affect directly via typical policy levers. 23
25 References Amin, Mohammad. (2010). Gender and Informality World Bank Enterprise Note 16. Angrist, Joshua D. and Jorn-Steffen Pischke. (2010). "The Credibility Revolution in Empirical Economics: How Better Research Design Is Taking the Con out of Econometrics" Journal of Economic Perspectives 24 (2): Akerlof, George. A., & R.E. Kranton. (2000). Economics and Identity Quarterly Journal of Economics 115: Azam, Mehtabul, and Geeta Gandhi Kingdon. (2010). Are Girls the Fairer Sex in India? Revisiting Intra-Household Allocation of Education Expenditure World Development. Ban, Radu, and Vijayendra Rao. (2008). "Tokenism or Agency? The Impact of Women s Reservations on Village Democracies in South India" Economic Development and Cultural Change 56: Beaman, L., Chattopadhyay, R., Duflo, E., Pande, R., & Topalova, P. (2009). Powerful women: Does exposure reduce bias? Quarterly Journal of Economics 124: Beaman, L., Duflo, E., Pande, R., & Topalova, P. (2012). Female Leadership Raises Aspirations and Educational Attainment for Girls: A Policy Experiment in India Science, 335: Behrman, J.R. & Knowles, J.C. (1999). Household Income and Child Schooling in Vietnam The World Bank Economic Review 13: Besley, Timothy, Rohini Pande, Lupin Rahman, and Vijayendra Rao. (2004). The Politics of Public Goods Provision: Evidence from Indian Local Government Journal of the European Economic Association 2: Bruhn, Miriam. (2009). Female-Owned Firms in Latin America: Characteristics, Performance, and Obstacles to Growth Working Paper. Cameron, Colin, Jonah Gelbach and Douglas Miller. (2011). Robust Inference with Multi-way Clustering Journal of Business and Economic Statistics 29: Chattopadhyay, R., & Duflo, E. (2004a). The Impact of Reservation in the Panchayati Raj: Evidence from a Nationwide Randomized Experiment Economic and Political Weekly 39: (2004b). Women as policy makers: evidence from a randomized policy experiment in India Econometrica 72:
26 Clots-Figueras, Irma. (2012). Are Female Leaders Good for Education? Evidence from India American Economic Journal: Applied Economics 4: Datt, G., & Ravallion, M. (2011). "Has India's Economic Growth Become More Pro-Poor in the Wake of Economic Reforms?" World Bank Economic Review 25: De Carvalho Filho, I.E. (2008). Household income as a determinant of child labor and school enrollment in Brazil: Evidence from a social security reform Economic Development and Cultural Change 60: Dhaliwal, Spinder. (2000). Asian Female Entrepreneurs and Women in Business an Exploratory Study Enterprise and Innovation Management Studies 1: Dube, Arindrajit, T. William Lester, and Michael Reich. (2010). "Minimum Wage Effects Across State Borders: Estimates Using Contiguous Counties," The Review of Economics and Statistics 92: Duflo, Esther. (2005). Why Political Reservations? Journal of the European Economic Association 3: Duflo, Esther. (2011). Women Empowerment and Development NBER Working Paper Duranton, Gilles, Laurent Gobillon and Henry G. Overman. (2011). "Assessing the Effects of Local Taxation using Microgeographic Data" Economic Journal 121: Edmonds, E. V. (2006). Understanding sibling differences in child labor Journal of Population Economics 19: Edmonds, E. and Nina Pavcnik. (2002). Does globalization increase child labor? Evidence from Vietnam NBER Working Paper Field, Erica, Seema Jayachandran, and Rohini Pande. (2010). Do Traditional Institutions Constrain Female Entrepreneurship? A Field Experiment on Business Training in India, American Economic Review Papers and Proceedings 100. Ghani, Ejaz & Kerr, William R. & O'Connell, Stephen D. (2014). "Political reservations and women's entrepreneurship in India", Journal of Development Economics 108: Ghani, Ejaz & Mani, Anandi & O'Connell, Stephen D. (2013). "Can political empowerment help economic empowerment? Women leaders and female labor force participation in India", Policy Research Working Paper Series 6675, The World Bank. Ghosh, Piyali, and Reena Cheruvalath. (2007). Indian Female Entrepreneurs as Catalysts for Economic Growth and Development The International Journal of Entrepreneurship and Innovation 8:
27 Government of India (GOI). (2008.) Study on EWRs in Panchayati Raj Institutions. New Delhi: Ministry of Panchayati Raj. Hausmann, R., Tyson, L. D., & Zahidi, S. (2011). The Global Gender Gap Report, Geneva, Switzerland: World Economic Forum. Hoff, Karla, and Joseph Stiglitz. (2010). Equilibrium Fictions: A Cognitive Approach to Societal Rigidity American Economic Review Papers and Proceedings 100. Holmes, Thomas J. (1998). The Effect of State Policies on the Location of Manufacturing: Evidence from State Borders The Journal of Political Economy 6: Iyer, L., Mani, A., Mishra, P., & Topalova, P. (2011). The Power of Political Voice : Women s Political Representation and Crime in India American Economic Journal: Applied Economics 4: Jensen, R. T. (2010a). The (perceived) returns to education and the demand for schooling Quarterly Journal of Economics 125: Jensen, R. T. (2010b). Economic Opportunities and Gender Differences In Human Capital: Experimental Evidence For India NBER Working Paper Jofre-Monseny, Jordi. (2012). Do welfare benefits deter migration? mimeo. Kobeissi, Nada. (2010). Gender Factors and Female Entrepreneurship: International Evidence and Policy Implications Journal of International Entrepreneurship 8: Kochar, A. (2004). Urban influences on rural schooling in India Journal of Development Economics 74: Mammen, Kristin, and Christina Paxson. (2000). Women's Work and Economic Development Journal of Economic Perspectives 14: Mathew, George. (1995). Status of Panchayati Raj in the States of India, New Delhi: Institute of Social Sciences. Mathew, George. (2000). Status of Panchayati Raj in the States and Union Territories of India. New Delhi: Institute of Social Sciences. Michalopoulos, Stelios and Elias Papaioannou. (2014). National Institutions and Subnational Development in Africa The Quarterly Journal of Economics 129: Mitra, Reshmi. (2002). The Growth Pattern of Women-Run Enterprises: An Empirical Study in India Journal of Developmental Entrepreneurship. 26
28 Munshi, Kaivan. (2011). Strength in Numbers: Networks as a Solution to Occupational Traps Review of Economic Studies 78: Munshi, Kaivan and Mark Rosenzweig. (2006). Traditional Institutions Meet the Modern World: Caste, Gender, and Schooling in a Globalizing Economy American Economic Review 96: Naidu, Suresh. (2012). Suffrage, schooling and sorting in the post-bellum U.S. South NBER Working Paper Nguyen, T. (2008). Information, Role Models and Perceived Returns to Education: Experimental Evidence from Madagascar MIT Job Market Paper. Oster, E., & Millett, B. (2011). Do Call Centers Promote School Enrollment? Evidence from India Working paper. Pande, Rohini. (2003). Can Mandated Political Representation Provide Disadvantaged Minorities Policy Influence? Theory and Evidence from India American Economic Review 93: Pande, Rohini, and Deanna Ford. (2011). Gender Quotas and Female Leadership: A Review, Background Paper for the World Development Report on Gender. Pillania, Rajesh, Madhurima Lall, and Shikha Saha. (2010. Motives for Starting Business: Indian Women Entrepreneurs Perspectives International Journal of Indian Culture and Business Management 3: Powley, Elizabeth. (2007). Rwanda: The Impact of Women Legislators on Policy Outcomes Affecting Children and Families Background Paper for State of the World s Children, UNICEF. Schultz, T. Paul. (2001). Women s Roles in the Agricultural Household: Bargaining and Human Capital Investments in Agricultural and Resource Economics Handbook, B. Gardner and G. Rausser, Amsterdam: Elsevier Publishing. Shastry, Gauri Kartini (2010). "Human Capital Response to Globalization: Education and Information Technology in India," mimeo. Topalova, Petia, and Esther Duflo. (2004). Is There Discrimination Against Women in Politics? Evidence from India MIT Working Paper. United Nations. (2014). Millennium Development Goals. Available from: < [Accessed 11 March 2014]. United Nations. (2012). Michelle Bachelet Highlights Quotas to Accelerate Women s Political Participation. Available from: 27
29 < [Accessed 11 March 2014]. Verheul, Ingrid, André van Stel, and Roy Thurik. (2006). Explaining Female and Male Entrepreneurship at the Country Level Entrepreneurship and Regional Development 18: Washington, Ebonya. (2008). Female Socialization: How Daughters Affect Their Legislator Fathers' Voting on Women's Issues American Economic Review 98: World Bank. (2012). World Development Report 2012: Gender Equality and Development. Washington, DC. 28
30 Tables and Figures Table 1 Share of rural female non-attendees aged 5-24 reporting reason for dropping out Reason Child is not interested in studies Inability to cope or failure Parents not interested in studies Financial constraints Has to attend to other domestic activities Others Has to participate in other economic activities School is not near Has to look after sibling(s) Education is not considered useful Has to work for wage/salary No tradition in the family/community School atmosphere unfriendly Completed the desired level of school Awaiting admission to next level*.00 For helping in household enterprise**.01 Inadequate number of teachers**.00 Language at school unfamiliar**.00 Nonavailability of ladies' toilet**.00 Nonavailability of lady teacher**.00 Timing of educational institution not suitable**.00 Sources: Attending an Educational Institution in India, Its Level, Nature and Cost, NSS Report No. 439, 52nd Round (July 1995-June 1996); Author's calculations using NSS Round 64 ( ) Schedule Participation and Expenditure in Education. Notes: *response available only in Round 52 survey; **response available only in Round 64 survey.
31 Table 2 Mean enrollment rates in rural areas by social group, gender, age and year non-sc/st SC/ST Age Change Change Panel A: Male Panel B: Female Panel C: Female - Male enrollment gap Notes: Author's calculations using National Sample Survey data (various rounds). Enrollment rates are calculated as the mean across individuals of an indicator for usual principal activity reported as "attending an educational institution" for the age groups specified. Population estimates are constructed by weighting by the inverse sampling probability (sample weights) provided with the data.
32 Table 3 Cross-district variation in years of exposure to female district chairperson seat reservation, 2007 State Mean Std. Dev. Min. Max. Districts (N ) Andhra Pradesh Bihar Gujarat Haryana Kerala Maharashtra Orissa Punjab Rajasthan West Bengal Note: Author's calculations using data from Iyer et al. (2012).
33 Table 4 Baseline differences in household characteristics across districts, 1987 Variable Panel A: as observed 2007 exposure to Pradhan reservation Low ( 5 years) High (>5 years) High - Low Std. Err. N Enrollment [0/1]: non-sc/st, female (0.048) 6,807 Enrollment [0/1]: non-sc/st, male (0.038) 7,921 Enrollment [0/1]: SC/ST, female (0.051) 2,116 Enrollment [0/1]: SC/ST, male (0.047) 2,498 Mean per capita consumption, Rs (12.730) 19,279 Household size (0.161) 19,342 Female [0/1] (0.011) 19,342 SC/ST [0/1] (0.036) 19,342 Panel B: residuals after removing state fixed effects Enrollment [0/1]: non-sc/st, female (0.052) 6,807 Enrollment [0/1]: non-sc/st, male (0.042) 7,921 Enrollment [0/1]: SC/ST, female (0.056) 2,116 Enrollment [0/1]: SC/ST, male (0.058) 2,498 Mean per capita consumption, Rs (12.057) 19,279 Household size (0.170) 19,342 Female [0/1] (0.011) 19,342 SC/ST [0/1] (0.040) 19,342 Notes: Means and differences estimated by a univariate linear regression of individual characteristics on an indicator for "high" exposure status (as of 2007) on the 1987 individual-level cross-section. Heteroskedasticity-consistent robust standard errors clustered by district reported. Sample is comprised of individuals 9-17 years old in rural areas. Panel B removes state-level differences in both the "high exposure status" indicator and the outcome to account for differing mean district-level exposure across states arising from state implementation timing. Significance levels indicated by + <.10, ++ <.05, +++ <.01.
34 Panel A: Linear Table 5 Cumulative effect of chairperson reservation on enrollment rates within state, cross-district variation Dependent variable: individual enrollment [0/1] Sample: women men non-sc/st SC/ST non-sc/st SC/ST (1) (2) (3) (4) Exposure to chairperson reservations (years) (0.003) (0.005) (0.003) (0.005) adj. R Panel B: Differential effects Moderate (3-7 years) exposure to chairperson reservations (0.015) (0.025) (0.015) (0.024) High (>7 years) exposure to chairperson reservations (0.028) (0.038) (0.022) (0.041) adj. R N 10,170 4,275 11,399 4,994 Dependent variable mean Notes: Coefficients estimated by a linear probability model of an individual-level enrollment status indicator regressed on the level of exposure as of Panels contain coefficients from separate regressions estimated for the subsample indicated in the column header. Heteroskedasticity-consistent robust standard errors clustered by district reported in parentheses. Sample is comprised of individuals 9-17 years old in rural areas and observations are weighted by the provided sampling weight. All specifications contain an unreported constant term and state fixed effects. Panel A: Linear Table 6 Cumulative effect of chairperson reservation on enrollment rates cross-state border district variation Dependent variable: district pair enrollment rate differential Sample: women men non-sc/st SC/ST non-sc/st SC/ST (1) (2) (3) (4) Difference in exposure to chairperson reservations (years) (0.008) (0.014) (0.007) (0.012) Enrollment differential, (0.153) (0.237) (0.094) (0.190) adj. R Panel B: Differential effects Moderate difference in exposure to chairperson reservations (1-3 years) (0.031) (0.044) (0.018) (0.032) Large difference in exposure to chairperson reservations (>4 years) (0.032) (0.085) (0.050) (0.063) Enrollment differential, (0.181) (0.241) (0.096) (0.170) adj. R N Dependent variable mean Notes: Panels present coefficients from unweighted linear regressions of the differential enrollment rate in 2007 on the 2007 difference in policy exposure across district pairs lying across state borders. Columns contain coefficients from separate regressions estimated for the subsample indicated in the column header. Heteroskedasticity-consistent robust standard errors using two-way clustering reported in parentheses. Sample is comprised of individuals 9-17 years old in rural areas. All specifications contain an unreported constant term and two vectors of state fixed effects.
35 Table 7 Testing for differential trends in pre-policy enrollment rates Dependent variable: individual enrollment [0/1] Sample: women men non-sc/st SC/ST non-sc/st SC/ST (1) (2) (3) (4) Year ( ) ( ) ( ) ( ) Year*73rd CAA implementation year ( ) ( ) ( ) ( ) N 65,961 22,531 78,718 27,805 adj. R Notes: Table presents a test of differential pre-period trends estimated via a linear probability model regressing individual-level enrollment status of 9 to 17 year-olds in rural areas across three pre-intervention survey waves on a linear time trend and the time trend interacted with the state-level policy implementation year. Heteroskedasticity-consistent robust standard errors clustered by state reported in parentheses. All specifications include an unreported constant term and vectors of state fixed effects. Estimations are weighted by the provided sampling weight. Table 8 Summary statistics, cross-border estimation sample Variable Mean absolute difference Std. Dev. Min Max N Enrollment rate differential non-sc/st, female SC/ST, female non-sc/st, male SC/ST, male Enrollment rate differential non-sc/st, female SC/ST, female non-sc/st, male SC/ST, male Exposure gap, Combined population of district pair, , ,790 94,815 1,356, Notes: Table shows summary statistics calculated across district pairs lying across state borders. District-level enrollment rates calculated as the count of individuals reporting usual principal activity as "attending an educational institution" divided by the total population for the sample of 9 to 17 year-olds in rural areas. Mean absolute differences shown.
36 Panel A: Full sample Table 9 Estimation of school enrollment rates cross-state border district variation Dependent variable: district pair enrollment rate differential Sample: women men non-sc/st SC/ST non-sc/st SC/ST (1) (2) (3) (4) Exposure gap, 2007 (years) (0.002) (0.006) (0.003) (0.004) Enrollment differential, (0.044) (0.082) (0.042) (0.045) N adj. R Panel B: Ten-state sample Exposure gap, 2007 (years) (0.010) (0.013) (0.006) (0.006) Enrollment differential, (0.076) (0.205) (0.045) (0.162) N adj. R Panel C: IV estimates, full sample Exposure gap, 2007 (years) (0.002) (0.008) (0.004) (0.003) Enrollment differential, (0.044) (0.080) (0.042) (0.045) N adj. R Notes: Table presents coefficients from an unweighted linear regression of the differential enrollment rate in 2007 on the 2007 difference in policy exposure among neighboring districts lying across state borders. Underlying sample is comprised of 9-17 year-olds in rural areas. Enrollment rates are calculated using sample weights. Heteroskedasticity-consistent robust standard errors clustered by border reported in parentheses. All specifications include an unreported constant term. Results are robust to discretizing the main policy measure as in Table 6.
37 Table 10 Differences in schooling infrastructure and schooling environment cross-state border district variation Schools per total population Dependent variable: district pair differential in schooling infrastructure indicator Schools per New schools Share of Teachers per Share of schools population established per classrooms in pupil with girls' (rural) 000 population "good" lavatory condition Share teachers female (1) (2) (3) (4) (5) (6) (7) Implementation gap as of 2007 (years) (0.000) (0.000) (0.000) (0.006) (0.000) (0.010) (0.004) Enrollment differential, (0.000) (0.001) (0.000) (0.072) (0.006) (0.127) (0.064) N adj. R Notes: Table presents coefficients from an unweighted linear regression of the differential schooling infrastructure measure (indicated by column) in 2007 on the 2007 difference in policy exposure among neighboring districts lying across state borders. Heteroskedasticity-consistent robust standard errors clustered by border reported in parentheses. All specifications include an unreported constant term. Table 11 Salience of leaders via news media: Difference-in-differences estimates using the Times of India web archive ( ) Panchayats/ leaders Dependent variable: indicator for at least one word in topic set(s) found in article text School/ Women/ girls education Women/girls and Panchayats/ leaders School/ education and Panchayats/ leaders Women/ girls and school/ education (1) (2) (3) (4) (5) (6) Election year indicator (2.960) (4.197) (4.071) (0.861) (0.635) (2.728) N 244, , , , , ,462 adj. R Notes: Table presents coefficients from an unweighted linear probability model regressing an indicator for appearance of word related to the topics in column headers on an indicator for the state and year the article references holding Panchayat elections. Heteroskedasticity-consistent robust standard errors clustered by state reported in parentheses. All specifications include separate vectors of state and year fixed effects and an unreported constant term.
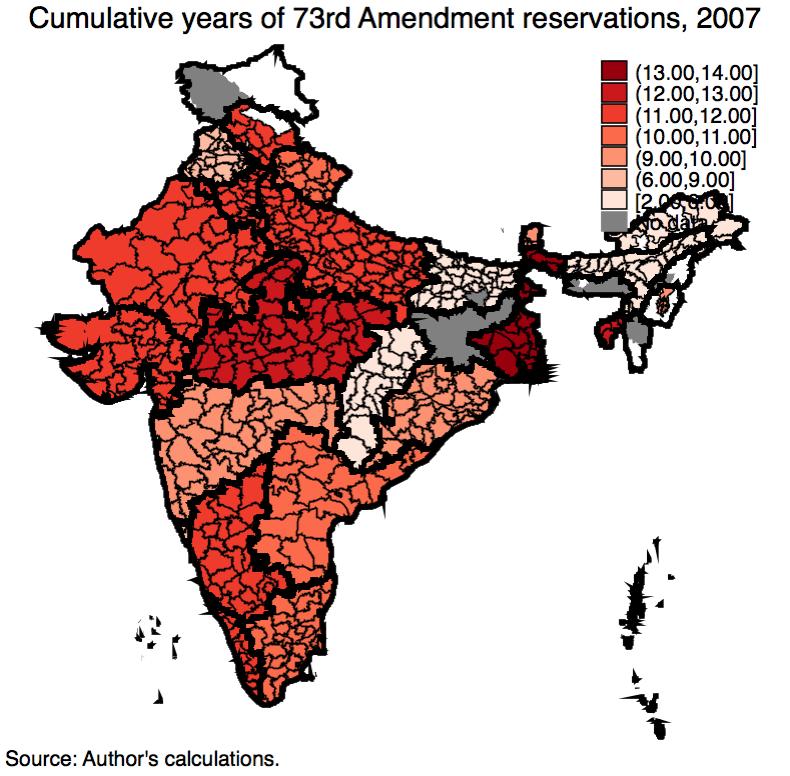
38 Figure 1
39 Figure 2
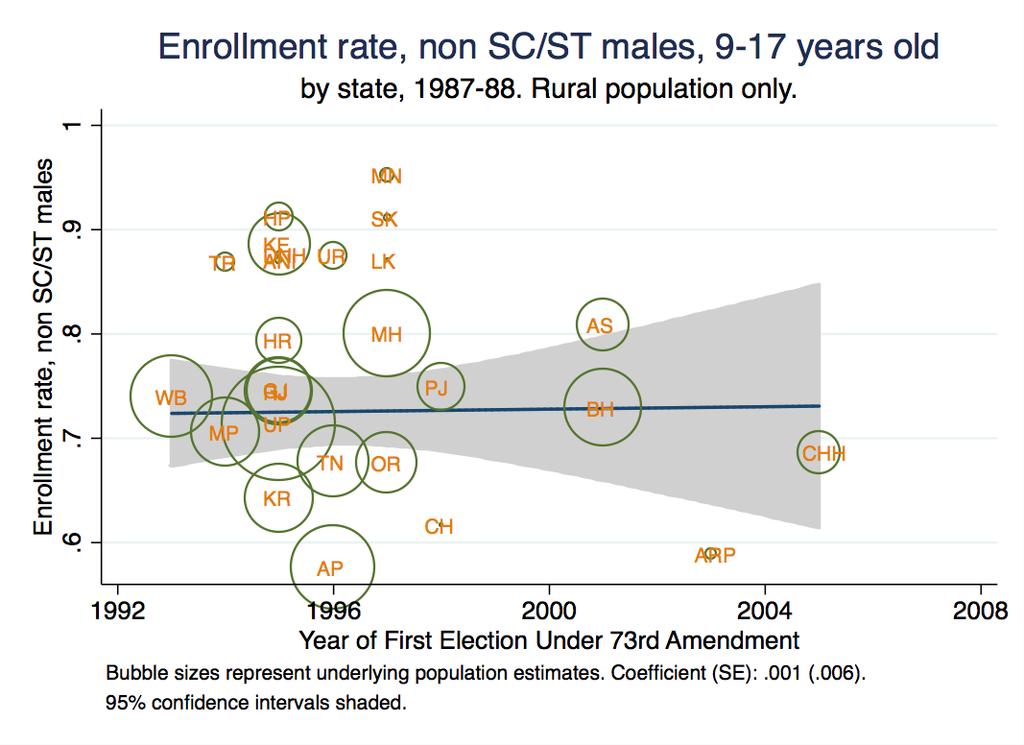
40 Figure 3
41 Figure 4
42 Figure 5
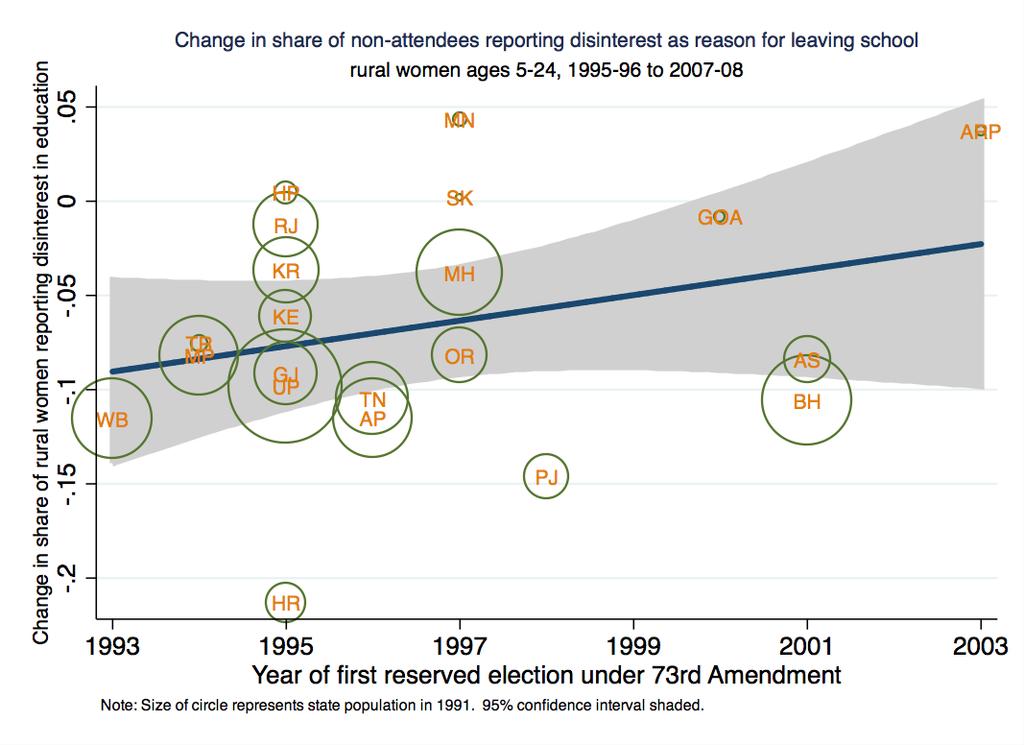
43 Figure 6
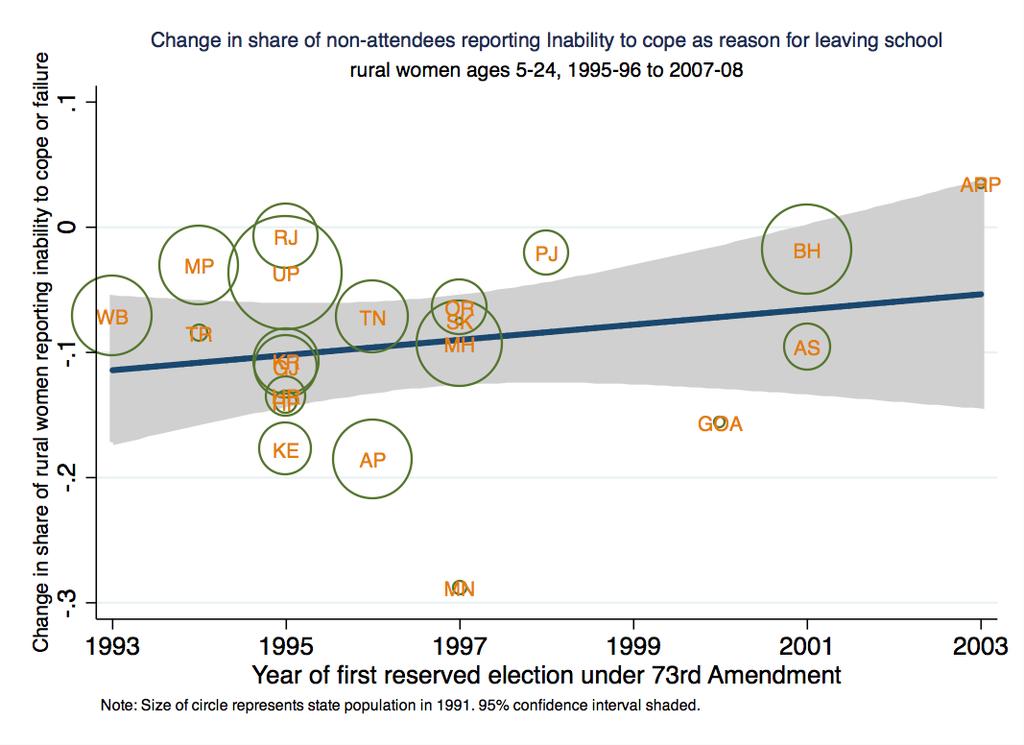
44 Figure 7
 is contiguous with four districts in Maharashtra.")
45 Appendix A: Construction of the border dataset Since borders do not sit at square angles with only a single neighbor on each side, it was necessary to incorporate (and correct for) districts that have multiple contiguous cross-border neighbors. In the example below, district Adilabad (Andhra Pradesh) is contiguous with four districts in Maharashtra. Map of the Andhra Pradesh - Maharashtra border at District Adilabad, AP In the border district dataset, this would result in four separate observations, one for each pair of contiguous neighbors. In estimations, these four observations would be clustered together for standard error calculations. Given that it may also be the case that the second district (in a given Appendix 1
Political Inclusion and Educational Investment
 City University of New York (CUNY) CUNY Academic Works Economics Working Papers CUNY Academic Works 2015 Political Inclusion and Educational Investment Stephen D. O'Connell CUNY Graduate Center Follow
NBER WORKING PAPER SERIES POLITICAL RESERVATIONS AND WOMEN S ENTREPRENEURSHIP IN INDIA. Ejaz Ghani William R. Kerr Stephen D.
 NBER WORKING PAPER SERIES POLITICAL RESERVATIONS AND WOMEN S ENTREPRENEURSHIP IN INDIA Ejaz Ghani William R. Kerr Stephen D. O'Connell Working Paper 19868 http://www.nber.org/papers/w19868 NATIONAL BUREAU
Political Reservation and Substantive Representation: Evidence from Indian Panchayats
 Political Reservation and Substantive Representation: Evidence from Indian Panchayats Esther Duflo (based on joint work with Lori Beaman, Raghabendra Chattopadhyay, Rohini Pande and Petia Topalova October
Political Reservations and Women s Entrepreneurship in India
 Public Disclosure Authorized Policy Research Working Paper 6307 WPS6307 Public Disclosure Authorized Public Disclosure Authorized Political Reservations and Women s Entrepreneurship in India Ejaz Ghani
Women as Policy Makers: Evidence from a Randomized Policy Experiment in India
 Women as Policy Makers: Evidence from a Randomized Policy Experiment in India Chattopadhayay and Duflo (Econometrica 2004) Presented by Nicolas Guida Johnson and Ngoc Nguyen Nov 8, 2018 Introduction Research
Women s Education and Women s Political Participation
 2014/ED/EFA/MRT/PI/23 Background paper prepared for the Education for All Global Monitoring Report 2013/4 Teaching and learning: Achieving quality for all Women s Education and Women s Political Participation
Are Female Leaders Good for Education? Evidence from India.
 Are Female Leaders Good for Education? Evidence from India. Irma Clots-Figueras Department of Economics, London School of Economics JOB MARKET PAPER October 2005 Abstract This paper studies the impact
Can Quotas Increase the Supply of Candidates for Higher-Level Positions? Evidence from Local Government in India
 DISCUSSION PAPER SERIES IZA DP No. 11286 Can Quotas Increase the Supply of Candidates for Higher-Level Positions? Evidence from Local Government in India Stephen D. O Connell JANUARY 2018 DISCUSSION PAPER
Does Political Reservation for Minorities Affect Child Labor? Evidence from India. Elizabeth Kaletski University of Connecticut
 Does Political Reservation for Minorities Affect Child Labor? Evidence from India Elizabeth Kaletski University of Connecticut Nishith Prakash University of Connecticut Working Paper 2014-12 May 2014 365
Immigrant Legalization
 Technical Appendices Immigrant Legalization Assessing the Labor Market Effects Laura Hill Magnus Lofstrom Joseph Hayes Contents Appendix A. Data from the 2003 New Immigrant Survey Appendix B. Measuring
Gender preference and age at arrival among Asian immigrant women to the US
 Gender preference and age at arrival among Asian immigrant women to the US Ben Ost a and Eva Dziadula b a Department of Economics, University of Illinois at Chicago, 601 South Morgan UH718 M/C144 Chicago,
Women and Power: Unpopular, Unwilling, or Held Back? Comment
 Women and Power: Unpopular, Unwilling, or Held Back? Comment Manuel Bagues, Pamela Campa May 22, 2017 Abstract Casas-Arce and Saiz (2015) study how gender quotas in candidate lists affect voting behavior
GUIDE 1: WOMEN AS POLICYMAKERS
 GUIDE 1: WOMEN AS POLICYMAKERS Thinking about measurement and outcomes This case study is based on Women as Policy Makers: Evidence from a Randomized Policy Experiment in India, by Raghabendra Chattopadhyay
Table A.2 reports the complete set of estimates of equation (1). We distinguish between personal
. We distinguish between personal") Akay, Bargain and Zimmermann Online Appendix 40 A. Online Appendix A.1. Descriptive Statistics Figure A.1 about here Table A.1 about here A.2. Detailed SWB Estimates Table A.2 reports the complete set
Akay, Bargain and Zimmermann Online Appendix 40 A. Online Appendix A.1. Descriptive Statistics Figure A.1 about here Table A.1 about here A.2. Detailed SWB Estimates Table A.2 reports the complete set
International Migration and Gender Discrimination among Children Left Behind. Francisca M. Antman* University of Colorado at Boulder
 International Migration and Gender Discrimination among Children Left Behind Francisca M. Antman* University of Colorado at Boulder ABSTRACT: This paper considers how international migration of the head
GEORG-AUGUST-UNIVERSITÄT GÖTTINGEN
 GEORG-AUGUST-UNIVERSITÄT GÖTTINGEN FACULTY OF ECONOMIC SCIENCES CHAIR OF MACROECONOMICS AND DEVELOPMENT Bachelor Seminar Economics of the very long run: Economics of Islam Summer semester 2017 Does Secular
The Redistributive Effects of Political Reservation for Minorities: Evidence from India
 The Redistributive Effects of Political Reservation for Minorities: Evidence from India Aimee Chin 1 and Nishith Prakash 2, 3 This Draft: February 2009 Abstract We examine the impact of political reservation
NBER WORKING PAPER SERIES THE REDISTRIBUTIVE EFFECTS OF POLITICAL RESERVATION FOR MINORITIES: EVIDENCE FROM INDIA. Aimee Chin Nishith Prakash
 NBER WORKING PAPER SERIES THE REDISTRIBUTIVE EFFECTS OF POLITICAL RESERVATION FOR MINORITIES: EVIDENCE FROM INDIA Aimee Chin Nishith Prakash Working Paper 16509 http://www.nber.org/papers/w16509 NATIONAL
Parental Response to Changes in Return to Education for Children: The Case of Mexico. Kaveh Majlesi. October 2012 PRELIMINARY-DO NOT CITE
 Parental Response to Changes in Return to Education for Children: The Case of Mexico Kaveh Majlesi October 2012 PRELIMINARY-DO NOT CITE Abstract Previous research has shown that school enrollment in developing
Schooling and Cohort Size: Evidence from Vietnam, Thailand, Iran and Cambodia. Evangelos M. Falaris University of Delaware. and
 Schooling and Cohort Size: Evidence from Vietnam, Thailand, Iran and Cambodia by Evangelos M. Falaris University of Delaware and Thuan Q. Thai Max Planck Institute for Demographic Research March 2012 2
International Institute for Population Sciences, Mumbai (INDIA)
") Kunal Keshri (kunalkeshri.lrd@gmail.com) (Senior Research Fellow, e-mail:) Dr. R. B. Bhagat (Professor & Head, Dept. of Migration and Urban Studies) International Institute for Population Sciences, Mumbai
Kunal Keshri (kunalkeshri.lrd@gmail.com) (Senior Research Fellow, e-mail:) Dr. R. B. Bhagat (Professor & Head, Dept. of Migration and Urban Studies) International Institute for Population Sciences, Mumbai
Path-Breakers: How Does Women s Political Participation Respond to Electoral Success? *
 Path-Breakers: How Does Women s Political Participation Respond to Electoral Success? * Sonia Bhalotra University of Bristol Irma Clots-Figueras Universidad Carlos III de Madrid Lakshmi Iyer Harvard Business
Narrative I Attitudes towards Community and Perceived Sense of Fraternity
 1 Narrative I Attitudes towards Community and Perceived Sense of Fraternity One of three themes covered by the Lok Survey Project is attitude towards community, fraternity and the nature of solidarity
The Impact of Unionization on the Wage of Hispanic Workers. Cinzia Rienzo and Carlos Vargas-Silva * This Version, May 2015.
 The Impact of Unionization on the Wage of Hispanic Workers Cinzia Rienzo and Carlos Vargas-Silva * This Version, May 2015 Abstract This paper explores the role of unionization on the wages of Hispanic
On Adverse Sex Ratios in Some Indian States: A Note
 CENTRE FOR ECONOMIC REFORM AND TRANSFORMATION School of Management and Languages, Heriot-Watt University, Edinburgh, EH14 4AS Tel: 0131 451 4207 Fax: 0131 451 3498 email: ecocert@hw.ac.uk World-Wide Web:
Effect of Political Decentralization and Female Leadership on Institutional Births and Child Mortality in Rural Bihar, India
 Discussion Paper Series IZA DP No. 10780 Effect of Political Decentralization and Female Leadership on Institutional Births and Child Mortality in Rural Bihar, India Santosh Kumar Nishith Prakash may 2017
Skilled Immigration and the Employment Structures of US Firms
 Skilled Immigration and the Employment Structures of US Firms Sari Kerr William Kerr William Lincoln 1 / 56 Disclaimer: Any opinions and conclusions expressed herein are those of the authors and do not
Incumbency as a Source of Spillover Effects in Mixed Electoral Systems: Evidence from a Regression-Discontinuity Design.
 Incumbency as a Source of Spillover Effects in Mixed Electoral Systems: Evidence from a Regression-Discontinuity Design Forthcoming, Electoral Studies Web Supplement Jens Hainmueller Holger Lutz Kern September
Immigrant Employment and Earnings Growth in Canada and the U.S.: Evidence from Longitudinal data
 Immigrant Employment and Earnings Growth in Canada and the U.S.: Evidence from Longitudinal data Neeraj Kaushal, Columbia University Yao Lu, Columbia University Nicole Denier, McGill University Julia Wang,
The Impact of Unionization on the Wage of Hispanic Workers. Cinzia Rienzo and Carlos Vargas-Silva * This Version, December 2014.
 The Impact of Unionization on the Wage of Hispanic Workers Cinzia Rienzo and Carlos Vargas-Silva * This Version, December 2014 Abstract This paper explores the role of unionization on the wages of Hispanic
Openness and Poverty Reduction in the Long and Short Run. Mark R. Rosenzweig. Harvard University. October 2003
 Openness and Poverty Reduction in the Long and Short Run Mark R. Rosenzweig Harvard University October 2003 Prepared for the Conference on The Future of Globalization Yale University. October 10-11, 2003
Efficiency Consequences of Affirmative Action in Politics Evidence from India
 Efficiency Consequences of Affirmative Action in Politics Evidence from India Sabyasachi Das, Ashoka University Abhiroop Mukhopadhyay, ISI Delhi* Rajas Saroy, ISI Delhi Affirmative Action 0 Motivation
Immigration and Internal Mobility in Canada Appendices A and B. Appendix A: Two-step Instrumentation strategy: Procedure and detailed results
 Immigration and Internal Mobility in Canada Appendices A and B by Michel Beine and Serge Coulombe This version: February 2016 Appendix A: Two-step Instrumentation strategy: Procedure and detailed results
Tribal Women Experiencing Panchayati Raj Institution in India with Special Reference to Arunachal Pradesh
 IOSR Journal Of Humanities And Social Science (IOSR-JHSS) Volume 22, Issue 1, Ver. 2 (January 2017) PP 46-50 e-issn: 2279-0837, p-issn: 2279-0845. www.iosrjournals.org Tribal Women Experiencing Panchayati
Labor Market Dropouts and Trends in the Wages of Black and White Men
 Industrial & Labor Relations Review Volume 56 Number 4 Article 5 2003 Labor Market Dropouts and Trends in the Wages of Black and White Men Chinhui Juhn University of Houston Recommended Citation Juhn,
Subhasish Dey, University of York Kunal Sen,University of Manchester & UNU-WIDER NDCDE, 2018, UNU-WIDER, Helsinki 12 th June 2018
 Do Political Parties Practise Partisan Alignment in Social Welfare Spending? Evidence from Village Council Elections in India Subhasish Dey, University of York Kunal Sen,University of Manchester & UNU-WIDER
Working Paper. Why So Few Women in Poli/cs? Evidence from India. Mudit Kapoor Shamika Ravi. July 2014
 Working Paper Why So Few Women in Poli/cs? Evidence from India Mudit Kapoor Shamika Ravi July 2014 Brookings Ins8tu8on India Center, 2014 Why So Few Women in Politics? Evidence from India Mudit Kapoor
SDG-10: Reduce inequalities within the States
 SDG-10: Reduce inequalities within the States 10.1 Empirical evidence using cross-country income data - the most recent and comprehesive covering 121 countries between 1967 and 2011- concludes that the
Cleavages in Public Preferences about Globalization
 3 Cleavages in Public Preferences about Globalization Given the evidence presented in chapter 2 on preferences about globalization policies, an important question to explore is whether any opinion cleavages
Publicizing malfeasance:
 Publicizing malfeasance: When media facilitates electoral accountability in Mexico Horacio Larreguy, John Marshall and James Snyder Harvard University May 1, 2015 Introduction Elections are key for political
Appendix for Citizen Preferences and Public Goods: Comparing. Preferences for Foreign Aid and Government Programs in Uganda
 Appendix for Citizen Preferences and Public Goods: Comparing Preferences for Foreign Aid and Government Programs in Uganda Helen V. Milner, Daniel L. Nielson, and Michael G. Findley Contents Appendix for
Determinants of Return Migration to Mexico Among Mexicans in the United States
 Determinants of Return Migration to Mexico Among Mexicans in the United States J. Cristobal Ruiz-Tagle * Rebeca Wong 1.- Introduction The wellbeing of the U.S. population will increasingly reflect the
Volume 35, Issue 1. An examination of the effect of immigration on income inequality: A Gini index approach
 Volume 35, Issue 1 An examination of the effect of immigration on income inequality: A Gini index approach Brian Hibbs Indiana University South Bend Gihoon Hong Indiana University South Bend Abstract This
Role of Women in local governance for the Development of Girls education case study from India
 Role of Women in local governance for the Development of Girls education case study from India YAZALI, Josephine, Professeure associée, Inde at International colloquim on gender and governance(17-19 2009)
Education, Women's Empowerment and Political Selection. November 2015 Preliminary. Duha T. Altindag Auburn University
 Education, Women's Empowerment and Political Selection November 2015 Preliminary Duha T. Altindag Auburn University altindag@auburn.edu Naci Mocan Louisiana State University, NBER, IZA mocan@lsu.edu Abstract:
The Effect of Immigrant Student Concentration on Native Test Scores
 The Effect of Immigrant Student Concentration on Native Test Scores Evidence from European Schools By: Sanne Lin Study: IBEB Date: 7 Juli 2018 Supervisor: Matthijs Oosterveen This paper investigates the
Corruption, Political Instability and Firm-Level Export Decisions. Kul Kapri 1 Rowan University. August 2018
 Corruption, Political Instability and Firm-Level Export Decisions Kul Kapri 1 Rowan University August 2018 Abstract In this paper I use South Asian firm-level data to examine whether the impact of corruption
Preliminary Effects of Oversampling on the National Crime Victimization Survey
 Preliminary Effects of Oversampling on the National Crime Victimization Survey Katrina Washington, Barbara Blass and Karen King U.S. Census Bureau, Washington D.C. 20233 Note: This report is released to
Path-Breakers: How Does Women s Political Participation Respond to Electoral Success? *
 Path-Breakers: How Does Women s Political Participation Respond to Electoral Success? * Sonia Bhalotra University of Bristol Irma Clots-Figueras Universidad Carlos III de Madrid Lakshmi Iyer Harvard Business
Online Appendix: Conceptualization and Measurement of Party System Nationalization in Multilevel Electoral Systems
 Online Appendix: Conceptualization and Measurement of Party System Nationalization in Multilevel Electoral Systems Schakel, Arjan H. and Swenden, Wilfried (2016) Rethinking Party System Nationalization
Do Parties Matter for Fiscal Policy Choices? A Regression-Discontinuity Approach
 Do Parties Matter for Fiscal Policy Choices? A Regression-Discontinuity Approach Per Pettersson-Lidbom First version: May 1, 2001 This version: July 3, 2003 Abstract This paper presents a method for measuring
Unequal Recovery, Labor Market Polarization, Race, and 2016 U.S. Presidential Election. Maoyong Fan and Anita Alves Pena 1
 Unequal Recovery, Labor Market Polarization, Race, and 2016 U.S. Presidential Election Maoyong Fan and Anita Alves Pena 1 Abstract: Growing income inequality and labor market polarization and increasing
Differential effects of graduating during a recession across gender and race
 Kondo IZA Journal of Labor Economics (2015) 4:23 DOI 10.1186/s40172-015-0040-6 ORIGINAL ARTICLE Differential effects of graduating during a recession across gender and race Ayako Kondo Open Access Correspondence:
WomenasPolicyMakers:Evidencefroma Randomized Policy Experiment in India 1
 WomenasPolicyMakers:Evidencefroma Randomized Policy Experiment in India 1 by Raghabendra Chattopadhyay and Esther Duflo Abstract This paper uses political reservations for women in India to study the impact
Remittances and Poverty. in Guatemala* Richard H. Adams, Jr. Development Research Group (DECRG) MSN MC World Bank.
 MSN MC World Bank.") Public Disclosure Authorized Public Disclosure Authorized Public Disclosure Authorized Public Disclosure Authorized Remittances and Poverty in Guatemala* Richard H. Adams, Jr. Development Research Group
Public Disclosure Authorized Public Disclosure Authorized Public Disclosure Authorized Public Disclosure Authorized Remittances and Poverty in Guatemala* Richard H. Adams, Jr. Development Research Group
Female Migration for Non-Marital Purposes: Understanding Social and Demographic Correlates of Barriers
 Female Migration for Non-Marital Purposes: Understanding Social and Demographic Correlates of Barriers Dr. Mala Mukherjee Assistant Professor Indian Institute of Dalit Studies New Delhi India Introduction
Inequality in Housing and Basic Amenities in India
 MPRA Munich Personal RePEc Archive Inequality in Housing and Basic Amenities in India Rama Pal and Neil Aneja and Dhruv Nagpal Indian Institute of Technology Bobmay, Indian Institute of Technology Bobmay,
The impact of parents years since migration on children s academic achievement
 Nielsen and Rangvid IZA Journal of Migration 2012, 1:6 ORIGINAL ARTICLE Open Access The impact of parents years since migration on children s academic achievement Helena Skyt Nielsen 1* and Beatrice Schindler
PANCHAYATI RAJ AND POVERTY ALLEVIATION IN WEST BENGAL: SUMMARY OF RESEARCH FINDINGS. Pranab Bardhan and Dilip Mookherjee.
 PANCHAYATI RAJ AND POVERTY ALLEVIATION IN WEST BENGAL: SUMMARY OF RESEARCH FINDINGS Pranab Bardhan and Dilip Mookherjee December 2005 The experience of West Bengal with respect to Panchayat Raj has been
Returns to Education in the Albanian Labor Market
 Returns to Education in the Albanian Labor Market Dr. Juna Miluka Department of Economics and Finance, University of New York Tirana, Albania Abstract The issue of private returns to education has received
Voting Technology, Political Responsiveness, and Infant Health: Evidence from Brazil
 Voting Technology, Political Responsiveness, and Infant Health: Evidence from Brazil Thomas Fujiwara Princeton University Place Date Motivation Why are public services in developing countries so inadequate?
Research Report. How Does Trade Liberalization Affect Racial and Gender Identity in Employment? Evidence from PostApartheid South Africa
 International Affairs Program Research Report How Does Trade Liberalization Affect Racial and Gender Identity in Employment? Evidence from PostApartheid South Africa Report Prepared by Bilge Erten Assistant
Case Study on Youth Issues: Philippines
 Case Study on Youth Issues: Philippines Introduction The Philippines has one of the largest populations of the ASEAN member states, with 105 million inhabitants, surpassed only by Indonesia. It also has
Human Development Indices and Indicators: 2018 Statistical Update. Pakistan
 Human Development Indices and Indicators: 2018 Statistical Update Briefing note for countries on the 2018 Statistical Update Introduction Pakistan This briefing note is organized into ten sections. The
Political participation and Women Empowerment in India
 Political participation and Women Empowerment in India Dr Satyavrat Singh Rawat Associate Professor, Department of Economics NREC College Khurja Abstract Political participation is a mechanism which enables
Can Elected Minority Representatives Affect Health Worker Visits? Evidence from India. Elizabeth Kaletski University of Connecticut
 Can Elected Minority Representatives Affect Health Worker Visits? Evidence from India Elizabeth Kaletski University of Connecticut Nishith Prakash University of Connecticut Working Paper 2014-19 August
Issues in Political Economy, Vol 22, 2013, 56-76
 Issues in Political Economy, Vol 22, 2013, 56-76 Reservation Policy and Criminal Behavior in India: The Link Between Political Reservation and Atrocities Against Scheduled Castes and Tribes Raahil Madhok,
Levels and Dynamics of Inequality in India: Filling in the blanks
 Levels and Dynamics of Inequality in India: Filling in the blanks Peter Lanjouw (Vrije University Amsterdam) Summary of Findings from the India Component of the UNU-WIDER Inequality in the Giants Project
Perspective on Forced Migration in India: An Insight into Classed Vulnerability
 Perspective on in India: An Insight into Classed Vulnerability By Protap Mukherjee* and Lopamudra Ray Saraswati* *Ph.D. Scholars Population Studies Division Centre for the Study of Regional Development
B R E A D Working Paper
 Can Mandated Political Representation Increase Policy Influence for Disadvantaged Minorities? Theory and Evidence from India Rohini Pande BREAD Working Paper No. 024 April 2003 Copyright 2003 Rohini Pande
Model of Voting. February 15, Abstract. This paper uses United States congressional district level data to identify how incumbency,
 U.S. Congressional Vote Empirics: A Discrete Choice Model of Voting Kyle Kretschman The University of Texas Austin kyle.kretschman@mail.utexas.edu Nick Mastronardi United States Air Force Academy nickmastronardi@gmail.com
Cross-State Differences in the Minimum Wage and Out-of-state Commuting by Low-Wage Workers* Terra McKinnish University of Colorado Boulder and IZA
 Cross-State Differences in the Minimum Wage and Out-of-state Commuting by Low-Wage Workers* Terra McKinnish University of Colorado Boulder and IZA Abstract The 2009 federal minimum wage increase, which
Pathbreakers? Women's Electoral Success and Future Political Participation
 Pathbreakers? Women's Electoral Success and Future Political Participation Sonia Bhalotra, University of Essex Irma Clots-Figueras, Universidad Carlos III de Madrid Lakshmi Iyer, University of Notre Dame
BJP s Demographic Dividend in the 2014 General Elections: An Empirical Analysis ±
 BJP s Demographic Dividend in the 2014 General Elections: An Empirical Analysis ± Deepankar Basu and Kartik Misra! [Published in Economic and Political Weekly, Vol. 50, No. 3] 1. Introduction In the 2014
Executive summary. Part I. Major trends in wages
 Executive summary Part I. Major trends in wages Lowest wage growth globally in 2017 since 2008 Global wage growth in 2017 was not only lower than in 2016, but fell to its lowest growth rate since 2008,
Immigration and Multiculturalism: Views from a Multicultural Prairie City
 Immigration and Multiculturalism: Views from a Multicultural Prairie City Paul Gingrich Department of Sociology and Social Studies University of Regina Paper presented at the annual meeting of the Canadian
Cohort Effects in the Educational Attainment of Second Generation Immigrants in Germany: An Analysis of Census Data
 Cohort Effects in the Educational Attainment of Second Generation Immigrants in Germany: An Analysis of Census Data Regina T. Riphahn University of Basel CEPR - London IZA - Bonn February 2002 Even though
Wage Structure and Gender Earnings Differentials in China and. India*
 Wage Structure and Gender Earnings Differentials in China and India* Jong-Wha Lee # Korea University Dainn Wie * National Graduate Institute for Policy Studies September 2015 * Lee: Economics Department,
IS THE MEASURED BLACK-WHITE WAGE GAP AMONG WOMEN TOO SMALL? Derek Neal University of Wisconsin Presented Nov 6, 2000 PRELIMINARY
 IS THE MEASURED BLACK-WHITE WAGE GAP AMONG WOMEN TOO SMALL? Derek Neal University of Wisconsin Presented Nov 6, 2000 PRELIMINARY Over twenty years ago, Butler and Heckman (1977) raised the possibility
Benefit levels and US immigrants welfare receipts
 1 Benefit levels and US immigrants welfare receipts 1970 1990 by Joakim Ruist Department of Economics University of Gothenburg Box 640 40530 Gothenburg, Sweden joakim.ruist@economics.gu.se telephone: +46
Entry, Exit and Candidate Selection: Evidence from India
 Entry, Exit and Candidate Selection: Evidence from India Abhijit V Banerjee Esther Duflo Clement Imbert Rohini Pande October 28, 2016 Keywords: JEL: Abstract What motivates candidates to run in low income
This analysis confirms other recent research showing a dramatic increase in the education level of newly
 CENTER FOR IMMIGRATION STUDIES April 2018 Better Educated, but Not Better Off A look at the education level and socioeconomic success of recent immigrants, to By Steven A. Camarota and Karen Zeigler This
ANNUAL SURVEY REPORT: BELARUS
 ANNUAL SURVEY REPORT: BELARUS 2 nd Wave (Spring 2017) OPEN Neighbourhood Communicating for a stronger partnership: connecting with citizens across the Eastern Neighbourhood June 2017 1/44 TABLE OF CONTENTS
Does Political Reservation Affect Voting Behavior? Empirical Evidence from India
 PRIMCED Discussion Paper Series, No. 17 Does Political Reservation Affect Voting Behavior? Empirical Evidence from India Yuko Mori and Takashi Kurosaki September 2011 Research Project PRIMCED Institute
An Analysis of Rural to Urban Labour Migration in India with Special Reference to Scheduled Castes and Schedules Tribes
 International Journal of Interdisciplinary and Multidisciplinary Studies (IJIMS), 2015, Vol 2, No.10,53-58. 53 Available online at http://www.ijims.com ISSN: 2348 0343 An Analysis of Rural to Urban Labour
Women Empowerment through Panchayati Raj Institutions: A Case Study
 Journal of Studies in Social Sciences and Humanities http://www.jssshonline.com/ Volume 2, No. 3, 2016, 115-120 ISSN: 2413-9270 Women Empowerment through Panchayati Raj Institutions: A Case Study Dr Y.
II. Roma Poverty and Welfare in Serbia and Montenegro
 II. Poverty and Welfare in Serbia and Montenegro 10. Poverty has many dimensions including income poverty and non-income poverty, with non-income poverty affecting for example an individual s education,
Don t Touch My Road. Evidence from India on Affirmative Action and Everyday Discrimination
 Don t Touch My Road. Evidence from India on Affirmative Action and Everyday Discrimination VICTOIRE GIRARD October 2016 Abstract This article investigates whether affirmative action, in the form of electoral
Violence and the labor supply of married women in India
 Violence and the labor supply of married women in India Zahra Siddique May 1, 2018 Abstract This paper examines whether fear and safety concerns have an impact on behavior such as female labor supply in
High Technology Agglomeration and Gender Inequalities
 High Technology Agglomeration and Gender Inequalities By Elsie Echeverri-Carroll and Sofia G Ayala * The high-tech boom of the last two decades overlapped with increasing wage inequalities between men
 Original citation: Iyer, Lakshmi, Mani, Anandi, Mishra, Prachi and Topalova, Petia (2011) The power of political voice : women's political representation and crime in India. Working Paper. Coventry, UK:
FOREIGN FIRMS AND INDONESIAN MANUFACTURING WAGES: AN ANALYSIS WITH PANEL DATA
 FOREIGN FIRMS AND INDONESIAN MANUFACTURING WAGES: AN ANALYSIS WITH PANEL DATA by Robert E. Lipsey & Fredrik Sjöholm Working Paper 166 December 2002 Postal address: P.O. Box 6501, S-113 83 Stockholm, Sweden.
The Poor in the Indian Labour Force in the 1990s. Working Paper No. 128
 CDE September, 2004 The Poor in the Indian Labour Force in the 1990s K. SUNDARAM Email: sundaram@econdse.org SURESH D. TENDULKAR Email: suresh@econdse.org Delhi School of Economics Working Paper No. 128
On the Causes and Consequences of Ballot Order Effects
 Polit Behav (2013) 35:175 197 DOI 10.1007/s11109-011-9189-2 ORIGINAL PAPER On the Causes and Consequences of Ballot Order Effects Marc Meredith Yuval Salant Published online: 6 January 2012 Ó Springer
Telephone Survey. Contents *
 Telephone Survey Contents * Tables... 2 Figures... 2 Introduction... 4 Survey Questionnaire... 4 Sampling Methods... 5 Study Population... 5 Sample Size... 6 Survey Procedures... 6 Data Analysis Method...
Prospects for Immigrant-Native Wealth Assimilation: Evidence from Financial Market Participation. Una Okonkwo Osili 1 Anna Paulson 2
 Prospects for Immigrant-Native Wealth Assimilation: Evidence from Financial Market Participation Una Okonkwo Osili 1 Anna Paulson 2 1 Contact Information: Department of Economics, Indiana University Purdue
Human Development Indices and Indicators: 2018 Statistical Update. Cambodia
 Human Development Indices and Indicators: 2018 Statistical Update Briefing note for countries on the 2018 Statistical Update Introduction Cambodia This briefing note is organized into ten sections. The
Human Development Indices and Indicators: 2018 Statistical Update. Indonesia
 Human Development Indices and Indicators: 2018 Statistical Update Briefing note for countries on the 2018 Statistical Update Introduction Indonesia This briefing note is organized into ten sections. The
Outsourcing Household Production: Effects of Foreign Domestic Helpers on Native Labor Supply in Hong Kong
 Outsourcing Household Production: Effects of Foreign Domestic Helpers on Native Labor Supply in Hong Kong Patricia Cortes Jessica Pan University of Chicago Graduate School of Business October 31, 2008
Latin American Immigration in the United States: Is There Wage Assimilation Across the Wage Distribution?
 Latin American Immigration in the United States: Is There Wage Assimilation Across the Wage Distribution? Catalina Franco Abstract This paper estimates wage differentials between Latin American immigrant