The Three Elephants in the Room: Coal, Oil and Gas in the Primary Energy Consumption (PEC) and their CO2 Emissions up to 2013 Bernard CHABOT
|
|
|
- Jacob Hampton
- 6 years ago
- Views:
Transcription
1 The Three Elephants in the Room: Coal, Oil and Gas in the Primary Energy Consumption (PEC) and their CO2 Emissions up to 2013 Bernard CHABOT Renewable Energy Consultant and Trainer BCCONSULT, Garbejaire B107, VALBONE, France 1
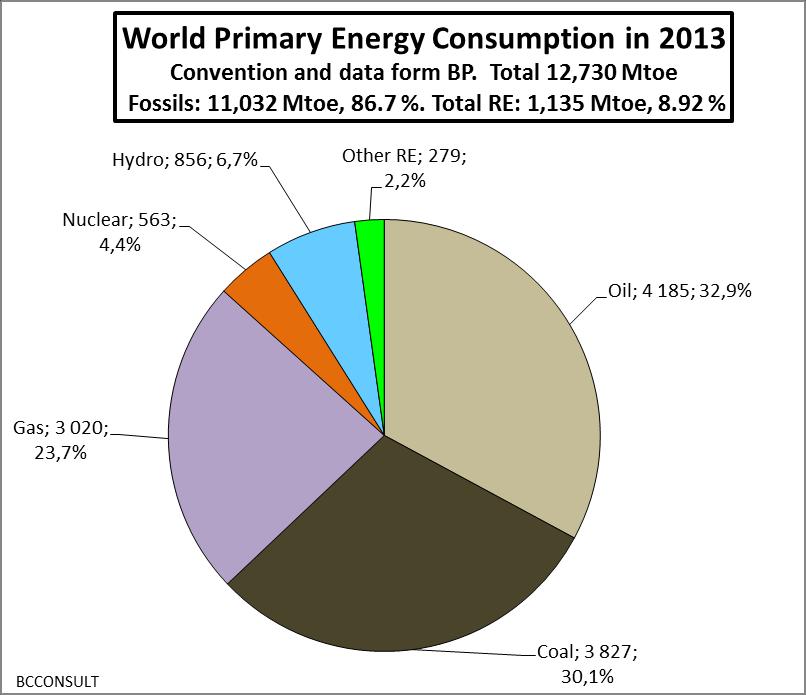
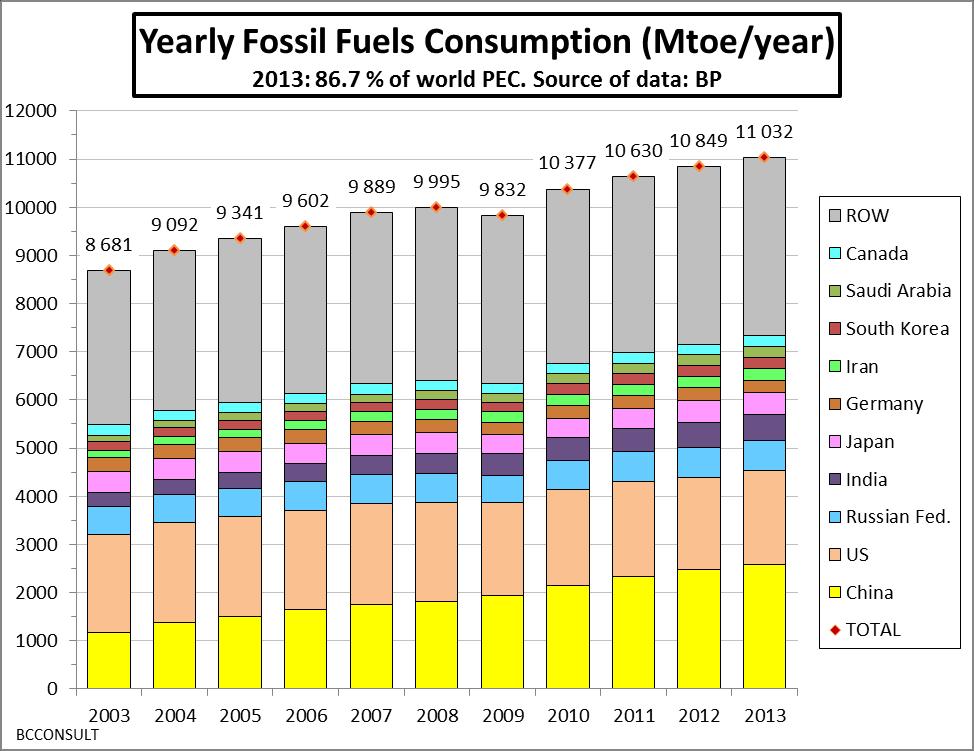
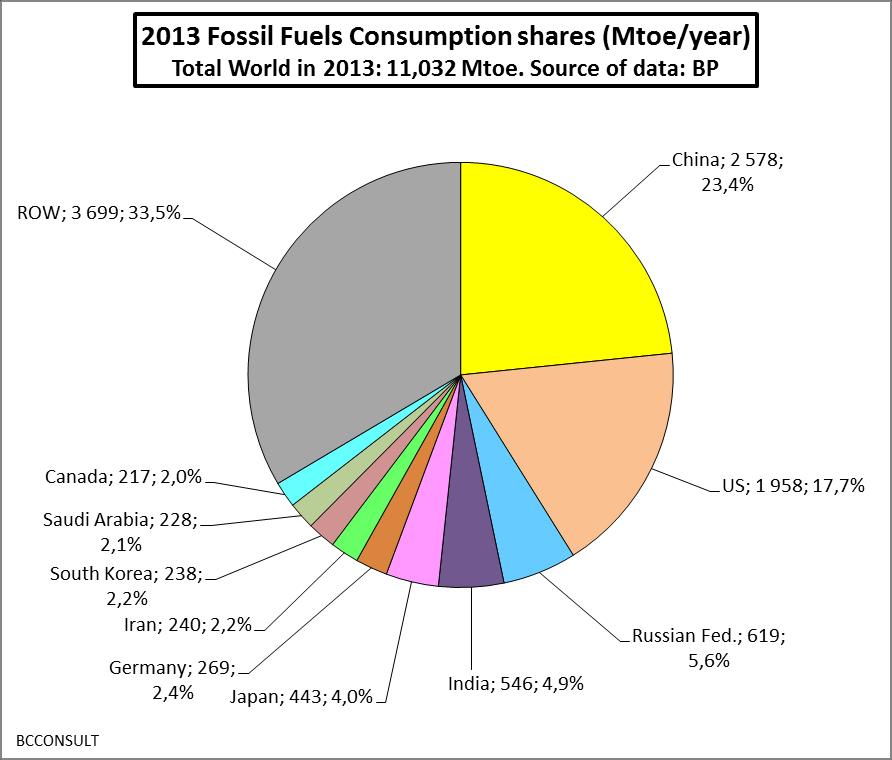
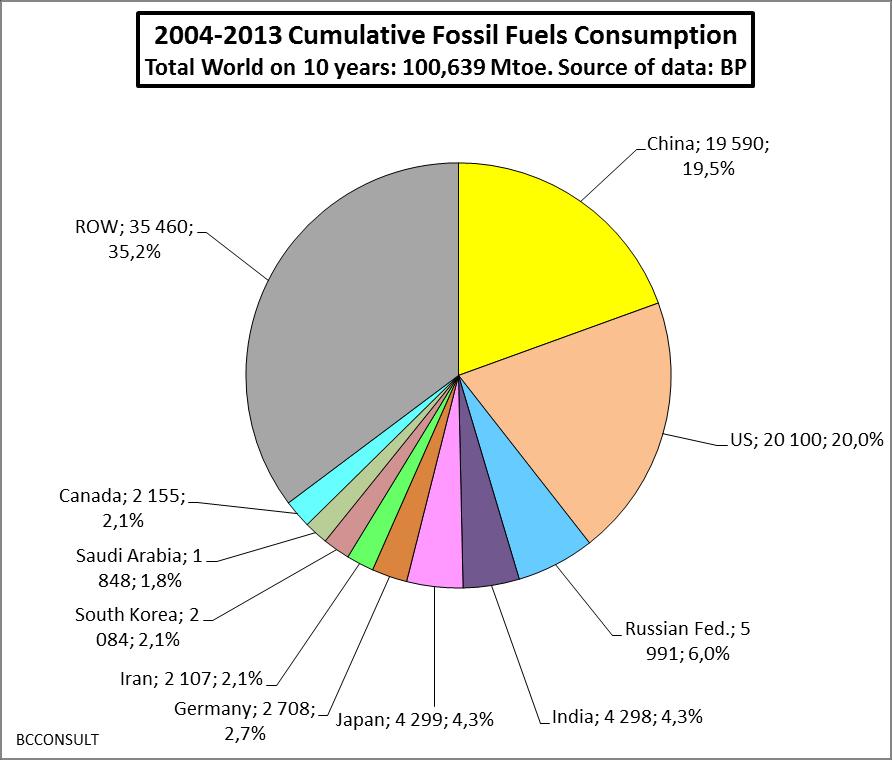
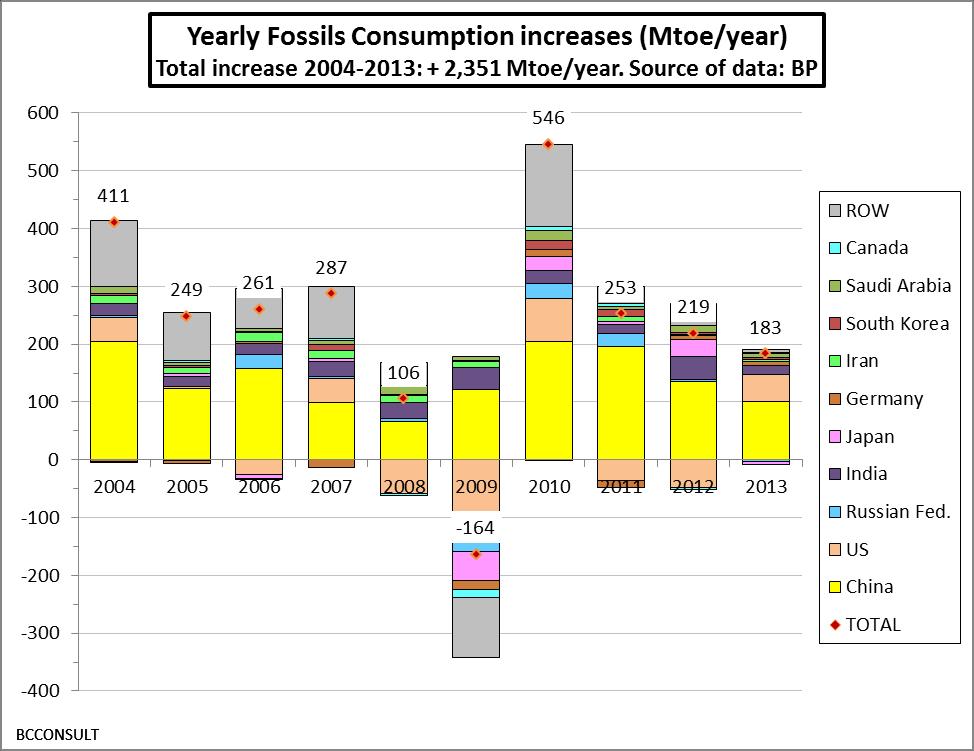
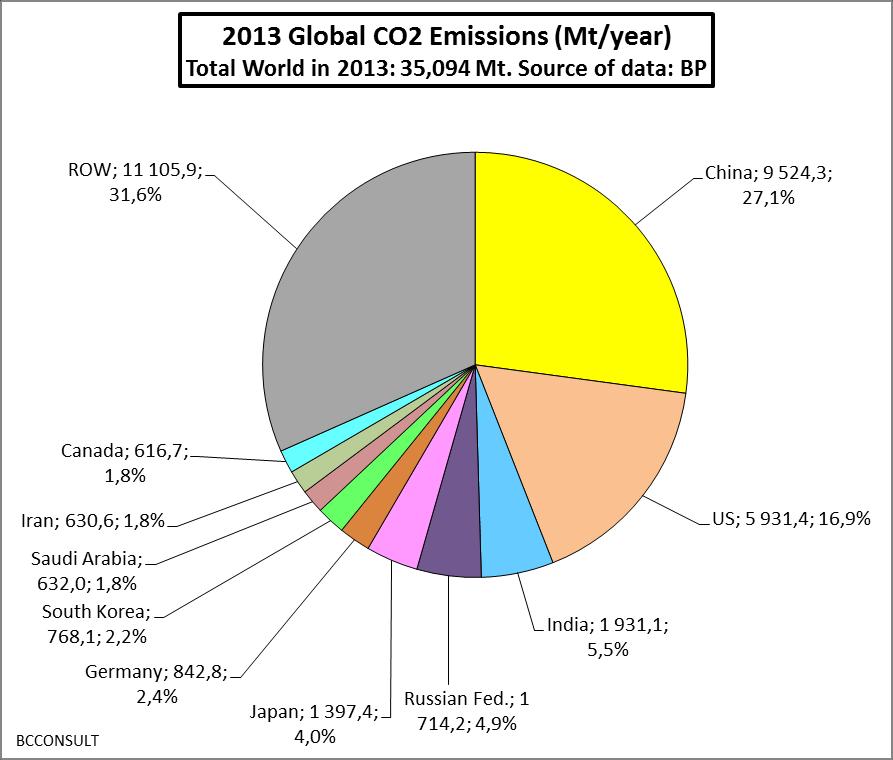
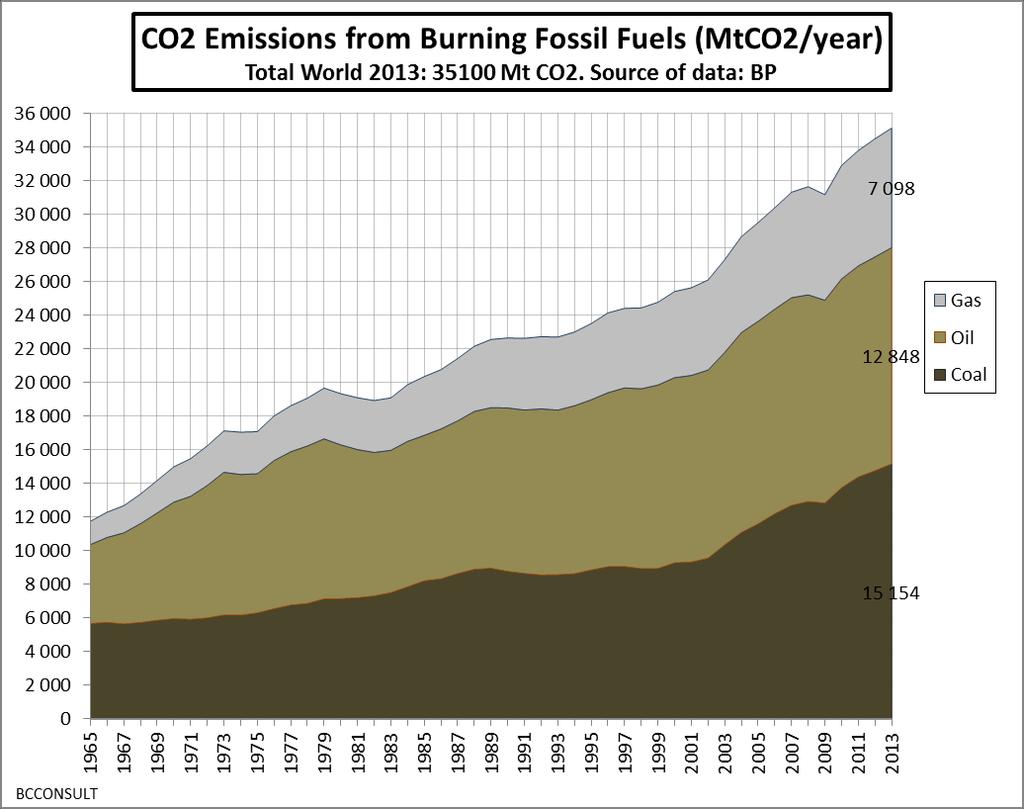
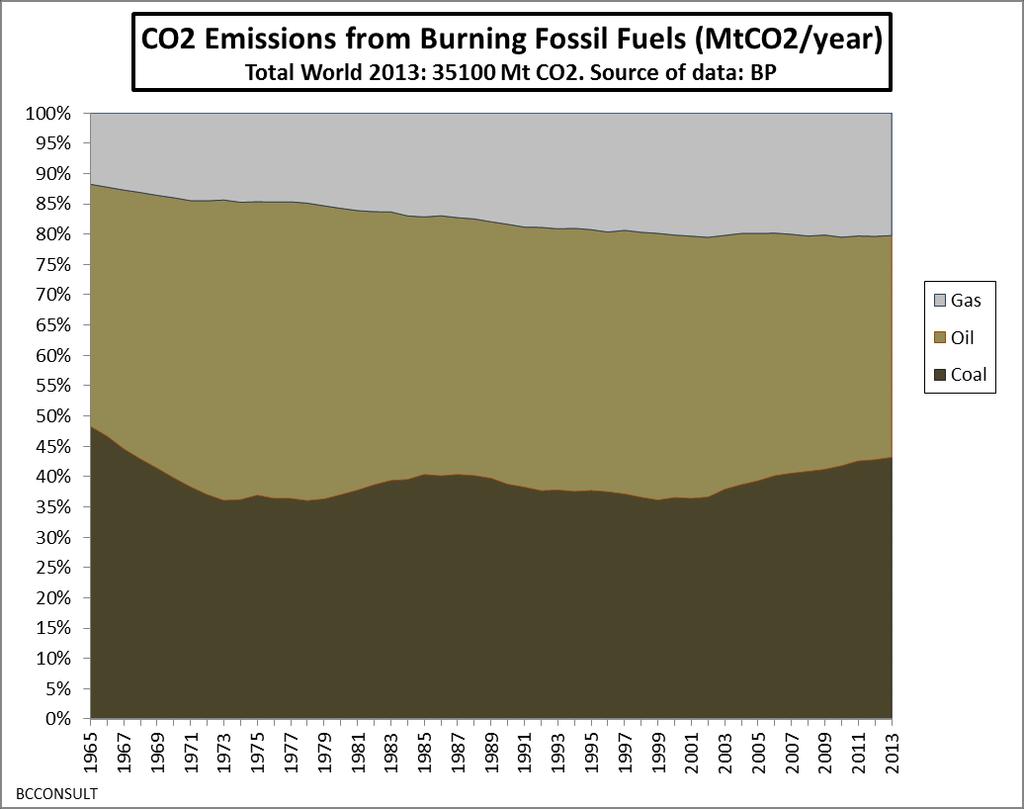
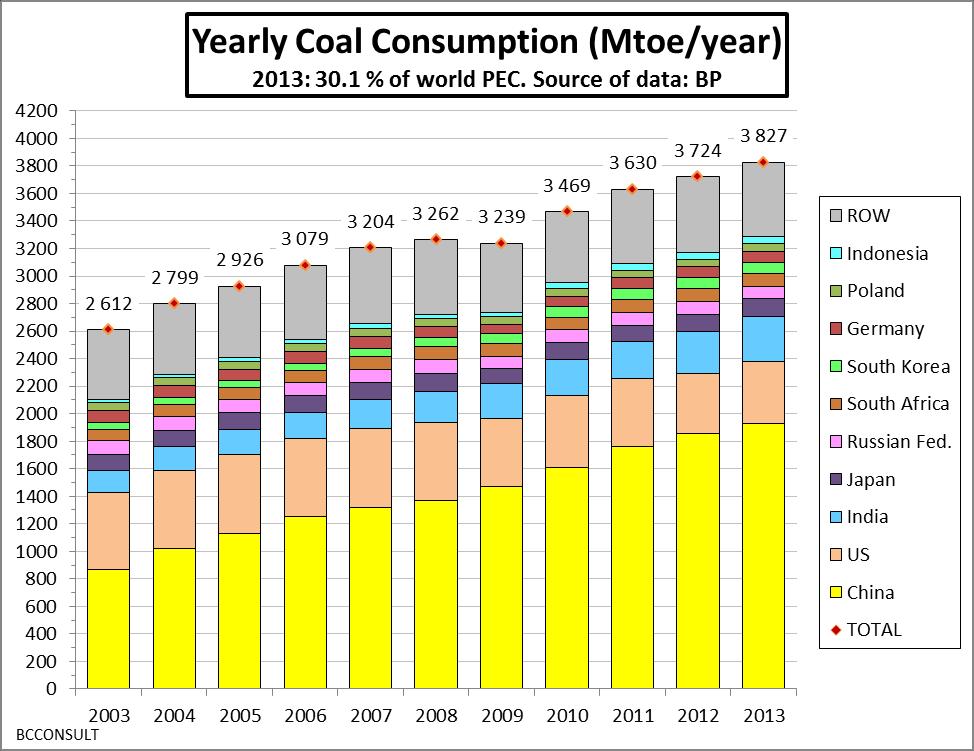
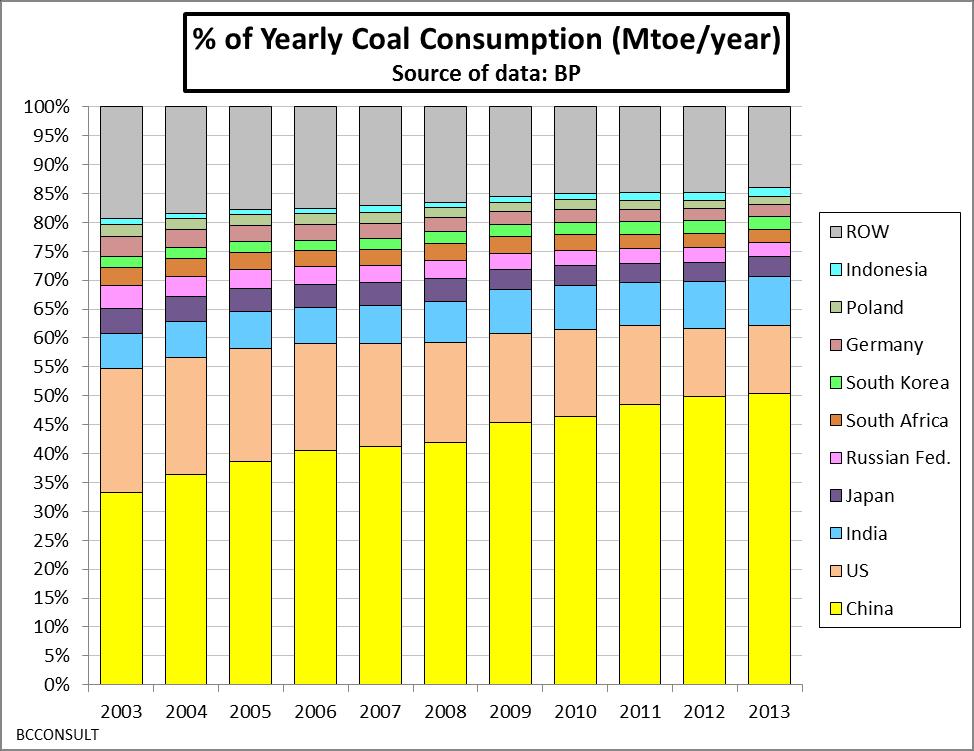
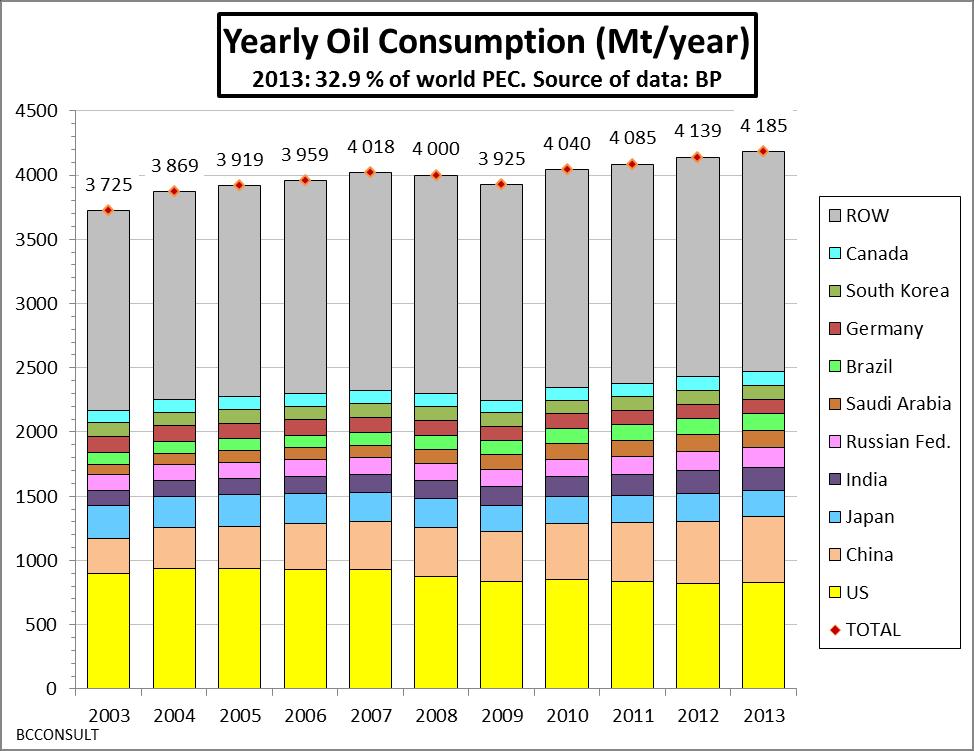
2 Main Findings and Conclusions World primary energy consumption (PEC) remains based mainly on the use of fossil fuels : according to the BP Statistical Rewiew 2014 used in this analysis, in 2013 fossil fuels contributed around 87 % of the 12,730 Mtoe of global PEC in 2013: 33 % from oil (4,185 Mt), 30 % from coal (3,827 Mtoe) and 24 % from gas (3,020 Mtoe). Commercial renewables (including hydropower) contributed by 8.9 % (1,135 Mtoe) and nuclear by 4.4 % (563 Mtoe) Considering final energy consumption including from traditional biomass (see slide N 7 from the REN report), in 2012 fossil fuels contributed by 78.2 %, renewables by 19 % (of which 10 % modern renewables) and nuclear energy by 2.6 %. On the last ten years ( ), fossil fuels consumption average annual growth rate (2.2 %/year) was the same than for PEC, compared to %/year for renewables (resulting from %/year for hydropower and %/year for other renewables) and to a decrease of %/year for nuclear power. At 35,094 MtCO2 in 2013 and an average growth rate of %/year on compared to %/year on , global emissions from burning fossil fuels are on an unsustainable path (see slide N 36 and 37), with a cumulative value of more than 1,100 GtCO2 since around half a century ago (1965) of which 400 Gt since Extrapolated to 2025, this CO2 emission path from burning fossil fuels would add GtCO2 since 2000, too near from the 866 GtCO2 of the CO2 budget calculated by the Postdam Institute for Climate to secure a 80 % probality of limiting the global warming to less than + 2 C during this 21 st century. Detailed analysis of coal consumption (slides 38-44) and oil of and consumption and production (slides 45-72) in 2013, during the last ten years ( ) and on the period show the differentiated contributions of main countries producing and consuming fossil fuels and the impact of large emerging countries. Analysis of [Oil + Gas] consumption and production (slides 73-81), of the (production consumption) differences and the (Production /Consumption) ratios puts in evidence the fast declining related values on for large hydrocarbons producers and exporters (e. g. Saudi Arabia, Iran) and for many importing countries (like China since 1993) or regions (European Union). In USA, the recent increase of unconventional oil and gas production was not sufficient to avoid a still large hydrocarbons (production consumption) difference of Mtoe in 2013, with a ratio of 71 %. For the European Union, the hydrocarbons production/consumption deficits are aggravating (slides 80 and 81), for gas from a ratio of 60 % in 1994 down to 38 % in 2013 (a deficit of 244 Mtoe), for oil from 25 % in 1999 down to a mere 11 % in 2013 (a deficit of Mt), and for [Oil + Gas] from 36 % in 1996 down to 22 % in 2013 (a combined deficit of Mtoe). Tables of the Top 40 countries in 2013 in ANNEX 1 and ANNEX 2 (slides 82 to 91) show individual countries ranks for the contributions of primary energy sources (fossils, renewables, nuclear) in absolute and relative values. Up to 12 of the 67 selected countries are dependant to fossil fuels to more than 99 % of their PEC. Only 2 countries (Norway and Sweden) rely on non-fossil energy sources for more than 2/3 rd of their PEC. Only one country (France) rely on more than 1/3 rd on nuclear power of its PEC with a 38.6 % contribution. And only 4 countries rely on modern and commercial renewables for more than 1/3 rd of their PEC (of which near 2/3 rd for Norway), and without hydropower, only one (Denmark) rely on more than 20 % from renewables within its PEC. Due to this unsustainable dependency and development path related to fossil fuels consumption and the related CO2 emissions, and due to the continuously decreasing market share from nuclear power and its limited future development opportunities, sustainable policies and measures for energy and climate should strongly focus on energy conservation, energy efficiency and a faster development of modern renewables in all economic sectors both in industrialised, emerging and developing countries.
3 Introduction and Content Analysis based on data from the BP Statistical Review 2014, global data and for 67 individual countries representing 96 % of the 2013 world PEC, downloadable at : World primary energy consumption (PEC): Slides N 4-18 Fossil fuels consumption: Slides N CO2 emissions from burning fossil fuels : Slides N Coal consumption by countries: Slides N Oil consumption and production by countries: Slides N Gas consumption and production by countries: Slides N [Oil + Gas] consumption and production: Slides N ANNEX 1: Top 40 countries for primary energy consumption by sources: Slides ANNEX 2: Top 40 countries by % of primary energy consumption by sources: Slides 91-94
4 World Primary Energy Consumption by Sources in
5 5
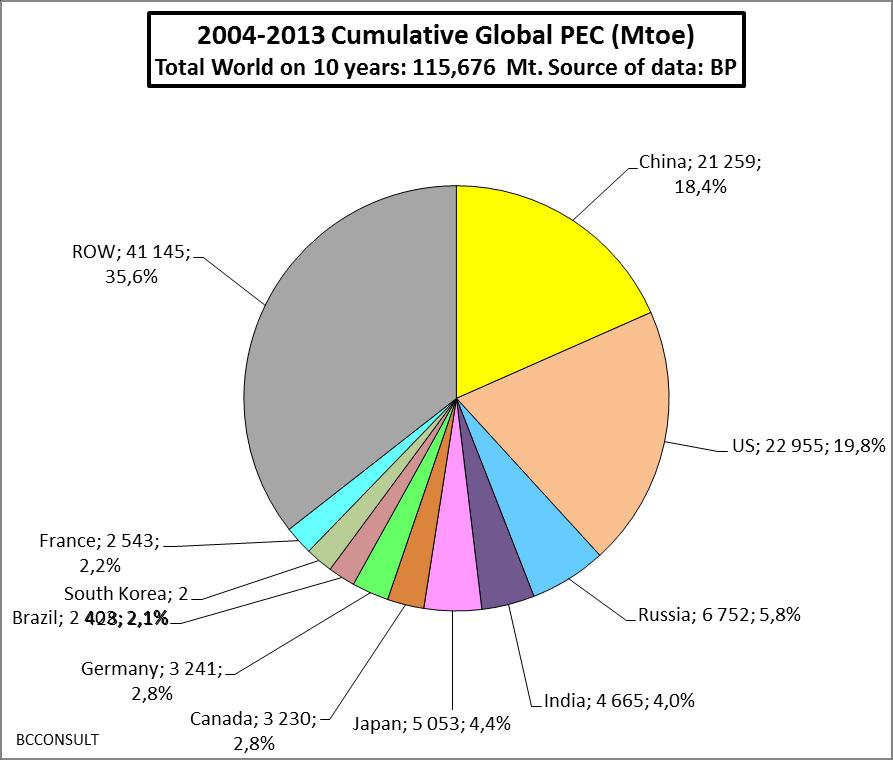
6 Data from BP Tot Fossil Coal Oil Gas Nuclear Hydro Other RE Tot. RE Tot. PEC Total World (Mtoe) % Total PEC 86,66% 30,06% 32,87% 23,73% 4,42% 6,72% 2,19% 8,92% 100% Rest of World (Mtoe) % ROW on total 3,9% 1,4% 6,7% 3,3% 0,3% 9,5% 2,0% 7,7% 4,1% Data from BP Tot. Fossil Coal Oil Gas Nuclear Hydro Other RE Tot. RE Tot. PEC Total World (Mtoe) Of which: OECD 4 571, , , ,4 447,0 319,3 195,6 514, ,1 Non-OECD 6 461, , , ,0 116,1 536,5 83,7 620, ,3 % OECD 41,4% 27,9% 49,2% 47,8% 79,4% 37,3% 70,0% 45,4% 43,5% % Non OECD 58,6% 72,1% 50,8% 52,2% 20,6% 62,7% 30,0% 54,6% 56,5% European Union 1 284,9 285,4 605,2 394,3 198,5 81,9 110,6 192, ,9 % EU in World 11,6% 7,5% 14,5% 13,1% 35,3% 9,6% 39,6% 17,0% 13,2% EU in OECD 28,1% 26,7% 29,4% 27,3% 44,4% 25,7% 56,5% 37,4% 30,3% 6

7 Considering the final energy consumption (and not the primary energy demand) and integrating the non commercial use of biomass, the global share of fossil fuels was still largely dominant at 78.4 % in 2012, compared to 19 % from renewables and 2.6 % from nuclear energy Source: REN 21, RENEWABLES 204 GLOBAL STATUS REPORT 7
8 Analysis of the Changes in the World Primary Energy Consumption by Sources on the Last Ten Years:
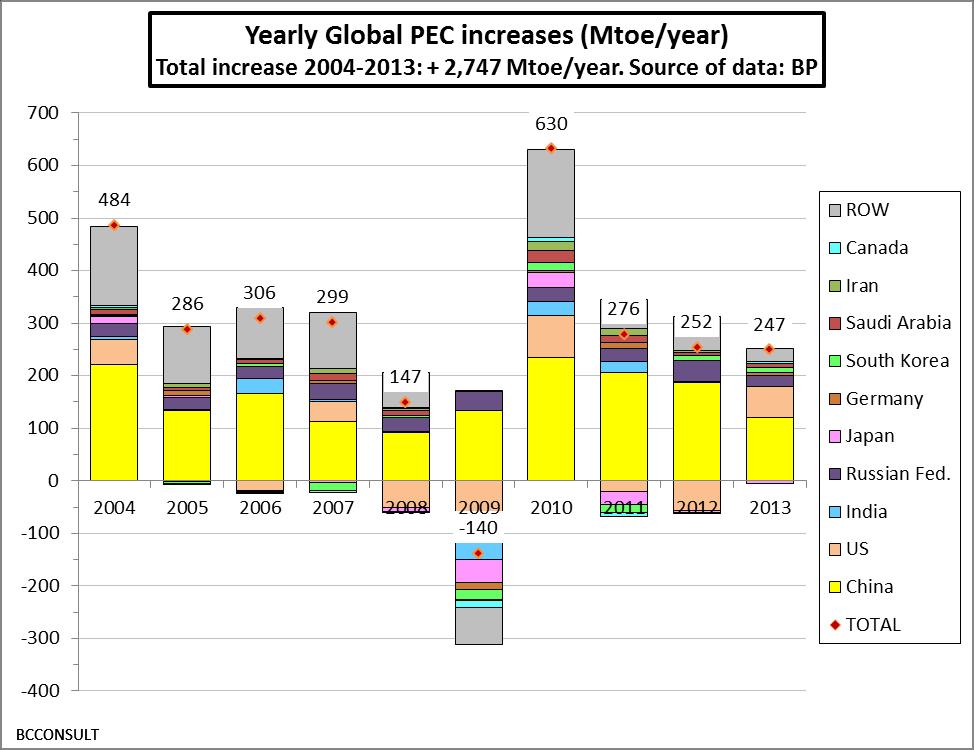
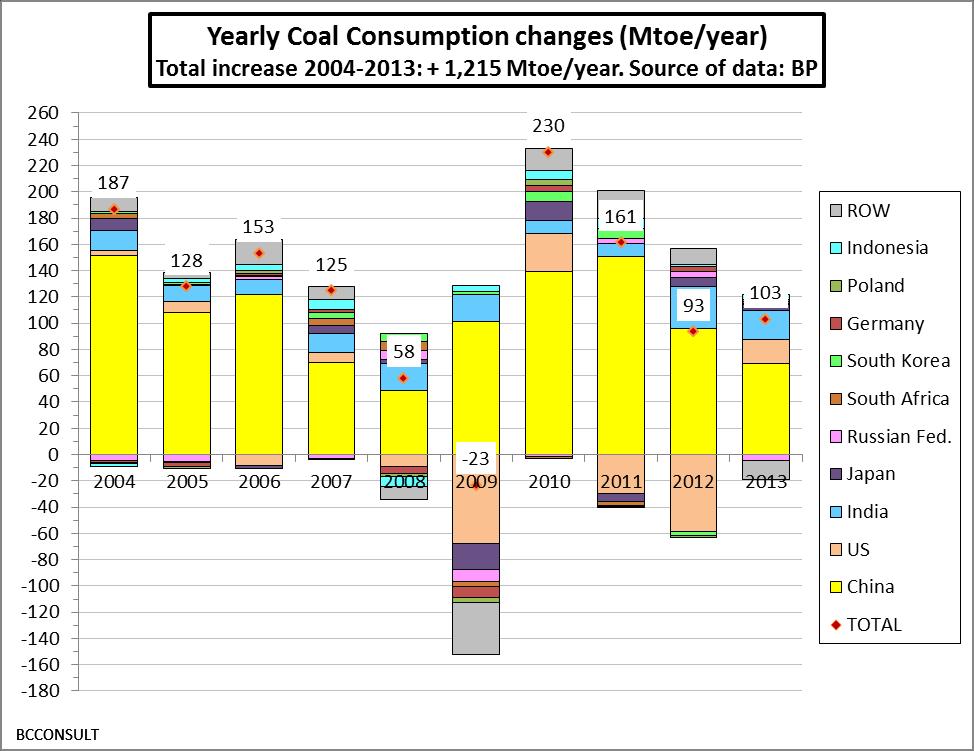
9 World PEC. Data: BP Total Coal Oil Gas Nuclear Hydro Other RE Tot. RE Total BCCONSULT 6/2014 Fossils PEC Mtoe Mtoe , (2013) - (2004) (Mtoe) (2013) / (2004) 1,21 1,37 1,08 1,25 0,90 1,35 3,67 1,60 1,22 10 years variation % 21% 37% 8% 25% -10% 35% 267% 60% 22% Av. Growth Rate (%/year) 2,2% 3,5% 0,9% 2,5% -1,1% 3,4% 15,6% 5,3% 2,2% 9
10 Analysis of Primary Energy Consumption (PEC) by Sources on
11 11
12 Analysis of Primary Energy Consumption by Countries on
13 13
14 14
15 15
16 16
17 17
18 18
19 Fossil Fuels Consumption by Countries on
20 20
21 21
22 22
23 23
24 24
25 25
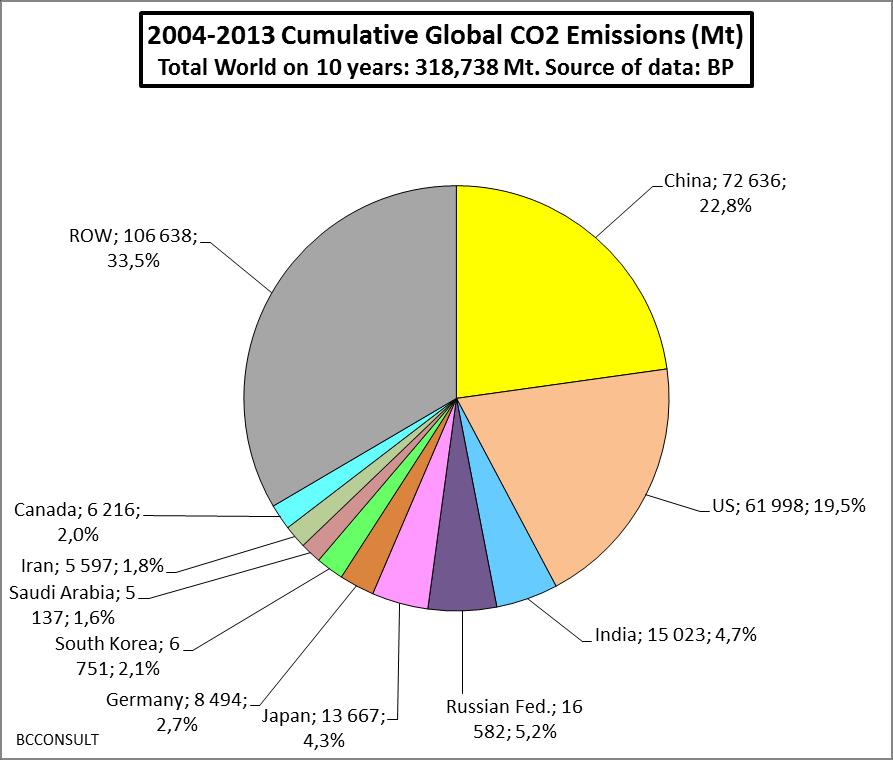
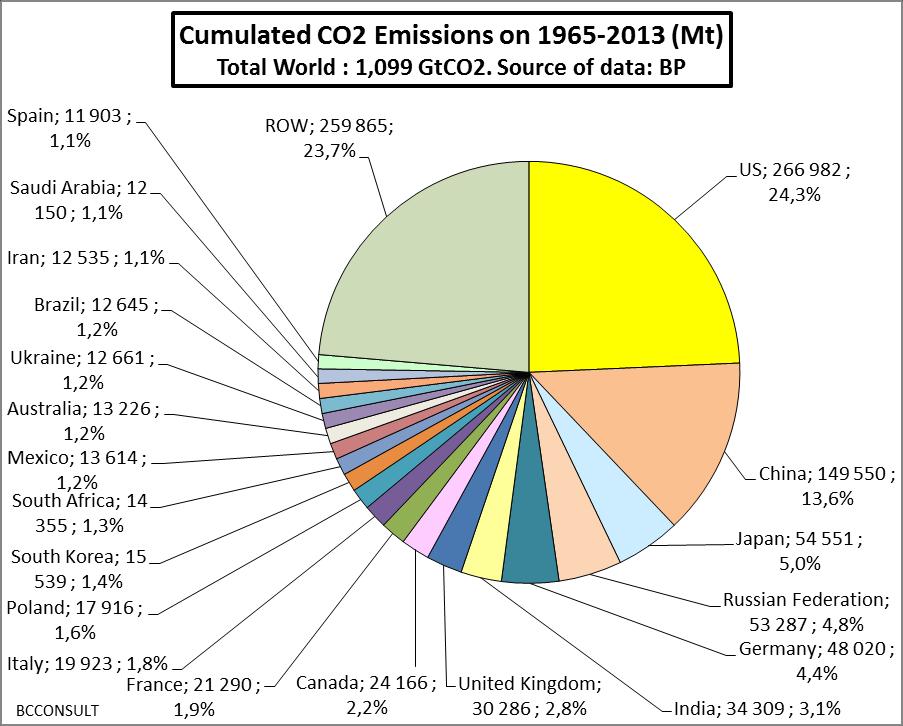
26 C02 Emissions From Burning Fossil Fuels (All Sectors) Share of electricity production in global CO2 emissions CO2 emissions from burning fossil fuels since 1990 CO2 emissions in 2013 Cumulated CO2 emissions on the last ten years Cumulated CO2 emissions since
27 Electricity production and industry are main emitters sectors Source: «Long term trend in global CO2 emissions, 2011 report», PBL Netherlands Environmental Assessment Agency and JRC European Commission,
28 28
29 29
30 30
31 CO2 emissions in 2013 (Mt). Data from BP Rank Country Mt CO2 % World Cum % 1 China 9 524,3 27,1% 27,1% 2 US 5 931,4 16,9% 44,0% 3 India 1 931,1 5,5% 49,5% 4 Russian Federation 1 714,2 4,9% 54,4% 5 Japan 1 397,4 4,0% 58,4% 6 Germany 842,8 2,4% 60,8% 7 South Korea 768,1 2,2% 63,0% 8 Saudi Arabia 632,0 1,8% 64,8% 9 Iran 630,6 1,8% 66,6% 10 Canada 616,7 1,8% 68,4% 11 Brazil 541,1 1,5% 69,9% 12 Indonesia 523,3 1,5% 71,4% 13 United Kingdom 513,4 1,5% 72,8% 14 Mexico 499,4 1,4% 74,3% 15 South Africa 441,1 1,3% 75,5% 16 France 385,6 1,1% 76,6% 17 Italy 383,1 1,1% 77,7% 18 Australia 360,1 1,0% 78,7% 19 Poland 331,1 0,9% 79,7% 20 Taiw an 330,0 0,9% 80,6% 21 Turkey 328,8 0,9% 81,6% 22 Thailand 328,4 0,9% 82,5% 23 Ukraine 301,1 0,9% 83,4% 24 Spain 284,3 0,8% 84,2% 25 United Arab Emirates 253,7 0,7% 84,9% 26 Netherlands 238,5 0,7% 85,6% 27 Malaysia 234,7 0,7% 86,2% 28 Singapore 224,6 0,6% 86,9% 29 Egypt 224,0 0,6% 87,5% 30 Kazakhstan 209,5 0,6% 88,1% 31 Argentina 194,5 0,6% 88,7% 32 Venezuela 176,6 0,5% 89,2% 33 Pakistan 166,4 0,5% 89,6% 34 Belgium 142,4 0,4% 90,1% 35 Vietnam 137,1 0,4% 90,4% 36 Algeria 121,9 0,3% 90,8% 37 Uzbekistan 110,5 0,3% 91,1% 38 Czech Republic 109,4 0,3% 91,4% 39 Kuw ait 104,5 0,3% 91,7% 40 Chile 92,2 0,3% 92,0% 41 China Hong Kong SAR 90,8 0,3% 92,2% 42 Philippines 90,8 0,3% 92,5% 43 Colombia 82,2 0,2% 92,7% 44 Qatar 80,7 0,2% 93,0% 45 Greece 78,8 0,2% 93,2% 46 Romania 76,2 0,2% 93,4% 47 Israel 76,1 0,2% 93,6% 48 Austria 70,6 0,2% 93,8% 49 Bangladesh 67,9 0,2% 94,0% 50 Turkmenistan 66,4 0,2% 94,2% 51 Belarus 65,6 0,2% 94,4% 52 Trinidad & Tobago 53,0 0,2% 94,5% 53 Sw eden 52,9 0,2% 94,7% 54 Portugal 52,3 0,1% 94,8% 55 Peru 47,9 0,1% 95,0% 56 Finland 47,9 0,1% 95,1% 57 Hungary 47,0 0,1% 95,2% 58 Denmark 44,6 0,1% 95,4% 59 Norw ay 44,5 0,1% 95,5% 60 Sw itzerland 44,3 0,1% 95,6% 61 Bulgaria 41,4 0,1% 95,7% 62 New Zealand 37,1 0,1% 95,9% 63 Ecuador 36,8 0,1% 96,0% 64 Republic of Ireland 35,4 0,1% 96,1% 65 Slovakia 34,7 0,1% 96,2% 66 Azerbaijan 32,3 0,1% 96,2% 67 Lithuania 14,8 0,0% 96,3% ROW ,7% 100,0% Total World ,0% of w hich: OECD ,7% Non-OECD ,3% European Union ,2% Former Soviet Union ,3% Source of data: BP Statistical Review
32 32
33 33
34 Cumulative CO2 emissions on (Mt). Data: BP Rank Country % World Cum % World 1 US ,3% 24,3% 2 China ,6% 37,9% 3 Japan ,0% 42,9% 4 Russian Federation ,8% 47,7% 5 Germany ,4% 52,1% 6 India ,1% 55,2% 7 United Kingdom ,8% 58,0% 8 Canada ,2% 60,2% 9 France ,9% 62,1% 10 Italy ,8% 63,9% 11 Poland ,6% 65,6% 12 South Korea ,4% 67,0% 13 South Africa ,3% 68,3% 14 Mexico ,2% 69,5% 15 Australia ,2% 70,7% 16 Ukraine ,2% 71,9% 17 Brazil ,2% 73,0% 18 Iran ,1% 74,2% 19 Saudi Arabia ,1% 75,3% 20 Spain ,1% 76,3% 21 Netherlands ,0% 77,3% 22 Indonesia ,82% 78,1% 23 Taiw an ,70% 78,8% 24 Czech Republic ,70% 79,5% 25 Turkey ,65% 80,2% 26 Belgium ,63% 80,8% 27 Romania ,58% 81,4% 28 Argentina ,53% 81,9% 29 Thailand ,53% 82,5% 30 Kazakhstan ,49% 82,9% 31 Venezuela ,48% 83,4% 32 Egypt ,42% 83,8% 33 United Arab Emirates ,39% 84,2% 34 Malaysia ,37% 84,6% 35 Singapore ,37% 85,0% 36 Pakistan ,34% 85,3% 37 Greece ,32% 85,6% 38 Sw eden ,31% 85,9% 39 Uzbekistan ,31% 86,3% 40 Hungary ,30% 86,6% 41 Austria ,27% 86,8% 42 Bulgaria ,27% 87,1% 43 Denmark ,26% 87,4% 44 Algeria ,26% 87,6% 45 Vietnam ,23% 87,8% 46 Finland ,22% 88,1% 47 Colombia ,21% 88,3% 48 Philippines ,21% 88,5% 49 Belarus ,20% 88,7% 50 Slovakia ,20% 88,9% 51 Kuw ait ,19% 89,1% 52 China Hong Kong SAR ,19% 89,3% 53 Israel ,19% 89,5% 54 Sw itzerland ,19% 89,6% 55 Portugal ,19% 89,8% 56 Chile ,18% 90,0% 57 Norw ay ,16% 90,2% 58 Republic of Ireland ,13% 90,3% 59 New Zealand ,12% 90,4% 60 Turkmenistan ,12% 90,5% 61 Qatar ,12% 90,6% 62 Peru ,10% 90,8% 63 Trinidad & Tobago ,10% 90,9% 64 Azerbaijan ,10% 91,0% 65 Bangladesh ,10% 91,1% 66 Ecuador 731 0,07% 91,1% 67 Lithuania 604 0,05% 91,2% ROW ,8% 100,0% Total World ,0% of w hich: OECD ,0% Non-OECD ,0% European Union ,2% Former Soviet Union ,8% Source of data: BP Statistical Review
35 35
36 36
37 37
38 38
39 : %/year : %/year : + 3.4%/year 39
40 40
41 Coal Consumption by Countries on
42 42
43 43
44 44
45 45
46 46
47 47
48 Oil Consumption by Countries on
49 49
50 50
51 51
52 52
53 53
54 54
55 Oil Production by Countries On
56 56
57 57
58 58
59 59
60 60
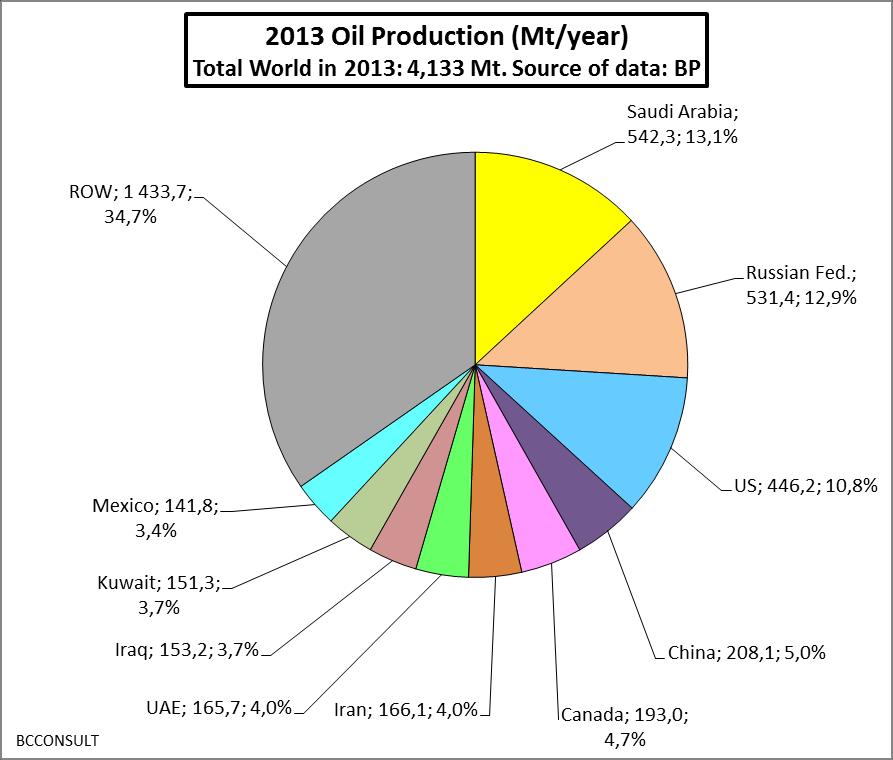
61 2013 Oil Production World % Rank Country Mtoe % Cum % 1 Saudi Arabia 542,3 13,12% 13,12% 2 Russian Fed. 531,4 12,86% 25,98% 3 US 446,2 10,80% 36,78% 4 China 208,1 5,04% 41,81% 5 Canada 193,0 4,67% 46,48% 6 Iran 166,1 4,02% 50,50% 7 United Arab Emirates 165,7 4,01% 54,51% 8 Iraq 153,2 3,71% 58,22% 9 Kuw ait 151,3 3,66% 61,88% 10 Mexico 141,8 3,43% 65,31% 11 Venezuela 135,1 3,27% 68,58% 12 Nigeria 111,3 2,69% 71,27% 13 Brazil 109,9 2,66% 73,93% 14 Angola 87,4 2,11% 76,05% 15 Qatar 84,2 2,04% 78,08% 16 Kazakhstan 83,8 2,03% 80,11% 17 Norw ay 83,2 2,01% 82,12% 18 Algeria 68,9 1,67% 83,79% 19 Colombia 52,9 1,28% 85,07% 20 Libya 46,5 1,12% 86,19% 21 Azerbaijan 46,2 1,12% 87,31% 22 Oman 46,1 1,12% 88,43% 23 Indonesia 42,7 1,03% 89,46% 24 India 42,0 1,02% 90,47% 25 United Kingdom 40,6 0,98% 91,46% 26 Egypt 34,5 0,84% 92,29% 27 Argentina 30,5 0,74% 93,03% 28 Malaysia 29,6 0,72% 93,75% 29 Ecuador 28,2 0,68% 94,43% 30 Australia 17,9 0,43% 94,87% 31 Vietnam 17,0 0,41% 95,28% 32 Thailand 16,6 0,40% 95,68% 33 Equatorial Guinea 14,6 0,35% 96,03% 34 Rep. of Congo (Brazz.) 14,5 0,35% 96,38% 35 Gabon 11,8 0,29% 96,67% 36 Turkmenistan 11,4 0,28% 96,95% 37 Denmark 8,7 0,21% 97,16% 38 Yemen 7,4 0,18% 97,33% 39 Brunei 6,6 0,16% 97,49% 40 Sudan 6,0 0,15% 97,64% 41 Trinidad & Tobago 5,9 0,14% 97,78% 42 Italy 5,6 0,13% 97,92% 43 Chad 5,0 0,12% 98,04% 44 South Sudan 4,9 0,12% 98,15% 45 Peru 4,6 0,11% 98,26% 46 Romania 4,1 0,10% 98,36% 47 Tunisia 3,0 0,07% 98,44% 48 Uzbekistan 2,9 0,07% 98,51% 49 Syria 2,8 0,07% 98,57% 49 countries ,57% 98,57% ROW 59 1,43% 100% Total World ,9 100% of w hich: OECD 951,0 23,0% Non-OECD 3 181,9 77,0% OPEC 1 740,1 42,1% Non-OPEC (- FSU) 1 711,6 41,4% European Union 68,4 1,7% Former Soviet Union 681,3 16,5% Source of data: BP Statistical Review
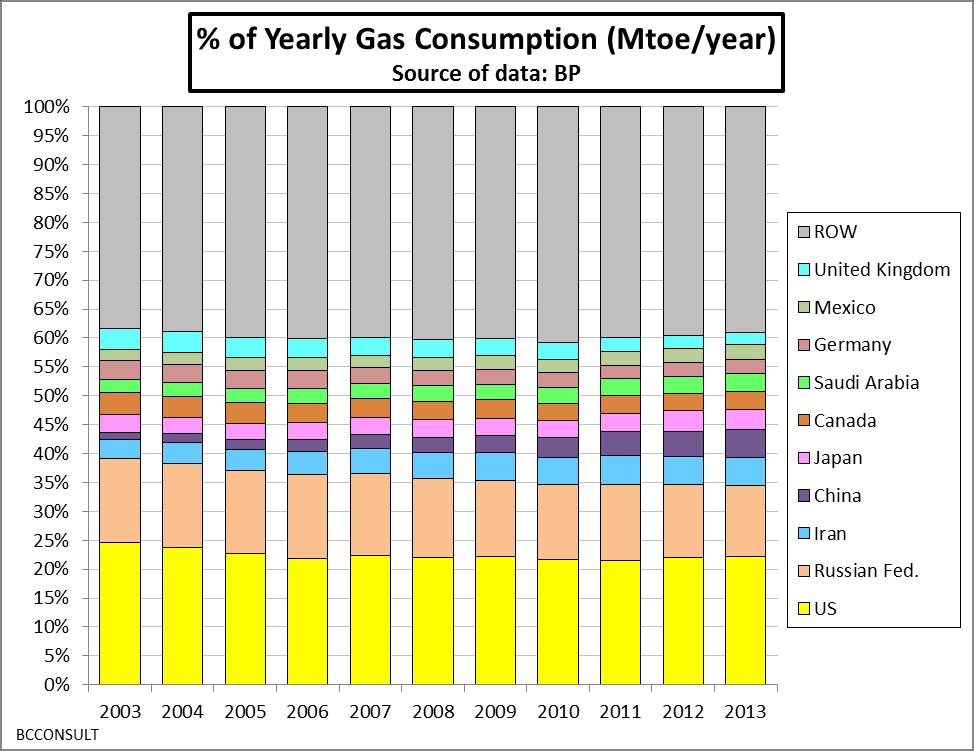
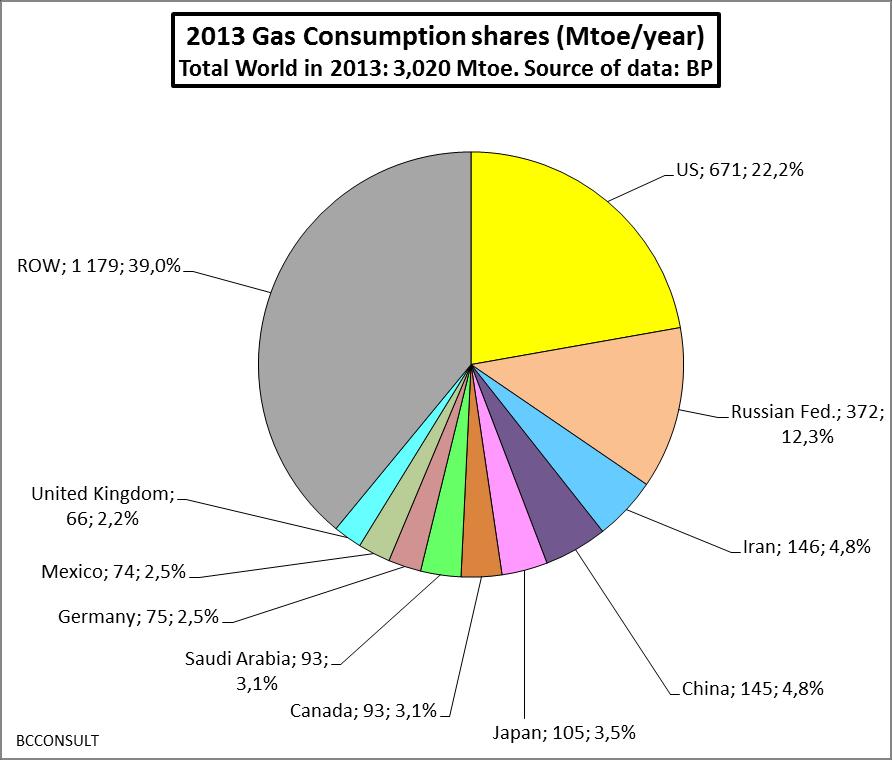
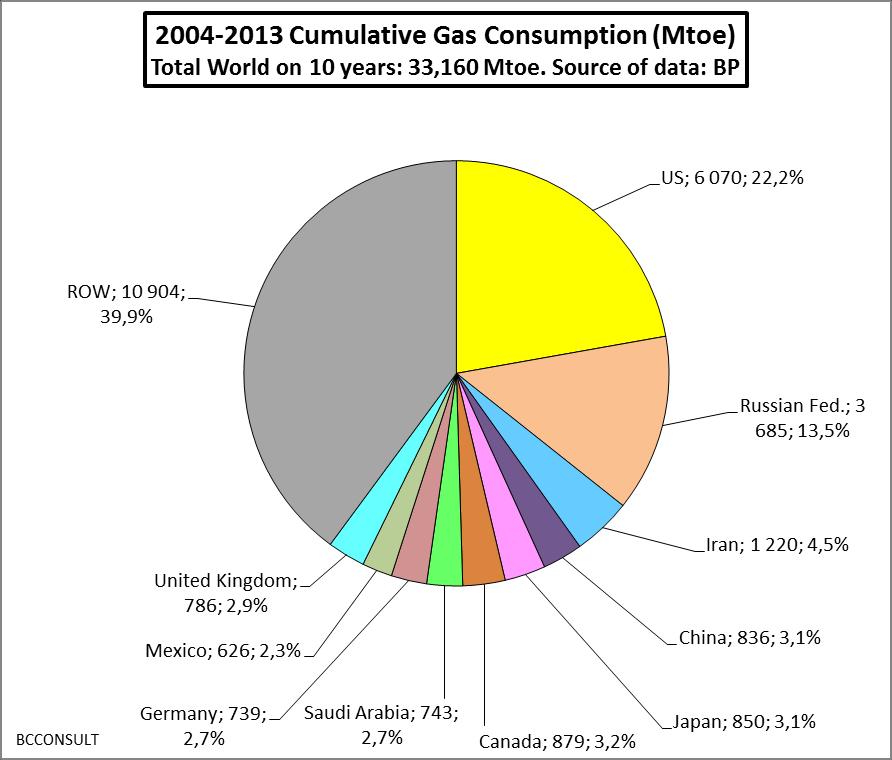
62 Gas Consumption by Countries on
63 63
64 64
65 65
66 66
67 67
68 68
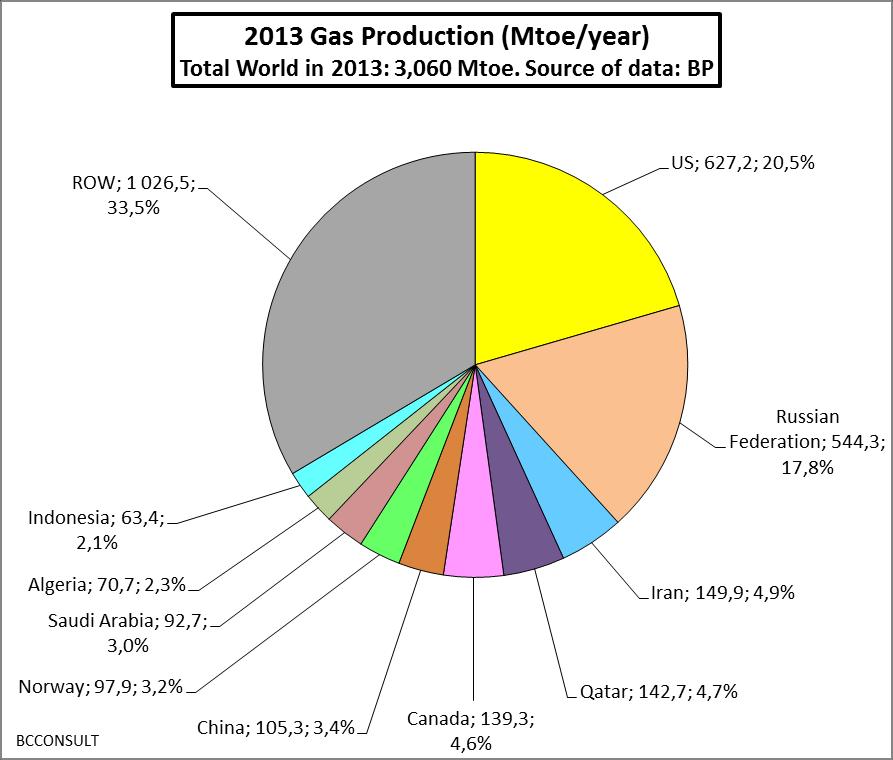
69 Gas Production by Countries On
70 70
71 71
72 72
73 73
74 74
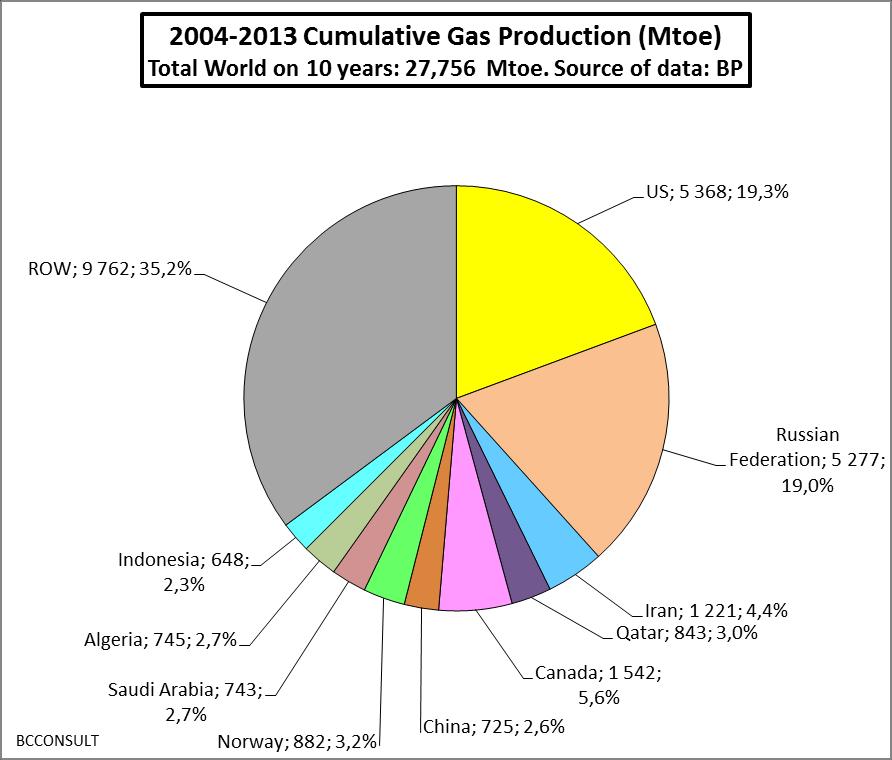
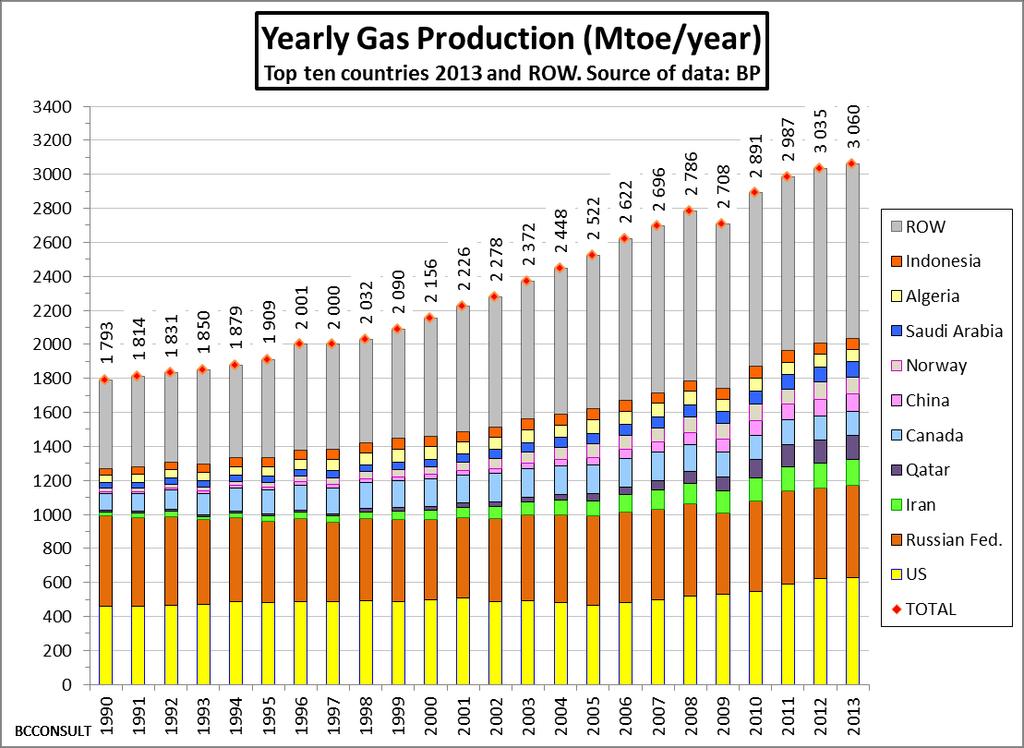
75 2013 Gas Production (Mtoe) % Rank Country Mtoe % Cum % 1 US 627,2 20,50% 20,50% 2 Russian Federation 544,3 17,79% 38,29% 3 Iran 149,9 4,90% 43,18% 4 Qatar 142,7 4,66% 47,85% 5 Canada 139,3 4,55% 52,40% 6 China 105,3 3,44% 55,84% 7 Norw ay 97,9 3,20% 59,04% 8 Saudi Arabia 92,7 3,03% 62,07% 9 Algeria 70,7 2,31% 64,38% 10 Indonesia 63,4 2,07% 66,45% 11 Malaysia 62,1 2,03% 68,49% 12 Netherlands 61,8 2,02% 70,51% 13 Turkmenistan 56,1 1,83% 72,34% 14 United Kingdom 51,4 1,68% 74,02% 15 Mexico 51,0 1,67% 75,69% 16 Egypt 50,5 1,65% 77,33% 17 United Arab Emirates 50,4 1,65% 78,98% 18 Uzbekistan 49,7 1,62% 80,60% 19 Australia 38,6 1,26% 81,86% 20 Trinidad & Tobago 38,6 1,26% 83,12% 21 Thailand 37,6 1,23% 84,35% 22 Pakistan 34,7 1,13% 85,49% 23 Nigeria 32,5 1,06% 86,55% 24 Argentina 32,0 1,05% 87,59% 25 India 30,3 0,99% 88,58% 26 Oman 27,8 0,91% 89,49% 27 Venezuela 25,6 0,84% 90,33% 28 Bangladesh 19,7 0,64% 90,97% 29 Brazil 19,2 0,63% 91,60% 30 Bolivia 18,8 0,61% 92,21% 31 Ukraine 17,3 0,57% 92,78% 32 Kazakhstan 16,6 0,54% 93,32% 33 Azerbaijan 14,5 0,48% 93,80% 34 Bahrain 14,2 0,46% 94,26% 35 Kuw ait 14,0 0,46% 94,72% 36 Myanmar 11,8 0,39% 95,11% 37 Colombia 11,4 0,37% 95,48% 38 Brunei 11,0 0,36% 95,84% 39 Peru 11,0 0,36% 96,20% 40 Libya 10,8 0,35% 96,55% 41 Romania 9,9 0,32% 96,87% 42 Yemen 9,3 0,30% 97,18% 43 Vietnam 8,8 0,29% 97,46% 44 Germany 7,4 0,24% 97,70% 45 Italy 6,4 0,21% 97,91% 46 Denmark 4,4 0,14% 98,06% 47 Syria 4,0 0,13% 98,19% 48 Poland 3,8 0,12% 98,31% 49 Iraq 0,6 0,02% 98,33% 49 countries ,33% 98,33% ROW 51 1,67% 100% Total World ,9 100% of w hich: OECD 1 107,0 36,2% Non-OECD 1 952,9 63,8% European Union 150,7 4,9% Former Soviet Union 698,8 22,8% Source of data: BP Statistical Review
76 [Oil + Gas] Production and Consumption by Countries in 2013 and on
77 77
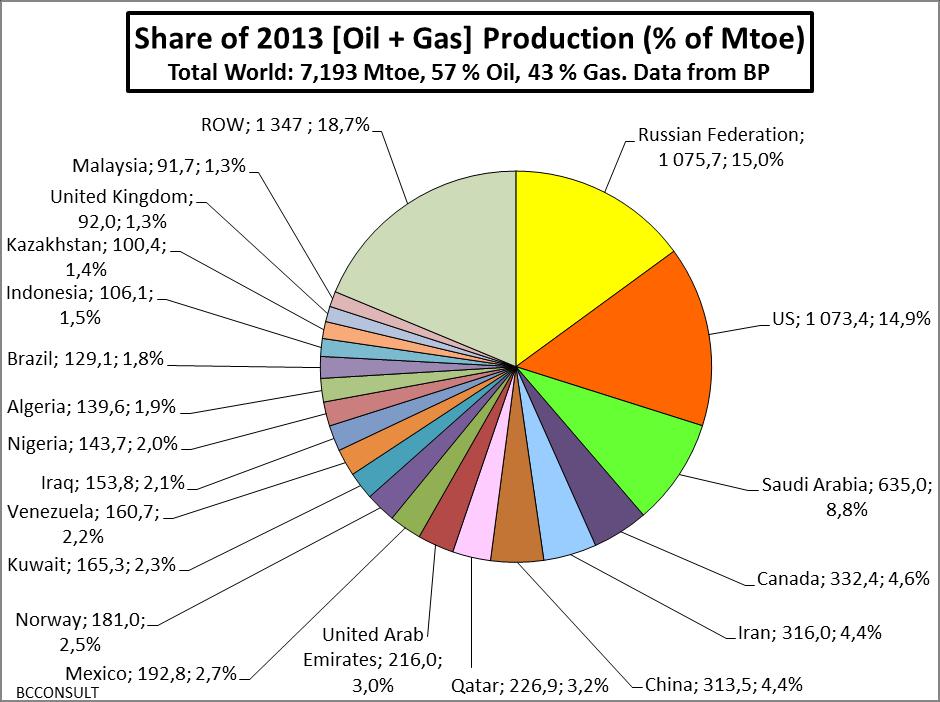
78 2013 [Oil+Gas] Production Mtoe/year Source of data: BP Statistical Review 2014 Rank Country Oil Gas % Oil % Gas [Oil+Gas] % World Cum % 1 Russian Federation 531,4 544,3 49% 51% 1 075,7 14,96% 15,0% 2 US 446,2 627,2 42% 58% 1 073,4 14,92% 29,9% 3 Saudi Arabia 542,3 92,7 85% 15% 635,0 8,83% 38,7% 4 Canada 193,0 139,3 58% 42% 332,4 4,62% 43,3% 5 Iran 166,1 149,9 53% 47% 316,0 4,39% 47,7% 6 China 208,1 105,3 66% 34% 313,5 4,36% 52,1% 7 Qatar 84,2 142,7 37% 63% 226,9 3,15% 55,2% 8 United Arab Emirates 165,7 50,4 77% 23% 216,0 3,00% 58,2% 9 Mexico 141,8 51,0 74% 26% 192,8 2,68% 60,9% 10 Norw ay 83,2 97,9 46% 54% 181,0 2,52% 63,4% 11 Kuw ait 151,3 14,0 92% 8% 165,3 2,30% 65,7% 12 Venezuela 135,1 25,6 84% 16% 160,7 2,23% 68,0% 13 Iraq 153,2 0,6 100% 0% 153,8 2,14% 70,1% 14 Nigeria 111,3 32,5 77% 23% 143,7 2,00% 72,1% 15 Algeria 68,9 70,7 49% 51% 139,6 1,94% 74,0% 16 Brazil 109,9 19,2 85% 15% 129,1 1,80% 75,8% 17 Indonesia 42,7 63,4 40% 60% 106,1 1,47% 77,3% 18 Kazakhstan 83,8 16,6 83% 17% 100,4 1,40% 78,7% 19 United Kingdom 40,6 51,4 44% 56% 92,0 1,28% 80,0% 20 Malaysia 29,6 62,1 32% 68% 91,7 1,28% 81,3% 21 Angola 87,4 0,0 100% 0% 87,4 1,21% 82,5% 22 Egypt 34,5 50,5 41% 59% 85,0 1,18% 83,7% 23 Oman 46,1 27,8 62% 38% 73,9 1,03% 84,7% 24 India 42,0 30,3 58% 42% 72,3 1,00% 85,7% 25 Turkmenistan 11,4 56,1 17% 83% 67,5 0,94% 86,6% 26 Colombia 52,9 11,4 82% 18% 64,3 0,89% 87,5% 27 Argentina 30,5 32,0 49% 51% 62,5 0,87% 88,4% 28 Azerbaijan 46,2 14,5 76% 24% 60,7 0,84% 89,2% 29 Libya 46,5 10,8 81% 19% 57,2 0,80% 90,0% 30 Australia 17,9 38,6 32% 68% 56,5 0,79% 90,8% 31 Thailand 16,6 37,6 31% 69% 54,2 0,75% 91,6% 32 Uzbekistan 2,9 49,7 6% 94% 52,6 0,73% 92,3% 33 Trinidad & Tobago 5,9 38,6 13% 87% 44,4 0,62% 92,9% 34 Ecuador 28,2 0,0 100% 0% 28,2 0,39% 93,3% 35 Vietnam 17,0 8,8 66% 34% 25,8 0,36% 93,7% 36 Bangladesh 0,0 19,7 0% 100% 19,7 0,27% 94,0% 37 Brunei 6,6 11,0 38% 62% 17,6 0,24% 94,2% 38 Yemen 7,4 9,3 44% 56% 16,7 0,23% 94,4% 39 Peru 4,6 11,0 29% 71% 15,5 0,22% 94,6% 40 Equatorial Guinea 14,6 0,0 100% 0% 14,6 0,20% 94,8% 41 Rep. of Congo (Brazz.) 14,5 0,0 100% 0% 14,5 0,20% 95,0% 42 Bahrain 0,0 14,2 0% 100% 14,2 0,20% 95,2% 43 Romania 4,1 9,9 29% 71% 14,0 0,19% 95,4% 44 Denmark 8,7 4,4 67% 33% 13,0 0,18% 95,6% 45 Italy 5,6 6,4 47% 53% 11,9 0,17% 95,8% 46 Gabon 11,8 0,0 100% 0% 11,8 0,16% 96,0% 47 Myanmar 0,0 11,8 0% 100% 11,8 0,16% 96,1% 48 Syria 2,8 4,0 41% 59% 6,8 0,09% 96,2% 49 Sudan 6,0 0,0 100% 0% 6,0 0,08% 96,3% 50 Chad 5,0 0,0 100% 0% 5,0 0,07% 96,4% 51 South Sudan 4,9 0,0 100% 0% 4,9 0,07% 96,4% 52 Tunisia 3,0 0,0 100% 0% 3,0 0,04% 96,5% Countries Oil Gas % Oil % Gas [Oil+Gas] % World Cum % 52 countries % 41% ,47% 96,5% ROW % 77% 254 3,53% Total World % 43% % 100% of w hich: OECD 951, ,0 46% 54% 2 058,0 28,6% Non-OECD 3 181, ,9 62% 38% 5 134,7 71,4% European Union 68,4 150,7 31% 69% 219,1 3,0% Former Soviet Union 681,3 698,8 49% 51% 1 380,1 19,2% Oil and gas production. Source of data: BP Statistical Review
79 79
80 80
81 81
82 82
83 83
84 84
85 ANNEX 1: Top 40 Countries For Primary Energy Consumption (PEC) by Sources In
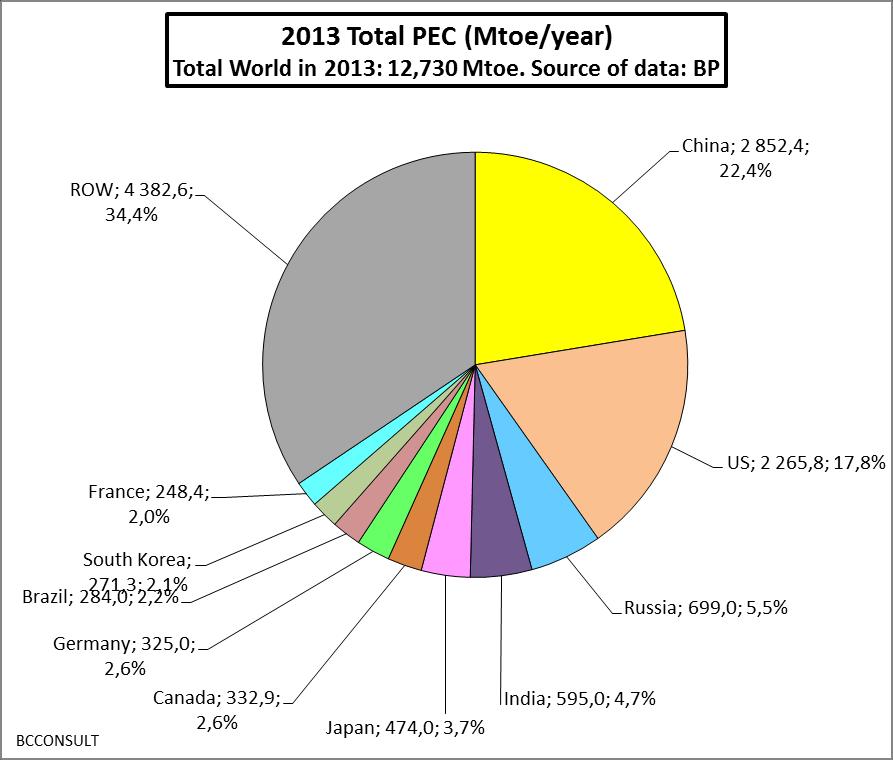
86 Mtoe ROW 1 182,0 9,3% 100% 2013 TOTAL World ,0% 100% Rank Country Total PEC % Total Cum. % 1 China 2 852,4 22,4% 22,4% 2 US 2 265,8 17,8% 40,2% 3 Russia 699,0 5,5% 45,7% 4 India 595,0 4,7% 50,4% 5 Japan 474,0 3,7% 54,1% 6 Canada 332,9 2,6% 56,7% 7 Germany 325,0 2,6% 59,3% 8 Brazil 284,0 2,2% 61,5% 9 South Korea 271,3 2,1% 63,6% 10 France 248,4 2,0% 65,6% 11 Iran 243,9 1,9% 67,5% 12 Saudi Arabia 227,7 1,8% 69,3% 13 United Kingdom 200,0 1,6% 70,8% 14 Mexico 188,0 1,5% 72,3% 15 Indonesia 168,7 1,3% 73,7% 16 Italy 158,8 1,2% 74,9% 17 Spain 133,7 1,1% 75,9% 18 Turkey 122,8 1,0% 76,9% 19 South Africa 122,4 1,0% 77,9% 20 Ukraine 117,5 0,9% 78,8% 21 Australia 116,0 0,9% 79,7% 22 Thailand 115,6 0,9% 80,6% 23 Taiw an 110,9 0,9% 81,5% 24 Poland 99,9 0,8% 82,3% 25 United Arab Emirates 97,1 0,8% 83,0% 26 Netherlands 86,8 0,7% 83,7% 27 Egypt 86,8 0,7% 84,4% 28 Argentina 84,5 0,7% 85,1% 29 Venezuela 82,9 0,7% 85,7% 30 Malaysia 81,1 0,6% 86,4% 31 Singapore 75,7 0,6% 86,9% 32 Pakistan 69,6 0,5% 87,5% 33 Kazakhstan 62,0 0,5% 88,0% 34 Belgium 61,7 0,5% 88,5% 35 Vietnam 54,4 0,4% 88,9% 36 Sw eden 51,0 0,4% 89,3% 37 Uzbekistan 47,8 0,4% 89,7% 38 Algeria 46,6 0,4% 90,0% 39 Norw ay 45,0 0,4% 90,4% 40 Czech Republic 41,9 0,3% 90,7% Source of data: BP Statistical Review 2014 Mtoe ROW 947,4 8,6% 105% 2013 TOTAL World ,0% 100% Rank Country Tot. Fossils % Total Cum. % 1 China 2 578,1 23,4% 23,4% 2 US 1 957,7 17,7% 41,1% 3 Russia 618,7 5,6% 46,7% 4 India 545,9 4,9% 51,7% 5 Japan 442,7 4,0% 55,7% 6 Germany 268,7 2,4% 58,1% 7 Iran 239,5 2,2% 60,3% 8 South Korea 237,6 2,2% 62,4% 9 Saudi Arabia 227,7 2,1% 64,5% 10 Canada 216,9 2,0% 66,5% 11 Brazil 180,3 1,6% 68,1% 12 Mexico 176,6 1,6% 69,7% 13 United Kingdom 172,1 1,6% 71,3% 14 Indonesia 162,8 1,5% 72,7% 15 Italy 134,1 1,2% 74,0% 16 France 131,1 1,2% 75,1% 17 South Africa 118,9 1,1% 76,2% 18 Thailand 113,4 1,0% 77,3% 19 Australia 108,1 1,0% 78,2% 20 Turkey 107,2 1,0% 79,2% 21 Taiw an 99,1 0,9% 80,1% 22 United Arab Emirates 97,1 0,9% 81,0% 23 Spain 95,7 0,9% 81,9% 24 Ukraine 95,3 0,9% 82,7% 25 Poland 95,1 0,9% 83,6% 26 Egypt 83,4 0,8% 84,3% 27 Netherlands 83,1 0,8% 85,1% 28 Malaysia 78,7 0,7% 85,8% 29 Singapore 75,4 0,7% 86,5% 30 Argentina 73,3 0,7% 87,1% 31 Venezuela 63,9 0,6% 87,7% 32 Pakistan 61,1 0,6% 88,3% 33 Kazakhstan 60,2 0,5% 88,8% 34 Belgium 49,1 0,4% 89,3% 35 Algeria 46,5 0,4% 89,7% 36 Uzbekistan 45,2 0,4% 90,1% 37 Vietnam 42,1 0,4% 90,5% 38 Kuw ait 37,8 0,3% 90,8% 39 Czech Republic 32,6 0,3% 91,1% 40 Qatar 31,8 0,3% 91,4% 86
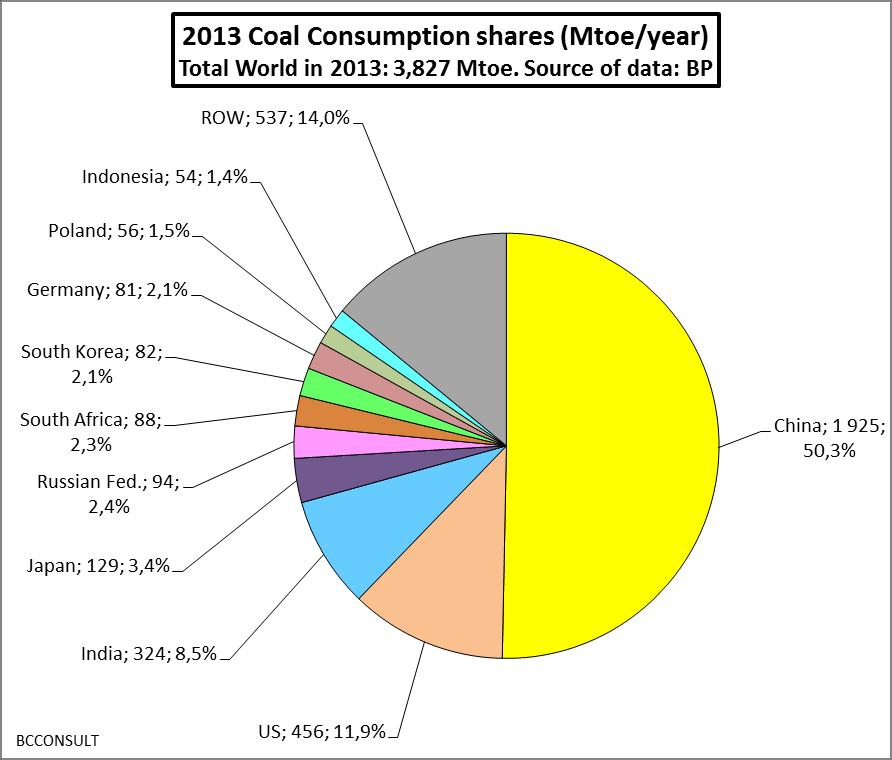
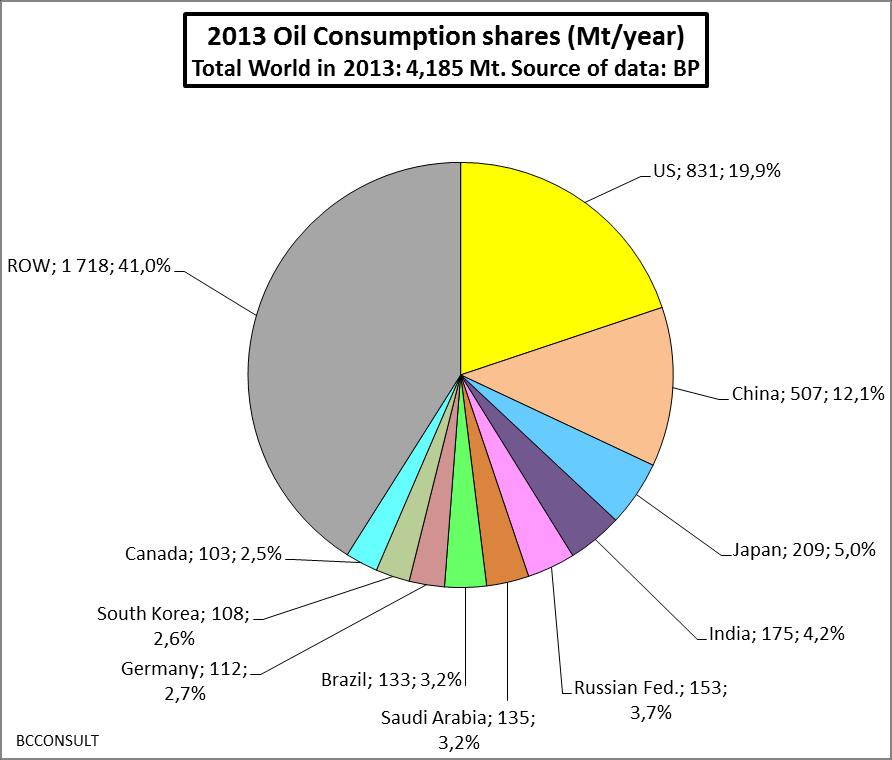
87 Mtoe ROW 502,3 12,0% 105% 2013 TOTAL World ,0% 100% Rank Country Oil % Total Cum. % 1 US 831,0 19,9% 19,9% 2 China 507,4 12,1% 32,0% 3 Japan 208,9 5,0% 37,0% 4 India 175,2 4,2% 41,2% 5 Russia 153,1 3,7% 44,8% 6 Saudi Arabia 135,0 3,2% 48,0% 7 Brazil 132,7 3,2% 51,2% 8 Germany 112,1 2,7% 53,9% 9 South Korea 108,4 2,6% 56,5% 10 Canada 103,5 2,5% 59,0% 11 Iran 92,9 2,2% 61,2% 12 Mexico 89,7 2,1% 63,3% 13 France 80,3 1,9% 65,2% 14 Indonesia 73,8 1,8% 67,0% 15 United Kingdom 69,8 1,7% 68,7% 16 Singapore 65,9 1,6% 70,2% 17 Italy 61,8 1,5% 71,7% 18 Spain 59,3 1,4% 73,1% 19 Thailand 50,4 1,2% 74,3% 20 Australia 47,0 1,1% 75,5% 21 Taiw an 43,4 1,0% 76,5% 22 Netherlands 41,4 1,0% 77,5% 23 Venezuela 36,2 0,9% 78,4% 24 Egypt 35,7 0,9% 79,2% 25 United Arab Emirates 35,6 0,9% 80,1% 26 Turkey 33,1 0,8% 80,9% 27 Malaysia 31,2 0,7% 81,6% 28 Belgium 31,0 0,7% 82,3% 29 Argentina 29,4 0,7% 83,0% 30 South Africa 27,2 0,7% 83,7% 31 Poland 24,0 0,6% 84,3% 32 Pakistan 22,0 0,5% 84,8% 33 Kuw ait 21,8 0,5% 85,3% 34 China Hong Kong SAR 17,7 0,4% 85,7% 35 Chile 17,6 0,4% 86,2% 36 Algeria 17,5 0,4% 86,6% 37 Vietnam 17,4 0,4% 87,0% 38 Sw eden 14,3 0,3% 87,3% 39 Greece 14,0 0,3% 87,7% 40 Colombia 13,9 0,3% 88,0% Source of data: BP Statistical Review 2014 Mtoe ROW 72,1 1,9% 101% 2013 TOTAL World ,0% 100% Rank Country Coal % Total Cum. % 1 China 1 925,3 50,3% 50,3% 2 US 455,7 11,9% 62,2% 3 India 324,3 8,5% 70,7% 4 Japan 128,6 3,4% 74,1% 5 Russia 93,5 2,4% 76,5% 6 South Africa 88,2 2,3% 78,8% 7 South Korea 81,9 2,1% 80,9% 8 Germany 81,3 2,1% 83,1% 9 Poland 56,1 1,5% 84,5% 10 Indonesia 54,4 1,4% 86,0% 11 Australia 45,0 1,2% 87,1% 12 Ukraine 42,6 1,1% 88,2% 13 Taiw an 41,0 1,1% 89,3% 14 United Kingdom 36,5 1,0% 90,3% 15 Kazakhstan 36,1 0,9% 91,2% 16 Turkey 33,0 0,9% 92,1% 17 Canada 20,3 0,5% 92,6% 18 Malaysia 17,0 0,4% 93,0% 19 Czech Republic 16,5 0,4% 93,5% 20 Thailand 16,0 0,4% 93,9% 21 Vietnam 15,9 0,4% 94,3% 22 Italy 14,6 0,4% 94,7% 23 Brazil 13,7 0,4% 95,1% 24 Mexico 12,4 0,3% 95,4% 25 France 12,2 0,3% 95,7% 26 Philippines 10,5 0,3% 96,0% 27 Spain 10,3 0,3% 96,2% 28 Netherlands 8,3 0,2% 96,5% 29 China Hong Kong SAR 7,8 0,2% 96,7% 30 Chile 7,4 0,2% 96,9% 31 Israel 7,3 0,2% 97,0% 32 Greece 7,1 0,2% 97,2% 33 Bulgaria 5,9 0,2% 97,4% 34 Romania 5,6 0,1% 97,5% 35 Pakistan 4,4 0,1% 97,6% 36 Colombia 4,3 0,1% 97,8% 37 Finland 3,7 0,1% 97,9% 38 Austria 3,6 0,1% 97,9% 39 Denmark 3,2 0,1% 98,0% 40 Slovakia 3,1 0,1% 98,1% 87
88 Mtoe ROW 231,5 7,7% 104% 2013 TOTAL World ,0% 100% Rank Country Gas % Total Cum. % 1 US 671,0 22,2% 22,2% 2 Russia 372,1 12,3% 34,5% 3 Iran 146,0 4,8% 39,4% 4 China 145,5 4,8% 44,2% 5 Japan 105,2 3,5% 47,7% 6 Canada 93,1 3,1% 50,8% 7 Saudi Arabia 92,7 3,1% 53,8% 8 Germany 75,3 2,5% 56,3% 9 Mexico 74,5 2,5% 58,8% 10 United Kingdom 65,8 2,2% 61,0% 11 United Arab Emirates 61,5 2,0% 63,0% 12 Italy 57,8 1,9% 64,9% 13 South Korea 47,3 1,6% 66,5% 14 Thailand 47,0 1,6% 68,0% 15 India 46,3 1,5% 69,6% 16 Egypt 46,3 1,5% 71,1% 17 Argentina 43,2 1,4% 72,5% 18 Turkey 41,1 1,4% 73,9% 19 Uzbekistan 40,7 1,3% 75,2% 20 Ukraine 40,5 1,3% 76,6% 21 France 38,6 1,3% 77,8% 22 Pakistan 34,7 1,1% 79,0% 23 Indonesia 34,6 1,1% 80,1% 24 Brazil 33,9 1,1% 81,3% 25 Netherlands 33,4 1,1% 82,4% 26 Malaysia 30,6 1,0% 83,4% 27 Algeria 29,1 1,0% 84,3% 28 Venezuela 27,5 0,9% 85,3% 29 Spain 26,1 0,9% 86,1% 30 Qatar 23,3 0,8% 86,9% 31 Trinidad & Tobago 20,2 0,7% 87,6% 32 Turkmenistan 20,0 0,7% 88,2% 33 Bangladesh 19,7 0,7% 88,9% 34 Belarus 16,5 0,5% 89,4% 35 Australia 16,1 0,5% 89,9% 36 Kuw ait 16,0 0,5% 90,5% 37 Belgium 15,1 0,5% 91,0% 38 Poland 15,0 0,5% 91,5% 39 Taiw an 14,7 0,5% 92,0% 40 Romania 11,2 0,4% 92,3% Source of data: BP Statistical Review 2014 Mtoe ROW 1,7 0,3% 100% 2013 TOTAL World ,0% 100% Rank Country Nuclear % Total Cum. % 1 US 187,9 33,4% 33,4% 2 France 95,9 17,0% 50,4% 3 Russia 39,1 6,9% 57,3% 4 South Korea 31,4 5,6% 62,9% 5 China 25,0 4,4% 67,4% 6 Canada 23,1 4,1% 71,5% 7 Germany 22,0 3,9% 75,4% 8 Ukraine 18,8 3,3% 78,7% 9 United Kingdom 16,0 2,8% 81,6% 10 Sw eden 15,1 2,7% 84,2% 11 Spain 12,8 2,3% 86,5% 12 Belgium 9,6 1,7% 88,2% 13 Taiw an 9,4 1,7% 89,9% 14 India 7,5 1,3% 91,2% 15 Czech Republic 7,0 1,2% 92,5% 16 Sw itzerland 5,9 1,1% 93,5% 17 Finland 5,4 1,0% 94,5% 18 Slovakia 3,6 0,6% 95,1% 19 Hungary 3,5 0,6% 95,7% 20 Brazil 3,3 0,6% 96,3% 21 Japan 3,3 0,6% 96,9% 22 Bulgaria 3,2 0,6% 97,5% 23 South Africa 3,1 0,6% 98,0% 24 Mexico 2,7 0,5% 98,5% 25 Romania 2,6 0,5% 99,0% 26 Argentina 1,4 0,2% 99,2% 27 Pakistan 1,1 0,2% 99,4% 28 Iran 0,9 0,2% 99,6% 29 Netherlands 0,6 0,1% 99,7% 30 Saudi Arabia 0,0 0,0% 99,7% 31 Indonesia 0,0 0,0% 99,7% 32 Singapore 0,0 0,0% 99,7% 33 Italy 0,0 0,0% 99,7% 34 Thailand 0,0 0,0% 99,7% 35 Australia 0,0 0,0% 99,7% 36 Venezuela 0,0 0,0% 99,7% 37 Egypt 0,0 0,0% 99,7% 38 United Arab Emirates 0,0 0,0% 99,7% 39 Turkey 0,0 0,0% 99,7% 40 Malaysia 0,0 0,0% 99,7% 88
89 Mtoe ROW 7,8 2,8% 101% 2013 TOTAL World ,0% 100% Rank Country Non Hydo RE % Total Cum. % 1 US 58,6 21,0% 21,0% 2 China 42,9 15,4% 36,4% 3 Germany 29,7 10,6% 47,0% 4 Spain 16,8 6,0% 53,0% 5 Brazil 13,2 4,7% 57,7% 6 Italy 13,0 4,6% 62,4% 7 India 11,7 4,2% 66,6% 8 United Kingdom 10,9 3,9% 70,5% 9 Japan 9,4 3,4% 73,9% 10 France 5,9 2,1% 76,0% 11 Sw eden 5,0 1,8% 77,8% 12 Canada 4,3 1,5% 79,3% 13 Poland 4,2 1,5% 80,8% 14 Denmark 3,7 1,3% 82,1% 15 Portugal 3,6 1,3% 83,4% 16 Australia 3,4 1,2% 84,6% 17 Netherlands 3,0 1,1% 85,7% 18 Belgium 2,8 1,0% 86,7% 19 Finland 2,7 1,0% 87,7% 20 Mexico 2,5 0,9% 88,6% 21 Philippines 2,4 0,8% 89,4% 22 Indonesia 2,3 0,8% 90,3% 23 Turkey 2,2 0,8% 91,1% 24 New Zealand 2,0 0,7% 91,8% 25 Austria 1,9 0,7% 92,5% 26 Czech Republic 1,5 0,5% 93,0% 27 Greece 1,4 0,5% 93,5% 28 Chile 1,4 0,5% 94,0% 29 Taiw an 1,2 0,4% 94,4% 30 Romania 1,1 0,4% 94,8% 31 Republic of Ireland 1,1 0,4% 95,2% 32 South Korea 1,0 0,4% 95,6% 33 Thailand 1,0 0,3% 95,9% 34 Argentina 0,7 0,2% 96,2% 35 Bulgaria 0,6 0,2% 96,4% 36 Norw ay 0,5 0,2% 96,6% 37 Hungary 0,5 0,2% 96,8% 38 Sw itzerland 0,5 0,2% 97,0% 39 Egypt 0,4 0,1% 97,1% 40 Slovakia 0,3 0,1% 97,2% Source of data: BP Statistical Review 2014 Mtoe ROW 112,6 9,9% 102% 2013 TOTAL World ,0% 100% Rank Country Total RE % Total Cum. % 1 China 249,2 22,0% 22,0% 2 US 120,2 10,6% 32,5% 3 Brazil 100,4 8,8% 41,4% 4 Canada 92,9 8,2% 49,6% 5 India 41,6 3,7% 53,2% 6 Russia 41,1 3,6% 56,9% 7 Germany 34,3 3,0% 59,9% 8 Norw ay 29,7 2,6% 62,5% 9 Japan 28,0 2,5% 65,0% 10 Spain 25,1 2,2% 67,2% 11 Italy 24,6 2,2% 69,4% 12 France 21,4 1,9% 71,2% 13 Venezuela 19,0 1,7% 72,9% 14 Sw eden 18,9 1,7% 74,6% 15 Turkey 15,6 1,4% 76,0% 16 Vietnam 12,3 1,1% 77,0% 17 United Kingdom 12,0 1,1% 78,1% 18 Austria 10,3 0,9% 79,0% 19 Colombia 10,2 0,9% 79,9% 20 Argentina 9,9 0,9% 80,8% 21 Sw itzerland 9,0 0,8% 81,6% 22 Mexico 8,7 0,8% 82,3% 23 Australia 8,0 0,7% 83,0% 24 Pakistan 7,4 0,7% 83,7% 25 New Zealand 7,3 0,6% 84,3% 26 Portugal 6,6 0,6% 84,9% 27 Indonesia 5,9 0,5% 85,4% 28 Chile 5,8 0,5% 85,9% 29 Finland 5,6 0,5% 86,4% 30 Peru 5,0 0,4% 86,9% 31 Poland 4,8 0,4% 87,3% 32 Romania 4,6 0,4% 87,7% 33 Philippines 4,5 0,4% 88,1% 34 Denmark 3,7 0,3% 88,4% 35 Iran 3,4 0,3% 88,7% 36 Ukraine 3,4 0,3% 89,0% 37 Egypt 3,3 0,3% 89,3% 38 Netherlands 3,1 0,3% 89,6% 39 Belgium 2,9 0,3% 89,8% 40 Greece 2,9 0,3% 90,1% 89
90 Source of data: BP Statistical Review 2014 Mtoe ROW 128,7 7,6% 102% 2013 TOTAL World ,0% 100% Rank Country Non Fossi % Total Cum. % 1 US 308,1 18,1% 18,1% 2 China 274,2 16,1% 34,3% 3 France 117,2 6,9% 41,2% 4 Canada 116,0 6,8% 48,0% 5 Brazil 103,8 6,1% 54,1% 6 Russia 80,3 4,7% 58,9% 7 Germany 56,4 3,3% 62,2% 8 India 49,1 2,9% 65,1% 9 Spain 37,9 2,2% 67,3% 10 Sw eden 34,0 2,0% 69,3% 11 South Korea 33,7 2,0% 71,3% 12 Japan 31,3 1,8% 73,1% 13 Norw ay 29,7 1,8% 74,9% 14 United Kingdom 27,9 1,6% 76,5% 15 Italy 24,6 1,5% 78,0% 16 Ukraine 22,2 1,3% 79,3% 17 Venezuela 19,0 1,1% 80,4% 18 Turkey 15,6 0,9% 81,3% 19 Sw itzerland 15,0 0,9% 82,2% 20 Belgium 12,6 0,7% 83,0% 21 Vietnam 12,3 0,7% 83,7% 22 Taiw an 11,8 0,7% 84,4% 23 Mexico 11,4 0,7% 85,0% 24 Argentina 11,2 0,7% 85,7% 25 Finland 11,0 0,6% 86,3% 26 Austria 10,3 0,6% 87,0% 27 Colombia 10,2 0,6% 87,6% 28 Czech Republic 9,3 0,5% 88,1% 29 Pakistan 8,5 0,5% 88,6% 30 Australia 8,0 0,5% 89,1% 31 New Zealand 7,3 0,4% 89,5% 32 Romania 7,2 0,4% 89,9% 33 Portugal 6,6 0,4% 90,3% 34 Indonesia 5,9 0,3% 90,7% 35 Chile 5,8 0,3% 91,0% 36 Slovakia 5,0 0,3% 91,3% 37 Peru 5,0 0,3% 91,6% 38 Bulgaria 4,8 0,3% 91,9% 39 Poland 4,8 0,3% 92,2% 40 Philippines 4,5 0,3% 92,4% 90
91 ANNEX 2: Top 40 Countries by % of Primary Energy Consumption (PEC) by Sources in
92 2013 TOTAL World 86,7% Rank Country % Fossil 1 Qatar 100,0% 2 Kuw ait 100,0% 3 Saudi Arabia 100,0% 4 China Hong Kong SAR 100,0% 5 Turkmenistan 100,0% 6 United Arab Emirates 100,0% 7 Trinidad & Tobago 100,0% 8 Algeria 99,8% 9 Belarus 99,7% 10 Singapore 99,6% 11 Israel 99,4% 12 Bangladesh 99,1% 13 Iran 98,2% 14 Thailand 98,1% 15 Azerbaijan 97,3% 16 South Africa 97,2% 17 Malaysia 97,0% 18 Kazakhstan 97,0% 19 Indonesia 96,5% 20 Egypt 96,2% 21 Netherlands 95,8% 22 Poland 95,2% 23 Uzbekistan 94,6% 24 Lithuania 94,2% 25 Mexico 94,0% 26 Japan 93,4% 27 Australia 93,1% 28 India 91,7% 29 Republic of Ireland 90,6% 30 China 90,4% 31 Greece 89,5% 32 Taiw an 89,3% 33 Russia 88,5% 34 Pakistan 87,8% 35 South Korea 87,6% 36 Turkey 87,3% 37 Argentina 86,7% 38 US 86,4% 39 United Kingdom 86,0% 40 Philippines 85,7% 2013 TOTAL World 32,87% Rank Country % Oil 1 Singapore 87,1% 2 Ecuador 78,8% 3 China Hong Kong SAR 63,6% 4 Saudi Arabia 59,3% 5 Kuw ait 57,7% 6 Greece 51,5% 7 Chile 50,7% 8 Republic of Ireland 50,6% 9 Belgium 50,3% 10 Lithuania 47,9% 11 Netherlands 47,7% 12 Mexico 47,7% 13 Brazil 46,7% 14 Peru 46,0% 15 Portugal 45,4% 16 Spain 44,4% 17 Japan 44,1% 18 Indonesia 43,8% 19 Venezuela 43,7% 20 Israel 43,6% 21 Thailand 43,6% 22 Denmark 43,4% 23 Philippines 43,0% 24 Egypt 41,1% 25 Australia 40,5% 26 South Korea 40,0% 27 Taiw an 39,1% 28 Sw itzerland 39,1% 29 Italy 38,9% 30 Malaysia 38,5% 31 Iran 38,1% 32 Algeria 37,5% 33 Austria 36,8% 34 United Arab Emirates 36,7% 35 US 36,7% 36 Colombia 36,5% 37 Azerbaijan 36,0% 38 New Zealand 35,7% 39 United Kingdom 34,9% 40 Argentina 34,8% Source of data: BP Statistical Review TOTAL World 30,06% Rank Country % Coal 1 South Africa 72,05% 2 China 67,50% 3 Kazakhstan 58,20% 4 Poland 56,15% 5 India 54,51% 6 Czech Republic 39,35% 7 Australia 38,78% 8 Taiw an 36,94% 9 Ukraine 36,26% 10 Bulgaria 34,54% 11 Philippines 33,14% 12 Indonesia 32,25% 13 Israel 30,30% 14 South Korea 30,17% 15 Vietnam 29,24% 16 China Hong Kong SAR 27,86% 17 Japan 27,12% 18 Turkey 26,87% 19 Greece 26,12% 20 Germany 25,01% 21 Chile 21,26% 22 Malaysia 20,91% 23 US 20,11% 24 Slovakia 18,95% 25 United Kingdom 18,27% 26 Denmark 17,70% 27 Romania 16,90% 28 Finland 14,18% 29 Thailand 13,81% 30 Russia 13,38% 31 Hungary 12,99% 32 Colombia 11,31% 33 Portugal 11,28% 34 Austria 10,55% 35 Republic of Ireland 9,92% 36 Netherlands 9,60% 37 Italy 9,19% 38 Spain 7,74% 39 New Zealand 7,60% 40 Mexico 6,62% 2013 TOTAL World 23,73% Rank Country % Gas 1 Trinidad & Tobago 91,60% 2 Uzbekistan 85,12% 3 Turkmenistan 76,09% 4 Bangladesh 73,81% 5 Qatar 73,25% 6 Belarus 65,21% 7 United Arab Emirates 63,32% 8 Algeria 62,35% 9 Azerbaijan 61,35% 10 Iran 59,85% 11 Egypt 53,35% 12 Russia 53,24% 13 Argentina 51,11% 14 Pakistan 49,86% 15 Lithuania 42,95% 16 Kuw ait 42,29% 17 Saudi Arabia 40,72% 18 Thailand 40,67% 19 Mexico 39,62% 20 Netherlands 38,44% 21 Hungary 37,74% 22 Malaysia 37,68% 23 Italy 36,41% 24 Ukraine 34,47% 25 Romania 34,01% 26 Turkey 33,45% 27 Venezuela 33,15% 28 United Kingdom 32,89% 29 Republic of Ireland 30,05% 30 US 29,61% 31 Slovakia 29,32% 32 Canada 27,98% 33 Peru 27,15% 34 Israel 25,47% 35 Colombia 25,37% 36 Belgium 24,55% 37 Germany 23,16% 38 Austria 22,45% 39 Japan 22,19% 40 Indonesia 20,50% 92
93 2013 TOTAL World 4,42% Rank Country % Nuclear 1 France 38,6% 2 Sw eden 29,7% 3 Slovakia 21,5% 4 Finland 20,7% 5 Sw itzerland 19,6% 6 Bulgaria 18,8% 7 Hungary 17,0% 8 Czech Republic 16,6% 9 Ukraine 16,0% 10 Belgium 15,6% 11 South Korea 11,6% 12 Spain 9,6% 13 Taiw an 8,5% 14 US 8,3% 15 United Kingdom 8,0% 16 Romania 8,0% 17 Canada 6,9% 18 Germany 6,8% 19 Russia 5,6% 20 South Africa 2,6% 21 Argentina 1,6% 22 Pakistan 1,5% 23 Mexico 1,4% 24 India 1,3% 25 Brazil 1,2% 26 China 0,9% 27 Netherlands 0,7% 28 Japan 0,7% 29 Iran 0,4% 30 Norw ay 0,0% 31 Colombia 0,0% 32 New Zealand 0,0% 33 Austria 0,0% 34 Venezuela 0,0% 35 Vietnam 0,0% 36 Peru 0,0% 37 Ecuador 0,0% 38 Portugal 0,0% 39 Chile 0,0% 40 Turkey 0,0% 2013 TOTAL World 6,7% Rank Country % Hydro 1 Norw ay 64,9% 2 Brazil 30,7% 3 Sw itzerland 28,4% 4 Sw eden 27,3% 5 Canada 26,6% 6 Colombia 26,4% 7 New Zealand 26,3% 8 Austria 24,7% 9 Venezuela 22,9% 10 Vietnam 22,5% 11 Peru 21,9% 12 Ecuador 17,0% 13 Portugal 12,9% 14 Chile 12,8% 15 Finland 11,1% 16 Turkey 10,9% 17 Argentina 10,9% 18 Pakistan 10,7% 19 Romania 10,4% 20 Italy 7,3% 21 China 7,2% 22 Slovakia 7,0% 23 Philippines 6,9% 24 France 6,2% 25 Spain 6,2% 26 Russia 5,9% 27 Uzbekistan 5,4% 28 Bulgaria 5,4% 29 Greece 5,3% 30 India 5,0% 31 Japan 3,9% 32 Australia 3,9% 33 Egypt 3,4% 34 Mexico 3,3% 35 Kazakhstan 3,0% 36 US 2,7% 37 Ukraine 2,7% 38 Azerbaijan 2,7% 39 Malaysia 2,6% 40 Indonesia 2,1% Source of data: BP Statistical Review TOTAL World 2,19% Rank Country % Non hyd RE 1 Denmark 20,3% 2 Portugal 15,1% 3 Spain 12,6% 4 New Zealand 10,3% 5 Finland 10,3% 6 Sw eden 9,8% 7 Germany 9,1% 8 Republic of Ireland 8,5% 9 Italy 8,2% 10 Philippines 7,4% 11 Austria 5,6% 12 United Kingdom 5,4% 13 Greece 5,2% 14 Brazil 4,7% 15 Belgium 4,6% 16 Poland 4,2% 17 Chile 4,0% 18 Lithuania 3,7% 19 Bulgaria 3,7% 20 Czech Republic 3,5% 21 Netherlands 3,5% 22 Romania 3,4% 23 Australia 3,0% 24 Hungary 2,6% 25 US 2,6% 26 France 2,4% 27 Japan 2,0% 28 India 2,0% 29 Slovakia 1,8% 30 Turkey 1,8% 31 Sw itzerland 1,6% 32 China 1,5% 33 Indonesia 1,4% 34 Mexico 1,3% 35 Canada 1,3% 36 Norw ay 1,2% 37 Taiw an 1,1% 38 Peru 1,1% 39 Thailand 0,8% 40 Argentina 0,8% 2013 TOTAL World 8,9% Rank Country % RE 1 Norw ay 66,1% 2 Sw eden 37,0% 3 New Zealand 36,6% 4 Brazil 35,4% 5 Austria 30,2% 6 Sw itzerland 30,0% 7 Portugal 28,0% 8 Canada 27,9% 9 Colombia 26,8% 10 Peru 23,0% 11 Venezuela 22,9% 12 Vietnam 22,5% 13 Finland 21,4% 14 Denmark 20,3% 15 Spain 18,8% 16 Ecuador 17,6% 17 Chile 16,8% 18 Italy 15,5% 19 Philippines 14,3% 20 Romania 13,8% 21 Turkey 12,7% 22 Argentina 11,7% 23 Pakistan 10,7% 24 Germany 10,6% 25 Greece 10,5% 26 Republic of Ireland 9,4% 27 Bulgaria 9,1% 28 Slovakia 8,9% 29 China 8,7% 30 France 8,6% 31 India 7,0% 32 Australia 6,9% 33 United Kingdom 6,0% 34 Japan 5,9% 35 Russia 5,9% 36 Lithuania 5,8% 37 Czech Republic 5,6% 38 Uzbekistan 5,4% 39 US 5,3% 40 Poland 4,8% 93
94 Source of data: BP Statistical Review TOTAL World 13,3% Rank Country % Non Fossil 1 Sw eden 66,7% 2 Norw ay 66,1% 3 Sw itzerland 49,6% 4 France 47,2% 5 Finland 42,1% 6 New Zealand 36,6% 7 Brazil 36,5% 8 Canada 34,8% 9 Slovakia 30,3% 10 Austria 30,2% 11 Spain 28,4% 12 Portugal 28,0% 13 Bulgaria 27,8% 14 Colombia 26,8% 15 Peru 23,0% 16 Venezuela 22,9% 17 Vietnam 22,5% 18 Czech Republic 22,2% 19 Romania 21,8% 20 Belgium 20,4% 21 Denmark 20,3% 22 Hungary 19,9% 23 Ukraine 18,9% 24 Ecuador 17,6% 25 Germany 17,3% 26 Chile 16,8% 27 Italy 15,5% 28 Philippines 14,3% 29 United Kingdom 14,0% 30 US 13,6% 31 Argentina 13,3% 32 Turkey 12,7% 33 South Korea 12,4% 34 Pakistan 12,2% 35 Russia 11,5% 36 Taiw an 10,7% 37 Greece 10,5% 38 China 9,6% 39 Republic of Ireland 9,4% 40 India 8,3% 41 Australia 6,9% 42 Japan 6,6% 43 Mexico 6,0% 44 Lithuania 5,8% 45 Uzbekistan 5,4% 46 Poland 4,8% 47 Netherlands 4,2% 48 Egypt 3,8% 49 Indonesia 3,5% 50 Kazakhstan 3,0% 51 Malaysia 3,0% 52 South Africa 2,8% 53 Azerbaijan 2,7% 54 Thailand 1,9% 55 Iran 1,8% 56 Bangladesh 0,9% 57 Israel 0,6% 58 Singapore 0,4% 59 Belarus 0,3% 60 Algeria 0,2% 61 Trinidad & Tobago 0,0% 62 United Arab Emirates 0,0% 63 Turkmenistan 0,0% 64 China Hong Kong SAR 0,0% 65 Kuw ait 0,0% 66 Qatar 0,0% 67 Saudi Arabia 0,0% 94
The National Police Immigration Service (NPIS) forcibly returned 412 persons in December 2017, and 166 of these were convicted offenders.
 forcibly returned 412 persons in December 2017, and 166 of these were convicted offenders.") Monthly statistics December 2017: Forced returns from Norway The National Police Immigration Service (NPIS) forcibly returned 412 persons in December 2017, and 166 of these were convicted offenders. The
Monthly statistics December 2017: Forced returns from Norway The National Police Immigration Service (NPIS) forcibly returned 412 persons in December 2017, and 166 of these were convicted offenders. The
Translation from Norwegian
 Statistics for May 2018 Forced returns from Norway The National Police Immigration Service (NPIS) forcibly returned 402 persons in May 2018, and 156 of these were convicted offenders. The NPIS is responsible
VISA POLICY OF THE REPUBLIC OF KAZAKHSTAN
 VISA POLICY OF THE REPUBLIC OF KAZAKHSTAN Country Diplomatic Service National Term of visafree stay CIS countries 1 Azerbaijan visa-free visa-free visa-free 30 days 2 Kyrgyzstan visa-free visa-free visa-free
Delays in the registration process may mean that the real figure is higher.
 Monthly statistics December 2013: Forced returns from Norway The National Police Immigration Service (NPIS) forcibly returned 483 persons in December 2013. 164 of those forcibly returned in December 2013
GLOBAL RISKS OF CONCERN TO BUSINESS WEF EXECUTIVE OPINION SURVEY RESULTS SEPTEMBER 2017
 GLOBAL RISKS OF CONCERN TO BUSINESS WEF EXECUTIVE OPINION SURVEY RESULTS SEPTEMBER 2017 GLOBAL RISKS OF CONCERN TO BUSINESS Results from the World Economic Forum Executive Opinion Survey 2017 Survey and
The National Police Immigration Service (NPIS) returned 444 persons in August 2018, and 154 of these were convicted offenders.
 returned 444 persons in August 2018, and 154 of these were convicted offenders.") Monthly statistics August 2018 Forced returns from Norway The National Police Immigration Service (NPIS) returned 444 persons in August 2018, and 154 of these were convicted offenders. The NPIS is responsible
Monthly statistics August 2018 Forced returns from Norway The National Police Immigration Service (NPIS) returned 444 persons in August 2018, and 154 of these were convicted offenders. The NPIS is responsible
The NPIS is responsible for forcibly returning those who are not entitled to stay in Norway.
 Monthly statistics December 2014: Forced returns from Norway The National Police Immigration Service (NPIS) forcibly returned 532 persons in December 2014. 201 of these returnees had a criminal conviction
LIST OF CHINESE EMBASSIES OVERSEAS Extracted from Ministry of Foreign Affairs of the People s Republic of China *
 ANNEX 1 LIST OF CHINESE EMBASSIES OVERSEAS Extracted from Ministry of Foreign Affairs of the People s Republic of China * ASIA Chinese Embassy in Afghanistan Chinese Embassy in Bangladesh Chinese Embassy
Tourism Highlights International Tourist Arrivals, Average Length of Stay, Hotels Occupancy & Tourism Receipts Years
 KINGDOM OF CAMBODIAA NATION RELIGION KING 3 TOURISM STATISTICS REPORT Oct tober 2013 MINISTRY OF TOURISM Statisticss and Tourism Information Department No. A3, Street 169, Sangkat Veal Vong, Khann 7 Makara,
Contributions to UNHCR For Budget Year 2014 As at 31 December 2014
 1 UNITED STATES OF AMERICA 1,280,827,870 2 EUROPEAN UNION 271,511,802 3 UNITED KINGDOM 4 JAPAN 5 GERMANY 6 SWEDEN 7 KUWAIT 8 SAUDI ARABIA *** 203,507,919 181,612,466 139,497,612 134,235,153 104,356,762
Countries for which a visa is required to enter Colombia
 Albania EASTERN EUROPE Angola SOUTH AFRICA Argelia (***) Argentina SOUTH AMERICA Australia OCEANIA Austria Azerbaijan(**) EURASIA Bahrain MIDDLE EAST Bangladesh SOUTH ASIA Barbados CARIBBEAN AMERICA Belgium
World Refugee Survey, 2001
 World Refugee Survey, 2001 Refugees in Africa: 3,346,000 "Host" Country Home Country of Refugees Number ALGERIA Western Sahara, Palestinians 85,000 ANGOLA Congo-Kinshasa 12,000 BENIN Togo, Other 4,000
The Conference Board Total Economy Database Summary Tables November 2016
 The Conference Board Total Economy Database Summary Tables November 2016 About This document contains a number of tables and charts outlining the most important trends from the latest update of the Total
Human Resources in R&D
 NORTH AMERICA AND WESTERN EUROPE EAST ASIA AND THE PACIFIC CENTRAL AND EASTERN EUROPE SOUTH AND WEST ASIA LATIN AMERICA AND THE CARIBBEAN ARAB STATES SUB-SAHARAN AFRICA CENTRAL ASIA 1.8% 1.9% 1. 1. 0.6%
SEVERANCE PAY POLICIES AROUND THE WORLD
 SEVERANCE PAY POLICIES AROUND THE WORLD SEVERANCE PAY POLICIES AROUND THE WORLD No one likes to dwell on lay-offs and terminations, but severance policies are a major component of every HR department s
The National Police Immigration Service (NPIS) forcibly returned 375 persons in March 2018, and 136 of these were convicted offenders.
 forcibly returned 375 persons in March 2018, and 136 of these were convicted offenders.") Statistics March 2018: Forced returns from Norway The National Police Immigration Service (NPIS) forcibly returned 375 persons in March 2018, and 136 of these were convicted offenders. The NPIS is responsible
Statistics March 2018: Forced returns from Norway The National Police Immigration Service (NPIS) forcibly returned 375 persons in March 2018, and 136 of these were convicted offenders. The NPIS is responsible
Return of convicted offenders
 Monthly statistics December : Forced returns from Norway The National Police Immigration Service (NPIS) forcibly returned 869 persons in December, and 173 of these were convicted offenders. The NPIS forcibly
Copyright Act - Subsidiary Legislation CHAPTER 311 COPYRIGHT ACT. SUBSIDIARY LEGlSLA non. List o/subsidiary Legislation
 Copyright Act - Subsidiary Legislation CAP. 311 CHAPTER 311 COPYRIGHT ACT SUBSIDIARY LEGlSLA non List o/subsidiary Legislation Page I. Copyright (Specified Countries) Order... 83 81 [Issue 1/2009] LAWS
India, Bangladesh, Bhutan, Nepal and Sri Lanka: Korea (for vaccine product only):
:") Asia Pacific Local Safety Office Australia & New Zealand: LSO_aust@its.jnj.com China: XJPADEDESK@ITS.JNJ.COM Hong Kong & Machu: drugsafetyhk@its.jnj.com India, Bangladesh, Bhutan, Nepal and Sri Lanka:
Asia Pacific Local Safety Office Australia & New Zealand: LSO_aust@its.jnj.com China: XJPADEDESK@ITS.JNJ.COM Hong Kong & Machu: drugsafetyhk@its.jnj.com India, Bangladesh, Bhutan, Nepal and Sri Lanka:
Contracting Parties to the Ramsar Convention
 Contracting Parties to the Ramsar Convention 14/12/2016 Number of Contracting Parties: 169 Country Entry into force Notes Albania 29.02.1996 Algeria 04.03.1984 Andorra 23.11.2012 Antigua and Barbuda 02.10.2005
Regional Scores. African countries Press Freedom Ratings 2001
 Regional Scores African countries Press Freedom 2001 Algeria Angola Benin Botswana Burkina Faso Burundi Cape Verde Cameroon Central African Republic Chad Comoros Congo (Brazzaville) Congo (Kinshasa) Cote
WORLDWIDE DISTRIBUTION OF PRIVATE FINANCIAL ASSETS
 WORLDWIDE DISTRIBUTION OF PRIVATE FINANCIAL ASSETS Munich, November 2018 Copyright Allianz 11/19/2018 1 MORE DYNAMIC POST FINANCIAL CRISIS Changes in the global wealth middle classes in millions 1,250
GUIDELINE OF COMMITTEES IN TASHKENT MODEL UNITED NATIONS CONFERENCE 2019
 GUIDELINE OF COMMITTEES IN TASHKENT MODEL UNITED NATIONS CONFERENCE 2019 THIS DOCUMENT IS A PROPERTY OF WIUT IMUN SOCIETY 2018-2019. Note that all information on these papers can be subject to change.
Country pairings for the second cycle of the Mechanism for the Review of Implementation of the United Nations Convention against Corruption
 Country pairings for the second cycle of the Mechanism for the Review of Implementation of the United Nations Convention against Corruption In year 1, a total of 29 reviews will be conducted: Regional
Country Participation
 Country Participation IN ICP 2003 2006 The current round of the International Comparison Program is the most complex statistical effort yet providing comparable data for about 150 countries worldwide.
Collective Intelligence Daudi Were, Project
 Collective Intelligence Daudi Were, Project Director, @mentalacrobatic Kenya GDP 2002-2007 Kenya General Election Day 2007 underreported unreported Elections UZABE - Nigerian General Election - 2015
The Multidimensional Financial Inclusion MIFI 1
 2016 Report Tracking Financial Inclusion The Multidimensional Financial Inclusion MIFI 1 Financial Inclusion Financial inclusion is an essential ingredient of economic development and poverty reduction
Overview of JODI Gas Milestones and Beta Test Launch
 3 rd Gas Data Transparency Conference 4-5 June 2013, Bali, Indonesia Overview of JODI Gas Milestones and Beta Test Launch Yuichiro Torikata Energy Analyst International Energy Forum Extending the JODI
24. INTERNATIONAL STATISTICS IRAN STATISTICAL YEARBOOK 1394
 IRAN STATISTICAL YEARBOOK 1394 24. INTERNATIONAL STATISTICS Introduction his chapter is to provide proper round for a statistical comparison between Iran and other countries. Sources of the presented statistics
UNITED NATIONS FINANCIAL PRESENTATION. UN Cash Position. 18 May 2007 (brought forward) Alicia Barcena Under Secretary-General for Management
 Alicia Barcena Under Secretary-General for Management") UNITED NATIONS FINANCIAL PRESENTATION UN Cash Position 18 May 2007 (brought forward) Alicia Barcena Under Secretary-General for Management Key Components as at 31 December (Actual) (US$ millions) 2005
UNITED NATIONS FINANCIAL PRESENTATION UN Cash Position 18 May 2007 (brought forward) Alicia Barcena Under Secretary-General for Management Key Components as at 31 December (Actual) (US$ millions) 2005
VACATION AND OTHER LEAVE POLICIES AROUND THE WORLD
 VACATION AND OTHER LEAVE POLICIES AROUND THE WORLD VACATION AND OTHER LEAVE POLICIES AROUND THE WORLD AT A GLANCE ORDER ONLINE GEOGRAPHY 47 COUNTRIES COVERED 5 REGIONS 48 MARKETS Americas Asia Pacific
IMO MANDATORY REPORTS UNDER MARPOL. Analysis and evaluation of deficiency reports and mandatory reports under MARPOL for Note by the Secretariat
 INTERNATIONAL MARITIME ORGANIZATION E IMO SUB-COMMITTEE ON FLAG STATE IMPLEMENTATION 16th session Agenda item 4 FSI 16/4 25 February 2008 Original: ENGLISH MANDATORY REPORTS UNDER MARPOL Analysis and evaluation
KINGDOM OF CAMBODIA NATION RELIGION KING 3 TOURISM STATISTICS REPORT. September 2010
 KINGDOM OF CAMBODIA NATION RELIGION KING 3 TOURISM STATISTICS REPORT September 2010 MINISTRY OF TOURISM Statistics and Tourism Information Department No. A3, Street 169, Sangkat Veal Vong, Khan 7 Makara,
Global Prevalence of Adult Overweight & Obesity by Region
 Country Year of Data Collection Global Prevalence of Adult Overweight & Obesity by Region National /Regional Survey Size Age Category % BMI 25-29.9 %BMI 30+ % BMI 25- %BMI 30+ 29.9 European Region Albania
HUMAN RESOURCES IN R&D
 HUMAN RESOURCES IN R&D This fact sheet presents the latest UIS S&T data available as of July 2011. Regional density of researchers and their field of employment UIS Fact Sheet, August 2011, No. 13 In the
Good Sources of International News on the Internet are: ABC News-
 Directions: AP Human Geography Summer Assignment Ms. Abruzzese Part I- You are required to find, read, and write a description of 5 current events pertaining to a country that demonstrate the IMPORTANCE
Trends in international higher education
 Trends in international higher education 1 Schedule Student decision-making Drivers of international higher education mobility Demographics Economics Domestic tertiary enrolments International postgraduate
Management Systems: Paulo Sampaio - University of Minho. Pedro Saraiva - University of Coimbra PORTUGAL
 Management Systems: A Path to Organizational Sustainability Paulo Sampaio - University of Minho paulosampaio@dps.uminho.ptuminho pt Pedro Saraiva - University of Coimbra pas@eq.uc.pt PORTUGAL Session learning
Cambridge International Examinations Cambridge International Advanced Subsidiary and Advanced Level
 Cambridge International Examinations Cambridge International Advanced Subsidiary and Advanced Level *4898249870-I* GEOGRAPHY 9696/31 Paper 3 Advanced Human Options October/November 2015 INSERT 1 hour 30
Figure 2: Range of scores, Global Gender Gap Index and subindexes, 2016
 Figure 2: Range of s, Global Gender Gap Index and es, 2016 Global Gender Gap Index Yemen Pakistan India United States Rwanda Iceland Economic Opportunity and Participation Saudi Arabia India Mexico United
A Partial Solution. To the Fundamental Problem of Causal Inference
 A Partial Solution To the Fundamental Problem of Causal Inference Some of our most important questions are causal questions. 1,000 5,000 10,000 50,000 100,000 10 5 0 5 10 Level of Democracy ( 10 = Least
Global Variations in Growth Ambitions
 Global Variations in Growth Ambitions Donna Kelley, Babson College 7 th Annual GW October Entrepreneurship Conference World Bank, Washington DC October 13, 216 Wide variation in entrepreneurship rates
Mechanism for the Review of Implementation of the United Nations Convention against Corruption: country pairings for the second review cycle
 Mechanism for the Review of Implementation of the United Nations Convention against Corruption: country pairings for the second review cycle In the first year, a total of 29 reviews will be conducted.
MIGRATION IN SPAIN. "Facebook or face to face? A multicultural exploration of the positive and negative impacts of
 "Facebook or face to face? A multicultural exploration of the positive and negative impacts of Science and technology on 21st century society". MIGRATION IN SPAIN María Maldonado Ortega Yunkai Lin Gerardo
PROTOCOL RELATING TO AN AMENDMENT TO THE CONVENTION ON INTERNATIONAL CIVIL AVIATION ARTICLE 45, SIGNED AT MONTREAL ON 14 JUNE parties.
 PROTOCOL RELATING TO AN AMENDMENT TO THE CONVENTION ON INTERNATIONAL CIVIL AVIATION ARTICLE 45, SIGNED AT MONTREAL ON 14 JUNE 1954 State Entry into force: The Protocol entered into force on 16 May 1958.
PISA 2015 in Hong Kong Result Release Figures and Appendices Accompanying Press Release
 PISA 2015 in Hong Kong Result Release Figures and Appendices Accompanying Press Release Figure 1-7 and Appendix 1,2 Figure 1: Comparison of Hong Kong Students Performance in Science, Reading and Mathematics
CHILE NORTH AMERICA. Egypt, Israel, Oman, Saudi Arabia and UAE. Barge service: Russia Federation, South Korea and Taiwan. USA East Coast and Panama
 EUROPE Bulgaria, Greece, Italy, Netherlands and Turkey Belgium, Denmark, France, Germany, Malta, Netherlands, Poland, Slovenia, Spain and UK Belgium, Germany, Gibraltar, Greece, Italy, Malta, Netherlands,
LIST OF CONTRACTING STATES AND OTHER SIGNATORIES OF THE CONVENTION (as of January 11, 2018)
") ICSID/3 LIST OF CONTRACTING STATES AND OTHER SIGNATORIES OF THE CONVENTION (as of January 11, 2018) The 162 States listed below have signed the Convention on the Settlement of Investment Disputes between
ICSID/3 LIST OF CONTRACTING STATES AND OTHER SIGNATORIES OF THE CONVENTION (as of January 11, 2018) The 162 States listed below have signed the Convention on the Settlement of Investment Disputes between
World Peace Index Its Significance and Contribution to the Scientific Study of World Peace
 World Peace Index Its Significance and Contribution to the Scientific Study of World Peace The 3 rd OECD WORLD FORUM October 29, 2009, BUSAN, KOREA Sang-Hyun Lee Acting Director, The World Peace Forum
Middle School Level. Middle School Section I
 017 Montessori Model UN New York Conference Matrix DISEC ECOFIN SOCHUM LEGAL SPECPOL UNGA5 UNSC Japan 14 People s Republic of China 14 Republic of Angola 14 Republic of France 14 Russian Federation 14
Dashboard. Jun 1, May 30, 2011 Comparing to: Site. 79,209 Visits % Bounce Rate. 231,275 Pageviews. 00:03:20 Avg.
 www.beechworth.com Dashboard Jun 1, 21 - May 3, 211 Comparing to: Site Visits Jun 7 Jul 1 Aug 12 Sep 14 Oct 17 Nov 19 Dec 22 Jan 24 Feb 26 Mar 31 May 3 Site Usage 79,29 Visits 45.87% Bounce Rate 231,275
KINGDOM OF CAMBODIA NATION RELIGION KING 3 TOURISM STATISTICS REPORT. March 2010
 KINGDOM OF CAMBODIA NATION RELIGION KING 3 TOURISM STATISTICS REPORT March 2010 MINISTRY OF TOURISM Statistics and Tourism Information Department No. A3, Street 169, Sangkat Veal Vong, Khan 7 Makara, Phnom
On the Future of Criminal Offender DNA Databases
 The Impact of DNA Technologies On the Future of Criminal Offender DNA Databases Presented by Tim Schellberg Gordon Thomas Honeywell Governmental Affairs Human Identification Solutions Conference Madrid,
Financing of the United Nations peacekeeping forces in the Middle East: United Nations Interim Force in Lebanon
 United Nations General Assembly Distr.: General 5 June 2001 Original: English A/55/681/Add.1 Fifty-fifth session Agenda item 138 (b) Financing of the United Nations peacekeeping forces in the Middle East:
Mechanism for the Review of Implementation of the United Nations Convention against Corruption: country pairings for the second review cycle
 Mechanism for the Review of Implementation of the United Nations Convention against Corruption: country pairings for the second review cycle In the first year, a total of 29 reviews will be conducted.
FREEDOM OF THE PRESS 2008
 FREEDOM OF THE PRESS 2008 Table of Global Press Freedom Rankings 1 Finland 9 Free Iceland 9 Free 3 Denmark 10 Free Norway 10 Free 5 Belgium 11 Free Sweden 11 Free 7 Luxembourg 12 Free 8 Andorra 13 Free
Mapping physical therapy research
 Mapping physical therapy research Supplement Johan Larsson Skåne University Hospital, Revingevägen 2, 247 31 Södra Sandby, Sweden January 26, 2017 Contents 1 Additional maps of Europe, North and South
2018 Social Progress Index
 2018 Social Progress Index The Social Progress Index Framework asks universally important questions 2 2018 Social Progress Index Framework 3 Our best index yet The Social Progress Index is an aggregate
Country pairings for the first review cycle of the Mechanism for the Review of Implementation of the United Nations Convention against Corruption
 Country pairings for the first review cycle of the Mechanism for the Review of Implementation of the United Nations Convention against Corruption In the first year, a total of 27 reviews will be conducted.
Country pairings for the second review cycle of the Mechanism for the Review of Implementation of the United Nations Convention against Corruption
 Country pairings for the second review cycle of the Mechanism for the Review of Implementation of the United Nations Convention against Corruption In the first year, a total of 29 reviews will be conducted.
Share of Countries over 1/3 Urbanized, by GDP per Capita (2012 $) 1960 and 2010
 1960 and 2010") Share of Countries over 1/3 Urbanized, by GDP per Capita (2012 $) 1960 and 2010 Share Urbanized 0.2.4.6.8 1 $0-1000 $1000-2000 $2000-3000 $3000-4000 $4000-5000 1960 2010 Source: World Bank Welfare Economics
Share of Countries over 1/3 Urbanized, by GDP per Capita (2012 $) 1960 and 2010 Share Urbanized 0.2.4.6.8 1 $0-1000 $1000-2000 $2000-3000 $3000-4000 $4000-5000 1960 2010 Source: World Bank Welfare Economics
GLOBAL PRESS FREEDOM RANKINGS
 GLOBAL PRESS FREEDOM RANKINGS 1 Finland 10 Free 2 Norway 11 Free Sweden 11 Free 4 Belgium 12 Free Iceland 12 Free Luxembourg 12 Free 7 Andorra 13 Free Denmark 13 Free Switzerland 13 Free 10 Liechtenstein
geography Bingo Instructions
 Bingo Instructions Host Instructions: Decide when to start and select your goal(s) Designate a judge to announce events Cross off events from the list below when announced Goals: First to get any line
Markets in higher education
 Markets in higher education Simon Marginson Institute of Education (IOE) Conference on The State and Market in Education: Partnership or Competition? The Grundtvig Study Centre Aarhus University and LLAKES,
REPORT OF THE FOURTH SPECIAL SESSION OF THE CONFERENCE OF THE STATES PARTIES
 OPCW Conference of the States Parties Fourth Special Session C-SS-4/3 26 and 27 June 2018 27 June 2018 Original: ENGLISH REPORT OF THE FOURTH SPECIAL SESSION OF THE CONFERENCE OF THE STATES PARTIES 1.
SKILLS, MOBILITY, AND GROWTH
 SKILLS, MOBILITY, AND GROWTH Eric Hanushek Ludger Woessmann Ninth Biennial Federal Reserve System Community Development Research Conference April 2-3, 2015 Washington, DC Commitment to Achievement Growth
APPENDIX 1: MEASURES OF CAPITALISM AND POLITICAL FREEDOM
 1 APPENDIX 1: MEASURES OF CAPITALISM AND POLITICAL FREEDOM All indicators shown below were transformed into series with a zero mean and a standard deviation of one before they were combined. The summary
Hilde C. Bjørnland. BI Norwegian Business School. Advisory Panel on Macroeconomic Models and Methods Oslo, 27 November 2018
 Discussion of OECD Deputy Secretary-General Ludger Schuknecht: The Consequences of Large Fiscal Consolidations: Why Fiscal Frameworks Must Be Robust to Risk Hilde C. Bjørnland BI Norwegian Business School
Global Access Numbers. Global Access Numbers
 Global Access Numbers Below is a list of Global Access Numbers, in order by country. If a Country has an AT&T Direct Number, the audio conference requires two-stage dialing. First, dial the AT&T Direct
Geoterm and Symbol Definition Sentence. consumption. developed country. developing country. gross domestic product (GDP) per capita
 per capita") G E O T E R M S Read Sections 1 and 2. Then create an illustrated dictionary of the Geoterms by completing these tasks: Create a symbol or an illustration to represent each term. Write a definition of
G E O T E R M S Read Sections 1 and 2. Then create an illustrated dictionary of the Geoterms by completing these tasks: Create a symbol or an illustration to represent each term. Write a definition of
New York County Lawyers Association Continuing Legal Education Institute 14 Vesey Street, New York, N.Y (212)
") New York County Lawyers Association Continuing Legal Education Institute 14 Vesey Street, New York, N.Y. 10007 (212) 267-6646 Who is Who in the Global Economy And Why it Matters June 20, 2014; 6:00 PM-6:50
New York County Lawyers Association Continuing Legal Education Institute 14 Vesey Street, New York, N.Y. 10007 (212) 267-6646 Who is Who in the Global Economy And Why it Matters June 20, 2014; 6:00 PM-6:50
TAKING HAPPINESS SERIOUSLY
 TAKING HAPPINESS SERIOUSLY FLACSO-INEGI seminar Mexico City, April 18, 2013 John Helliwell Canadian Institute for Advanced Research and Vancouver School of Economics, UBC In collaboration with Shun Wang,
REGIONAL INTEGRATION IN THE AMERICAS: THE IMPACT OF THE GLOBAL ECONOMIC CRISIS
 REGIONAL INTEGRATION IN THE AMERICAS: THE IMPACT OF THE GLOBAL ECONOMIC CRISIS Conclusions, inter-regional comparisons, and the way forward Barbara Kotschwar, Peterson Institute for International Economics
STATUS OF THE CONVENTION ON THE PROHIBITION OF THE DEVELOPMENT, PRODUCTION, STOCKPILING AND USE OF CHEMICAL WEAPONS AND ON THEIR DESTRUCTION
 OPCW Technical Secretariat S/6/97 4 August 1997 ENGLISH: Only STATUS OF THE CONVENTION ON THE PROHIBITION OF THE DEVELOPMENT, PRODUCTION, STOCKPILING AND USE OF CHEMICAL WEAPONS AND ON THEIR DESTRUCTION
SCALE OF ASSESSMENT OF MEMBERS' CONTRIBUTIONS FOR 1994
 International Atomic Energy Agency GENERAL CONFERENCE Thirtyseventh regular session Item 13 of the provisional agenda [GC(XXXVII)/1052] GC(XXXVII)/1070 13 August 1993 GENERAL Distr. Original: ENGLISH SCALE
Asia Pacific (19) EMEA (89) Americas (31) Nov
 EMEA (89) Americas (31) Nov") Americas (31) Argentina Bahamas Barbados Belize Bermuda Bolivia Brazil Cayman Islands Chile Colombia Costa Rica Curaçao Dominican Republic Ecuador El Salvador Guatemala Honduras Jamaica Nicaragua Panama
Americas (31) Argentina Bahamas Barbados Belize Bermuda Bolivia Brazil Cayman Islands Chile Colombia Costa Rica Curaçao Dominican Republic Ecuador El Salvador Guatemala Honduras Jamaica Nicaragua Panama
South Africa - A publisher s perspective. STM/PASA conference 11 June, 2012, Cape Town Mayur Amin, SVP Research & Academic Relations
 South Africa - A publisher s perspective STM/PASA conference 11 June, 2012, Cape Town Mayur Amin, SVP Research & Academic Relations 0 As a science information company, we have a unique vantage point on
Cotton: World Markets and Trade
 United States Department of Agriculture Foreign Agricultural Service Circular Series FOP - November Cotton: World Markets and Trade Peru Cotton Production, Consumption and Imports Lb. Bales Production
Charting Cambodia s Economy, 1H 2017
 Charting Cambodia s Economy, 1H 2017 Designed to help executives interpret economic numbers and incorporate them into company s planning. Publication Date: January 3 rd, 2017 HELPING EXECUTIVES AROUND
Country pairings for the first cycle of the Mechanism for the Review of Implementation of the United Nations Convention against Corruption
 Country pairings for the first cycle of the Mechanism for the Review of Implementation of the United Nations Convention against Corruption YEAR 1 Group of African States Zambia Zimbabwe Italy Uganda Ghana
Emerging Asian economies lead Global Pay Gap rankings
 For immediate release Emerging Asian economies lead Global Pay Gap rankings China, Thailand and Vietnam top global rankings for pay difference between managers and clerical staff Singapore, 7 May 2008
Toward Inclusive Growth in Indonesia : Improving Trade and Employment
 Toward Inclusive Growth in Indonesia : Improving Trade and Employment Guntur Sugiyarto*) Asian Development Bank Conference on Trade and Employment in a Globalized World. Jakarta, Indonesia, 1-11 Desember
BULGARIAN TRADE WITH EU IN JANUARY 2017 (PRELIMINARY DATA)
") BULGARIAN TRADE WITH EU IN JANUARY 2017 (PRELIMINARY DATA) In January 2017 Bulgarian exports to the EU increased by 7.2% month of 2016 and amounted to 2 426.0 Million BGN (Annex, Table 1 and 2). Main trade
BULGARIAN TRADE WITH EU IN JANUARY 2017 (PRELIMINARY DATA) In January 2017 Bulgarian exports to the EU increased by 7.2% month of 2016 and amounted to 2 426.0 Million BGN (Annex, Table 1 and 2). Main trade
Income and Population Growth
 Supplementary Appendix to the paper Income and by Markus Brueckner and Hannes Schwandt November 2013 downloadable from: https://sites.google.com/site/markusbrucknerresearch/research-papers Table of Contents
The National Police Immigration Service (NPIS) forcibly returned 429 persons in January 2018, and 137 of these were convicted offenders.
 forcibly returned 429 persons in January 2018, and 137 of these were convicted offenders.") Monthly statistics January 2018: Forced returns from Norway The National Police Immigration Service (NPIS) forcibly returned 429 persons in January 2018, and 137 of these were convicted offenders. The
Monthly statistics January 2018: Forced returns from Norway The National Police Immigration Service (NPIS) forcibly returned 429 persons in January 2018, and 137 of these were convicted offenders. The
1994 No DESIGNS
 1994 No. 3219 DESIGNS The Designs (Convention Countries) Order 1994 Made 14th December 1994 Coming into force 13th January 1995 At the Court at Buckingham Palace, the 14th day of December 1994 Present,
2014 BELGIAN FOREIGN TRADE
 2014 BELGIAN FOREIGN TRADE 2 3 01 \\ EXPORTS 6 1.1 Geographical developments 1.2 Sectoral developments 02 \\ IMPORTS 14 2.1 Geographical developments 2.2 Sectoral developments 03 \\ GEOGRAPHICAL TRADE
BULGARIAN TRADE WITH EU IN THE PERIOD JANUARY - MARCH 2016 (PRELIMINARY DATA)
") BULGARIAN TRADE WITH EU IN THE PERIOD JANUARY - MARCH 2016 (PRELIMINARY DATA) In the period January - March 2016 Bulgarian exports to the EU grew by 2.6% in comparison with the same 2015 and amounted to
BULGARIAN TRADE WITH EU IN THE PERIOD JANUARY - MARCH 2016 (PRELIMINARY DATA) In the period January - March 2016 Bulgarian exports to the EU grew by 2.6% in comparison with the same 2015 and amounted to
Montessori Model United Nations - NYC Conference March 2018
 Montessori Model United Nations - NYC Conference March 018 Middle School Level COMMITTEES COUNTRIES Maximum Number of Delegates per Committee DISEC 1 DISEC LEGAL SPECPOL SOCHUM ECOFIN 1 ECOFIN UNSC UNGA
AUSTRALIA S REFUGEE RESPONSE NOT THE MOST GENEROUS BUT IN TOP 25
 19 July 2013 AUSTRALIA S REFUGEE RESPONSE NOT THE MOST GENEROUS BUT IN TOP 25 Australia is not the world s most generous country in its response to refugees but is just inside the top 25, according to
The Strategic Marketing Institute Working Paper
 The Strategic Marketing Institute Working Paper Spending on Food: Implications for Michigan Agriculture William A. Knudson 1-1003 October 2003 Introduction Researchers at the Economic Research Service
THE GLOBAL VILLAGE JUNE 24 AUGUST 3, for future leaders of business and industry LEHIGH UNIVERSITY
 for future leaders of business and industry JUNE 24 AUGUST 3, 2012 CORE AREAS Enhance Leadership and Entrepreneurial Skills Increase Knowledge of Business and Industry Establish a Global Network Clearly
The International Investment Index Report IIRC, Wuhan University
 The International Investment Index Report -14, Wuhan University The International Investment Index Report for to 14 Make international investment simple Introduction International investment continuously
Consumer Barometer Study 2017
 Consumer Barometer Study 2017 The Year of the Mobile Majority As reported mobile internet usage crosses 50% 2 for the first time in all 63 countries covered by the Consumer Barometer Study 1, we look at
Table of country-specific HIV/AIDS estimates and data, end 2001
 Report on the global HIV/AIDS epidemic 2002 Table of country-specific HIV/AIDS estimates and data, end 2001 Global surveillance of HIV/AIDS and sexually transmitted infections (STIs) is a joint effort
1994 No PATENTS
 1994 No. 3220 PATENTS The Patents (Convention Countries) Order 1994 Made 14th December 1994 Laid before Parliament 23rd December 1994 Coming into force 13th January 1995 At the Court at Buckingham Palace,
CENTRAL AMERICA AND THE CARIBBEAN
 CENTRAL AMERICA AND THE CARIBBEAN Antigua and Barbuda No Visa needed Visa needed Visa needed No Visa needed Bahamas No Visa needed Visa needed Visa needed No Visa needed Barbados No Visa needed Visa needed
3. Sustainable Development
 3. Sustainable Development 3.1. Gini index in ASEM countries (2012) 0 10 20 30 40 50 Philippines Russian Federation Thailand Viet Nam Lao PDR Greece Portugal Bulgaria Spain Latvia Italy Lithuania Luxembourg
WORLD MEN S CHAMPIONSHIP 2008
 WORLD MEN S CHAMPIONSHIP 2008 NONTHABURI, THAILAND 21 31 AUGUST, 2008 SF STRIKE BOWL NGAMWONGWAN BULLETIN 1 BUS SERVICE Bus services will be provided on your arrival as well as your departure. Depending
ARABPLAST 2019 FACT SHEET
 ARABPLAST 2019 FACT SHEET 1. Exhibition Name ArabPlast 2019 2. Edition / Years 14th / 28 3. Frequency Biannual 4. Description International Trade Show for Plastics, Petrochemicals, Packaging & Rubber Industry