Executive Summary of Texans Attitudes toward Immigrants, Immigration, Border Security, Trump s Policy Proposals, and the Political Environment
|
|
|
- William Robertson
- 6 years ago
- Views:
Transcription

1 2017 of Texans Attitudes toward Immigrants, Immigration, Border Security, Trump s Policy Proposals, and the Political Environment Immigration and Border Security regularly rank at or near the top of the issues that Texans say are the most important facing the state. The 2017 Texas Lyceum Poll is no different, with 27% of Texans saying that immigration or border security is the state's most important problem, ranking higher than any issue. 1
2 With this in mind and observing the role that the issue of immigration has played in both national and statewide politics recently, the 2017 is devoted primarily to the topic of immigration and border security. Our hope is to enlighten the public and policy makers on the many different facets surrounding this seemingly entrenched topic. It is important to note that the 2017, like all Texas Lyceum Polls before it, is a survey of Texas adults. For this reason, the opinions contained herein are not as conservative as one might expect from other polls, which tend to be of registered or likely voters. 2

3 General Attitudes towards Immigrants Summary of Findings Before diving into more divisive topics, we began our immigration battery with two questions intending to assess Texans' general attitudes about immigrants and immigration. The first question, a repeat from the 2016 Texas Lyceum poll, asked respondents whether they would "say that immigration helps the United States more than it hurts it, or immigration hurts the United States more than it helps it?" Overall, 62% of Texas adults said that immigration helps more than it hurts compared to 27% who said that it hurts more than it helps. This was a slight softening of attitudes from the 2016 results, in which 54% of Texas adults said that immigration helps more than it hurts. 3
 and 46% saying it hurts more than it helps (a view held")
4 Similar to 2016, overall opinion was driven in large part by increasingly positive attitudes towards immigration among Texas Democrats and minorities. Republican attitudes remained relatively unchanged from 2016, with 39% saying immigration helps more than it hurts (a view held by 37% in 2016) and 46% saying it hurts more than it helps (a view held by 49% in 2016). Democrats saying that immigration helps more than it hurts increased by 7 points, from 72% to 79%, while the percentage of Hispanics saying helps increased by 12 points, from 59% to 71%. There is also a major difference in overarching attitudes towards immigration by age cohort. While 80% of year olds say that immigration helps more than it hurts, that percentage drops to 69% among year olds, 57% among year olds, and down to 46% among those over the age of 65. 4

5 Next, we asked Texans whether recent immigrants, whom we define as people who have arrived in the U.S. within the past 10 years or so, have mostly adopted essential American culture and values, or have mostly retained their own culture and values. Overall, a majority of Texans (52%) believe that recent immigrants retain their own culture and values, while a third (33%) believe that they adopt American culture and values. While Democrats were roughly split on this question with 46% saying that they adopt American culture/values and 41% saying that they retain their own 64% of Republicans said that recent immigrants mostly retain their own values. There were only minor differences on this question by race, and among the different age cohorts, older respondents were more inclined than younger ones to believe that immigrants retain their own culture and values, with year olds evenly split on this question, 46% to 45%. 5

6 Illegal Immigration and Trump s Policy Proposals While past Lyceum Polling shows that immigration and border security regularly rank near the top of issues that Texans think are most important, this survey sought to dig deeper in assessing specific concerns about illegal immigration. First, respondents were asked how concerned they are about the particular issue of illegal immigration. Overall, 72% of Texans expressed concern about illegal immigration, with 37% saying that they were "extremely concerned" and 35% saying that they were "somewhat concerned". Republicans were significantly more concerned than Democrats (90% to 57%), and Anglos were more concerned than Hispanics (78% to 69%). 6
.")
7 To better understand the nature of these concerns, we followed up among those who said that they were "extremely" or "somewhat" concerned with an item asking them "what is the primary reason for your concern over illegal immigration?" Respondents were able to answer however they wanted (i.e., this was an openended item). A plurality of Texans (19%) cited safety/criminality as their primary concern. Second most cited was the issue of economic concerns (17%), with the third most cited concern being that immigrants should follow the legal process (13%). Interestingly, there were few major differences between sub-groups with respect to the rank order of concerns. Public safety was the most cited concern by most, and save a slightly higher share of Anglos citing economic concerns (21%) than Hispanics (15%) or African Americans (10%), the structure of concerns were basically universal. 7
8 Next we assessed Texans' attitudes towards some of President Trump's policy goals, executive orders, and campaign promises. First, we asked respondents, in a repeat from the 2016 Poll, whether they favor or oppose building a wall along the U.S. - Mexico border. Overall, opinions remained essentially unchanged from 2016, when 35% favored building the wall with 59% opposed. This year, 35% again favored building the wall with 61% in opposition. There were few notable changes, save for a slight increase in the share of Texas Hispanics who said that they would be in favor of building the wall (from 18% in 2016 to 25% in 2017). Given the changing nature and content of the President's recent executive orders on immigration related issues, we asked Texans whether, if implemented, they thought that "President Trump's executive orders on immigration would make the United States safer or less safe," or whether they wouldn't make much of a difference. A plurality responded that these executive orders would have no effect on U.S. safety (39%), with more of the remainder (37%) saying that they would make the U.S. safer, and 22% saying that they would make the U.S. less safe. Republicans overwhelmingly expressed the belief that these measures would make the U.S. safer (77%), while a majority of Democrats (51%) said that they would have no effect, with 38% saying that they would make the U.S. less safe. Thinking about the broader thrust of increased enforcement of immigration laws in light of promises made during the 2016 Presidential campaign, we asked Texans whether or not they believed that President Trump will truly "deport millions of illegal immigrants currently living in the United States?" Overall, half of adult Texans believe that he will, while 40% do not believe that he will. Democrats were more likely than Republicans to believe that the President will deport millions of undocumented immigrants (63% to 47%). Hispanic Texans were mixed, with 49% believing that he would deport millions, and 41% saying that he would not. As a follow-up to this question, we asked respondents whether or not they wanted the President to do this (deport millions of undocumented immigrants)? Only 31% of Texans said that they did. The majority, 62% said that they didn't want the President to deport millions of undocumented immigrants. This included 84% of Democrats, 74% of African Americans, and 72% of Hispanics. A majority of Texas Republicans (59%) said that they supported these deportations. White Texans had mixed opinions, with 43% wanting the President to deport millions of undocumented immigrants compared to 48% opposed. Again, there were some unique differences by age. Among the youngest cohort, 75% were against the deportation of millions of undocumented immigrants, but this decreased to 67% among year olds, and to 53% and 55% among year olds and those over the age of 65, respectively. Finally, given all of the politics surrounding the issue of immigration, both legal and illegal, the Lyceum Poll assessed Texans' attitudes towards how President Trump, Republicans in Congress (as the majority party in both chambers), and the Texas Legislature as a whole is handling the issue of immigration and border security. Overall, President Trump received the highest approval (38%), slightly besting the Texas Legislature at 36%. But disapproval is also high for President Trump, at 58% overall, slightly less than disapproval for Republicans in Congress with respect to their handling of immigration and border security (60%). 8

9 Immigration Reform While the politics surrounding comprehensive immigration reform have gotten no easier since 2013, both parties increasingly realize that reform is an issue that they will need to address at some point, or continue to deal with electoral uncertainty around the implications of the current system. The 2017 asked respondents how immigration should be prioritized, with further questions about a series of policy proposals often considered to be part of any discussion on comprehensive immigration reform. For the former, Texans were asked whether U.S. immigration policy should prioritize "allowing new immigrants who already have family members living in the U.S." or "allowing new immigrants who already have useful job skills." Overall, the plurality said that immigration policy should prioritize those with job skills (46%), while 9

10 32% said that policy should prioritize those with family members in the United States. There were clear partisan divisions, as 49% of Republicans said that policy should prioritize those with job skills, and 46% of Democrats said it should prioritize those with family ties. 10

11 With respect to immigration reform proposals, we asked Texans their level of support for each of five common policy areas: 1. Allowing illegal immigrants living in the U.S. the opportunity to become citizens after a long waiting period if they pay taxes and a penalty, pass a criminal background check, and learn English. 2. Tightening U.S. border security and providing Border Patrol with increased technology, infrastructure, and personnel. 3. Requiring U.S. business owners to check the immigration status of any employee they hire, with stiff fines and penalties for employers who knowingly hire illegal immigrants. 4. Allowing engineers and scientists from other countries who earn graduate degrees in the U.S. to remain in the U.S. to work. 5. Varying the number of low-skilled immigrants allowed to enter the country depending on how the U.S. economy is doing. 11
12 Overall, the most popular proposal was to allow illegal immigrants the ability to become citizens after a long waiting period, payment of taxes and a penalty, passage of a criminal background check, and a shown proficiency in English. This was supported by 90% of Texas adults, with 63% strongly supportive, and 27% somewhat supportive. This results may be surprising to anyone familiar with other public opinion polls in Texas, most of which show that the notion of a pathway to citizenship for undocumented immigrants currently living in the U.S. is quite unpopular. However, like other polling, the specific provisions of immigration reform tend to be far more popular than the overarching concept of immigration reform itself. In this case, a policy proposal that has a number of punitive elements (e.g. a waiting period, penalties, taxes, language requirements) is broadly popular in a state that holds otherwise restrictive attitudes towards immigration. The second most popular proposal was to allow engineers/scientists from other countries who earn their degree in the U.S. the ability to stay, supported by 86% of Texas adults; next, tightening border security (80%); requiring businesses to verify the immigration status of their employees (72%); and lastly, varying the number of low-skilled immigrants allowed to enter the U.S. based on current economic conditions (58%). There are certain policy areas in which Texas Republicans and Texas Democrats overlap, and certain policy areas in which they diverge. Interestingly, equal shares of Republicans and Democrats expressed support for a pathway to citizenship. Similarly, roughly equal shares supported varying the number of low-skilled workers allowed to enter the country. Republicans are far more in favor of increasing border security operations (91%) than are Democrats (70%), and are also more supportive of requiring businesses to verify the immigration status of their employees (89% to 59%). Democrats are far more supportive than Republicans of allowing scientists and engineers to remain in the country after completing their degrees (94% to 71%). Overall though, it is clear that even in Texas, Republicans and Democrats appear to agree far more over the particulars of immigration reform than current debates might suggest. 12
13 State Level Immigration Policy The was conducted in the middle of the 2017 Legislative Session, providing an opportunity to survey Texans on a number of issues that the Legislature is currently debating that relate to immigrants and the state's orientation towards those who are here illegally. We chose to focus on three issues: (1) border security funding, (2) in-state tuition rates for undocumented students, and (3) sanctuary city policies. The Legislature increased border security funding substantially during the 2015 Legislative Session. Heading into the 2017 Legislative Session, the Department of Public Safety made a request for additional funds. But given funding challenges and Republican dominance at the federal level of government, many were wondering whether the Legislature would consider spending less on border security funding. With this in mind, we tested two propositions: (1) whether Texans wanted to see the Legislature increase, decrease, or keep border security funding the same, and (2) whether Donald Trump's occupation of the White House, or Republican control of Congress, changes this calculation in the minds of Texans. To do this, we employed a split-sample design, in which half of respondents received one version of a question while the other half received another. More specifically, half the respondents were asked, "With Donald Trump in the White House, should the Texas Legislature continue funding border security operations in Texas at the same levels as before, increase funding for border security operations, or decrease funding for border security operations?" The other half received the same question, but instead of "Donald Trump in the White House," the question read "With Republicans in control of Congress." Presumably, any differences in the responses to these questions could be attributable to the expectation that one or the other (Trump or Republicans in Congress) will be more effective at easing Texas' burden for dealing with border security. We found that a plurality of Texans in both conditions preferred to continue current levels of funding (45% in the Trump condition and 41% in the Congressional Republican condition). Interestingly, while 28% of Texans in the Trump condition wanted to increase funding, 37% of Texans in the Congressional Republican condition wanted to increase funding. A preference for decreasing funding was higher in the Trump condition (21%) than in the Congressional Republican condition (15%). This indicates that, overall, Texans are expressing a greater expectation that the President will deliver on border security and/or immigration enforcement than Republicans in Congress, but there is no outcry to decrease the amount of money Texas spends securing its borders. 13
.")
14 When looked at by party, Democrats were 14 points more likely to support a decrease in funding when considering Donald Trump over Congressional Republicans (35% to 21%), and Republicans were 14 points more likely to support increasing funding when considering Republicans in Congress compared to President Trump (58% to 44%). A seemingly perennial issue facing the Legislature is whether or not to continue providing in-state tuition rates to public universities for undocumented immigrants brought here as children by their parents. Overall, 61% of Texas adults said that these students should be allowed to pay the in-state rates, while 31% said that they should have to pay out-of-state rates. In 2011, when the Texas Lyceum last asked this question, 52% of Texans said that these students should pay the in-state rates, while 43% said that they should pay the out-of-state rates. 14
 favor requiring that these students pay out-of-state rates.")
15 Not surprisingly, strong partisan differences underlie these results. Among Democrats, 77% favor the in-state rates, while a majority of Republicans (51%) favor requiring that these students pay out-of-state rates. White respondents are almost evenly split between in-state rates (49%) and out-of-state rates (42%), while Hispanics are overwhelmingly in favor of having these students pay the in-state rates (71%). Finally, we wanted to assess attitudes about an issue that has been on-going in Texas for some time, but has received a new round of attention recently because of a conflict between the Governor and Travis County: sanctuary cities. To look at attitudes toward sanctuary cities, we first assessed, when knowledgeable of the prevailing arguments for and against them, whether or not Texas adults support the notion of sanctuary cities. To do this, we asked the following question: In some cities, when local police or city government employees learn that someone is in the country illegally, they do not automatically turn that person over to federal immigration enforcement officers. [ROTATE SUPPORT/OPPOSE CLAUSES] 15

16 Supporters of these so-called sanctuary cities say that this improves public safety because it encourages people in immigrant communities to work with police to help arrest dangerous criminals without fear of being deported themselves. Opponents of these so-called sanctuary cities say that this practice is a violation of federal law and allows some dangerous criminals who are in the country illegally to continue to commit violent crimes. Thinking about your own view, do you support or oppose sanctuary cities? In response to this question, 49% of Texas adults expressed opposition to sanctuary cities, while 45% expressed support. Among Republicans, 86% were in opposition to sanctuary cities, while among Democrats, 69% were in support. White opposition to sanctuary cities was 62%, while Hispanic support for sanctuary cities was 56%. 16

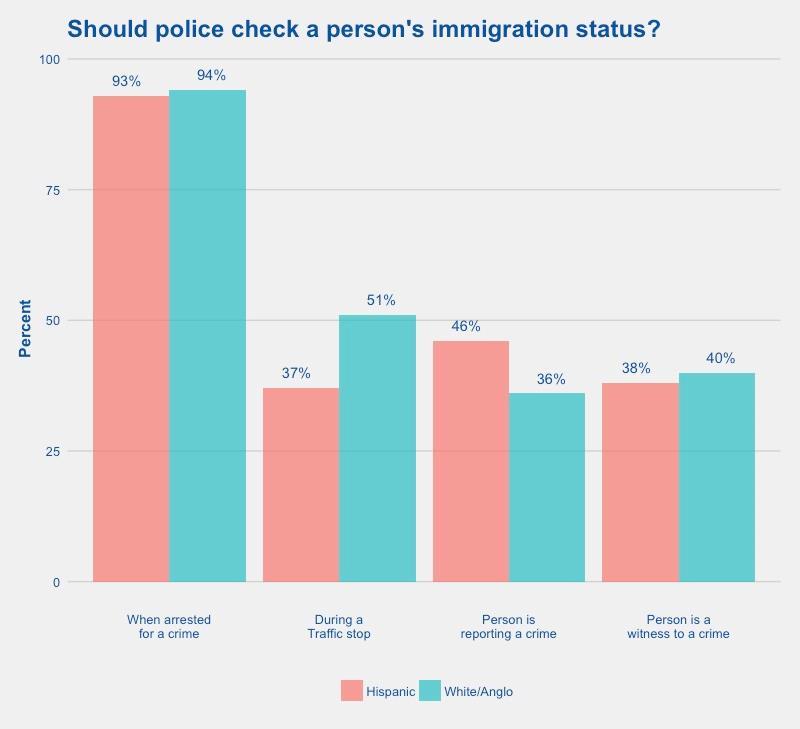
17 Digging deeper into this issue, the Lyceum Poll asked Texans whether or not police should check a person's immigration status in a range of interactions. Overall, 93% of Texans said that immigration status should be checked when a person is arrested for a crime, but support for checking immigration status dropped considerably for other situations. Forty-three percent said that police should check immigration status during a routine traffic stop, 40% said that status should be checked when a person is reporting a crime, and 39% said that status should be checked when the police suspect that a person is a witness to a crime or could provide information. 17

18 Among Republicans, 99% think immigration status should be checked when a person is arrested for a crime, 68% think it should be checked during a routine traffic stop, and 53% think it should be checked when a person is reporting, or is a witness to, a crime. Among Democrats, 88% think that immigration status should be checked when a person is arrested for a crime, 28 percent think it should be checked during a routine traffic stop, and 30% think it should be checked when a person is reporting, or is a witness to, a crime. 18
 and Anglo (94%) respondents said that immigration status should be checked when someone is arrested for a crime.")
19 Finally, Hispanic adults in Texas are not universally less likely than White Texans to oppose immigration status checks across all situations. Almost all Hispanic (93%) and Anglo (94%) respondents said that immigration status should be checked when someone is arrested for a crime. Roughly equal shares of both Hispanics and Anglos (38% and 40%) think that status should be checked when someone is a witness to a crime. But differences emerge for the other two items. Hispanics are more likely than Anglos to say that immigration status should be checked when someone is reporting a crime (46% to 36%), but are less likely to endorse checking immigration status during a routine traffic stop (37% to 51%). 19
20 20
21 Methodology From April 3-9, 2017, The Texas Lyceum conducted a statewide telephone survey of adult citizens. The survey utilized a stratified probability sample design, with respondents being randomly selected at the level of the household. The survey also employed a randomized cell phone supplement, with 50 percent of completed interviews being conducted among cell phone only or cell phone dominant households. A Spanish-language instrument was developed and bilingual interviewers offered respondents a chance to participate in English or Spanish. On average, respondents completed the interview in 17 minutes. Approximately 6,100 records were drawn to yield 1,000 completed interviews. The final data set is weighted by race/ethnicity, age and gender to achieve representativeness as defined by the Texas Department State Health Services 2017 population projections. The overall margin of error for the poll is +/- 3.1 percentage points. The Texas Lyceum The Texas Lyceum has committed to annual probability samples of the state of Texas to bolster its understanding of public opinion on crucial policy issues. The professional rationale for the is straightforward: a non-partisan, high quality, scientific survey designed to provide (1) specific data points on issues of interest, and (2) a time series of key demographics, attitudes, and opinions. Towards this end, the trademark of the is transparency. Top-line and detailed cross-tabular results of each poll will be made available on the Texas Lyceum website at The Texas Lyceum, now 36 years strong, is a non-profit, non-partisan statewide leadership organization focused on identifying the next generation of Texas leaders. The Texas Lyceum consists of 96 men and women from throughout the state. Directors begin their service while under the age of 46 and have demonstrated leadership in their community and profession, together with a deep commitment to Texas. The Texas Lyceum acts as a catalyst to bring together diverse opinions and expertise to focus on national and state issues, and seeks to emphasize constructive private sector, public sector, and individual responses to the issues. To accomplish these purposes, the Lyceum conducts periodic public forums, commissions The, and convenes programs for the Directors to explore and discuss key economic and social issues of the state and nation. 21
22 [ROTATE Q16A-Q16B] Q16A. Do you approve or disapprove of the way Donald Trump is handling the issue of immigration and border security? 1. Approve 38% 2. Disapprove DON T KNOW / REFUSED / NA 4 Q16B. Do you approve or disapprove of the way Republicans in Congress are handling the issue of immigration and border security? 1. Approve 27% 2. Disapprove DON T KNOW / REFUSED / NA 13 Q17. Do you approve or disapprove of the way the Texas Legislature is handling the issue of immigration and border security? 1. Approve 36% 2. Disapprove DON T KNOW / REFUSED / NA 20 SECTION III: ISSUES & POLICY Immigration Let s talk about immigration for a few minutes Q22. Would you say that immigration helps the United States more than it hurts it, or immigration hurts the United States more than it helps it? 1. Helps more than it hurts 62% 2. Hurts more than it helps A little of both (Vol.) 6 4. DON T KNOW / REFUSED / NA 5 Q23. Thinking specifically about recent immigrants, that is people who have come to the United States to live and work in the past ten years or so, which of the following statements is closer to your opinion about these immigrants coming to the United States?...[RANDOMIZE 1-2] 1. They mostly adopted essential American culture and values when they got here, 33% 2. They mostly retained their own cultures and values DON T KNOW / REFUSED / NA 16 22
23 Illegal Immigration The next few questions concern illegal immigration Q25. How concerned are you about illegal immigration? Extremely concerned, somewhat concerned, not very concerned, or not at all concerned? 1. Extremely 37% 2. Somewhat Not very Not at all DON T KNOW / REFUSED / NA 1 Q26. [IF Q25 EQ 1 2] What is the primary reason for your concern over illegal immigration? [OPEN- ENDED] (n = 699, MOE +/- 3.71%) 1. Safety / Criminality 19% 2. Economic concerns / Jobs Illegal / Should follow proper process Government resources 9 5. National security / terrorism 8 6. Need to be properly vetted / keep track of who comes in 6 7. American culture 2 8. Other Don't know 5 Q28. Would you favor or oppose building a wall along the US-Mexico border to try to stop illegal immigration? 1. Favor 35% 2. Oppose DON T KNOW / REFUSED / NA 4 Q39. If implemented, do you think President (Donald) Trump's executive orders on immigration would make the United States safer or less safe, or doesn't it make much of a difference at all? 1. Safer 37% 2. Less safe No difference DON T KNOW / REFUSED / NA 3 Q29. Do you believe President Trump truly will deport millions of illegal immigrants currently living in the United States? 1. Yes 50% 2. No DON T KNOW / REFUSED / NA 10 Q30. And do you want him to do that (deport millions of illegal immigrants currently living in the US)? 1. Yes 31% 2. No DON T KNOW / REFUSED / NA 8 23
24 Immigration Reform Q31. What should be the priority for U.S. immigration policy? Should it be [RANDOMIZE 1-2] 1. allowing new immigrants who already have family members living in the U.S. [or] 32% 2. allowing new immigrants who already have useful job skills DON T KNOW / REFUSED / NA 22 Q33. Please tell us whether you support or oppose each of the following ideas. Would that be strongly or somewhat support/oppose: A. Allowing illegal immigrants living in the U.S. the opportunity to become citizens after a long waiting period if they pay taxes and a penalty, pass a criminal background check, and learn English. 1. Strongly support 63% 2. Somewhat support Somewhat oppose 4 4. Strongly oppose 5 5. DON T KNOW / REFUSED / NA 1 B. Tightening U.S. border security and providing Border Patrol with increased technology, infrastructure, and personnel. 1. Strongly support 53% 2. Somewhat support Somewhat oppose Strongly oppose 7 5. DON T KNOW / REFUSED / NA 3 C. Requiring U.S. business owners to check the immigration status of any employee they hire, with stiff fines and penalties for employers who knowingly hire illegal immigrants. 1. Strongly support 49% 2. Somewhat support Somewhat oppose Strongly oppose DON T KNOW / REFUSED / NA 5 D. Allowing engineers and scientists from other countries who earn graduate degrees in the U.S. to remain in the U.S. to work. 1. Strongly support 56% 2. Somewhat support Somewhat oppose 6 4. Strongly oppose 4 5. DON T KNOW / REFUSED / NA 4 E. Varying the number of low-skilled immigrants allowed to enter the country depending on how the U.S. economy is doing. 1. Strongly support 24% 2. Somewhat support Somewhat oppose Strongly oppose DON T KNOW / REFUSED / NA 8 24
25 State Level Immigration [Split-sample Q34A-Q34B; n = 574 for Q34A, producing an MOE of +/- 4.1%; n = 426 for Q34B, producing an MOE of 4.75%] Q34A. With Donald Trump in the White House, should the Texas Legislature continue funding border security operations in Texas at the same levels as before, increase funding for border security operations, or decrease funding for border security operations? 1. Continue funding 45% 2. Increase funding Decrease funding DON T KNOW / REFUSED / NA 6 Q34B. With Republicans in control of the Congress, should the Texas Legislature continue funding border security operations in Texas at the same levels as before, increase funding for border security operations, or decrease funding for border security operations? 1. Continue funding 41% 2. Increase funding Decrease funding DON T KNOW / REFUSED / NA 7 Q35. Some illegal immigrants were brought to Texas as children by their parents. Do you think that these individuals should receive in-state tuition rates, or should they pay have to pay the higher rates of out-of-state residents? 1. In-state rates 61% 2. Out-of-state rates DON T KNOW / REFUSED / NA 8 Sanctuary Cities Q36. In some cities, when local police or city government employees learn that someone is in the country illegally, they do not automatically turn that person over to federal immigration enforcement officers. [ROTATE SUPPORT/OPPOSE CLAUSES] Supporters of these so-called sanctuary cities say that this improves public safety because it encourages people in immigrant communities to work with police to help arrest dangerous criminals without fear of being deported themselves. Opponents of these so-called sanctuary cities say that this practice is a violation of federal law and allows some dangerous criminals who are in the country illegally to continue to commit violent crimes. Thinking about your own view, do you support or oppose sanctuary cities? 1. Support 45% 2. Oppose DON T KNOW / REFUSED / NA 5 25
26 Q37. In each of the following interactions with a police office, should a person s immigration status be checked, or not? Checked Not Checked Don t Know A. During a routine traffic stop 44% 53% 4% B. When that person is reporting a crime C. When the police suspect that person is a witness to a crime or can provide information D. When that person is arrested for a crime
2016 Texas Lyceum Poll
 2016 of Immigration, Discrimination, Transgender Student Facility Access, Medicaid Expansion, Voter ID, and Ride-Hailing Regulation Attitudes A September 1-11, 2016 survey of adult Texans reveals they
Executive Summary of Economic Attitudes, Most Important Problems, Ratings of Top Political Figures, and an Early Look at the 2018 Texas Elections
 2017 of Economic Attitudes, Most Important Problems, Ratings of Top Political Figures, and an Early Look at the 2018 Texas Elections Summary of Findings The 2017 continues its long time-series assessing
2013 Texas Lyceum Poll. Executive Summary of Issue Priorities, Attitudes on Transportation, Water, Infrastructure, Education, and Health Care
 2013 of Issue Priorities, Attitudes on Transportation, Water, Infrastructure, Education, and Health Care It may be the economy for the country, but it s education here in Texas. We want to do more on roads,
2016 GOP Nominating Contest
 2015 Texas Lyceum Poll Executive Summary 2016 Presidential Race, Job Approval & Economy A September 8-21, 2015 survey of adult Texans shows Donald Trump leading U.S. Sen. Ted Cruz 21-16, former U.S. Secretary
2014 Texas Lyceum Poll. Executive Summary of Economic Evaluations, Job Approval, and Trial Ballots
 2014 of Economic Evaluations, Job Approval, and Trial Ballots We re anxious about the (national) economy, we like our leaders, and we weren t aware there is another election just around the corner A September
2011 Texas Lyceum Poll. Executive Summary of Social Policy Issues
 2011 Texas Lyceum Poll Executive Summary of Social Policy Issues A recent Texas Lyceum poll surveyed adult Texans on a range of hot button social and policy issues that were the subject of much debate
2011 Texas Lyceum Poll 5 th Anniversary DAY 2 Texans vary on hot button issues facing the Texas Legislature
 2011 Texas Lyceum Poll 5 th Anniversary DAY 2 Texans vary on hot button issues facing the Texas Legislature LYCEUM POLL SHOWS TEXANS: Support expanded gambling more than in the past Want additional help
NATIONAL: PUBLIC SAYS LET DREAMERS STAY
 Please attribute this information to: Monmouth University Poll West Long Branch, NJ 07764 www.monmouth.edu/polling Follow on Twitter: @MonmouthPoll Released: Monday, February 5, 2018 Contact: PATRICK MURRAY
Latino Decisions / America's Voice June State Latino Battleground Survey
 Latino Decisions / America's Voice June 2012 5-State Latino Battleground Survey 1. On the whole, what are the most important issues facing the Hispanic community that you think Congress and the President
Marist College Institute for Public Opinion Poughkeepsie, NY Phone Fax
 Marist College Institute for Public Opinion Poughkeepsie, NY 12601 Phone 845.575.5050 Fax 845.575.5111 www.maristpoll.marist.edu POLL MUST BE SOURCED: MSNBC/Telemundo/Marist Poll* Issues 2016: Immigration
RECOMMENDED CITATION: Pew Research Center, June, 2015, Broad Public Support for Legal Status for Undocumented Immigrants
 NUMBERS, FACTS AND TRENDS SHAPING THE WORLD FOR RELEASE JUNE 4, 2015 FOR FURTHER INFORMATION ON THIS REPORT: Carroll Doherty, Director of Political Research Alec Tyson, Senior Researcher Rachel Weisel,
Borders First a Dividing Line in Immigration Debate
 JUNE 23, 2013 More Say Legalization Would Benefit Economy than Cost Jobs Borders First a Dividing Line in Immigration Debate A Pew Research Center/USA TODAY Survey FOR FURTHER INFORMATION CONTACT THE PEW
Florida Latino Survey Sept 2017
 Q1. Generally speaking, would you say things in this country are headed in the right direction, or are they off on the wrong track? Right direction 43% Wrong track 57% Q2. Overall, do you approve or disapprove
October 21, 2015 Media Contact: Joanna Norris, Director Department of Public Relations (904)
") October 21, 2015 Media Contact: Joanna Norris, Director Department of Public Relations (904) 620-2102 UNF Poll Reveals Hillary Clinton Holds Significant Lead in Democratic Primary Race A new University
October 21, 2015 Media Contact: Joanna Norris, Director Department of Public Relations (904) 620-2102 UNF Poll Reveals Hillary Clinton Holds Significant Lead in Democratic Primary Race A new University
The margin of error is: ±3.70% for 700 interviews among Adults ±5.66% for 300 interviews among Hispanics
 HART/McINTURFF Study #10336--page 1 Interviews: 700 adults, including 70 reached by cell phone Date: May 20-23, 2010 Oversample of 300 Hispanic adults Study #10336 48 Male 52 Female Please note: all results
Any Court Health Care Decision Unlikely to Please
 MONDAY, JUNE 18, 2012 Immigration: Public Backs AZ Law, But Also Path to Citizenship Any Court Health Care Decision Unlikely to Please FOR FURTHER INFORMATION CONTACT: Andrew Kohut President, Pew Research
AMERICANS VIEWS OF PRESIDENT TRUMP S AGENDA ON HEALTH CARE, IMMIGRATION, AND INFRASTRUCTURE
 AMERICANS VIEWS OF PRESIDENT TRUMP S AGENDA ON HEALTH CARE, IMMIGRATION, AND INFRASTRUCTURE March 2018 1 TABLE OF CONTENTS I. Health Care........... 3 II. Immigration... 7 III. Infrastructure....... 12
An in-depth examination of North Carolina voter attitudes on important current issues
 An in-depth examination of North Carolina voter attitudes on important current issues Registered Voters in North Carolina August 25-30, 2018 1 Contents Contents Key Survey Insights... 3 Satisfaction with
federallyissued 3 Dont know DEF Bad idea USA Case 2:13-cv Document Filed in TXSD on 11/20/14 Page 1 of 6
 Case 2:13-cv-00193 Document 792-30 Filed in TXSD on 11/20/14 Page 1 of 6 EXHIBIT B National There a debate about state laws that require voters to show a valid form of federallyissued state or photo identification
NATIONAL: PUBLIC TAKES SOFTER STANCE ON ILLEGAL IMMIGRATION
 Please attribute this information to: Monmouth University Poll West Long Branch, NJ 07764 www.monmouth.edu/polling Follow on Twitter: @MonmouthPoll Released: Thursday, September 21, 2017 Contact: PATRICK
Doubts About China, Concerns About Jobs POST-SEATTLE SUPPORT FOR WTO
 FOR IMMEDIATE RELEASE: Thursday, March 2, 2000 FOR FURTHER INFORMATION: Andrew Kohut, Director Doubts About China, Concerns About Jobs POST-SEATTLE SUPPORT FOR WTO Most Americans continue to support free
National Latino Survey Sept 2017
 1. Generally speaking, would you say things in this country are headed in the right direction, or are they off on the wrong track? Right direction... 32 Wrong track... 68 2. Overall, do you approve or
Release #2345 Release Date: Tuesday, July 13, 2010
 THE FIELD POLL THE INDEPENDENT AND NON-PARTISAN SURVEY OF PUBLIC OPINION ESTABLISHED IN 1947 AS THE CALIFORNIA POLL BY MERVIN FIELD Field Research Corporation 601 California Street, Suite 900 San Francisco,
RUTGERS-EAGLETON POLL: MOST NEW JERSEYANS SUPPORT DREAM ACT
 Eagleton Institute of Politics Rutgers, The State University of New Jersey 191 Ryders Lane New Brunswick, New Jersey 08901-8557 www.eagleton.rutgers.edu eagleton@rci.rutgers.edu 732-932-9384 Fax: 732-932-6778
PENNSYLVANIA: DEM GAINS IN CD18 SPECIAL
 Please attribute this information to: Monmouth University Poll West Long Branch, NJ 07764 www.monmouth.edu/polling Follow on Twitter: @MonmouthPoll Released: Monday, 12, Contact: PATRICK MURRAY 732-979-6769
Weekly Tracking Poll Week 3: September 25-Oct 1 (MoE +/-4.4%)
") 1. Thinking ahead to the November 2016 election, what would you say the chances are that you will vote in the election for U.S. President, Congress and other state offices - are you almost certain to vote,
1. Thinking ahead to the November 2016 election, what would you say the chances are that you will vote in the election for U.S. President, Congress and other state offices - are you almost certain to vote,
Views of the Economy by Party --- Now / Reps Dems Inds Reps Dems Inds Good 61% 67% 56% 31% 78% 53% Bad
 CBS NEWS POLL For release: Thursday, February 23, 2017 7:00 am EST Optimism on the Economy, Concern About Immigration February 17-21, 2017 Evaluations of the nation s economy are the most positive they
American Politics and Foreign Policy
 American Politics and Foreign Policy Shibley Telhami and Stella Rouse Principal Investigators A survey sponsored by University of Maryland Critical Issues Poll fielded by Nielsen Scarborough Survey Methodology
NEW JERSEY: DEM MAINTAINS EDGE IN CD11
 Please attribute this information to: Monmouth University Poll West Long Branch, NJ 07764 www.monmouth.edu/polling Follow on Twitter: @MonmouthPoll Released: Tuesday, October 9, Contact: PATRICK MURRAY
Statewide Survey on Job Approval of President Donald Trump
 University of New Orleans ScholarWorks@UNO Survey Research Center Publications Survey Research Center (UNO Poll) 3-2017 Statewide Survey on Job Approval of President Donald Trump Edward Chervenak University
NATIONAL: 2018 HOUSE RACE STABILITY
 Please attribute this information to: Monmouth University Poll West Long Branch, NJ 07764 www.monmouth.edu/polling Follow on Twitter: @MonmouthPoll Released: Friday, November 2, 2018 Contact: PATRICK MURRAY
NEW HAMPSHIRE: CLINTON PULLS AHEAD OF SANDERS
 Please attribute this information to: Monmouth University Poll West Long Branch, NJ 07764 www.monmouth.edu/polling Follow on Twitter: @MonmouthPoll Released: Tuesday, 3, Contact: PATRICK MURRAY 732-979-6769
America s Voice. Findings from a Survey of 800 Registered Voters Nationwide, with an oversample of 300 Latino Registered Voters
 America s Voice Findings from a Survey of 800 Registered Voters Nationwide, with an oversample of 300 Latino Registered Voters Celinda Lake, David Mermin, and Zach Young Lake Research Partners Washington,
The Republican Race: Trump Remains on Top He ll Get Things Done February 12-16, 2016
 CBS NEWS POLL For release: Thursday, February 18, 2016 7:00 AM EST The Republican Race: Trump Remains on Top He ll Get Things Done February 12-16, 2016 Donald Trump (35%) continues to hold a commanding
WEEKLY LATINO TRACKING POLL 2018: WAVE 1 9/05/18
 WEEKLY LATINO TRACKING POLL 2018: WAVE 1 9/05/18 1. Many people are busy and don t get a chance to vote in every election. Thinking ahead to the November 2018 election, what would you say the chances are
Institute for Public Policy
 Institute for Public Policy 2018 Gubernatorial Race Report of Findings October 2018 Table of Contents SECTION ONE About the Poll SECTION TWO Project Overview SECTION THREE Key Findings & Headlines SECTION
Institute for Public Policy
 Institute for Public Policy 2018 Gubernatorial Race Report of Findings November 2018 Table of Contents SECTION ONE About the Poll SECTION TWO Project Overview SECTION THREE Key Findings & Headlines SECTION
NEW JERSEY: CD03 STILL KNOTTED UP
 Please attribute this information to: Monmouth University Poll West Long Branch, NJ 07764 www.monmouth.edu/polling Follow on Twitter: @MonmouthPoll Released: Thursday, October 25, Contact: PATRICK MURRAY
HIGH POINT UNIVERSITY POLL MEMO RELEASE 9/24/2018 (UPDATE)
") HIGH POINT UNIVERSITY POLL MEMO RELEASE 9/24/2018 (UPDATE) ELEMENTS Population represented Sample size Mode of data collection Type of sample (probability/nonprobability) Start and end dates of data collection
HIGH POINT UNIVERSITY POLL MEMO RELEASE 9/24/2018 (UPDATE) ELEMENTS Population represented Sample size Mode of data collection Type of sample (probability/nonprobability) Start and end dates of data collection
Institute for Public Policy
 Institute for Public Policy 2018 Gubernatorial Race Report of Findings Table of Contents SECTION ONE About the Poll SECTION TWO Project Overview SECTION THREE Key Findings & Headlines SECTION FOUR Detailed
HART RESEARCH ASSOCIATES/PUBLIC OPINION STRATEGIES Study # page 1
 HART RESEARCH ASSOCIATES/PUBLIC OPINION STRATEGIES Study #17505 -- page 1 Interviews: 900 Adults, including 405 respondents with a cell phone only and Date: December 13-15, 2017 12 respondents reached
PENNSYLVANIA: SMALL LEAD FOR SACCONE IN CD18
 Please attribute this information to: Monmouth University Poll West Long Branch, NJ 07764 www.monmouth.edu/polling Follow on Twitter: @MonmouthPoll Released: Thursday, 15, Contact: PATRICK MURRAY 732-979-6769
Support for Gun Checks Stays High; Two-Thirds Back a Path for Immigrants
 ABC NEWS/WASHINGTON POST POLL: Gun Control, Immigration & Politics EMBARGOED FOR RELEASE AFTER 7 a.m. Tuesday, April 16, 2013 Support for Gun Checks Stays High; Two-Thirds Back a Path for Immigrants Support
Obama Viewed as Fiscal Cliff Victor; Legislation Gets Lukewarm Reception
 JANUARY 7, 2013 Obama Viewed as Fiscal Cliff Victor; Legislation Gets Lukewarm Reception FOR FURTHER INFORMATION CONTACT: Michael Dimock Director, Pew Research Center for the People & the Press Carroll
HART/McINTURFF Study # page 1. Interviews: 1000 adults, including 200 reached by cell phone Date: August 5-9, 2010
 HART/McINTURFF Study #10651--page 1 Interviews: 1000 adults, including 200 reached by cell phone Date: August 5-9, 2010 Study #10651 48 Male 52 Female Please note: all results are shown as percentages
Californians & Their Government
 PPIC STATEWIDE SURVEY DECEMBER 2018 Californians & Their Government Mark Baldassare Dean Bonner Alyssa Dykman Lunna Lopes CONTENTS Press Release State Post-Election Landscape Federal Post-Election Landscape
FROM: CALIFORNIACITYNEWS.ORG / PRIME GROUP DATE: MAY 2017 CALIFORNIA LOCAL ELECTED OFFICIALS POLL RESULTS
 FROM: CALIFORNIACITYNEWS.ORG / PRIME GROUP DATE: MAY 2017 RE: CALIFORNIA LOCAL ELECTED OFFICIALS POLL RESULTS Highlights The inaugural CalfiorniaCityNews.org / Prime Group California Local Elected Officials
Marist College Institute for Public Opinion Poughkeepsie, NY Phone Fax
 Marist College Institute for Public Opinion Poughkeepsie, NY 12601 Phone 845.575.5050 Fax 845.575.5111 www.maristpoll.marist.edu POLL MUST BE SOURCED: McClatchy-Marist Poll* Voters Question Clinton s Private
RECOMMENDED CITATION: Pew Research Center, August, 2016, On Immigration Policy, Partisan Differences but Also Some Common Ground
 NUMBERS, FACTS AND TRENDS SHAPING THE WORLD FOR RELEASE AUGUST 25, 2016 FOR MEDIA OR OTHER INQUIRIES: Carroll Doherty, Director of Political Research Jocelyn Kiley, Associate Director, Research Bridget
Hart Research Associates/Public Opinion Strategies Study # page 1
 Hart Research Associates/Public Opinion Strategies Study #19020 -- page 1 Interviews: 900 Adults, including 405 respondents with a cell phone only and 9 Date: January 20-23, 2019 respondents reached on
RECOMMENDED CITATION: Pew Research Center, May, 2015, Negative Views of New Congress Cross Party Lines
 NUMBERS, FACTS AND TRENDS SHAPING THE WORLD FOR RELEASE MAY 21, 2015 FOR FURTHER INFORMATION ON THIS REPORT: Carroll Doherty, Director of Political Research Jocelyn Kiley, Associate Director, Research
Ipsos Poll conducted for Reuters, May 5-9, 2011 NOTE: all results shown are percentages unless otherwise labeled.
 1146 19 th St., NW, Suite 200 Washington, DC 20036 (202) 463-7300 Interview dates: May 5-9, 2011 Interviews: 1,029 adults; 876 registered voters 451 Democrats; 429 Republicans; 149 Independents Margin
Public Opinion on Health Care Issues October 2012
 Public Opinion on Health Care Issues October 2012 One week before the 2012 presidential election, health policy issues including Medicare and the Affordable Care Act (ACA) remain a factor in voters views
University of North Florida Public Opinion Research Lab
 University of North Florida Public Opinion Research Lab www.unf.edu/coas/porl/ October 4, 2018 Media Contact: Joanna Norris, Director Department of Public Relations (904) 620-2102 Methodology Results Contact:
(Full methodological details appended at the end.) *= less than 0.5 percent
 *= less than 0.5 percent") This Washington Post-Schar School poll was conducted by telephone March 26-29, 2019 among a random national sample of 640 adults with 62 percent reached on cell phones and 38 percent on landlines. Overall
This Washington Post-Schar School poll was conducted by telephone March 26-29, 2019 among a random national sample of 640 adults with 62 percent reached on cell phones and 38 percent on landlines. Overall
RECOMMENDED CITATION: Pew Research Center, October, 2015, On Immigration Policy, Wider Partisan Divide Over Border Fence Than Path to Legal Status
 NUMBERS, FACTS AND TRENDS SHAPING THE WORLD FOR RELEASE OCTOBER 8, 2015 FOR FURTHER INFORMATION ON THIS REPORT: Carroll Doherty, Director of Political Research Rob Suls, Research Associate Bridget Jameson,
The Cook Political Report / LSU Manship School Midterm Election Poll
 The Cook Political Report / LSU Manship School Midterm Election Poll The Cook Political Report-LSU Manship School poll, a national survey with an oversample of voters in the most competitive U.S. House
FINAL RESULTS: National Voter Survey Total Sample Size: 2428, Margin of Error: ±2.0% Interview Dates: November 1-4, 2018
 FINAL RESULTS: National Voter Survey Total Sample Size: 2428, Margin of Error: ±2.0% Interview Dates: November 1-4, 2018 Language: English and Spanish Respondents: Likely November 2018 voters in 72 competitive
Marist College Institute for Public Opinion Poughkeepsie, NY Phone Fax
 Marist College Institute for Public Opinion Poughkeepsie, NY 12601 Phone 845.575.5050 Fax 845.575.5111 www.maristpoll.marist.edu POLL MUST BE SOURCED: McClatchy-Marist Poll* Majority Wants Immediate Action
POLL: CLINTON MAINTAINS BIG LEAD OVER TRUMP IN BAY STATE. As early voting nears, Democrat holds 32-point advantage in presidential race
 DATE: Oct. 6, FOR FURTHER INFORMATION, CONTACT: Brian Zelasko at 413-796-2261 (office) or 413 297-8237 (cell) David Stawasz at 413-796-2026 (office) or 413-214-8001 (cell) POLL: CLINTON MAINTAINS BIG LEAD
FOURTH ANNUAL IDAHO PUBLIC POLICY SURVEY 2019
 FOURTH ANNUAL IDAHO PUBLIC POLICY SURVEY 2019 ABOUT THE SURVEY The Fourth Annual Idaho Public Policy Survey was conducted December 10th to January 8th and surveyed 1,004 adults currently living in the
NATIONAL: AMERICA REMAINS DEEPLY DIVIDED
 Please attribute this information to: Monmouth University Poll West Long Branch, NJ 07764 www.monmouth.edu/polling Follow on Twitter: @MonmouthPoll Released: Wednesday, 22, Contact: PATRICK MURRAY 732-979-6769
Illinois Voters are Not Happy with the Direction of the State: Not Much Influenced by the Recent Tax Cuts
 paulsimoninstitute.org FOR Monday, IMMEDIATE October 12, RELEASE 2015 March 5, 2018 Contact: Charlie Leonard 618-303-9099 John Shaw 618-453-4009 Illinois Voters are Not Happy with the Direction of the
HISPANIC/LATINO OVERSAMPLE
 HART RESEARCH ASSOCIATES/PUBLIC OPINION STRATEGIES Study #18955 -- page 1 Interviews: 300 Registered Latino Voters, including 158 respondents with a cell phone only Date: September 16-19, 2018 Study #18955
THE HEALTH CARE BILL, THE PUBLIC OPTION, ABORTION, AND CONGRESS November 13-16, 2009
 CBS NEWS POLL For release: Tuesday, November 17, 2009 6:30 PM (ET) THE HEALTH CARE BILL, THE PUBLIC OPTION, ABORTION, AND CONGRESS November 13-16, 2009 Americans would strongly prefer a health care bill
NBC News/Marist Poll. Do you consider your permanent home address to be in Arizona? Which county in Arizona do you live in?
 NBC News/Marist Poll June 2018 Arizona Questionnaire Residents: n=982 MOE +/-4.1% Registered Voters: n=839 MOE +/-4.5% Potential Republican Electorate: n=371 MOE +/-6.7% Totals may not add to 100% due
Californians & Their Government
 Californians & Their Government Mark Baldassare Dean Bonner Lunna Lopes CONTENTS Press Release 3 2018 California Election 6 State and National Issues 13 Regional Map 20 Methodology 21 Questionnaire and
NBC News/WSJ/Marist Poll
 NBC News/WSJ/Marist Poll October 2016 North Carolina Questionnaire Residents: n=1,150 MOE +/-2.9% Registered Voters: n=1,025 MOE +/-3.1% Likely Voters: n= 743 MOE +/- 3.6% Totals may not add to 100% due
THE LOUISIANA SURVEY 2018
 THE LOUISIANA SURVEY 2018 Criminal justice reforms and Medicaid expansion remain popular with Louisiana public Popular support for work requirements and copayments for Medicaid The fifth in a series of
THE 2004 NATIONAL SURVEY OF LATINOS: POLITICS AND CIVIC PARTICIPATION
 Summary and Chartpack Pew Hispanic Center/Kaiser Family Foundation THE 2004 NATIONAL SURVEY OF LATINOS: POLITICS AND CIVIC PARTICIPATION July 2004 Methodology The Pew Hispanic Center/Kaiser Family Foundation
EMBARGOED FOR RELEASE UNTIL MONDAY, OCTOBER 27, am EDT. A survey of Virginians conducted by the Center for Public Policy
 EMBARGOED FOR RELEASE UNTIL MONDAY, OCTOBER 27, 2008 10am EDT COMMONWEALTH POLL A survey of Virginians conducted by the Center for Public Policy Contact: Cary Funk, Survey Director and Associate Professor,
MEMORANDUM. Independent Voter Preferences
 MEMORANDUM TO: Interested Parties FROM: Ed Gillespie, Whit Ayres and Leslie Sanchez DATE: November 9, 2010 RE: Post-Election Poll Highlights: Independents Propel Republican Victories in 2010 The 2010 mid-term
SURVEY KEY FINDINGS. Require RPS of 20 percent by 2020
 SURVEY KEY FINDINGS 1. Overwhelming majorities of Michigan voters, regardless of political affiliation, support the state requiring more electricity be produced from renewable energy sources and nearly
An in-depth examination of North Carolina voter attitudes in important current issues. Registered Voters in North Carolina
 An in-depth examination of North Carolina voter attitudes in important current issues Registered Voters in North Carolina January 21-25, 2018 Table of Contents Key Survey Insights... 3 Satisfaction with
REGISTERED VOTERS October 30, 2016 October 13, 2016 Approve Disapprove Unsure 7 6 Total
 NBC News/WSJ/Marist Poll October 30, 2016 North Carolina Questionnaire Residents: n=1,136 MOE +/- 2.9% Registered Voters: n=1,018 MOE +/- 3.1% Likely Voters: n=780 MOE +/- 3.5% Totals may not add to 100%
The Morning Call / Muhlenberg College Institute of Public Opinion. Pennsylvania 2012: An Election Preview
 The Morning Call / Muhlenberg College Institute of Public Opinion Pennsylvania 2012: An Election Preview Key Findings Report December 9, 2011 KEY FINDINGS: 1. While nearly half of Pennsylvanians currently
News Release. A Challenging Road to 2020 Voters more hopeful than fearful about the future EMBARGOED UNTIL 5:00 AM ET SEPTEMBER 5, 2018
 News Release EMBARGOED UNTIL 5:00 AM ET SEPTEMBER 5, 2018 Contacts: Andy Garman Wixted & Company 515-226-0818 515-556-4827 (cell) agarman@thinkwixted.com Debra Lukehart Grinnell College Vice President,
IMMIGRATION IN THE GARDEN STATE
 Contact: PATRICK MURRAY 732-263-5858 (office) 732-979-6769 (cell) pdmurray@monmouth.edu Released: Sunday July 29, 2007 This poll was conducted by the Monmouth University Polling Institute 400 Cedar Avenue
THE ECONOMY, THE DEFICIT, AND THE PRESIDENT July 24-28, 2009
 CBS NEWS/NEW YORK TIMES POLL For Release: Wednesday, July 29, 2009 6:30 pm (EDT) THE ECONOMY, THE DEFICIT, AND THE PRESIDENT July 24-28, 2009 The economy remains the top concern for Americans, but as the
Support for Restoring U.S.-Cuba Relations March 11-15, 2016
 CBS NEWS/NEW YORK TIMES POLL For release: Monday, March 21, 2016 7:00 am EDT Support for Restoring U.S.-Cuba Relations March 11-15, 2016 Amid President Barack Obama s historic trip to Cuba, a majority
Public Opinion on Health Care Issues
 Public Opinion on Health Care Issues EARLY REACTION TO SUPREME COURT DECISION ON THE ACA MAJORITY OF AMERICANS REPORT BEING AWARE OF SUPREME COURT DECISION; THEIR REACTION? DIVIDED It can take a lot to
THE PUBLIC AND THE CRITICAL ISSUES BEFORE CONGRESS IN THE SUMMER AND FALL OF 2017
 THE PUBLIC AND THE CRITICAL ISSUES BEFORE CONGRESS IN THE SUMMER AND FALL OF 2017 July 2017 1 INTRODUCTION At the time this poll s results are being released, the Congress is engaged in a number of debates
HART/McINTURFF Study # page 1
 HART/McINTURFF Study #141290 --page 1 Interviews: 1000 registered voters including 666 likely voters, 350 respondents with a cell phone only and 41 respondents reached on a cell phone but who also have
America s Voice/LD State Battleground Survey, April 2016
 1a. [SPLIT A] On the whole, what are the most important issues facing the [Hispanic/Latino] community that you think Congress and the President should address? Open ended, Pre-code to list, MAY SELECT
NATIONAL: DID SHUTDOWN MAKE TRUMP LOOK STRONGER OR WEAKER
 Please attribute this information to: Monmouth University Poll West Long Branch, NJ 07764 www.monmouth.edu/polling Follow on Twitter: @MonmouthPoll Released: Monday, January 28, Contact: PATRICK MURRAY
THE BUSH PRESIDENCY AND THE STATE OF THE UNION January 20-25, 2006
 CBS NEWS/NEW YORK TIMES POLL For release: January 26, 2005 6:30 P.M. THE BUSH PRESIDENCY AND THE STATE OF THE UNION January 20-25, 2006 For the first time in his presidency, George W. Bush will give a
NEW JERSEY: TIGHT RACE IN CD03
 Please attribute this information to: Monmouth University Poll West Long Branch, NJ 07764 www.monmouth.edu/polling Follow on Twitter: @MonmouthPoll Released: Tuesday, August 14, Contact: PATRICK MURRAY
These are the highlights of the latest Field Poll completed among a random sample of 997 California registered voters.
 THE FIELD POLL THE INDEPENDENT AND NON-PARTISAN SURVEY OF PUBLIC OPINION ESTABLISHED IN 1947 AS THE CALIFORNIA POLL BY MERVIN FIELD Field Research Corporation 601 California Street, Suite 900 San Francisco,
Heading into the Conventions: A Tied Race July 8-12, 2016
 CBS NEWS/NEW YORK TIMES POLL For release: Thursday, July 14 th, 2016 7:00 am EDT Heading into the Conventions: A Tied Race July 8-12, 2016 The race for President is all tied up. Hillary Clinton led Donald
It s Democrats +8 in Likely Voter Preference, With Trump and Health Care on Center Stage
 ABC NEWS/WASHINGTON POST POLL: The 2018 Midterm Elections EMBARGOED FOR RELEASE AFTER 12:00 a.m. Sunday, Nov. 4, 2018 It s Democrats +8 in Likely Voter Preference, With Trump and Health Care on Center
GENERATIONAL DIFFERENCES
 S U R V E Y B R I E F GENERATIONAL DIFFERENCES March 2004 ABOUT THE 2002 NATIONAL SURVEY OF LATINOS In the 2000 Census, some 35,306,000 people living in the United States identifi ed themselves as Hispanic/Latino.
HART RESEARCH ASSOCIATES/PUBLIC OPINION STRATEGIES Study # page 1
 HART RESEARCH ASSOCIATES/PUBLIC OPINION STRATEGIES Study #18955 -- page 1 Interviews: 900 Registered Voters, including 405 respondents with a cell phone only and Date: September 16-19, 2018 21 respondents
REPORT TO PROPRIETARY RESULTS FROM THE 48 TH PAN ATLANTIC SMS GROUP. THE BENCHMARK OF MAINE PUBLIC OPINION Issued May, 2011
 REPORT TO PROPRIETARY RESULTS FROM THE 48 TH PAN ATLANTIC SMS GROUP OMNIBUS POLL THE BENCHMARK OF MAINE PUBLIC OPINION Issued May, 2011 5 Milk Street Portland, Maine 04101 Tel: (207) 871-8622 www.panatlanticsmsgroup.com
CHRISTIE JOB GRADE IMPROVES SLIGHTLY, RE-ELECTION SUPPORT DOES NOT
 Eagleton Institute of Politics Rutgers, The State University of New Jersey 191 Ryders Lane New Brunswick, New Jersey 08901-8557 www.eagleton.rutgers.edu eagleton@rci.rutgers.edu 732-932-9384 Fax: 732-932-6778
NBC News/Marist Poll. Do you consider your permanent home address to be in Minnesota? Which county in Minnesota do you live in?
 NBC News/Marist Poll July 2018 Minnesota Questionnaire Residents: n=1032 MOE +/-3.7% Registered Voters: n=876 MOE +/-4.0% Potential Democratic Electorate: n=439 MOE +/-5.6% Potential Republican Electorate:
Muhlenberg College/Morning Call. Pennsylvania 15 th Congressional District Registered Voter Survey
 KEY FINDINGS: Muhlenberg College/Morning Call Pennsylvania 15 th Congressional District Registered Voter Survey January/February 2018 1. As the 2018 Midterm elections approach Pennsylvania s 15 th Congressional
ALABAMA: TURNOUT BIG QUESTION IN SENATE RACE
 Please attribute this information to: Monmouth University Poll West Long Branch, NJ 07764 www.monmouth.edu/polling Follow on Twitter: @MonmouthPoll Released: Monday, 11, Contact: PATRICK MURRAY 732-979-6769
November 2017 Toplines
 November 2017 Toplines The first of its kind bi-monthly survey of racially and ethnically diverse young adults GenForward is a survey associated with the University of Chicago Interviews: 10/26-11/10/2017
RECOMMENDED CITATION: Pew Research Center, February 2014, Public Divided over Increased Deportation of Unauthorized Immigrants
 NUMBERS, FACTS AND TRENDS SHAPING THE WORLD FOR RELEASE FEBRUARY 27, 2014 FOR FURTHER INFORMATION ON THIS REPORT: Carroll Doherty, Director of Political Research Rob Suls, Research Associate 202.419.4372
September 2017 Toplines
 The first of its kind bi-monthly survey of racially and ethnically diverse young adults Field Period: 08/31-09/16/2017 Total N: 1,816 adults Age Range: 18-34 NOTE: All results indicate percentages unless