Connecting for Growth, Economic Inclusion & Prosperity Volume 4/2017
|
|
|
- Chloe Short
- 6 years ago
- Views:
Transcription
1 Connecting for Growth, Economic Inclusion & Prosperity Volume 4/2017 Dr Adrian Professor in Economics, Finance and Competitive Strategy, GIBS
2

3 3

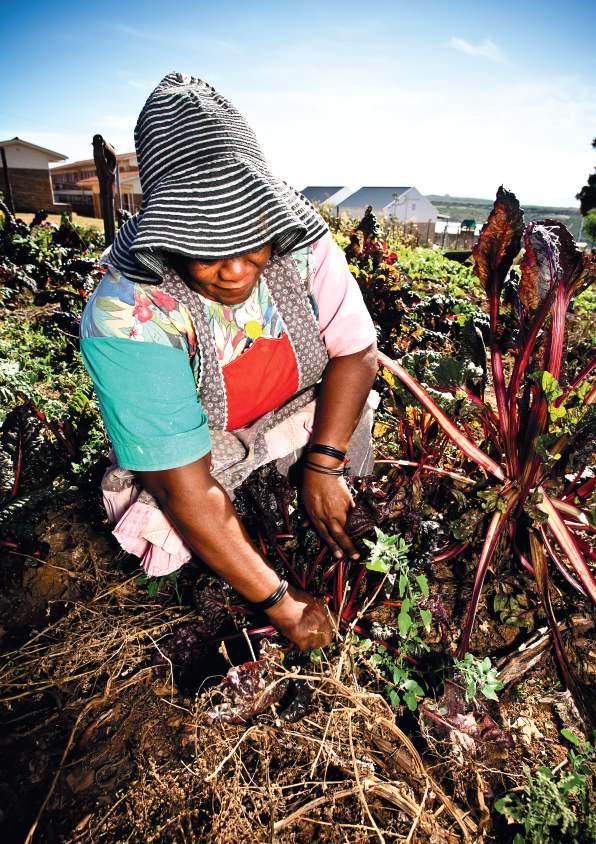
4 MEASURING CONNECTEDNESS The extent and nature of a country s connections to both the global and regional economy is one of the single biggest influencers of socio-economic change. While mainstream measures of economic integration have focussed more intently on trade flows and capital movements, they have a tendency to overlook other key pillars of economic connectedness, such as flows of information, knowledge, data and people, across borders. Measurement becomes more complex in many emerging and frontier economies, as data are often incomplete or missing entirely. This is especially true for the countries that make up Sub-Saharan Africa (Jerven, 2013). The Visa Africa Integration Index, now in its fourth edition, aims to improve our understanding on the importance of economic connectedness and to redress the deficit in information and knowledge about the mechanisms of socio-economic integration, which enable and promote development. Assimilating country and industry data, together with country-specific information proprietary to Visa, the index has measured and offered insight into economic connectedness for 11 indicative Sub-Saharan economies since The latest index highlights several important observations that, overwhelmingly, confirm the earlier findings. These are detailed below in this updated version, which extends to 19 countries divided into four regions Central Africa, East Africa, Southern Africa and West Africa representing 75% of the subcontinent s population and 85% of output. Several clear trends emerge: 4

5 Sub-Saharan African economies rank amongst the least connected in the world. Since our measurement began five years ago, however, the evidence points to connections growing quickly and effectively, particularly in east Africa, although Cameroon, Ghana and Zambia also stand out. In line with data for different countries studied over other periods, there is a strong correspondence between rising connectedness and improvements in economic and social wellbeing. Rwanda is an example of a stand out economy. Over the past five years, the country has displayed the largest relative gain in connectedness amongst the 19 countries in the index. This has manifested in a gain in per person income of 7.0% per year. All boats do not rise with the same tide. Kenya and Rwanda have made large gains in connectedness off relatively low bases over the five years covered by this research, Botswana has not moved much off its relatively high base, and Angola has struggled to improve off a low base. The Democratic Republic of Congo s score has fallen. The Visa Africa Integration Index makes an important and necessary contribution towards filling gaps in data and knowledge relating to many Sub-Saharan economies. It affords better understanding of the drivers and shapers of economic development in the region, helps inform data-driven policy and offers industrial and economic intelligence to business decision makers. 5

6 WHY CONNECTEDNESS MATTERS If the narrative that Sub-Saharan Africa will become the home of the next generation of economic miracles holds true, then the evidence of the past five decades, especially in nations that have shown rapid growth, shows that the pivotal factor for sustained, elevated and inclusive growth is the ability of countries to connect functionally and effectively to others. The next issue becomes examining the extent and nature of Sub-Saharan Africa s economic integration and connectedness. This is the subject of the Visa Africa Integration Index, which first covered the connectedness of African economies between 2011 and 2012, and which was subsequently updated for 2014, 2015 and 2016 (see Saville and White, 2013b; Saville and White, 2015a; Saville and Firth, 2016). This index originally covered 55% of the Sub- Saharan population and three-quarters of the region s output by measuring the depth and breadth of the connectedness of 11 African economies located in three clusters - East Africa (including Kenya, Rwanda, Tanzania and Uganda); West Africa (including Ghana and Nigeria); and Southern Africa (including Angola, Mozambique, South Africa, Zambia and Zimbabwe). With data that have recently become available, we are able to extend the coverage of the index by eight countries and refine the analysis by clustering the countries into four regions: i. Central Africa, which includes Angola, Cameroon and the Democratic Republic of Congo; ii. East Africa, covering Ethiopia, Kenya, Madagascar, Mauritius, Rwanda, Tanzania and Uganda; iii. Southern Africa, which includes Botswana, Mozambique, Namibia, South Africa, Zambia and Zimbabwe; and iv. West Africa, which includes Côte d Ivoire, Ghana and Nigeria. 6

7 The fourth edition employs these data to extend the coverage of the index to 19 economies representing three-quarters of the population and almost ninetenths of output. The results of this update confirm that Africa s connectedness is rising, and in turn where connectedness rises, it translates into growing prosperity. At a deeper level of analysis, the extent and nature of the drivers of connectedness and prosperity differ across regions and countries. Here the Visa Africa Integration Index can provide valuable insights into how one of the most powerful drivers of socioeconomic development in Sub-Saharan economies works. 7

8 GLOBAL CONNECTORS, LOCAL CHAMPIONS Between 2001 and 2015 the world economy grew by 2.8% per year. The Sub-Saharan African economy grew faster, led by the likes of Ethiopia, Rwanda, Tanzania and Zambia. Just seventeen years ago, in 2000, Ethiopia was the world s second-poorest country with an average income of $150 per person. An acceleration in economic performance has seen the Ethiopian economy grow by 9.2% per year over the last fifteen years faster than China or India. This rapid growth in Ethiopia was accompanied by increasing sophistication of value chains that embraced thousands of hectares of greenhouses. It also took in new infrastructure, an expanding international airline, the export of cut flowers, coffee and vegetables to Europe. Entrepreneurship development programmes and growing ties with other fast-growing economies such as China followed. Importantly, Ethiopia s great run has been validated by critical developmental indicators. Life expectancy, for instance, has risen by one year every year since Ethiopia s is not the only connectedness success story. Rwanda s economy has grown by 7.6% per year since 2001; and Tanzania, Uganda and Zambia each grew by an average 6.7% over the same period. These elevated growth rates have resulted in the Zambian economy taking a little more than ten years to double in size. Ethiopia s doubled in just eight years. Consequently, income per person in Ethiopia had grown four times over the last fifteen years, to reach $620 in Per capita incomes in Zambia have almost doubled over the fifteen years from $1,000 to $1,800. These transitions are impressive, but elevated, sustained and inclusive economic growth does not happen spontaneously. 1 All per capita data are in constant 2015 prices 8
: 2001-2015 16,0 14,0 12,0 10,0 8,0 6,0 4,0 2,0 0,0-2,0-4,0 Ethiopia Rwanda Sub-Saharan Africa World 2001")
9 Economic Growth (% p.a.): ,0 14,0 12,0 10,0 8,0 6,0 4,0 2,0 0,0-2,0-4,0 Ethiopia Rwanda Sub-Saharan Africa World World Bank (2016) 9

10 Countries that achieve high and sustained growth rates that underpin economic transformation and pave the road to prosperity have common elements. A study of 100 countries, spanning the five decades from , identifies a small set of potent elements that are common to the so-called miracle economies. These features include a high rate of saving that translates into raised investment levels; a young population that feeds into a growing workforce; the development and mobilisation of human capital through access to effective education and improving healthcare; a capable government with stable, growth-oriented policies underpinned by robust institutions; and functional integration with the world economy. The identity of those countries that make up the miracle set over the past fifty years are well known, and include places as geographically different and industrially diverse as Botswana, Chile, China, Estonia, Japan, Poland, Singapore, South Korea, Taiwan and Vietnam. As the experiences of these countries show, the impacts and effects of elevated, sustained and inclusive economic growth can be dramatic. Between 1966 and 2015, South Korea s per capita income grew from $1,400 to $28,000 a 20-fold increase in two generations. China s achievement is as impressive, with income per person growing from $900 in 1990 to $7,300 in 2015 amounting to an 8-fold gain in just 25 years. The effects of these economic transformations, however, reach well beyond gains in individual income. Chile is a good example of the potential, nature and extent of rapid, sustained growth. Today the country is known for salmon exports, some of the world s finest chardonnay and home to LATAM Airlines, one of the largest and most successful airlines flying the globe. Yet Chile was once poor. Chilean income in the mid-1970s stood at $700 per person, the unemployment rate was 25%, and consumer price inflation peaked at 508%. Life expectancy averaged 60 years and income inequality ranked amongst the worst in the world, with a Gini coefficient of This economic tragedy was met by a series of policy shifts that served to raise savings, promote healthcare, advance education, stabilise institutions and establish effective, functional connections with other countries and world markets. This cocktail for stability and growth, applied over the 30 years from 1986 to 2015, saw the Chilean economy grow at an average of 5.0% per year, with just two instances of negative year-on-year growth in the entire 30 years. By 2015 the Chilean economy had come to be characterised by low and stable consumer price inflation, unemployment was largely absent, income inequality had improved materially, life 10

11 expectancy stood at 82 years and per capita income amounted to $15,000, ranking Chile as a high-income economy. That Chile began the miracle period as a low-income, commodity-driven, factor-based economy vulnerable to external shocks with almost no evident competitive advantage lends power to the country s tale of transition and the necessary policy shifts made to achieve this. 11

12 THE EVIDENCE BEHIND AFRICA RISING The ingredients required to achieve elevated, sustained and inclusive growth are common across continents and time. It is encouraging that the last fifteen years has seen the narrative extended to include, for the first time, Sub-Saharan Africa as a collective. To this end, the Sub-Saharan economy grew by only 1.7% per year over the 1980s and 1990s, lagging the world economy s average of 2.9% per year. The gap in per capita income growth rates was even wider, with Sub-Saharan Africa s per person income falling by 1.1% per year over the two decades compared to the global average that grew by 1.4% per person per year. Since the turn of the century, though, the data tell a different story. The world economy has recorded economic growth of 2.8% per year and income per person has grown by 1.3% per year. This is much in line with the previous 20 years. By contrast, Sub-Saharan Africa s economic growth rate has lifted to 5.1% per year, and per capita income has grown at an average 2.3% per year. As a result, Sub-Saharan Africa ranks as the second-fastest growing region in the world over the past fifteen years. South Africa is an exception, with income per capita stuck at $7,500 over the past decade. Critically, in line with experiences in the so-called miracle economies, this rapid growth has been, largely, accompanied by rising social mobility, economic inclusion and structural transition. For instance, life expectancy across the continent at birth has risen from 48 years in 1980 to 60 years today, which, while still too low, evidences an upward trend due to improving healthcare. Primary school enrolment rates have moved from 76.9% into 1980 to 98.4% today, pointing to improved education. Population growth remains robust, averaging 2.8% per year in the last fifteen years, compared to a slowing world population growth rate. In a similar vein, scores that measure the quality of policies and strength of institutions for 40 Sub-Saharan countries have shown steady improvement over the last two decades to stand at all-time highs today. Further, saving rates and investment levels for the world economy are largely unchanged over the past fifteen years, whereas the average savings and investment rate for Sub-Saharan economies are 30% higher today than at the turn of the century. 12

13 Growth in Per Capita Income: ,0 2, ,0 1,5 1,0 0,5 0,0-0,5-1,0-1,5 World Bank (2016) World In short, the Sub-Saharan economic narrative shift from left behind to closing the gap is borne out by evidence of the same set of fast growth features as in the growth miracles countries. Equally important in this observation is that the elevated growth rates that emerged the growth miracles in the latter part of the twentieth century and that we see in a range Sub-Saharan Africa of Sub-Saharan economies today were unheard of before the 1960s. There is an important point in this note. Sustaining growth rates of more than five percent per annum over multiple decades has only been possible because the world economy is now more open and integrated. 13

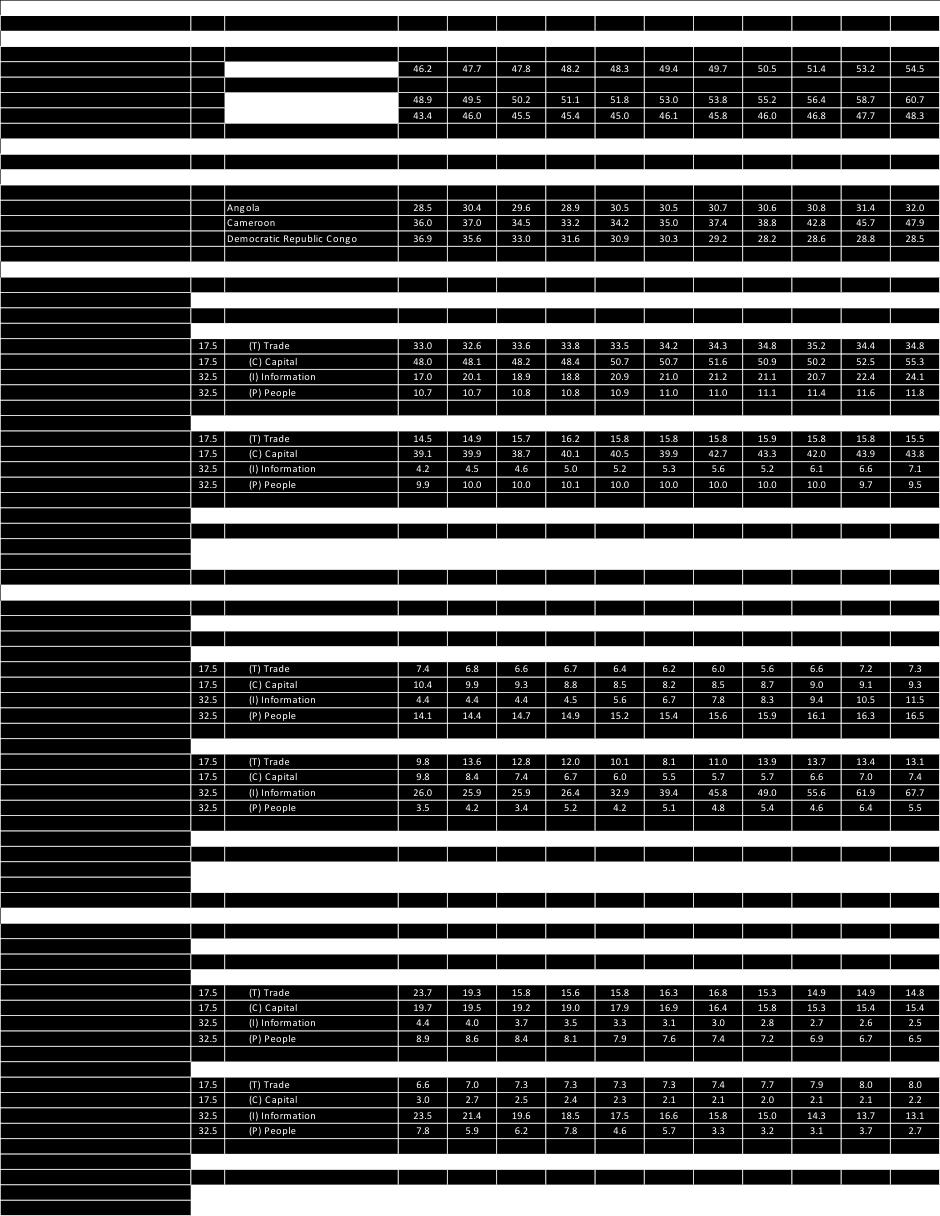
14 AN EVIDENCE-BASED APPROACH TO UNDERSTANDING THE INFLUENCE OF GLOBAL CONNECTORS & THE CAUSES OF FAST GROWTH As noted by the Commission on Growth and Development (2008) in The Growth Report: Strategies for Sustained Growth and Inclusive Development, economic connections allow fast-growing economies to import ideas, technologies, know-how and knowwhy from the rest of the world. The world economy, when not protectionist, offers developing countries a deep, elastic market for their exports that enables specialisation of labour, makes economies of scale and scope possible, allows countries to specialise in new export lines and to improve their productivity in manifold ways. The Ethiopian example is a case in point. Economic openness also provides access to other scarce resources, such as investment funds, especially in the form of foreign direct investment. Another resource that economic integration affords is foreign education, which often creates lasting international networks. In turn, because learning something is easier than inventing it, fast learners or technological adopters can rapidly gain ground on leading economies, which gives birth to economic convergence or catch up whereby poorer economies per capita incomes grow at faster rates than richer economies. If this holds, then all economies should eventually converge in terms of per capita income. These points are supported by Jeffrey Sachs and Andrew Warner s (1995) study of 111 countries spanning two decades. The results of this work showed that developing countries with functional economic connections had growth of 4.5% per person per year, industrialised countries had growth of 2.3% and closed economies grew by 2.0% per person per year. From this argument and evidence, sustainable, high growth is catch-up growth and connecting and integrating to the global economy through functional economic relationships is the essential resource. In his recent work, World 3.0: Global Prosperity and How to Achieve It, Pankaj Ghemawat (2011) formalised a framework to capture the nature, extent and effects of global connections and economic integration. Specifically, Ghemawat identified four channels through which countries connect with others, namely the flow of goods and services or trade (T); financial integration and the movement of capital in the form of foreign investment, foreign aid 14

15 and credit extension (C); the flow of information and knowledge (I) and the movement of people (P). This TCIP framework, in turn, allows for the measurement of the extent or depth of a country s economic connectedness as well as the nature or breadth of the connectedness. 15

16 CONNECTED? DEEP OR BROAD? In terms of depth, a country is considered to be deeply integrated, if the economy is particularly open and highly connected to the rest of the world. However, integration only becomes deep and broad if a highly-connected economy is engaged with a wide variety of counter parties across the different strands of global relationships. Angola serves as a good example, Angolan crude petroleum makes up 91% of exports with two thirds going to just three countries, China, India and the United States. This makes Angola s connectedness narrow. Contrast this with the widely connected economy of Poland whose exports range from gas turbines and rubber tyres through to rolled tobacco and poultry. These wideranging exports find their markets in over seventyfive countries. Based on this, measuring economic integration by way of depth and breadth provides for a robust and granular description as well as a better understanding of the nature of cross-country economic integration and helps us move beyond conventional and admittedly narrow economic measures. Using this framework, and supporting Sachs and Warner s (1995) earlier evidence, Ghemawat and Altman (2011, 64) note, Rich countries are consistently more globally connected than poor countries. The authors go on to show that strong, positive relationships exist between the depth and breadth of economic integration and economic growth, per capita incomes and broader socio-economic indicators. In their study of 112 countries, Ghemawat and Altman (2011, 64) report a correlation of 0.58 between economic openness and per capita incomes. They also find positive individual relationships between income and each of the four pillars of connectedness covering trade, capital, information and people flows. Further, economic connectedness explains as much as onefifth of economic growth across countries, and a strong positive relationship exists between economic integration and the United Nations Development Programme s Human Development Index, with a correlation of 0.63 (Ghemawat and Altman, 2011, 64). Critically, Ghemawat s framework also establishes that causality runs from economic integration to economic prosperity and improvements in welfare, and not the other way around. These findings are supported by a more recent study of 142 countries, which finds a strong, positive relationship between economic prosperity and the 2 The Human Development Index (HDI) is a composite measure which looks at health, education and income indicators to assess the general wellbeing of a country s population. 16

17 depth and breadth of trade, capital, information and people flows (Saville, 2016). To this end, the evidence suggests that as much as half of the difference in income per person for these 142 countries can be explained by the extent and nature of economic integration. Economic Integration & Income Per Person GDP per Capita ($, 2015) y = 724,27x R² = 0, Economic Integration (TCIP) Score Adrian Saville (2016) 17

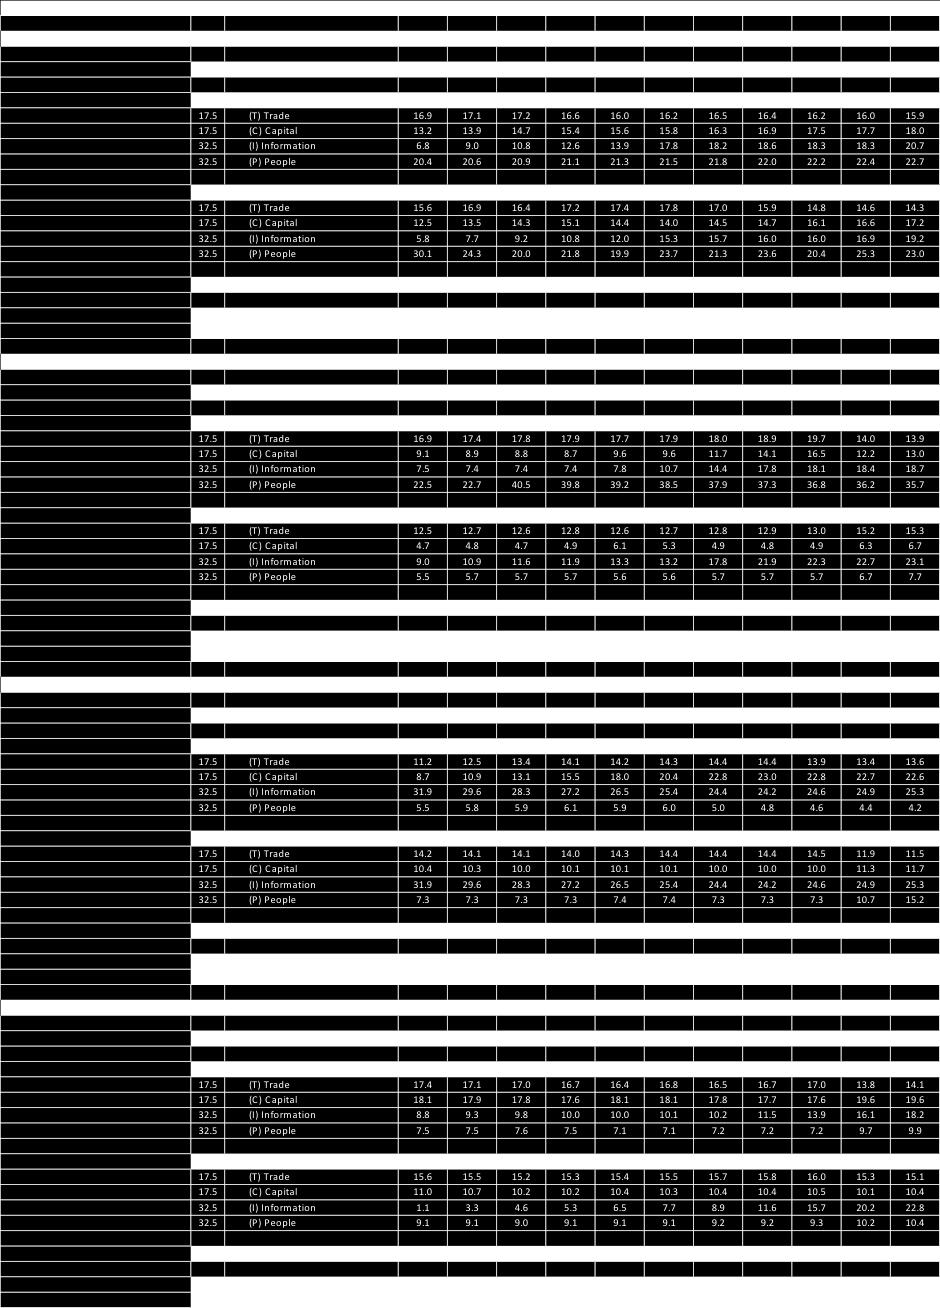
18 BUILDING THE INDEX The construction of this index, which is carefully detailed in Saville and White (2013a), draws on Ghemawat s four pillars of trade, capital, information and people to measure the breadth and depth of each country s connectedness to the world economy, at large, and the region, more specifically. The tables below show the components of each of the four pillars which also are scaled to establish representativeness. For instance, trade flows are compared to the size of the economy by way of a trade-to-income ratio and internet usage is scaled by population to give a penetration ratio. As captured in the tables, in measuring connectedness we recognise that economic integration takes place through four main channels, namely the flows of goods and services, or trade (T); the movement of foreign capital (C); exchanges of data, information, know-how and know-why (I); and the flow of people across borders as tourists, teachers, employees, and immigrants (P). We also recognise that integration takes many forms that include a consideration of depth and breadth as well as the geographic nature of economic connections. via the so-called TCIP flows would be considered to be deeply integrated. In measuring breadth, a country that has a more diversified portfolio of TCIP flows would be considered to be broadly integrated. Dissecting connectedness in this manner is imperative as depth and breadth each play a role in explaining the contribution that economic integration plays in driving socio-economic improvement. In the same way measuring the geographic nature of economic integration is instructive because regional integration or connecting to neighbours is found to be a more powerful and sustained contributor to socio-economic advance than global integration per se (Saville and White, 2013a). On this score, depth refers to the extent of economic connections where a country that has a high degree of connectedness with outside economic partners 18

19 19

20 Notably, the Visa Africa Integration Index blends macroeconomic data with proprietary microeconomic data sourced from Visa Sub-Saharan Africa. The Visa information has a number of desirable attributes in the construction of the index, including: i. the frequency with which the information is updated, namely biannually with access to quarterly data, compared to the conventional annual production of public data; ii. the relatively short lags normally three months between the flows that are measured and the data becoming available, as compared to the relatively long lags which can measure years in the case of public data; and iii. the uniqueness of the data which provides access to valuable and reliable information on connectivity that is not available in the public domain. 20

21 21
, for many of the poorest regions of the world the underlying figures supporting existing estimates of economic activity and social welfare are minimal or, in some")
22 MINDING THE GAP On this last point, those familiar with the region will recognise that data gaps, lags and omissions are a constant challenge to formulating policy and doing business in Africa. As noted by Young (2012, 1), for many of the poorest regions of the world the underlying figures supporting existing estimates of economic activity and social welfare are minimal or, in some instances, non-existent. This is particularly the case for African economies. For example, the Penn World Tables purchasing power parity data set provides real income estimates for 45 Sub-Saharan countries, yet for 24 of those countries there is no benchmark study of prices. In a similar vein, although the online United Nations National Accounts database provided GDP data in current and constant prices for 47 Sub-Saharan countries for each year from 1991, more than half of the data points are missing over a period of a decade and no constant price data had been received for any year for 15 of the countries for a period of almost 15 years (Young, 2012, 2). In addition to helping us overcome problems of missing data, the Visa data help address a second challenge in data sets, namely data robustness or accuracy. As Jerven (2013) demonstrates, even where numbers are available, figures are often misstated because of capacity constraints, changing economic structures and large informal economies that behave differently from the more conventional and readily measurable formal economy. This means that a key challenge in any survey of African economic development is to bolster statistical capacity. As Jerven (2013) illustrates, reliable statistics are basic to the operation of governments in developing countries, vital to non-governmental organisations and invaluable to business. In this way, the construction of the Visa Africa Integration Index and the proprietary data inputs represent a contribution to developing statistical capacity and building robust data pools. As noted, the index has been extended in 2017 to cover 19 countries. This extensive study examines countries omitted from other economic connectedness and integration indices which have been developed, such as the A.T. Kearney Globalization Index, Zurich ETH University s KOF Index of Globalization, the Ernst & Young Globalization Index and the DHL Global Connectedness Index. 22
23 23
.")
24 Another aspect of the Visa Africa Integration Index that is worth noting is that each pillar and component is attributed a weight based on economic relevance and development contribution (Saville and White, 2015). Aside from cementing the relevance of the index in monitoring economic performance and changes, the granularity of the index affords unique insights into economic and industrial makeup of the constituent countries. At launch, the index established a number of attributes and elements for the initial 11 countries making up the index (Saville and White, 2013b). These findings have been confirmed by subsequent updates, and point to implications for the region more generally (Saville and White, 2015a; Saville and Firth, 2016). The results of the first four editions of the index, covering the period , are outlined below. 3 Gross domestic product. 24
25 25
, who provide a detailed description and explanation of the index s construction, a score of 100 index points represents the global median in terms of")
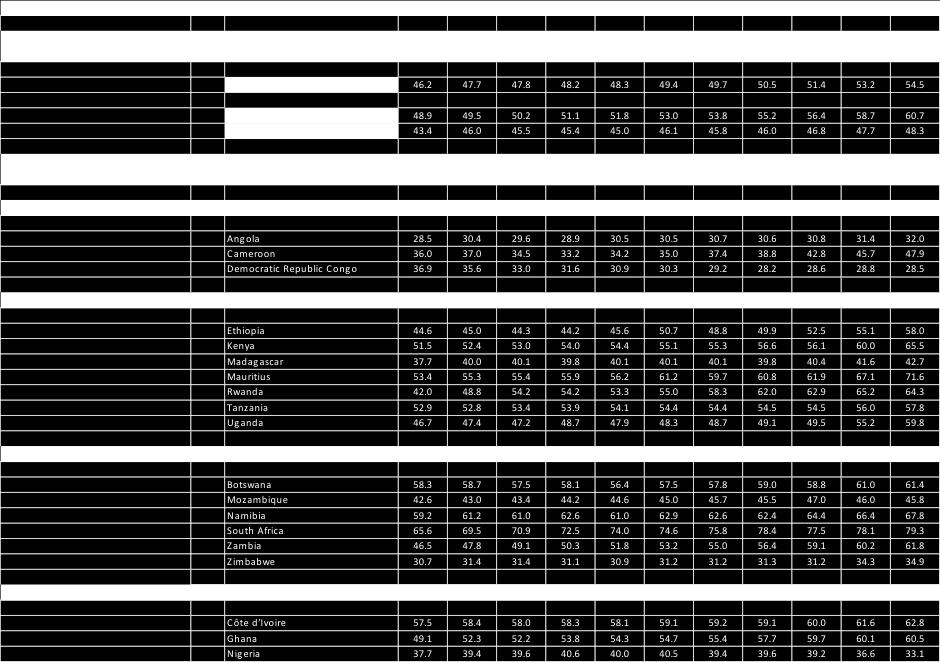
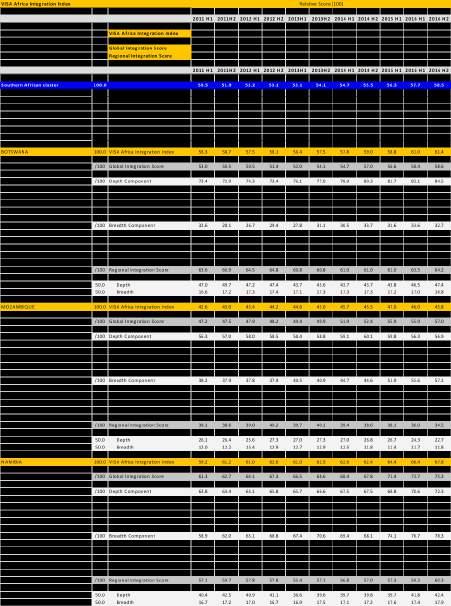
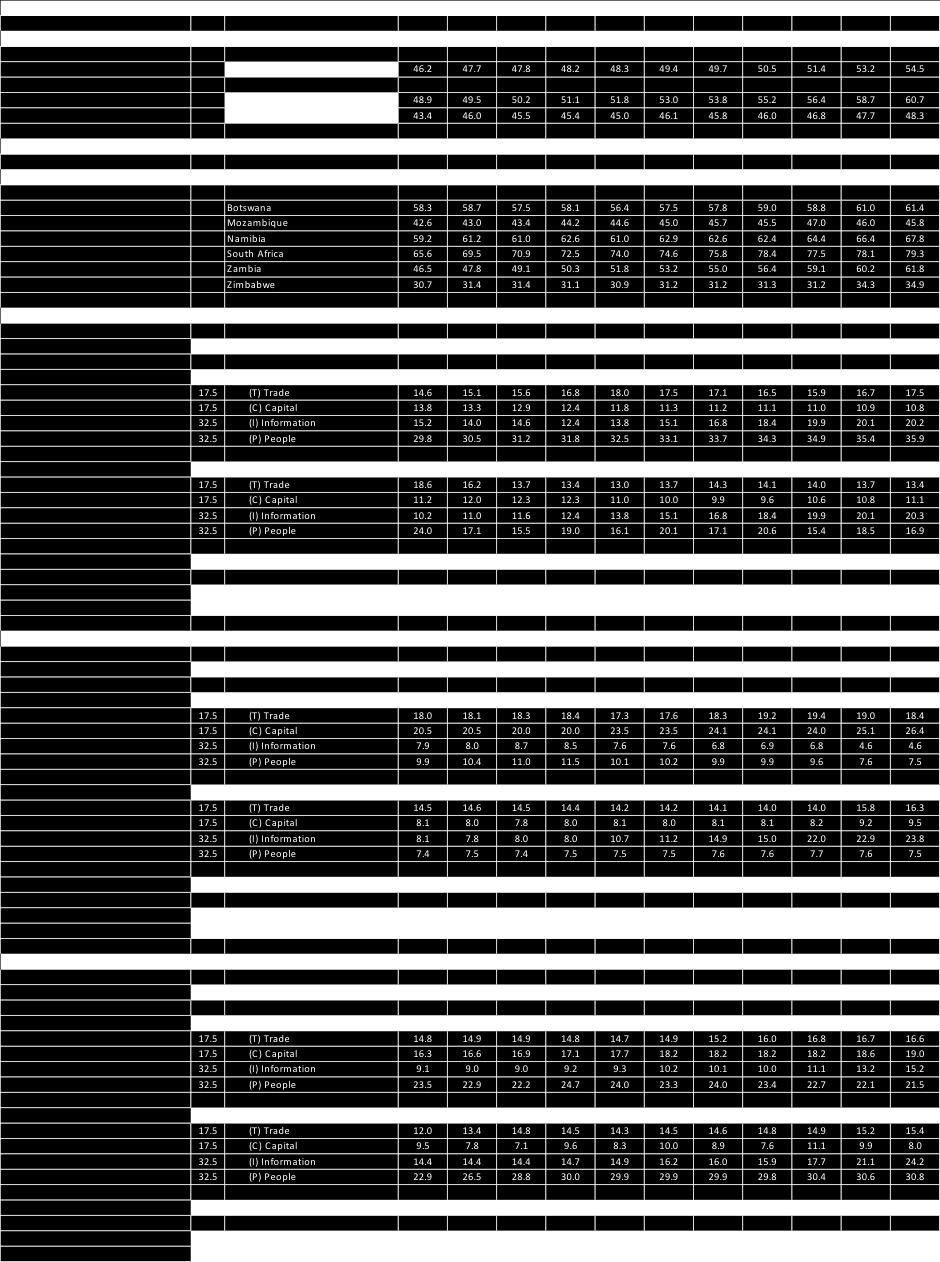
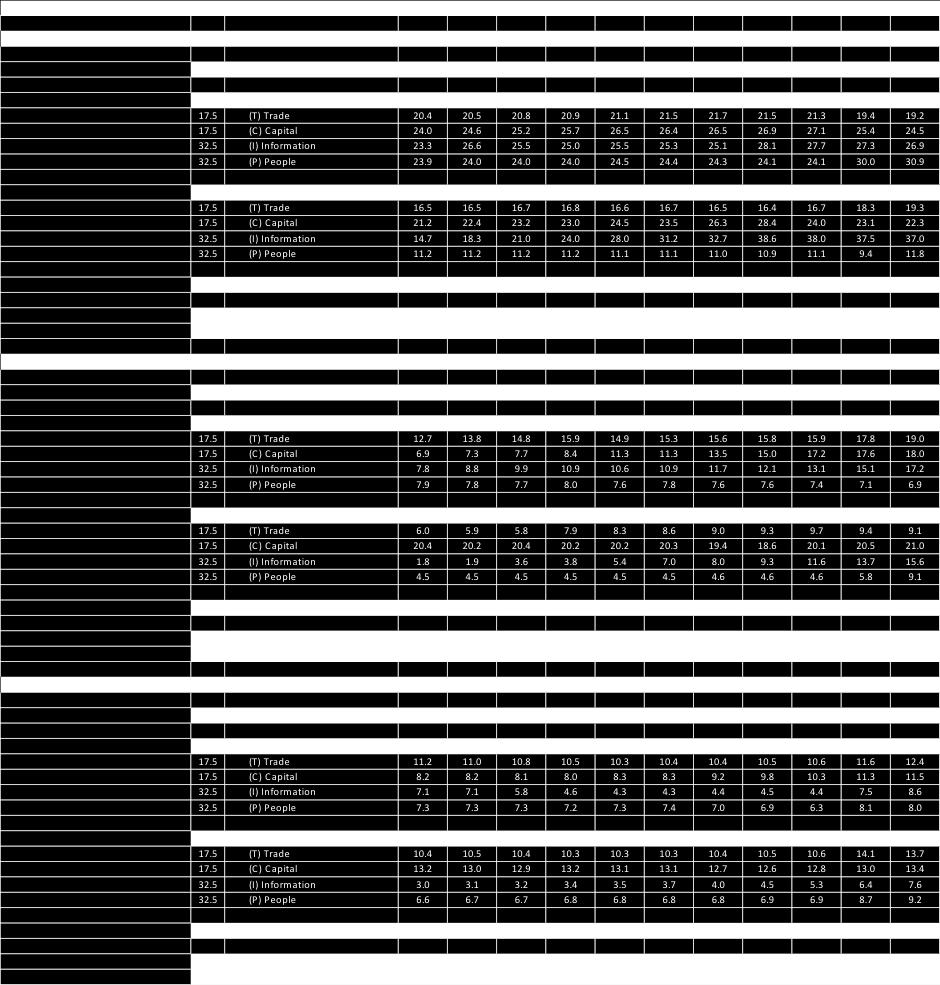
26 VISA AFRICA INTEGRATION INDEX: FINDINGS OF THE FOURTH EDITION First, as an aggregate, African economies are amongst the least integrated in the world. As outlined by Saville and White (2013a), who provide a detailed description and explanation of the index s construction, a score of 100 index points represents the global median in terms of connectedness and integration. Countries in this median category are India, Panama, the Philippines and Romania, as examples. In the main, African economies lag this benchmark meaningfully. Visa Africa Integration Index (2016) 100,0 90,0 80,0 70,0 60,0 50,0 40,0 30,0 20,0 10,0 0,0 26 Central Africa Angola Cameroon DRC East Africa Ethiopia Kenya Madagascar Mauritius Rwanda Tanzania Uganda Southern Africa Botswana Mozambique Namibia South Africa Zambia Zimbabwe West Africa Côte d Ivoire Ghana Nigeria

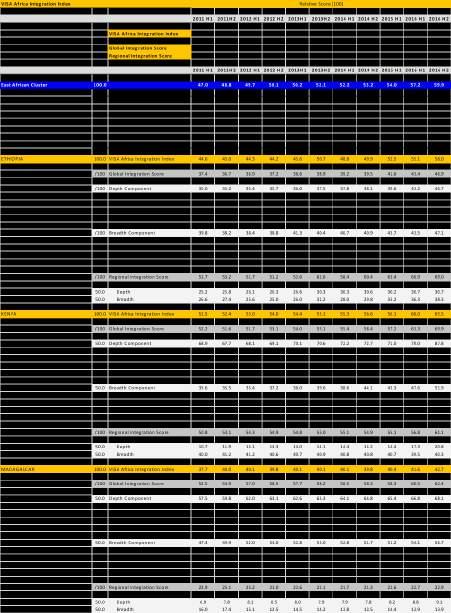
27 Second, the index shows that African economies are emerging off modest bases, yet demonstrating progressive structural improvements toward higher levels of integration with their respective regions and the world. East Africa, in particular, shows signs of rising connectedness over the first three survey periods. The fourth edition confirms this trend. Over the past five years, the greatest gains in economic 100,0 VISA Africa Integration Index: 2011 and 2016 integration have been made by the East African economies of Ethiopia, Kenya, Mauritius, Rwanda and Uganda. However, in West Africa, Ghana has made quick gains; in Southern Africa, Zambia has made the greatest strides off a relatively low base; and in the cluster of countries that makes up Central Africa, Cameroon is the big mover. 90, ,0 70,0 60,0 50,0 40,0 30,0 20,0 10,0 0,0 Central Africa Angola Cameroon DRC East Africa Ethiopia Kenya Madagascar Mauritius Rwanda Tanzania Uganda Southern Africa Botswana Mozambique Namibia South Africa Zambia Zimbabwe West Africa Côte d Ivoire Ghana Nigeria 27
28 Third, the index also shows that some countries are more integrated globally than regionally and vice versa, which is important information for policy makers who aim to deepen and broaden integration in their respective regions. This is an important point because, as noted earlier, regional integration or connecting to neighbours is a more powerful and sustained contributor to socio-economic advance than global integration (Saville and White, 2013a). Yet, the regional connectedness for sub-saharan economies lags other areas by a wide margin. Africa has the lowest percentage of intra-regional trade globally: only 14% of African total trade takes place with other African economies, versus 71% in Europe, 52% in South-East Asia and 40% in the North American Free Trade Area. VISA Africa Integration Index: Global & Regional Sub-Indices 65,0 60,0 55,0 50,0 45,0 40,0 35,0 30, H1 2011H H H2 2013H1 2013H H H H H H2 VISA Africa Integration Index Global Integration Score Regional Integration Score Trade between Sub-Saharan economies is hampered by high trade barriers and legacy transport infrastructure that raise the cost and increase the difficulty of doing business across borders in Africa. As evidence of this, Anabel Gonzalez, a senior director at the World Bank, notes, due to trade barriers, a truck crossing a border in southern Africa may need to carry up to 1,600 documents because of permits and licences. As noted earlier, the benefits to economic integration are numerous (Winter, 2017). Economic integration can serve as an incentive for foreign direct investment and help allocate production to countries with a comparative advantage, which in turn will promote specialisation and encourage economies of scale and scope. This is of particular relevance in the African context, as the continent is the most fragmented region in the world. Almost half of the 54 countries that make up Africa have relatively small economies and population sizes of fewer than 10 million people. These markets are too small to achieve the economies of scale needed to compete internationally, and many suffer from a further disadvantage of large distances to market. While low regional integration is a collective attribute, the differences across countries varies materially, with Angola, Madagascar, Nigeria and Zimbabwe displaying the lowest regional integration in the four regions, and Cameroon, Cote d Ivoire, Ethiopia and Zambia displaying the highest regional integration in the four regions. Extending this analysis to the regional level, East Africa and Southern Africa display a significantly higher level of regional integration than Central Africa or West Africa, which has implications for economic development and growth prospects. 28
29 Visa Africa Integration Index: 2016 Regional Integration Score 100,0 90,0 80,0 70,0 60,0 50,0 40,0 30,0 20,0 10,0 0,0 Central Africa Angola Cameroon DRC East Africa Ethiopia Kenya Madagascar Mauritius Rwanda Tanzania Uganda Southern Africa Botswana Mozambique Namibia South Africa Zambia Zimbabwe West Africa Côte d Ivoire Ghana Nigeria As a collective, however, it remains the case that although the connectedness of the region is rising, the drivers are growing global connections rather than connections to neighbours. This feature is universal for the 19 countries covered in the study. Visa Africa Integration Index: Global & Regional Sub-Indices 65,0 60,0 55,0 50,0 45,0 40,0 35,0 30, H1 2011H H H2 2013H1 2013H H H H H H2 VISA Africa Integration Index Global Integration Score Regional Integration Score 29
30 Fourth, the index underlines the differences that exist across countries, highlighting the risks that sit in the treatment of Africa as a single market. To this end, the appendix offers details on each of the countries, and also provides aggregate measures that capture broader trends. These features are captures in the detailed country-specific appendices. Fifth, as shown in our earlier work, there is a strong, positive correlation between changes in economic connectedness and per capita incomes for the 19 countries over the six-year period covered by the index. This is a valuable guide in pointing to the worth and robustness of the index. To speak to the evidence, over the period , the fast growing economies of Ethiopia, Ghana, Mauritius, and Rwanda all displayed strong advances in economic integration. By contrast, the slower growing economies of Angola, the Democratic Republic of Congo and Nigeria struggled to promote economic connections. The result for all 19 countries points to a positive correspondence between economic integration and growth in income per person. Change in Visa Africa Integration Index and Growth in Income Per Person: ,0 y = x R² = ,0 Ethiopia Ghana Change in Per Capita Income (% p.a. PPP) 5,0 4,0 3,0 2,0 Nigeria Mozambique Côte d Ivoire Zimbabwe Tanzania Namibia Botswana Madagascar Angola Uganda Kenya Cameroon Zambia Mauritius Rwanda 1,0 DRC South Africa 0,0-10,0-5,0 0,0 5,0 10,0 15,0 20,0 25,0 Change In Visa Africa Integration Index (Points) 30
31 31

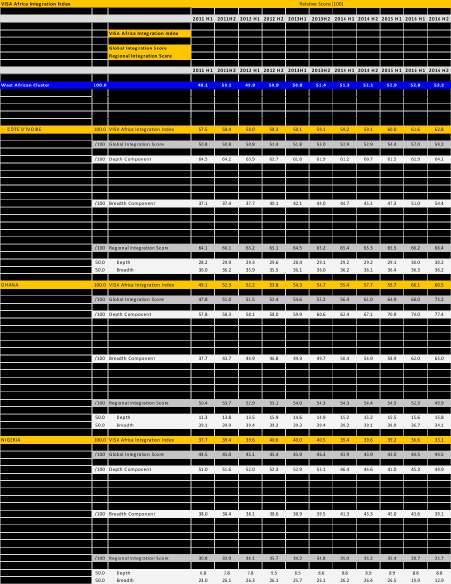
32 MEASURING AFRICA S CONNECTEDNESS Whilst assessing the results of the Visa Africa Integration Index justifies a volume on each country, constraints of time and space leave this task to the user. To this end, the appendices of this report detail the results for each county and show, inter alia: i. global and regional connectedness for each country; ii. the components of global depth and global breadth by way of trade (T), capital (C), information (I) and people (P) scores; iii. regional depth and regional breadth; and iv. a composite country score. In the final analysis, the net result is useful in pointing to potent trends that have been in place over a number of years which, in turn, help explain economic performance and changes in development observed in many parts of Africa over the past fifteen years. The differences observed between countries, however, is a critical reminder that Africa is divergent, and that the drivers, challenges, threats, risks and opportunities are different across the continent s 54 markets. In addition to this contribution to knowledge, the Visa Africa Integration Index is also a valuable tool in improving measurement of African economies connectedness with neighbours and with the world and advancing our understanding of how this connectedness is evolving. The most recent edition of the index adds to our efforts to close gaps that exist in knowledge and information. Beyond Africa, the Visa Africa Integration Index makes a valuable contribution to knowledge by establishing more comprehensive and robust measures of economic integration compared to those historically available. 32
33 33

34 34 VISA AFRICA INTEGRATION INDEX
35 35

36 36
37 37
38 38
39 39
40 40
41 REFERENCES Commission on Growth and Development (2008) The Growth Report: Strategies for Sustained Growth and Inclusive Development. World Bank: Washington, DC. Ghemawat, P. (2011) World 3.0: Global Prosperity and How to Achieve It. Harvard Business Press: Boston, Massachusetts. Ghemawat, P. with Altman, S. (2011), DHL Global Connectedness Index 2011: Analyzing Global Flows and their Power to Increase Prosperity. Deutschepost DHL: Bonn, Germany. Jerven, M. (2013) Poor Numbers: How We Are Misled by African Development Statistics and What to Do about It. Cornell University Press: London. Sachs, J.D. and Warner, A.M. (1995) Economic Convergence and Economic Policies. NBER Working Paper No Issued February 1995 Saville, A.D. (2016) Visa Africa Integration Index 2016: The Case of Nigeria. Produced for Visa Sub-Saharan Africa: October Saville, A.D. and Firth, K. (2016) Realising Potential, Connecting Africa: Visa Africa Integration Index, Third Edition. Visa Sub-Saharan Africa. Available via: Saville, A.D. and White, L. (2013a) Connecting Africa, Realising Potential: Visa Africa Integration Index. Working Paper. Available via: (2013b) Connecting Africa: Visa Africa Integration Index, First Edition. Visa Sub-Saharan Africa. Available via: (2015a) Realising Potential: Visa Africa Integration Index, Second Edition. Visa Sub-Saharan Africa Available via: (2015b) Ensuring that Africa Keeps Rising: The Economic Integration Imperative, South African Journal of International Affairs, Vol. 22(1). (2016) Bringing Pankaj Ghemawat to Africa: Measuring African Economic Integration, South African Journal of Economic and Management Science, Vol. 19(1). Young, A. (2012) The African Growth Miracle. NBER Working Paper No. W18490, October

42 42
43 43
44
Prosperity in Central and Eastern Europe A Legatum Institute Prosperity Report
 Prosperity in Central and Eastern Europe 2016 A Legatum Institute Prosperity Report The Legatum Institute The Legatum Institute is an international think tank and educational charity focused on understanding
Growth and poverty reduction in Africa in the last two decades
 Growth and poverty reduction in Africa in the last two decades And how does Rwanda fare? Andy McKay University of Sussex IPAR's Annual Research Conference Outline The Economist Recent SSA growth experience
Inclusive global growth: a framework to think about the post-2015 agenda
 Inclusive global growth: a framework to think about the post-215 agenda François Bourguignon Paris School of Economics Angus Maddison Lecture, Oecd, Paris, April 213 1 Outline 1) Inclusion and exclusion
Ghana Lower-middle income Sub-Saharan Africa (developing only) Source: World Development Indicators (WDI) database.
 Source: World Development Indicators (WDI) database.") Knowledge for Development Ghana in Brief October 215 Poverty and Equity Global Practice Overview Poverty Reduction in Ghana Progress and Challenges A tale of success Ghana has posted a strong growth performance
Knowledge for Development Ghana in Brief October 215 Poverty and Equity Global Practice Overview Poverty Reduction in Ghana Progress and Challenges A tale of success Ghana has posted a strong growth performance
realising Potential: connecting Africa SuMMArY PAPEr Visa Africa integration index
 realising Potential: connecting Africa Visa Africa integration index SuMMArY PAPEr VISA SUB-SAHARAN AFRICA in conjunction With Prof. ADriAN SAViLLE AND Dr LYAL WhitE TUNISIA MOROCCO WESTERN SAHARA ALGERIA
Maternal healthcare inequalities over time in lower and middle income countries
 Maternal healthcare inequalities over time in lower and middle income countries Amos Channon 30 th October 2014 Oxford Institute of Population Ageing Overview The importance of reducing maternal healthcare
To be opened on receipt
 Oxford Cambridge and RSA To be opened on receipt A2 GCE ECONOMICS F585/01/SM The Global Economy STIMULUS MATERIAL *6373303001* JUNE 2016 INSTRUCTIONS TO CANDIDATES This copy must not be taken into the
KPMG: 2013 Change Readiness Index Assessing countries' ability to manage change and cultivate opportunity
 KPMG: 2013 Change Readiness Index Assessing countries' ability to manage change and cultivate opportunity Graeme Harrison, Jacqueline Irving and Daniel Miles Oxford Economics The International Consortium
Overview of Human Rights Developments & Challenges
 Overview of Human Rights Developments & Challenges Background: Why Africa Matters (Socio- Economic & Political Context) Current State of Human Rights Human Rights Protection Systems Future Prospects Social
Globalisation and Open Markets
 Wolfgang LEHMACHER Globalisation and Open Markets July 2009 What is Globalisation? Globalisation is a process of increasing global integration, which has had a large number of positive effects for nations
HOW ECONOMIES GROW AND DEVELOP Macroeconomics In Context (Goodwin, et al.)
") Chapter 17 HOW ECONOMIES GROW AND DEVELOP Macroeconomics In Context (Goodwin, et al.) Chapter Overview This chapter presents material on economic growth, such as the theory behind it, how it is calculated,
Chapter 17 HOW ECONOMIES GROW AND DEVELOP Macroeconomics In Context (Goodwin, et al.) Chapter Overview This chapter presents material on economic growth, such as the theory behind it, how it is calculated,
Has Globalization Helped or Hindered Economic Development? (EA)
") Has Globalization Helped or Hindered Economic Development? (EA) Most economists believe that globalization contributes to economic development by increasing trade and investment across borders. Economic
Has Globalization Helped or Hindered Economic Development? (EA) Most economists believe that globalization contributes to economic development by increasing trade and investment across borders. Economic
Lecture 1 Economic Growth and Income Differences: A Look at the Data
 Lecture 1 Economic Growth and Income Differences: A Look at the Data Rahul Giri Contact Address: Centro de Investigacion Economica, Instituto Tecnologico Autonomo de Mexico (ITAM). E-mail: rahul.giri@itam.mx
Trade Patterns in the SADC Region: Key Issues for the FTA
 Trade patterns in the SADC region key issues for the FTA Development Policy Research Unit University of Cape Town Trade Patterns in the SADC Region: Key Issues for the FTA DPRU Policy Brief No. 00/P9 March
Africa -Opportunities for Entrepreneurship Dr. Jack M. Wilson Distinguished Professor of Higher Education, Emerging Technologies, and Innovation
 Africa -Opportunities for Entrepreneurship Dr. Jack M. Wilson Distinguished Professor of Higher Education, Emerging Technologies, and Innovation 18-Africa Opportunities for Entrepreneurship 1 1 Some of
Connecting Africa Visa Africa Integration Index
 Realising Potential: Connecting Africa Visa Africa Integration Index Prepared by Prof. Adrian Saville and Kelly Firth for Visa Sub-Saharan Africa VOLUME 3/2016 1 2 3 Table of Contents 04 38 List of Figures
Growth, Structural Transformation and Development
 Finn Tarp Keynote at The Third Voice of Social Sciences Conference (VSS) on Industrialization and Social Transformation University of Dar es Salaam, Tanzania, 24-25 November 2016 Growth, Structural Transformation
HIGHLIGHTS. There is a clear trend in the OECD area towards. which is reflected in the economic and innovative performance of certain OECD countries.
 HIGHLIGHTS The ability to create, distribute and exploit knowledge is increasingly central to competitive advantage, wealth creation and better standards of living. The STI Scoreboard 2001 presents the
IB Diploma: Economics. Section 4: Development Economics COURSE COMPANION. First Edition (2017)
") IB Diploma: Economics Section 4: Development Economics COURSE COMPANION First Edition (2017) Economic development... 3 Nature of economic growth and economic development... 3 Common Characteristics of
IB Diploma: Economics Section 4: Development Economics COURSE COMPANION First Edition (2017) Economic development... 3 Nature of economic growth and economic development... 3 Common Characteristics of
STATISTICAL REFLECTIONS
 World Population Day, 11 July 217 STATISTICAL REFLECTIONS 18 July 217 Contents Introduction...1 World population trends...1 Rearrangement among continents...2 Change in the age structure, ageing world
2010 Human Development Report: 40-year Trends Analysis Shows Poor Countries Making Faster Development Gains
 Strictly embargoed until 4 November 2010, 10:00 AM EDT (New York), 14:00PM GST 2010 Human Development Report: 40-year Trends Analysis Shows Poor Countries Making Faster Development Gains 20th anniversary
The Challenge of Inclusive Growth: Making Growth Work for the Poor
 2015/FDM2/004 Session: 1 The Challenge of Inclusive Growth: Making Growth Work for the Poor Purpose: Information Submitted by: World Bank Group Finance and Central Bank Deputies Meeting Cebu, Philippines
Conference on What Africa Can Do Now To Accelerate Youth Employment. Organized by
 Conference on What Africa Can Do Now To Accelerate Youth Employment Organized by The Olusegun Obasanjo Foundation (OOF) and The African Union Commission (AUC) (Addis Ababa, 29 January 2014) Presentation
DRIVERS OF DEMOGRAPHIC CHANGE AND HOW THEY AFFECT THE PROVISION OF EDUCATION
 DRIVERS OF DEMOGRAPHIC CHANGE AND HOW THEY AFFECT THE PROVISION OF EDUCATION This paper provides an overview of the different demographic drivers that determine population trends. It explains how the demographic
Your Excellencies the Ambassadors Ladies and Gentlemen
 Speech on Enhancing an Enabling Environment for the Diaspora to invest beyond remittances in Uganda s Social-Economic Transformation. By Prof. Emmanuel Tumusiime-Mutebile, Governor, Bank of Uganda At the
Edexcel (B) Economics A-level
 Economics A-level") Edexcel (B) Economics A-level Theme 2: The Wider Economic Environment 2.4 Life in a Global Economy 2.4.2 Developed, emerging and developing economies Notes Indicators of growth: o GDP per capita GDP per
Edexcel (B) Economics A-level Theme 2: The Wider Economic Environment 2.4 Life in a Global Economy 2.4.2 Developed, emerging and developing economies Notes Indicators of growth: o GDP per capita GDP per
Part 1: The Global Gender Gap and its Implications
 the region s top performers on Estimated earned income, and has also closed the gender gap on Professional and technical workers. Botswana is among the best climbers Health and Survival subindex compared
THAILAND SYSTEMATIC COUNTRY DIAGNOSTIC Public Engagement
 THAILAND SYSTEMATIC COUNTRY DIAGNOSTIC Public Engagement March 2016 Contents 1. Objectives of the Engagement 2. Systematic Country Diagnostic (SCD) 3. Country Context 4. Growth Story 5. Poverty Story 6.
Mexico: How to Tap Progress. Remarks by. Manuel Sánchez. Member of the Governing Board of the Bank of Mexico. at the. Federal Reserve Bank of Dallas
 Mexico: How to Tap Progress Remarks by Manuel Sánchez Member of the Governing Board of the Bank of Mexico at the Federal Reserve Bank of Dallas Houston, TX November 1, 2012 I feel privileged to be with
Income and Population Growth
 Supplementary Appendix to the paper Income and by Markus Brueckner and Hannes Schwandt November 2013 downloadable from: https://sites.google.com/site/markusbrucknerresearch/research-papers Table of Contents
ZiMUN 2017 General Assembly Research Report
 Forum: Issue: Increasing Involvement between SADC and ASEAN Blocks Student officer: Ryan Patrick Sylvester Position: Deputy President Chair Introduction ASEAN is an organisation created in the 1960s in
Challenges and Opportunities for harnessing the Demographic Dividend in Africa
 Challenges and Opportunities for harnessing the Demographic Dividend in Africa Eliya Msiyaphazi Zulu (PhD.) Presented at the Network on African Parliamentary Committee of Health Meeting Kampala, Uganda
Discussion of Angus Deaton, Wellbeing: Measurement and Concepts
 Discussion of Angus Deaton, Wellbeing: Measurement and Concepts Charles I. Jones Stanford GSB Discussion of Deaton on Wellbeing p.1/17 PPP Problems Discussion of Deaton on Wellbeing p.2/17 International
Information Seminar for African Members of. the ILO Governing Body
 Information Seminar for African Members of the ILO Governing Body Opening remarks by: Mr Aeneas C. Chuma ILO Assistant Director-General and Regional Director for Africa 27 April 2015 Addis Ababa, Ethiopia
How to Generate Employment and Attract Investment
 How to Generate Employment and Attract Investment Beatrice Kiraso Director UNECA Subregional Office for Southern Africa 1 1. Introduction The African Economic Outlook (AEO) is an annual publication that
Higher education global trends and emerging opportunities to Kevin Van-Cauter Higher Education Adviser The British Council
 Higher education global trends and emerging opportunities to 2020 Kevin Van-Cauter Higher Education Adviser The British Council Outline Where are international students coming from? Trends in Engineering
Test Bank for Economic Development. 12th Edition by Todaro and Smith
 Test Bank for Economic Development 12th Edition by Todaro and Smith Link download full: https://digitalcontentmarket.org/download/test-bankfor-economic-development-12th-edition-by-todaro Chapter 2 Comparative
The Demography of the Labor Force in Emerging Markets
 The Demography of the Labor Force in Emerging Markets David Lam I. Introduction This paper discusses how demographic changes are affecting the labor force in emerging markets. As will be shown below, the
AFRICA S YOUTH: JOBS OR MIGRATION?
 AFRICA S YOUTH: JOBS OR MIGRATION? _ 2019 IBRAHIM FORUM REPORT MO IBRAHIM FOUNDATION In 2017, migrants represented only 3.4% of the global population, a marginal increase from 2.9% in 1990 There were 36.3
Global Social Progress Index
 Global Social Progress Index How do we advance society? Economic Development Social Progress www.socialprogressindex.com The Social Progress Imperative defines social progress as: the capacity of a society
IEP Risk and Peace. Institute for Economics and Peace. Steve Killelea, Executive Chairman. Monday, 18th November 2013 EIB, Luxemburg
 IEP Risk and Peace Steve Killelea, Executive Chairman Institute for Economics and Peace Monday, 18th November 2013 EIB, Luxemburg Institute for Economics and Peace (IEP) The Institute for Economics and
UNLOCKING GROWTH AND PROSPERITY. The Global Rule of Law and Business Dashboard 2017
 UNLOCKING GROWTH AND PROSPERITY The Global Rule of Law and Business Dashboard 2017 The U.S. Chamber of Commerce is the world s largest business federation representing the interests of more than 3 million
chapter 1 people and crisis
 chapter 1 people and crisis Poverty, vulnerability and crisis are inseparably linked. Poor people (living on under US$3.20 a day) and extremely poor people (living on under US$1.90) are more vulnerable
Lecture 4: Measuring Welfare
 Lecture 4: Measuring Welfare Nicolas Roys University of Wisconsin Madison Econ 302 - Spring 2015 Comparing welfare across countries and over time How succesful is an economy at delivering the highest possible
Charting Australia s Economy
 Charting Australia s Economy Designed to help executives catch up with the economy and incorporate macro impacts into company s planning. Annual subscription includes 2 semiannual issues published in June
Slums As Expressions of Social Exclusion: Explaining The Prevalence of Slums in African Countries
 Slums As Expressions of Social Exclusion: Explaining The Prevalence of Slums in African Countries Ben C. Arimah United Nations Human Settlements Programme (UN-HABITAT) Nairobi, Kenya 1. Introduction Outline
GDP per capita was lowest in the Czech Republic and the Republic of Korea. For more details, see page 3.
 International Comparisons of GDP per Capita and per Hour, 1960 9 Division of International Labor Comparisons October 21, 2010 Table of Contents Introduction.2 Charts...3 Tables...9 Technical Notes.. 18
Trading Competitively: A Study of Trade Capacity Building in Sub-Saharan Africa
 OECD Development Centre Trading Competitively: A Study of Trade Capacity Building in Sub-Saharan Africa By Federico Bonaglia and Kiichiro Fukasaku Executive Summary July, 2002 1. This study addresses the
GaveKalDragonomics China Insight Economics
 GaveKalDragonomics China Insight 6 September 211 Andrew Batson Research director abatson@gavekal.com Is China heading for the middle-income trap? All fast-growing economies slow down, eventually. Since
Enhancing the demographic dividend for socioeconomic transformation in Africa the role of parliamentarians
 Enhancing the demographic dividend for socioeconomic transformation in Africa the role of parliamentarians Eliya Msiyaphazi Zulu, PhD Executive Director, AFIDEP Presented at the meeting at 2016 NEAPACOH
Rule of Law Index 2019 Insights
 World Justice Project Rule of Law Index 2019 Insights Highlights and data trends from the WJP Rule of Law Index 2019 Trinidad & Tobago Tunisia Turkey Uganda Ukraine United Arab Emirates United Kingdom
A Foundation for Dialogue on Freedom in Africa
 A Foundation for Dialogue on dom in Africa Sub-Saharan Africa in 007 presents at the same time some of the most promising examples of new democracies in the world places where leaders who came to power
Poverty in the Third World
 11. World Poverty Poverty in the Third World Human Poverty Index Poverty and Economic Growth Free Market and the Growth Foreign Aid Millennium Development Goals Poverty in the Third World Subsistence definitions
Health, wealth, and growth: why lowering cookstove trade barriers makes sense
 Health, wealth, and growth: why lowering cookstove trade barriers makes sense The World Bank s ACCES initiative & Dalberg Global Development Advisors 10 November 2015 A good advocacy strategy can determine
Africa s growth momentum in the past 25 years has been remarkable by historical
 2 GROWTH, JOBS, AND POVERTY IN AFRICA KEY MESSAGES Africa s growth momentum in the past 25 years has been remarkable by historical standards. Was it marked by growth dynamics that presage sustained growth?
London Measured. A summary of key London socio-economic statistics. City Intelligence. September 2018
 A summary of key socio-economic statistics September 2018 People 1. Population 1.1 Population Growth 1.2 Migration Flow 2. Diversity 2.1 Foreign-born ers 3. Social Issues 3.1 Poverty & Inequality 3.2 Life
2018 Social Progress Index
 2018 Social Progress Index The Social Progress Index Framework asks universally important questions 2 2018 Social Progress Index Framework 3 Our best index yet The Social Progress Index is an aggregate
A Speech on the Occasion of the Launch of the Institute of Directors of Malawi, By Mr. Patrick D. Chisanga,
 A Speech on the Occasion of the Launch of the Institute of Directors of Malawi, By Mr. Patrick D. Chisanga, Member, Private Sector Advisory Group (PSAG) of the Global Corporate Governance Forum Blantyre,
THE FASTEST GROWING LEAST DEVELOPED COUNTRIES
 Wioletta NOWAK University of Wroclaw THE FASTEST GROWING LEAST DEVELOPED COUNTRIES Case Study Keywords Economic development, Economic growth, LDCs JEL Classification O11, O47, O57 Abstract The paper presents
BBVA EAGLEs. Emerging And Growth Leading Economies Economic Outlook. Annual Report 2014 Cross-Country Emerging Markets, BBVA Research March 2014
 BBVA EAGLEs Emerging And Growth Leading Economies Economic Outlook Annual Report 2014 Cross-Country Emerging Markets, BBVA Research March 2014 Index Key takeaways in 2013 Rethinking EAGLEs for the next
2017 SADC People s Summit Regional Debates and Public Speaking Gala. Strengthening Youth Participation in Policy Dialogue Processes
 2017 SADC People s Summit Regional Debates and Public Speaking Gala Strengthening Youth Participation in Policy Dialogue Processes Constitutional Hill, Johannesburg South Africa 16 18 August 2017 Introduction
Charting Indonesia s Economy, 1H 2017
 Charting Indonesia s Economy, 1H 2017 Designed to help executives interpret economic numbers and incorporate them into company s planning. Publication Date: January 3 rd, 2017 Next Issue: To be published
Development Economics Lecture 1
 Development Economics Lecture 1 Anne Mikkola Partly using slides of Prof. Haaparanta EXAMS (one of the following) Date: 11.12.2007: Time: 12-14 Place: Porthania II Date: 16.1.2008: Time: 12-14 Place: Economicum
Charting Cambodia s Economy
 Charting Cambodia s Economy Designed to help executives catch up with the economy and incorporate macro impacts into company s planning. Annual subscription includes 2 semiannual issues published in June
Asia's giants take different routes By Martin Wolf Published: February :36 Last updated: February :36
 Asia's giants take different routes By Martin Wolf Published: February 22 2005 20:36 Last updated: February 22 2005 20:36 Almost two out of every five people on the planet are either Chinese or Indian.
Jens Thomsen: The global economy in the years ahead
 Jens Thomsen: The global economy in the years ahead Statement by Mr Jens Thomsen, Governor of the National Bank of Denmark, at the Indo- Danish Business Association, Delhi, 9 October 2007. Introduction
The Comparative Advantage of Nations: Shifting Trends and Policy Implications
 The Comparative Advantage of Nations: Shifting Trends and Policy Implications The Nobel Prize-winning economist Paul Samuelson once famously argued that comparative advantage was the clearest example of
2017 Social Progress Index
 2017 Social Progress Index Central Europe Scorecard 2017. For information, contact Deloitte Touche Tohmatsu Limited In this pack: 2017 Social Progress Index rankings Country scorecard(s) Spotlight on indicator
Full file at
 Chapter 2 Comparative Economic Development Key Concepts In the new edition, Chapter 2 serves to further examine the extreme contrasts not only between developed and developing countries, but also between
IMPACT OF GLOBALIZATION ON POVERTY: CASE STUDY OF PAKISTAN
 Romain Pison Prof. Kamal NYU 03/20/06 NYU-G-RP-A1 IMPACT OF GLOBALIZATION ON POVERTY: CASE STUDY OF PAKISTAN INTRODUCTION The purpose of this paper is to examine the effect of globalization in Pakistan
Lecture notes 1: Evidence and Issues. These notes are based on a draft manuscript Economic Growth by David N. Weil. All rights reserved.
 Lecture notes 1: Evidence and Issues These notes are based on a draft manuscript Economic Growth by David N. Weil. All rights reserved. Lecture notes 1: Evidence and Issues 1. A world of rich and poor:
A COMPARISON OF ARIZONA TO NATIONS OF COMPARABLE SIZE
 A COMPARISON OF ARIZONA TO NATIONS OF COMPARABLE SIZE A Report from the Office of the University Economist July 2009 Dennis Hoffman, Ph.D. Professor of Economics, University Economist, and Director, L.
Understanding global and local inequalities: an EU-AFD initiative. 15/01/2018 AFD, Paris
 Understanding global and local inequalities: an EU-AFD initiative 15/01/2018 AFD, Paris Global Inequality: Trends and Issues Finn Tarp, Director, United Nations University World Institute for Development
Africa s Recovery from the Global Recession: Challenges and Opportunities
 Africa s Recovery from the Global Recession: Challenges and Opportunities Professor Hassan Y. Aly Chief Research Economist The African Development Bank At the WB, Egypt April 24, 2010 Key Messages I. Africa
Impact of Religious Affiliation on Economic Growth in Sub-Saharan Africa. Dean Renner. Professor Douglas Southgate. April 16, 2014
 Impact of Religious Affiliation on Economic Growth in Sub-Saharan Africa Dean Renner Professor Douglas Southgate April 16, 2014 This paper is about the relationship between religious affiliation and economic
Informal Summary Economic and Social Council High-Level Segment
 Informal Summary 2011 Economic and Social Council High-Level Segment Special panel discussion on Promoting sustained, inclusive and equitable growth for accelerating poverty eradication and achievement
Prospects for Inclusive Growth in the MENA Region: A Comparative Approach
 Prospects for Inclusive Growth in the MENA Region: A Comparative Approach Hassan Hakimian London Middle East Institute SOAS, University of London Email: HH2@SOAS.AC.UK International Parliamentary Conference
The Prosperity Index in Africa. The Role of Entrepreneurship and Opportunity in Sub-Saharan Africa
 The Prosperity Index in Africa The Role of Entrepreneurship and Opportunity in Sub-Saharan Africa May 2011 Contents Overview and Key Findings...1 Background: Entrepreneurship the Locus of Growth...1 Prosperity
HAS GROWTH PEAKED? 2018 growth forecasts revised upwards as broad-based recovery continues
 HAS GROWTH PEAKED? 2018 growth forecasts revised upwards as broad-based recovery continues Regional Economic Prospects May 2018 Stronger growth momentum: Growth in Q3 2017 was the strongest since Q3 2011
The Demography of the Labor Force in Sub- Saharan Africa
 The Demography of the Labor Force in Sub- Saharan Africa David Lam Department of Economics and Population Studies Center University of Michigan Conference on Labor Markets in Western Africa: Evidence and
For more effective support of Africa s economic development
 For more effective support of Africa s economic development Courses of economic action proposed by the German-African Business Association to address the causes of flight Addressing the causes of flight
vi. rising InequalIty with high growth and falling Poverty
 43 vi. rising InequalIty with high growth and falling Poverty Inequality is on the rise in several countries in East Asia, most notably in China. The good news is that poverty declined rapidly at the same
Labour market of the new Central and Eastern European member states of the EU in the first decade of membership 125
 Labour market of the new Central and Eastern European member states of the EU in the first decade of membership 125 Annamária Artner Introduction The Central and Eastern European countries that accessed
Latin America in the New Global Order. Vittorio Corbo Governor Central Bank of Chile
 Latin America in the New Global Order Vittorio Corbo Governor Central Bank of Chile Outline 1. Economic and social performance of Latin American economies. 2. The causes of Latin America poor performance:
The Multidimensional Financial Inclusion MIFI 1
 2016 Report Tracking Financial Inclusion The Multidimensional Financial Inclusion MIFI 1 Financial Inclusion Financial inclusion is an essential ingredient of economic development and poverty reduction
ASEAN5 s economies have held up very well despite the global economic down turn, with domestic spending as the main driver.
 ASEAN5 s economies have held up very well despite the global economic down turn, with domestic spending as the main driver. Average GDP growth 2009-2012 Unit: %YOY 7 6 5 4 3 2 1 0 Contributions of GDP
GOVERNANCE STATISTICS, 2010
 GOVERNANCE STATISTICS, 2010 1. INTRODUCTION This is the first issue of Economic and Social Indicators (ESI) on Governance Statistics. It presents the situation of the country in areas of governance such
Presentation 1. Overview of labour migration in Africa: Data and emerging trends
 ARLAC Training workshop on Migrant Workers, 8 September 1st October 015, Harare, Zimbabwe Presentation 1. Overview of labour migration in Africa: Data and emerging trends Aurelia Segatti, Labour Migration
Figure 1. International Student Enrolment Numbers by Sector 2002 to 2017
 International Student Enrolments in Australia by Sector in Comparison to Higher Education Professor Emeritus Frank P. Larkins The University of Melbourne Summary The growth in international students enrolling
Facilitation Tips and Handouts for Making Population Real Training Sessions
 Facilitation Tips and Handouts for Making Population Real Training Sessions The training PowerPoint presentations accompany the following handouts. Tips for facilitating each session are also provided.
Asia-Pacific to comprise two-thirds of global middle class by 2030, Report says
 Strictly embargoed until 14 March 2013, 12:00 PM EDT (New York), 4:00 PM GMT (London) Asia-Pacific to comprise two-thirds of global middle class by 2030, Report says 2013 Human Development Report says
Chapter 11. Trade Policy in Developing Countries
 Chapter 11 Trade Policy in Developing Countries Preview Import-substituting industrialization Trade liberalization since 1985 Trade and growth: Takeoff in Asia Copyright 2015 Pearson Education, Inc. All
RECENT TRENDS AND DYNAMICS SHAPING THE FUTURE OF MIDDLE INCOME COUNTRIES IN AFRICA. Jeffrey O Malley Director, Data, Research and Policy UNICEF
 RECENT TRENDS AND DYNAMICS SHAPING THE FUTURE OF MIDDLE INCOME COUNTRIES IN AFRICA Jeffrey O Malley Director, Data, Research and Policy UNICEF OUTLINE 1. LICs to LMICs to UMICs: the recent past 2. MICs
Jobs, labour markets & shared growth Trends and issues
 A DFID practice paper Briefing June 08 Jobs, labour markets & shared growth Trends and issues This briefing note from PRD s Growth Team is the first of a pair for DFID staff and partner governments on
Unemployment and underemployment data
 Helpdesk Report Unemployment and underemployment data Laura Bolton Institute of development Studies 23 November 2016 Question Identify the number (absolute and as a proportion of the working age population)
ARANGKADA PHILIPPINES 2010: A BUSINESS PERSPECTIVE. Figure 10: Share in world GDP,
 Living in the High Growth Neighborhood The Philippines is located in the world s fastest growing region. Figure 10 shows that the ASEAN-6 plus 4 (China, India, Japan, and Korea) in 2009 had about the same
Inclusive Growth in Bangladesh: A Critical Assessment
 2 ND SANEM ANNUAL ECONOMISTS CONFERENCE MANAGING GROWTH FOR SOCIAL INCLUSION Inclusive Growth in Bangladesh: A Critical Assessment Towfiqul Islam Khan Research Fellow, CPD Dhaka:
How s Life in Germany?
 How s Life in Germany? November 2017 Relative to other OECD countries, Germany performs well across most well-being dimensions. Household net adjusted disposable income is above the OECD average, but household
Emerging Market Consumers: A comparative study of Latin America and Asia-Pacific
 Emerging Market Consumers: A comparative study of Latin America and Asia-Pacific Euromonitor International ESOMAR Latin America 2010 Table of Contents Emerging markets and the global recession Demographic
Global Scenarios until 2030: Implications for Europe and its Institutions
 January 2013 DPP Open Thoughts Papers 3/2013 Global Scenarios until 2030: Implications for Europe and its Institutions Source: Global Trends 2030: Alternative Worlds, a publication of the National Intelligence