A Demographic Portrait of Occupational Outcomes for Immigrants in the Saint Louis Metropolitan Region
|
|
|
- Wendy Page
- 6 years ago
- Views:
Transcription

1 A Demographic Portrait of Occupational Outcomes for Immigrants in the Saint Louis Metropolitan Region J.S. Onésimo Sandoval Associate Professor and Co-Director of the Public and Social Policy Ph.D. Program Saint Louis University Pedro Ruiz Ph.D. Student in the Ph.D. Program for Public and Social Policy Saint Louis University
2 Outline of Presentation Motivation Research Objectives Research Design and Data Empirical Findings Summary
3 MOTIVATION FOR THE STUDY
4 Foreign-born Population Trends Foreign-born population 130, ,074 49,833 80, % increase in the foreign-born population since

5 The pre-tabulated tables provide important information but we are limited with our analysis. For example, we only have five occupational categories.
6 The goal of this study was to develop a methodology to allow researchers and non-profit organizations to answer any question beyond the pre-tabulated tables.
7 RESEARCH OBJECTIVES
8 Three Objectives Develop a methodology to study occupational outcomes by demographic characteristics for: Unemployed foreign-born workers Employed foreign-born workers Underemployed foreign-born workers STEM occupations Develop a methodology to map the results for the Saint Louis Region Develop a methodology to allow for comparisons with other regions in future studies
9 RESEARCH DESIGN AND DATA
10 Data American Community Survey Aggregate Data from American FactFinder American Community Survey IPUMS 5 year sample ( ) PUMA Geography for maps Analytical Plan for Occupational Outcomes Unemployed foreign-born workers Employed foreign-born workers Underemployed foreign-born workers working but living in poverty working in an occupation not using their education STEM foreign-born workers
11 KEY DEMOGRAPHIC CHARACTERISTICS
12 Immigrants are still trying to understand the concept of U.S. racial categories Slightly less than half of the immigrants had a college or post-college education
13 NUMBER OF COUNTRIES FOR EACH RACIAL CATEGORY countries werr represented by the working age immigrant population ASIAN BLACK LATINO OTHER WHITE Source: American Community Survey Year sample, IPUMS-USA, University of Minnesota, Figure created by Sandoval and Ruiz.
14 RACE OF WORKING-AGE IMMIGRANT POPULATION 10% 20% 2% 32% 36% 36% of the workingage immigrant population was Asian ASIAN BLACK LATINO OTHER WHITE Source: American Community Survey Year sample, IPUMS-USA, University of Minnesota, Figure created by Sandoval and Ruiz.
15 EDUCATION 19% 25% 56% 56% of working-age immigrants had less than a college education LESS THAN COLLEGE EDUCATION COLLEGE EDUCATION POST COLLEGE EDUCATION Source: American Community Survey Year sample, IPUMS-USA, University of Minnesota, Figure created by Sandoval and Ruiz.
16 QUESTION #1 HOW MUCH TALENT DO WE HAVE IN THE REGION THAT IS UNDER-UTILIZED?
17 79,149 IMMIGRANT POPULATION IN SAINT LOUIS, MO 73,848 13% of employed immigrants were underemployed 20,948 28% 5,301 9,604 of employed immigrants are in STEM occupations IN LABOR MARKET UNEMPLOYED WORKING UNDEREMPLOYED STEM Source: American Community Survey Year sample, IPUMS-USA, University of Minnesota, Figure created by Sandoval and Ruiz.
18 QUESTION #2 WHO ARE THE UNEMPLOYED IMMIGRANTS?
19 UNEMPLOYED 27% 36% 25% 36% of unemployed immigrants were White 7% 5% 7% of unemployed immigrants were Black ASIAN BLACK LATINO OTHER WHITE Source: American Community Survey Year sample, IPUMS-USA, University of Minnesota, Figure created by Sandoval and Ruiz.
20 UNEMPLOYED 9% 71% 20% 71% of unemployed immigrants had less than a college education LESS THAN COLLEGE EDUCATION COLLEGE EDUCATION POST COLLEGE EDUCATION Source: American Community Survey Year sample, IPUMS-USA, University of Minnesota, Figure created by Sandoval and Ruiz.
21 UNEMPLOYED BUSINESS, FINANCE, ARTS & SCIENCE SALES, OFFICE & EDUCATION HEALTHCARE SERVICES FARMING CONSTRUCTION & EXTRACTION TRANSPORTATION PRODUCTION PROTECTIVE & MILITARY 1% 4% 8% 12% 11% 20% 20% 24% Source: American Community Survey Year sample, IPUMS-USA, University of Minnesota, Figure created by Sandoval and Ruiz. 24% of unemployed immigrants were classified as protective and military
22 QUESTION #3 WHO ARE THE EMPLOYED IMMIGRANTS?
23 EMPLOYED 2% 31% 20% 36% 36% of employed immigrants were Asian 10% 31% of employed immigrants were White ASIAN BLACK LATINO OTHER WHITE Source: American Community Survey Year sample, IPUMS-USA, University of Minnesota, Figure created by Sandoval and Ruiz.
24 EMPLOYED 18% 26% 55% 55% of employed immigrants had less than a college education LESS THAN COLLEGE EDUCATION COLLEGE EDUCATION POST COLLEGE EDUCATION Source: American Community Survey Year sample, IPUMS-USA, University of Minnesota, Figure created by Sandoval and Ruiz.
25 EMPLOYED 28% of employed immigrants were in Business, Finance, Arts, and Science BUSINESS, FINANCE, ARTS & SCIENCE SALES, OFFICE & EDUCATION HEALTHCARE SERVICES FARMING CONSTRUCTION & EXTRACTION TRANSPORTATION PRODUCTION PROTECTIVE & MILITARY 0% 0% 5% 10% 16% 19% 21% 28% Source: American Community Survey Year sample, IPUMS-USA, University of Minnesota, Figure created by Sandoval and Ruiz.
26 QUESTION #4 WHO ARE THE UNDEREMPLOYED IMMIGRANTS?
27 UNDEREMPLOYED 1% 13% 26% 25% 35% 35% of underemployed immigrants were Latino ASIAN BLACK LATINO OTHER WHITE Source: American Community Survey Year sample, IPUMS-USA, University of Minnesota, Figure created by Sandoval and Ruiz.
28 UNDEREMPLOYED 29% 17% 54% 46% of underemployed immigrants had a college or post-college education LESS THAN COLLEGE EDUCATION COLLEGE EDUCATION POST COLLEGE EDUCATION Source: American Community Survey Year sample, IPUMS-USA, University of Minnesota, Figure created by Sandoval and Ruiz.
29 UNDEREMPLOYED BUSINESS, FINANCE, ARTS & SCIENCE SALES, OFFICE & EDUCATION HEALTHCARE SERVICES FARMING CONSTRUCTION & EXTRACTION TRANSPORTATION PRODUCTION PROTECTIVE & MILITARY 2% 2% 0% 9% 12% 16% 26% 34% Source: American Community Survey Year sample, IPUMS-USA, University of Minnesota, Figure created by Sandoval and Ruiz. 34% of underemployed immigrants were in services
30 QUESTION #5 WHO ARE THE IMMIGRANTS IN STEM OCCUPATIONS?
31 TOP 10 STEM OCCUPATIONS COMPUTER AND INFOMRATION SYSTEMS MANAGE MANAGEMENT ANALYSTS COMPUTER SYSTEMS ANALYSTS COMPUTER PROGRAMMERS SOFTWARE DEVELOPERS COMPUTER OCCUPATIONS PHYSICAL SCIENTISTS POSTSECONDARY TEACHERS PHYSICIANS AND SURGEONS REGISTERED NURSES 6% 6% 6% 5% 8% 7% 11% 15% 18% 18% Source: American Community Survey Year sample, IPUMS-USA, University of Minnesota, Figure created by Sandoval and Ruiz. 25% of STEM immigrants were in occupations related to computers
32 TOP TEN STEM 10% 6% 3% 19% ASIAN BLACK LATINO OTHER WHITE 63% 63% of STEM immigrations were Asian Source: American Community Survey Year sample, IPUMS-USA, University of Minnesota, Figure created by Sandoval and Ruiz.
33 STEM 25% 8% 67% 67% of STEM immigrants had a post-college education LESS THAN COLLEGE EDUCATION COLLEGE EDUCATION POST COLLEGE EDUCATION Source: American Community Survey Year sample, IPUMS-USA, University of Minnesota, Figure created by Sandoval and Ruiz.
34 QUESTION #6 IS THERE A SPATIAL PATTERN FOR IMMIGRANTS?

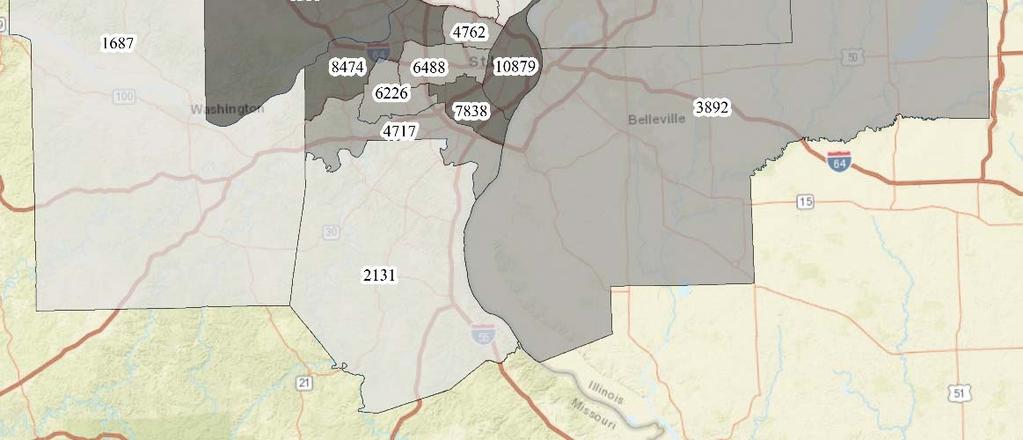
35 St. Louis City had the largest concentration of working-age immigrants


36 St. Louis County had the largest concentration of STEM workers
37 SUMMARY
38 General Conclusions 7% of working age immigrants were unemployed 13% of working immigrants were underemployed 1 out of 4 (28%) working immigrants are in STEM
39 Specific Trends by Occupation 96% in military or protective occupations were unemployed immigrants. Business, Finance, Arts, and Science was the largest occupation category (28%) followed by Sales, Office, and Education (21%) for the employed immigrants. Services occupation accounted for the largest number of underemployed immigrants. Of the top 10 STEM occupation, 1 out of 4 (25%) jobs were in a computer field.
New Americans in Michigan
 New Americans in Michigan An Economic Engine & Opportunity MAY 1, 2017 Kate Brick New American Economy 500 Republican, Independent, and Democratic mayors and CEOs in all 50 states agree: Immigration is
Immigrants and the Restructuring of the Boston Metropolitan Workforce,
 Institute for Immigration Research Immigrants and the Restructuring of the Boston Metropolitan Workforce, 1970-2010 Erin M. Stephens, Justin P. Lowry and James C. Witte JUNE 2015 1 Immigrants and the Restructuring
SECTION TWO: REGIONAL POVERTY TRENDS
 SECTION TWO: REGIONAL POVERTY TRENDS Metropolitan Council Choice, Place and Opportunity: An Equity Assessment of the Twin Cities Region Section 2 The changing face of poverty Ebbs and flows in the performance
Metro Atlanta Workforce:
 Metro Atlanta Workforce: Industries in Demand & Opportunity Occupations October, 2018 Atlanta Regional Commission For more information, contact: cdegiulio@atlantaregional.org In Sum In looking at a more
Racial Inequities in Fairfax County
 W A S H I N G T O N A R E A R E S E A R C H I N I T I A T I V E Racial Inequities in Fairfax County Leah Hendey and Lily Posey December 2017 Fairfax County, Virginia, is an affluent jurisdiction, with
The EEO Tabulation: Measuring Diversity in the Workplace ACS Data Users Conference May 29, 2014
 The EEO Tabulation: Measuring Diversity in the Workplace ACS Data Users Conference May 29, 2014 Ana J. Montalvo Industry and Occupation Statistics Branch Social, Economic, and Housing Statistics Division
Racial Inequities in Montgomery County
 W A S H I N G T O N A R E A R E S E A R C H I N I T I A T I V E Racial Inequities in Montgomery County Leah Hendey and Lily Posey December 2017 Montgomery County, Maryland, faces a challenge in overcoming
Mexicans in New York City, : A Visual Data Base
 Mexicans in New York City, 1990 2009: A Visual Data Base Center for Latin American, Caribbean & Latino Studies Graduate Center City University of New York 365 Fifth Avenue Room 5419 New York, New York
Chinese on the American Frontier, : Explorations Using Census Microdata, with Surprising Results
 Chew, Liu & Patel: Chinese on the American Frontier Page 1 of 9 Chinese on the American Frontier, 1880-1900: Explorations Using Census Microdata, with Surprising Results (Extended Abstract / Prospectus
Labor Force Characteristics by Race and Ethnicity, 2015
 Cornell University ILR School DigitalCommons@ILR Federal Publications Key Workplace Documents 9-2016 Labor Force Characteristics by Race and Ethnicity, 2015 Bureau of Labor Statistics Follow this and additional
Demographic, Economic, and Social Transformations in Queens Community District 3: East Elmhurst, Jackson Heights, and North Corona,
 Demographic, Economic, and Social Transformations in Queens Community District 3: East Elmhurst, Jackson Heights, and North Corona, 1990-2006 Astrid S. Rodríguez Fellow, Center for Latin American, Caribbean
ECONOMIC IMPACT OF IMMIGRATION IN KANSAS CITY AND THE BI-STATE REGION
 ECONOMIC IMPACT OF IMMIGRATION IN KANSAS CITY AND THE BI-STATE REGION REPORT PREPARED BY: DR. DONNA K. GINTHER DIRECTOR, CSTEP PAT OSLUND, RESEARCH ASSOCIATE JEN BODEN, RESEARCH ASSISTANT Acknowledgements:
Foreign-born STEM Workers in the United States
 Foreign-born STEM Workers in the United States Workers in STEM fields (science, technology, engineering, and math) play an increasingly important role in the U.S. economy. STEM occupations are critical
Labor Supply Factors and Labor Availability for the Fillmore County, Nebraska Labor Area
 Labor Supply Factors and Labor Availability for the Fillmore County, Nebraska Labor Area September 2018 Prepared by: Kenneth M. Lemke, Ph.D. Economist Nebraska Public Power District 1414 15 th Street -
Unemployment Rises Sharply Among Latino Immigrants in 2008
 Report February 12, 2009 Unemployment Rises Sharply Among Latino Immigrants in 2008 Rakesh Kochhar Associate Director for Research, Pew Hispanic Center The Pew Hispanic Center is a nonpartisan research
The foreign born are more geographically concentrated than the native population.
 The Foreign-Born Population in the United States Population Characteristics March 1999 Issued August 2000 P20-519 This report describes the foreign-born population in the United States in 1999. It provides
New Americans in Houston
 New Americans in Houston A Snapshot of the Demographic and Economic Contributions of Immigrants in the Metro Area POPULATION 6.8M.6M Total population in 06 Immigrant population.% Immigrant share of the
info Poverty in the San Diego Region SANDAG December 2013
 info December 2013 SANDAG Poverty in the San Diego Region Table of Contents Overview... 3 Background... 3 Federal Poverty Measurements... 4 Poverty Status for Individuals in the San Diego Region... 6 Demographic
Talent Advantage Series. Cameron Macht DEED Labor Market Information Office Regional Analysis & Outreach April 11, 2018
 Talent Advantage Series Cameron Macht DEED Labor Market Information Office Regional Analysis & Outreach www.mn.gov/deed/data/ April 11, 2018 Labor Force Constraints From 1976 to 2001, Minnesota gained
Demographic, Economic and Social Transformations in Bronx Community District 4: High Bridge, Concourse and Mount Eden,
 Center for Latin American, Caribbean & Latino Studies Graduate Center City University of New York 365 Fifth Avenue Room 5419 New York, New York 10016 Demographic, Economic and Social Transformations in
Chapter 1: Objectives
 Chapter 1: Objectives Identify Texas political party activists and government officials to inform participation in the political affairs of the state and its counties, cities, and special districts. Understand
The population of the Tenth Federal Reserve District has become
 Minority Workers in the Tenth District: Rising Presence, Rising Challenges By Chad R. Wilkerson and Megan D. Williams The population of the Tenth Federal Reserve District has become increasingly diverse
Unauthorized Immigration: Measurement, Methods, & Data Sources
 Jeffrey S. Passel Pew Hispanic Center Washington, DC Immigration Data Users Seminar Migration Policy Institute & Population Reference Bureau Washington, DC 16 October 2008 Unauthorized Immigration: Measurement,
Asian Pacific American Heritage Month: May 2004
 CB04-FF.06 April 19, 2004 Asian Pacific American Heritage Month: May 2004 In 1978, a joint congressional resolution established Asian Pacific American Heritage Week. The first 10 days of May were chosen
Fear of the Unknown: Views on Immigrants in Metropolitan St. Louis. Emily Hager University of Missouri-St. Louis
 Fear of the Unknown: Views on Immigrants in Metropolitan St. Louis Emily Hager University of Missouri-St. Louis Thanks to Missouri Immigrant and Refugee Advocates, mira-mo.org (funder) Colleagues at Saint
Astrid S. Rodríguez Fellow, Center for Latin American, Caribbean & Latino Studies. Center for Latin American, Caribbean & Latino Studies
 Demographic, Economic, and Social Transformations in Bronx Community District 9: Parkchester, Unionport, Soundview, Castle Hill, and Clason Point, 1990-2006 Center for Latin American, Caribbean & Latino
Readily Available Immigration Data
 Readily Available Immigration Data Tristan Cayn Research Officer, Strategic Research and Statistics PMC Node Meeting Calgary, Alberta November 25, 2008 Overview What immigration data is readily available?
4 The Regional Economist Fourth Quarter 2017 THINKSTOCK / ISTOCK / KINWUN
 4 The Regional Economist Fourth Quarter 2017 THINKSTOCK / ISTOCK / KINWUN LABOR Shifting Times The Evolution of the American Workplace By Alexander Monge-Naranjo and Juan Ignacio Vizcaino hat are the main
Why disaggregate data on U.S. children by immigrant status? Some lessons from the diversitydatakids.org project
 Why disaggregate data on U.S. children by immigrant status? Some lessons from the diversitydatakids.org project Dolores Acevedo-Garcia, PhD, MPA-URP Samuel F. and Rose B. Gingold Professor of Human Development
Working Overtime: Long Commutes and Rent-burden in the Washington Metropolitan Region
 Working Overtime: Long Commutes and Rent-burden in the Washington Metropolitan Region By Kathryn Howell, PhD Research Associate George Mason University School of Public Policy Center for Regional Analysis
Understanding Racial Inequity in Alachua County
 Understanding Racial Inequity in Alachua County (January, 2018) Hector H. Sandoval (BEBR) Department of Economics College of Liberal Arts and Sciences University of Florida Understanding Racial Inequity
Louisville: Immigration Rebirth Matt Ruther, Department of Urban and Public Affairs, University of Louisville
 Louisville: Immigration Rebirth Matt Ruther, Department of Urban and Public Affairs, University of Louisville Germantown. Schnitzelburg. Irish Hill. The names of neighborhoods within Louisville s urban
Characteristics of People. The Latino population has more people under the age of 18 and fewer elderly people than the non-hispanic White population.
 The Population in the United States Population Characteristics March 1998 Issued December 1999 P20-525 Introduction This report describes the characteristics of people of or Latino origin in the United
Racial Disparities in the Direct Care Workforce: Spotlight on Hispanic/Latino Workers
 FEBRUARY 2018 RESEARCH BRIEF Racial Disparities in the Direct Care Workforce: Spotlight on Hispanic/Latino Workers BY STEPHEN CAMPBELL The second in a three-part series focusing on racial and ethnic disparities
Foreign Migration to the Cleveland-Akron-Lorain Metropolitan Area From 1995 to 2000
 EngagedScholarship@CSU Urban Publications Maxine Goodman Levin College of Urban Affairs 12-22-2005 Foreign Migration to the Cleveland-Akron-Lorain Metropolitan Area From 1995 to 2000 Mark Salling, m.salling@csuohio.edu
LATINO DATA PROJECT. Astrid S. Rodríguez Ph.D. Candidate, Educational Psychology. Center for Latin American, Caribbean, and Latino Studies
 LATINO DATA PROJECT Demographic, Economic, and Social Transformations in the South Bronx: Changes in the NYC Community Districts Comprising Mott Haven, Port Morris, Melrose, Longwood, and Hunts Point,
RESEARCH BRIEF: The State of Black Workers before the Great Recession By Sylvia Allegretto and Steven Pitts 1
 July 23, 2010 Introduction RESEARCH BRIEF: The State of Black Workers before the Great Recession By Sylvia Allegretto and Steven Pitts 1 When first inaugurated, President Barack Obama worked to end the
Deconstructing Neighbourhood Transitions Larry S. Bourne, April 2007
 Deconstructing Neighbourhood h Transitions: The Contributions of Demographic, Immigration, Life Style and Housing Stock Changes Larry S. Bourne Professor of Geography and Planning Centre for Urban and
Occupational Status Trajectories for Highly-Skilled Immigrants: An Investigation of Ethno-Racial Differences
 Occupational Status Trajectories for Highly-Skilled Immigrants: An Investigation of Ethno-Racial Differences Laura J. Templeton, Ph.D. Candidate University of Alberta Edmonton, Alberta October 12, 2010
Hanna Sutela Senior researcher, PhD Population and Social Statistics Statistics Finland
 Hanna Sutela Senior researcher, PhD Population and Social Statistics Statistics Finland hanna.sutela@stat.fi Gender employment gaps of the population of foreign background in Finland Background In 2014,
MEXICAN MIGRATION MATURITY AND ITS EFFECTS ON FLOWS INTO LOCAL AREAS: A TEST OF THE CUMULATIVE CAUSATION PERSPECTIVE
 MEXICAN MIGRATION MATURITY AND ITS EFFECTS ON FLOWS INTO LOCAL AREAS: A TEST OF THE CUMULATIVE CAUSATION PERSPECTIVE ABSTRACT James D. Bachmeier University of California, Irvine This paper examines whether
Labor Supply Factors and Labor Availability for the Geneva (Fillmore County) Labor Area
 Labor Area") Labor Supply Factors and Labor Availability for the Geneva (Fillmore County) Labor Area June 2015 Prepared by: Kenneth M. Lemke, Ph.D. Economist Nebraska Public Power District 1414 15 th Street - P.O.
Labor Supply Factors and Labor Availability for the Geneva (Fillmore County) Labor Area June 2015 Prepared by: Kenneth M. Lemke, Ph.D. Economist Nebraska Public Power District 1414 15 th Street - P.O.
Asian American and Pacific Islander Workers Today
 Issue Brief May 2015 Asian American and Pacific Islander Workers Today By Nicole Woo and Cherrie Bucknor* This issue brief looks at the most recent U.S. Census Bureau data available 1 to provide an overview
Minorities in Rural America
 Minorities in Rural America South Carolina Rural Health Research Center Department of Health Administration Norman J. Arnold School of Public Health University of South Carolina Columbia, SC 29203 Michael
R 5.2% 69,787. New Americans in Memphis A Snapshot of the Demographic and Economic Contributions of Immigrants in the Metro Area 1
 New Americans in Memphis A Snapshot of the Demographic and Economic Contributions of Immigrants in the Metro Area 1 POPULATION GROWTH 5+95R Immigrant share of the population, 2015 Number of immigrants
CLACLS. Demographic, Economic, and Social Transformations in Bronx Community District 5:
 CLACLS Center for Latin American, Caribbean & Latino Stud- Demographic, Economic, and Social Transformations in Bronx Community District 5: Fordham, University Heights, Morris Heights and Mount Hope, 1990
Great Lakes Prosperity: The Promise of Investing in People
 Great Lakes Prosperity: The Promise of Investing in People Rolf Pendall, Ph.D. Codirector, M etropolitan H ousing & Communities Center Presentation at 2017 Policy Summit on H ousing, H uman Capital, and
CLACLS. A Profile of Latino Citizenship in the United States: Demographic, Educational and Economic Trends between 1990 and 2013
 CLACLS Center for Latin American, Caribbean & Latino Studies A Profile of Latino Citizenship in the United States: Demographic, Educational and Economic Trends between 1990 and 2013 Karen Okigbo Sociology
Patrick Adler and Chris Tilly Institute for Research on Labor and Employment, UCLA. Ben Zipperer University of Massachusetts, Amherst
 THE STATE OF THE UNIONS IN 2013 A PROFILE OF UNION MEMBERSHIP IN LOS ANGELES, CALIFORNIA AND THE NATION 1 Patrick Adler and Chris Tilly Institute for Research on Labor and Employment, UCLA Ben Zipperer
Q 23,992. New Americans in Champaign County 11.6% 11.8%
 New Americans in Champaign County A Snapshot of the Demographic and Economic Contributions of Immigrants in the County 1 POPULATION 23,992 Number of immigrants living in Champaign County in 2016, making
Demographic Data. Comprehensive Plan
 Comprehensive Plan 2010-2030 4 Demographic Data Population and demographics have changed over the past several decades in the City of Elwood. It is important to incorporate these shifts into the planning
Latest Immigration Data
 Latest Immigration Data And America s Changing Classrooms Denzil Mohammed Director, Public Education Institute The Immigrant Learning Center, Inc., Malden MA dmohammed@ilctr.org Immigrant Student Success,
Characteristics of Poverty in Minnesota
 Characteristics of Poverty in Minnesota by Dennis A. Ahlburg P overty and rising inequality have often been seen as the necessary price of increased economic efficiency. In this view, a certain amount
History of Immigration to Texas
 History of Immigration to Texas For most of its history, Texas has attracted settlers from the rest of the nation rather than abroad Mexican immigrants did not begin to settle permanently until late 1970s
Post-Secondary Education, Training and Labour September Profile of the New Brunswick Labour Force
 Post-Secondary Education, Training and Labour September 2018 Profile of the New Brunswick Labour Force Contents Population Trends... 2 Key Labour Force Statistics... 5 New Brunswick Overview... 5 Sub-Regional
THE LITERACY PROFICIENCIES OF THE WORKING-AGE RESIDENTS OF PHILADELPHIA CITY
 THE LITERACY PROFICIENCIES OF THE WORKING-AGE RESIDENTS OF PHILADELPHIA CITY Prepared by: Paul E. Harrington Neeta P. Fogg Alison H. Dickson Center for Labor Market Studies Northeastern University Boston,
EMBARGOED UNTIL THURSDAY 9/5 AT 12:01 AM
 EMBARGOED UNTIL THURSDAY 9/5 AT 12:01 AM Poverty matters No. 1 It s now 50/50: chicago region poverty growth is A suburban story Nationwide, the number of people in poverty in the suburbs has now surpassed
Migration, Poverty & Place in the Context of the Return Migration to the US South
 Migration, Poverty & Place in the Context of the Return Migration to the US South Katherine Curtis Department of Rural Sociology Research assistance from Jack DeWaard and financial support from the UW
U.S. Hispanics & Immigration: A Demographer s View
 Jeffrey S. Passel Pew Hispanic Center Washington, DC The Economics of Immigration Construction Economics Research Network Washington, DC December 6, 2007 U.S. Hispanics & Immigration: A Demographer s View
Latinos in Massachusetts Selected Areas: Framingham
 University of Massachusetts Boston ScholarWorks at UMass Boston Gastón Institute Publications Gastón Institute for Latino Community Development and Public Policy Publications 9-17-2010 Latinos in Massachusetts
Heading in the Wrong Direction: Growing School Segregation on Long Island
 Heading in the Wrong Direction: Growing School Segregation on Long Island January 2015 Heading in the Wrong Direction: Growing School Segregation on Long Island MAIN FINDINGS Based on 2000 and 2010 Census
A Portrait of Foreign-Born Teachers in the United States. By Yukiko Furuya, Mohammad Ismail Nooraddini, Wenjing Wang, and Michele Waslin 1
 A Portrait of Foreign-Born Teachers in the United States By Yukiko Furuya, Mohammad Ismail Nooraddini, Wenjing Wang, and Michele Waslin 1 January 2019 January 2019 2 Table of Contents Executive Summary
The Changing Face of Labor,
 The Changing Face of Labor, 1983-28 John Schmitt and Kris Warner November 29 Center for Economic and Policy Research 1611 Connecticut Avenue, NW, Suite 4 Washington, D.C. 29 22-293-538 www.cepr.net CEPR
Objectives. Scope and concepts
 Resolution concerning the measurement of underemployment and inadequate employment situations, adopted by the Sixteenth International Conference of Labour Statisticians (October 1998) The Sixteenth International
DATA PROFILES OF IMMIGRANTS IN THE DISTRICT OF COLUMBIA
 DATA PROFILES OF IMMIGRANTS IN THE DISTRICT OF COLUMBIA LATINO IMMIGRANTS Demographics Economic Opportunity Education Health Housing This is part of a data series on immigrants in the District of Columbia
9+91R 45, % New Americans in Dane County 9.7%, Immigrant share of the population, The immigrant population grew by 24.2%.
 New Americans in Dane County A Snapshot of the Demographic and Economic Contributions of Immigrants in the County 1 POPULATION GROWTH 9+91R 8.7% Immigrant share of the population, 2016 Between 2011 and
Patterns of Housing Voucher Use Revisited: Segregation and Section 8 Using Updated Data and More Precise Comparison Groups, 2013
 Patterns of Housing Voucher Use Revisited: Segregation and Section 8 Using Updated Data and More Precise Comparison Groups, 2013 Molly W. Metzger Center for Social Development Danilo Pelletiere U.S. Department
A Regional Comparison Minneapolis Saint Paul Regional Economic Development Partnership
 Greater MSP Baltimore A Regional Comparison Minneapolis Saint Paul Regional Economic Development Partnership TOP EMPLOYERS IN AND MSA GREATER MSP EMPLOYER EMPLOYEES EMPLOYER EMPLOYEES Target Corp. 26,694
Indian Migration to the U.S.
 Indian Migration to the U.S. Neil G. Ruiz Associate Director of Global Migration & Demography Pew Research Center is a nonpartisan fact tank that informs the public about the issues, attitudes and trends
Racial Disparities in the Direct Care Workforce: Spotlight on Asian and Pacific Islander Workers
 FEBRUARY 2018 RESEARCH BRIEF Racial Disparities in the Direct Care Workforce: Spotlight on Asian and Pacific Islander Workers BY STEPHEN CAMPBELL The final publication in a three-part series focusing on
Demographic, Economic, and Social Transformations in Brooklyn Community District 4: Bushwick,
 Demographic, Economic, and Social Transformations in Brooklyn Community District 4: Bushwick, 1990-2007 Astrid S. Rodríguez Ph.D. Candidate, Educational Psychology Center for Latin American, Caribbean
UMKC CENTER FOR ECONOMIC INFORMATION. Economic and Fiscal Contributions of International Immigrants in the State of Kansas
 UMKC CENTER FOR ECONOMIC INFORMATION Economic and Fiscal Contributions of International Immigrants in the State of Kansas Dr. Peter Eaton 1/10/2013 Acknowledgements The Greater Kansas City Hispanic Development
Racial Inequities in the Washington, DC, Region
 W A S H I N G T O N A R E A R E S E A R C H I N I T I A T V E Racial Inequities in the Washington, DC, Region 2011 15 Leah Hendey December 2017 The Washington, DC, region is increasingly diverse and prosperous,
Far From the Commonwealth: A Report on Low- Income Asian Americans in Massachusetts
 University of Massachusetts Boston ScholarWorks at UMass Boston Institute for Asian American Studies Publications Institute for Asian American Studies 1-1-2007 Far From the Commonwealth: A Report on Low-
OMP EIS Re-Evaluation: Interim Fly Quiet
 OMP EIS Re-Evaluation: Interim Fly Quiet Environmental Justice Presented to: By: Date: ONCC Technical Committee Amy Hanson November 13, 2018 Agenda Definition of Environmental Justice Fair Treatment without
A Social Profile of the Halton Visible Minority Population
 Halton Social Planning Council and Volunteer Centre A Social Profile of the Halton Visible Minority Population December 2000 Prepared by Ted Hildebrandt Senior Planner Lyn Apgar - Research Associate December
Environmental Justice Demographic Profile
 CENTRAL PUGET SOUND REGION Environmental Justice Demographic Profile January 2016 Contents INTRODUCTION... 3 OBJECTIVES... 4 DEFINITIONS... 4 Minority Populations... 4 Low-Income Population... 4 Other
Trends in Poverty Rates Among Latinos in New York City and the United States,
 City University of New York (CUNY) CUNY Academic Works Center for Latin American, Caribbean, and Latino Studies Centers & Institutes 11-2013 Trends in Poverty Rates Among Latinos in New York City and the
New Americans in Long Beach POPULATION GROWTH 3.3% 14.3 % Total population 481, % Immigrant population 128, % 26.1% 47.
 New Americans in Long Beach A Snapshot of the Demographic and Economic Contributions of Immigrants in the Long Beach Area 1 POPULATION GROWTH 7+7R 6.6% Immigrant share of the population, 016 Between 011
Employment outcomes of postsecondary educated immigrants, 2006 Census
 Employment outcomes of postsecondary educated immigrants, 2006 Census Li Xue and Li Xu September 2010 Research and Evaluation The views and opinions expressed in this document are those of the author(s)
JULY Esri Diversity Index
 JULY 2018 Esri Diversity Index Copyright 2018 Esri All rights reserved. Printed in the United States of America. The information contained in this document is the exclusive property of Esri. This work
Regional Total Population: 2,780,873. Regional Low Income Population: 642,140. Regional Nonwhite Population: 1,166,442
 BALTIMORE REGION Neighborhood change in Baltimore is marked by a major city suburban divide, reflecting its long and troubled history of racial segregation. In the suburbs, only about one in six residents
California s Congressional District 37 Demographic Sketch
 4.02.12 California s Congressional District 37 Demographic Sketch MANUEL PASTOR JUSTIN SCOGGINS JARED SANCHEZ Purpose Demographic Sketch Understand the Congressional District s population and its unique
The Economic Cost of Brain Waste in the U.S. Jeanne Batalova, Senior Policy Analyst Michael Fix, MPI President
 The Economic Cost of Brain Waste in the U.S. Jeanne Batalova, Senior Policy Analyst Michael Fix, MPI President Washington, DC December 7, 2016 Who Was Involved Support and collaboration New American Economy:
GALLUP DAILY TRACKING
 GALLUP DAILY TRACKING TOPICS AND METHODOLOGY The subsequent pages list the topics covered in Gallup Daily tracking an unprecedented survey of 1,000 U.S. adults each day, 350 days per year. Gallup Daily
Fed Forum. The Foreign-Born Population in Upstate New York. James Orr. Research and Statistics Group Federal Reserve Bank of New York
 Fed Forum The Foreign-Born Population in Upstate New York James Orr Research and Statistics Group Federal Reserve Bank of New York November 29, 7 1 Outline Immigration trends Characteristics of the foreign-born
REPORT AUGUST, The Contributions of New Americans in Missouri
 REPORT AUGUST, 2016 The Contributions of New Americans in Missouri Partners The Contributions of New Americans in Missouri CONTENTS Demographics 1 The Role of Immigrants as Entrepreneurs 2 Spotlight On:
TIEDI Labour Force Update September 2012
 The Toronto Immigrant Employment Data Initiative (TIEDI) s Labour Force Update aims to provide upto-date labour market data on immigrants. This monthly report relies on data from the Labour Force Survey
2016 Census Bulletin: Education and Labour
 2016 Census Bulletin: Education and Labour Kingston, Ontario Census Metropolitan Area (CMA) The 2016 Census Day was May 10, 2016. In the fall of 2017, Statistics Canada released various data sets from
Artists and Cultural Workers in Canadian Municipalities
 Artists and Cultural Workers in Canadian Municipalities Based on the 2011 National Household Survey Vol. 13 No. 1 Prepared by Kelly Hill Hill Strategies Research Inc., December 2014 ISBN 978-1-926674-36-0;
ORIGINS AND EXPERIENCES A GROWING GENERATION OF YOUNG IMMIGRANTS MICHIGAN IMMIGRANTS HAVE VARIED
 October 2017 Victoria Crouse, State Policy Fellow M ichigan has long been home to thousands of immigrants from all over the world. Immigrants in Michigan are neighbors, students, workers and Main Street
Children of Immigrants
 L O W - I N C O M E W O R K I N G F A M I L I E S I N I T I A T I V E Children of Immigrants 2013 State Trends Update Tyler Woods, Devlin Hanson, Shane Saxton, and Margaret Simms February 2016 This brief
California Healthcare Dollars and Politics
 California Healthcare Dollars and Politics On health-related bills, how lawmakers vote correlates closely with campaign donations. October 17, 2007 Contact: Dan Newman, Executive Director 510-868-0894
Graduate Course Descriptions
 Spring Semester 2016 Political Science Graduate Course Descriptions Visit our website at www.umsl.edu/~polisci PS 6401-G01 Introduction To Policy Research Adriano Udani Class time: Mo and We from 5:30pm
Emerging and Established Hispanic Communities: Implications of Changing Hispanic Demographics
 Emerging and Established Hispanic Communities: Implications of Changing Hispanic Demographics October 1, 2015 @NRCHispanic Co-Chairs Michael López, Ph.D. Abt Associates Michelle Blocklin, Ph.D. Abt Associates
NCRCRD. Trends in North Central Latino Demographics. North Central Regional Center for Rural Development. Policy BRIEF
 NCRCRD North Central Regional Center for Rural Development Trends in North Central Latino Demographics Policy BRIEF Final Report Submitted to the North Central Regional Center for Rural Development, 2013
Migration Information Source - Chinese Immigrants in the United States
 Pagina 1 di 8 Chinese Immigrants in the United States By Aaron Terrazas, Jeanne Batalova Migration Policy Institute May 6, 2010 The United States is home to about 1.6 million Chinese immigrants (including
Rural Pulse 2019 RURAL PULSE RESEARCH. Rural/Urban Findings March 2019
 Rural Pulse 2019 RURAL PULSE RESEARCH Rural/Urban Findings March 2019 Contents Executive Summary 3 Project Goals and Objectives 9 Methodology 10 Demographics 12 Detailed Research Findings 18 Appendix Prepared
Washington Area Economy: Performance and Outlook
 Washington Area Economy: Performance and Outlook Presentation to: Arlington Economic Development Commission Mark C. White, Ph.D. Deputy Director Center for Regional Analysis Schar School of Policy and
Immigrants in Healthcare Occupations
 Occupations January, 2017 Davis G. Patterson, PhD, Cyndy R. Snyder, PhD, Bianca K. Frogner, PhD KEY FINDINGS This study compares the sociodemographic and occupational characteristics of native-born U.S.