Evaluating Methods for Estimating Foreign-Born Immigration Using the American Community Survey
|
|
|
- Annis Robbins
- 6 years ago
- Views:
Transcription
1 Evaluating Methods for Estimating Foreign-Born Immigration Using the American Community Survey By C. Peter Borsella Eric B. Jensen Population Division U.S. Census Bureau Paper to be presented at the annual meeting of the Population Association of America, New Orleans, LA, April 11-13, 2013 This report is released to inform interested parties of ongoing research and to encourage discussion of work in progress. Any views expressed are those of the authors and not necessarily those of the U.S. Census Bureau.
2 Abstract The Population Estimates Program of the U.S. Census Bureau produces annual estimates of foreign-born immigration using the Residence One Year Ago (ROYA) method. Alternatively, foreign-born immigration can be estimated using the Year of Entry (YOE) method. Both methods use data from the American Community Survey (ACS). Although these methods are similar, they produce different estimates of foreign-born immigration. Furthermore, these differences vary by world region of birth. In this paper, we analyze the demographic, social, and survey-related characteristics of three mutually exclusive groups: the ROYA alone, YOE alone, and Overlap (included in both the ROYA and YOE methods) populations. The findings show that from , immigrants from Latin America were more likely to be in the YOE alone population than the ROYA alone or Overlap populations. Immigrants from Asia were more likely to be in the Overlap population during that same period. Introduction The Population Estimates Program of the U.S. Census Bureau produces annual estimates of net international migration. Currently, we use data from the American Community Survey (ACS) and the Residence One Year Ago (ROYA) method to produce the national-level total estimate of foreign-born immigration (Bhaskar et al. 2011). Specifically, the foreign born in the ACS whose response to the residence one year ago question indicated that they were living abroad are considered foreign-born immigrants. Alternatively, the Year of Entry (YOE) method can also be used to develop the national-level estimate of foreign-born immigration. For this method, the foreign-born immigrant population is estimated as the foreign-born population who responded that they came to live in the United States one year prior to the survey year. Both the ROYA and YOE methods produce estimates of foreign-born immigration to the United States over a 12-month time period. Although we use the ROYA method in the Population Estimates Program, data on year of entry from the ACS are used to distribute demographic and geographic characteristics to the ROYA-based national-level estimate. Therefore, understanding the similarities and differences between these two estimation methods is critical to the Population Estimates Program. 1
3 Although both methods provide an estimate of immigration, there are significant differences between estimates of foreign-born immigration using the ROYA and YOE methods. The YOE method consistently produces higher estimates of foreign-born immigration at the national level than the ROYA method (Bhaskar et al. 2011). Furthermore, these differences vary by world region of birth. When examining foreign-born immigrants from Mexico, Scopilliti et al. (2011) found YOE method estimates to be 30.4 percent higher than ROYA method estimates. Conversely, ROYA estimates of foreign-born immigrants from Canada tend to be higher than YOE estimates. This discrepancy may be due in part to differences in the reference period because the ROYA question covers the 12 months prior to the survey month while the YOE question covers the entire calendar year prior to the survey year. However, reference period differences should not have a substantial influence on the characteristics of the populations estimated by the two methods. In this paper, we use data from the single-year ACS files to analyze differences in the levels and characteristics of estimates of foreign-born immigration using the ROYA and YOE methods. Since part of the reference period for the ROYA method corresponds with part of the reference period for the YOE method, we estimate three mutually exclusive populations. The first population consists of foreign-born immigrants measured only by the ROYA method (ROYA alone). The second population contains foreign-born immigrants measured only by the YOE method (YOE alone). Finally, foreign-born immigrants measured by both the ROYA and YOE methods make up the Overlap population. We then analyze differences in the levels and characteristics of these populations, focusing on differences by world region of birth, as well as variation in demographic, social, and survey-related characteristics. 2
4 Background ROYA and YOE are the two methods generally used to estimate foreign-born immigration to the United States using ACS data. For both methods, the foreign-born population is identified using information on citizenship status where the foreign-born population is defined as those who 1) are naturalized citizens or 2) not U.S. citizens. Identifying the foreign born in this way is preferred to using data on place of birth from the ACS because a person born abroad of U.S. citizen parents could be misclassified as a foreign-born immigrant using place of birth data. For the ROYA method, foreign-born immigration is estimated as the foreign-born population whose residence one year ago was abroad. For the YOE method, the foreign-born population whose year of entry is one year prior to the survey year are considered foreign-born immigrants. The ROYA and YOE methods both measure annual foreign-born immigration flows over a 12-month time period; however, they do not reflect the same period, even when using the same single-year ACS file. Figure 1 illustrates the temporal inconsistencies between the ROYA and YOE methods and how recent immigrants are measured differently by each method. In this example, three immigrants were all surveyed in July of the survey year and each entered the United States in a different month within either the survey year or the year prior to the survey. If the first respondent (Immigrant 1) entered the United States in May of the year prior to the survey year and was surveyed in July, they would be included in the YOE estimate but not the ROYA estimate because they were living in the United States one year prior to the survey. If Immigrant 2 entered the United States in October of the year prior to the survey and was surveyed in July, they would be included in both the ROYA and YOE estimates. If Immigrant 3 entered the United States in March of the survey year and was surveyed in July of that same 3
5 year, they would only be included in the ROYA estimate (Figure 1). While there is clearly a temporal inconsistency between the ROYA and YOE methods, it is unclear how this would affect the levels and characteristics of estimates using the different methods. The reliability and validity of the survey questions in the ACS used in the ROYA and YOE methods could also cause variation in the estimates of foreign-born immigration to the United States. The year of entry question used by the Census Bureau asks respondents when did you come to live in the United States? Some researchers argue that this survey question is ambiguous because it does not specify which event (first or most recent) but rather requires a subjective judgment about when their residence became permanent (Ellis and Wright 1998; Redstone and Massey 2004). In analyzing responses to the year of entry question in the 2008 Current Population Survey Migration Supplement, de la Cruz and Logan (2009) found responses were often inconsistent with responses to the same question in a follow-up survey. In fact, responses to the year of entry questions did not necessarily correspond with either the first year of entry or the most recent year of entry. In an evaluation of the place of birth, citizenship, and year of arrival questions in the ACS, Harris et al. (2007) found that in 32.6 percent of cases, reported year of entry was not consistent with either the first or most recent years of entry. Despite these concerns about year of entry data, researchers regularly use the YOE method to produce estimates of foreign-born immigration (Passel 2007; Vericker, Fortuny, Finegold, and Ozdemir 2010). That the year of entry question in the ACS is not specific to a particular migration event could partially explain differences by world regions of birth in the estimates produced by the ROYA and YOE methods. Immigrants from Mexico and Latin America are more likely to return to their country-of-origin or to engage in multiple trips (circular migration) to the United States 4
6 than immigrants from other regions (Massey and Malone 2002). Circular migrants who entered the United States in the year prior to the survey year but respond to the year of entry question with the date from a previous migration event would not be measured by the YOE method. However, this does not explain why YOE estimates are consistently higher for Mexican immigrants than ROYA estimates. While the research reviewed above clearly shows that the ROYA and YOE methods produce different estimates of foreign-born immigration, there has not been a systematic study of these differences. The purpose of this paper is to analyze the variation in estimates of foreignborn immigration produced using the ROYA and YOE methods. This research is guided by the following research questions: 1) Why are estimates of foreign-born immigration produced using the ROYA and YOE methods different? 2) What variation exists in the characteristics of estimates produced using the ROYA and YOE methods? Data and Methods The data for this analysis come from pooled single-year ACS files. The ACS is a survey of the U.S. resident population with an annual sample size of approximately 3 million addresses. 1 Implementation of the survey is on a continuous basis, with each month fielding a sample of the resident population. The ACS includes data on demographic, housing, social, and economic characteristics of the U.S. population. Furthermore, the ACS provides immigrationrelated data such as place of birth, citizenship status, year of entry, and the respondent s residence one year prior to completing the survey (residence one year ago). Specifically, we restrict the analysis to the foreign-born, household population age three and older who were 1 The ACS data are based on a sample and are subject to sampling variability. For information on confidentiality protection, sampling error, nonsampling error, and definitions see 5
7 recent arrivals to the United States. 2 We also omitted cases where the values for the residence one year ago and year of entry variables were imputed. We create three mutually exclusive groups of foreign-born immigrants those identified by ROYA method alone, those identified by the YOE method alone, and an Overlap group identified by both methods. First, we examine trends in the levels of annual estimates for these populations from In addition to showing how levels of immigration, as measured using the different methods, vary across different years, we also analyze how estimates vary by month. Next, we focus on differences in demographic, social, and survey-related characteristics across the three groups using descriptive statistics. The demographic characteristics that we focus on are age, sex, family status, and world region of birth. Family status identifies if the respondent lives in a family or nonfamily household. For the world region of birth variable, we collapse the place of birth codes into Europe, Asia, Africa, Latin America, and Other. We purposely omit race and ethnicity from the analysis because it is so highly correlated with world region of birth and information on country of origin is more germane to this analysis. The social characteristics include educational attainment, school enrollment, and employment. Mode of response is included as a survey-operations characteristic. Finally, we use multinomial logistic regression analysis to model the likelihood of being in the 1) ROYA alone compared to the Overlap population, 2) the YOE alone compared to the Overlap population, and 3) the YOE alone compared to the ROYA alone population. In the multivariate analysis, the primary predictor variable is world region of birth because the sending country is such an important aspect of international migration flows and there is considerable 2 The ACS universe for the enrollment variable used in the analysis is restricted to the population age three and older. Also, the foreign-born immigration component of the population estimates is restricted to the household population. Therefore, we restricted our analysis to the household population age three and older. The age restriction is only used for research purposes and not in the production of the population estimates. 6
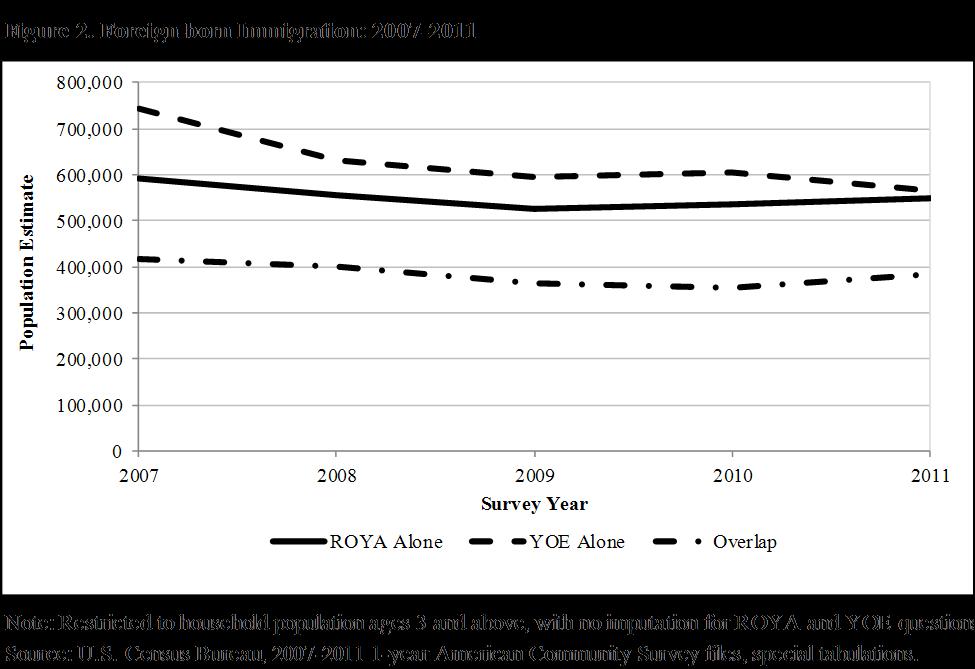
8 variation in the descriptive statistics across world regions. In addition, we use demographic, social, and survey-related controls to refine the relationship between the likelihood of being in the different populations and world region of birth. Results From 2007 to 2011, the ROYA and YOE methods produce different estimates of foreign-born immigration (Figure 2). In general, the YOE method produces higher estimate of foreign-born immigration than the ROYA method for the period. However, in 2011, it appears that the methods converge. Given there have not been any changes in the ACS questions used in the ROYA and YOE methods, this may imply a change in the characteristics of recent foreign-born immigrants. Table 1 reports variation in the estimates by month of survey for the three populations. Both the ROYA alone and YOE alone populations are higher in the later months. Conversely, the Overlap population is more prevalent in the earlier months. This matches expectations, as the further in the year the survey is given, the fewer the opportunities to fall into the Overlap population (see Figure 1). The monthly distribution of the YOE alone population is more consistent than the ROYA alone or Overlap, with a range of 4.6 percent in January to 10.6 percent in December. For the ROYA alone population, the monthly distribution ranges from 2.4 percent in January to 13.6 percent in December, a difference of 11.2 percentage points. The Overlap population has the most variation in the monthly distribution with a range of 1.3 percent in December to 16.6 percent in January. This would partly explain why YOE method estimates are higher than ROYA method estimates to the extent that there is seasonality in migration flows to the United States. 7
9 Variation in the imputation of missing data for the residence one year ago and year of entry questions also accounts for some of the differences in the ROYA and YOE estimates (Table 2). The imputation rates for both the residence one year ago and year of entry questions are lowest for the Overlap population, 2.2 and 0.6 percent, respectively. The imputation rate for the residence one year ago question is highest for the ROYA alone population, 6.6 percent. Similarly, the imputation rate for the year of entry question is highest for the YOE alone population, 11.6 percent. The high imputation rates for the YOE question are therefore a necessary consideration when comparing methods. Descriptive Statistics There are considerable differences in the demographic characteristics of foreign-born immigrants from 2007 to 2011 across the different populations (Table 3). The two largest foreign-born immigrant groups are from Asia and Latin America. Asians make up the largest segment of foreign-born immigrants in both the ROYA alone and Overlap populations, while Latin Americans are more prominent in the YOE alone population. While the percentage Asian is highest in the ROYA alone population, the absolute number of immigrants from Asia in the YOE alone population (1,182 thousand) is higher than the ROYA alone (1,120 thousand) and Overlap (834 thousand) populations. Thus, while the YOE method measures a greater number of Asians than the ROYA method, Asians make up a smaller percentage of the foreign-born immigrant population. Overall, the YOE method produces populations that have higher representations of Latin Americans and Africans, and higher counts of Asians, than the ROYA method. This may partially explain the convergence of ROYA and YOE method estimates of foreign-born immigrants, as immigration from Latin America has decreased over the past few 8
10 years and immigrants from Asia are on the rise (Jensen and Arenas-Germosén 2012; Pew Research Center for Social and Demographic Trends 2012). In general, international migration streams to the United States have a higher proportion of males than females (Table 3). The percent male in the YOE alone population is slightly higher than Overlap populations. The difference between the percent male in the YOE alone and ROYA alone populations is not statistically significant. Foreign-born immigrants in our sample are largely between the ages of 18 and 49, making up more than 60 percent of any of the three populations. The ROYA alone population has an older age structure than either the YOE alone or Overlap populations, with 19.4 percent aged 50 and older compared to 12.8 percent and 13.5 percent for the YOE alone and Overlap populations, respectively. In addition, foreign-born immigrants mainly live in a family household more than three quarters are in family households in each of the three populations. While the YOE alone population has the largest proportion of respondents who live in families, the ROYA alone and Overlap populations do not differ significantly from each other. These differences in demographic characteristics indicate that the YOE method produces a younger population that is more likely to belong to a family household than the ROYA method. Table 4 reports the social and survey-related characteristics of foreign-born immigrants from 2007 to We restrict the sample to ages 25 and above for the analysis of educational attainment and ages 16 and above for the employment analysis. For the ROYA alone, YOE alone, and Overlap populations, educational attainment has a somewhat segmented distribution with the largest percentage of the population having a bachelor s degree and the second largest percentage having less than high school. The YOE alone population is the least educated, having a higher percentage of those with less than a high school diploma and a lower percentage of 9
11 those with a bachelor s degree and above than the ROYA alone or Overlap populations. The lower educational attainment for the YOE alone population is consistent with our findings in Table 3 that this population includes more immigrants from Latin America and Mexico who tend to have lower socioeconomic status than immigrants from other regions. Most foreign-born immigrants were not enrolled in school at the time of the survey (Table 4); however, there are differences between the three populations. The ROYA alone population has the smallest percentage of students (24.1 percent), while the Overlap population has the highest (31.4 percent.) While the YOE alone population has the lowest overall level of educational attainment, the percentage enrolled in school (30.3 percent) is higher than the ROYA alone population. This is also consistent with our previous findings that the YOE population is younger than the ROYA or Overlap populations. There are significant differences in employment between the three populations (Table 4). The YOE alone population has the highest percentage of immigrants that are employed, 51.6 percent compared to the ROYA alone and Overlap populations, 40.1 and 44.3 percent, respectively. Also, the percentage employed for the YOE alone population is higher than both the percentage unemployed and the percentage not in the labor force. In contrast, the percentage not in the labor force was the highest labor force category for the ROYA alone and Overlap populations. Unemployment is lowest for the YOE alone population with 7.8 percent compared to 8.5 percent for the ROYA alone population and 8.9 percent for the Overlap population. It appears that the differences between populations in employment are balanced by those not in the labor force. The ACS is initially mailed to housing units and respondents are asked to complete the questionnaire and mail it back. Housing units that fail to complete the survey by mail are 10
12 followed up. If a phone number is available, they are followed up first by telephone (CATI) and then a sample of nonrespondents is followed up by in-person interview (CAPI). For this analysis, we categorize the mode of the survey as those who responded by mail, and those who responded through CATI /CAPI (Table 4). Recent immigrants are more likely to respond to the ACS through CATI/CAPI than through mail. The YOE alone population has the highest rate of CATI/CAPI response (67.8 percent,) while the Overlap population has the lowest (58.8 percent.) Of note is that foreign-born immigrants surveyed through CATI or CAPI are much more prevalent in the ROYA alone and YOE alone populations than the Overlap population. Multivariate Analysis The results of the descriptive analysis indicated that there are differences in the demographic, social, and survey-related characteristics of the ROYA alone, YOE alone, and Overlap populations. These differences are especially pronounced when comparing the estimates by world region of birth; however, there are compositional differences between the world regions that we are not able to measure with bivariate statistics. Multinomial logistic regression is used to assess the relationship between the estimate method and world region of birth using block modeling where we introduce demographic, social, and survey-related controls separately (Table 5). The models express the odds ratio of being in the 1) ROYA alone vs. the Overlap population, 2) the YOE alone vs. the Overlap population, and 3) ROYA alone vs. the YOE alone population. Controls for month and year of survey are present in all models, although specific results are not displayed. Model 1 focuses on the relationship between world region of birth and the different methods for estimating foreign-born immigration. The reference category is Latin America. Foreign-born immigrants from all regions are significantly more likely than Latin American 11
13 immigrants to belong to the Overlap population than either the ROYA alone or YOE alone populations. Furthermore, foreign-born immigrants from all regions, except for Africa, are significantly more likely than Latin American immigrants to belong to the ROYA alone population than the YOE alone population. From these results, it is clear that foreign-born immigrants from Latin America are much more likely than any other region to belong to the YOE alone population than any other population. These findings are consistent with the results of the descriptive analysis presented above. In Model 2, we focus on world region of birth while controlling for demographic characteristics including age, sex, and family status. Overall, the odds ratios for world region of birth remain significant, with little variation from Model 1. Sex is not statistically significant in this model. Age was categorized into four groups (3-17, 18-29, 30-49, and 50 years and older) with as the reference category. Foreign-born immigrants aged 3-17 are more likely than year olds to be in the Overlap population than either the ROYA alone or YOE alone populations. Additionally, those aged 50 and older are more likely than year olds to be in the ROYA alone population than either the YOE alone or Overlap populations. Household type is also significant. Foreign-born immigrants who live in family households are more likely than those living in nonfamily households to be in the YOE alone population than either the ROYA alone or Overlap populations. These results match the descriptive statistics, which show little difference between males and females and reveal a YOE alone population that is younger than the ROYA alone population. This would indicate that while demographic characteristics are related to the differences between the three mutually exclusive populations, they do not adequately explain the differences between world region of birth. 12
14 Model 3 focuses on the relationship between world region of birth and the likelihood of being in the different estimated populations while controlling for social variables. The social variables include educational attainment, school enrollment, and employment. Age is also retained as a control variable. Foreign-born immigrants with some college education are more likely than those with less than a high school diploma (reference category) to be in the ROYA alone population than either the YOE alone or Overlap populations. Foreign-born immigrants with a bachelor s degree or higher are more likely than those with less than a high school diploma to be in either the ROYA alone or Overlap populations than the YOE alone population. Students are more likely to be in the Overlap population than either the ROYA alone or YOE alone populations. Immigrants that are unemployed or not in the labor force are less likely to be in the YOE alone population than the ROYA alone or Overlap populations. The odds ratios for region of birth remain significant in this model, except for immigrants from Asia in the YOE alone vs. ROYA alone comparison. This means that differences between immigrants from Asia and Latin America in their likelihood of being classified in the ROYA alone or YOE alone categories can be explained by the social characteristics of immigrants from those regions. Model 4 replaces the social variables with the survey-related variable for mode of survey. Foreign-born immigrants who responded by telephone or in person are more likely than those who responded by mail to be in either the ROYA alone or YOE alone populations than the Overlap population. This matches what was portrayed in the descriptive statistics, where those surveyed by CATI or CAPI were least represented in the Overlap population. The odds ratios for region of birth remain significant. Mode of survey explains some, but not all, of the differences between world regions of birth. 13
15 Model 5 is a full model which includes all of the controls from the previous models. Even after controlling for demographic, social, and survey-related variables, the odds ratios for region of birth remain significant with relatively large magnitudes. Foreign-born immigrants born in Africa become significantly more likely than Latin Americans to be in the YOE alone population than the ROYA alone population. In this model, sex becomes statistically significant, with males being slightly more likely than females to be in the ROYA alone population than either the YOE alone or Overlap populations. The effects of age are less pronounced than in the model with demographic controls (Model 2) for the ROYA alone vs. Overlap and YOE alone vs. ROYA alone comparisons, especially for immigrants 3-17 years old and 50 years or older. The impact of living in a family household compared to a nonfamily household increases substantially in the full model for the YOE alone compared to the ROYA alone population where immigrants in a family are 42 percent more likely to be in the YOE alone than the ROYA alone category. There were only small changes in the odds ratios for educational attainment and enrollment in the full model; however, the changes were not statistically different from Model 3. In the full model, the effect of not being in the labor force increases for the ROYA alone vs. Overlap and YOE alone vs. ROYA alone comparisons compared to Model 3. Finally, mode of survey becomes statistically significant in the YOE alone and ROYA alone comparison where immigrants who responded by CATI/CAPI are less likely to be in the YOE alone than the ROYA alone category. Conclusion Precise measures of foreign-born immigration are essential for producing accurate population estimates. The Population Estimates Program of the U.S. Census Bureau uses the ROYA method to produce a national-level estimate of foreign-born immigration and information 14
16 on year of entry to distribute demographic and geographic characteristics to the ROYA-based national-level estimate. However, the YOE method can also be used to produce a national-level estimate of foreign-born immigration over a 12-month period. In this paper, we analyzed differences in estimates of foreign-born immigration between the ROYA and YOE methods focusing on annual and monthly levels of immigration as well as demographic, social, and survey-related characteristics. The findings show that from , there were differences in the estimated levels of foreign-born immigration between the ROYA and YOE methods. There was also considerable variation in the estimated characteristics, including world regions of birth, between the two methods. In recent years, the world-region-of-birth composition of immigrant flows to the United States has been shifting. Sharp declines in the number of immigrants from Mexico and other Latin American countries have been accompanied by steady increases in the number of immigrants from China and India (Jensen and Arenas-Germosén 2012). That the composition of world region of birth varies between the ROYA and YOE methods has implications for the age, sex, race, and Hispanic origin distributions for the estimates of net international migration used in the population estimates. The population estimated using the ROYA method is older, more Asian, and more White than the population estimated using the YOE method which is younger and more Hispanic. In an effort to produce the most accurate estimates, the Census Bureau continues to research and evaluate methods for estimating foreign-born immigration. 15
17 References Bhaskar, Renuka, Melissa Scopilliti, Frederick W Hollmann, and David Armstrong "Plans for Producing Estimates of Net International Migration for the 2010 Demographic Analysis Estimates." Population Division Working Paper No. 90. U.S. Census Bureau. de la Cruz, Patricia and Cassandra Logan "August 2008 CPS Migration Supplement: A Preliminary Look at the Citizenship and Year of Entry Sections." Paper Presented at the Annual Conference of the Southern Demographic Association, October, Galveston, TX. Ellis, Mark and Richard Wright "When Immigrants are not Migrants: Counting Arrivals of the Foreign Born using the U.S. Census." International Migration Review 32: Harris, Phillip, Renuka Bhaskar, Claire Shook-Finucane, and Leah Ericson "Evaluation Report Covering Place of Birth, U.S. Citizenship Status, and Year of Arrival." 2006 American Community Survey Content Test Report P.1: U.S. Census Bureau. Jensen, Eric and Belkinés Arenas-Germosén "Recent Trends in the Racial and Ethnic Composition of Immigrant Flows to the United States: " Poster Presented at the Annual Conference of the Population Association of America, May, San Francisco, CA. Massey, Douglas S. and Nolan J. Malone "Pathways to Legal Immigration." Population Research and Policy Review 21: Passel, Jeffrey "Unauthorized Migrants in the United States: Estimates, Methods, and Characteristics." OECD Social, Employment, and Migration Working Papers No. 57. Organization for Economic Co-operation and Development, Paris. Pew Research Center for Social and Demographic Trends "The Rise of Asian Americans." Washington, D.C.: Available online at Redstone, Ilana and Douglas S. Massey "Coming to Stay: An Analysis of the U.S. Census Question on Immigrants' Year of Arrival." Demography 41: Scopilliti, Melissa, Renuka Bhaskar, Eric B. Jensen, and Victoria A. Velkoff "Using Census and Survey Data to Estimate Migration Between the United States and Mexico." Paper Presented at the Annual Conference of the Population Association of America Annual Meetings, March/April, Washington, D.C. Vericker, Tracy, Karina Fortuny, Kenneth Finegold, and Sevgi Bayram Ozdemir "Effects of Immigration on WIC and NSLP Caseloads." The Urban Institute, Washington, D.C. 16
18 Table 1. Residence One Year Ago (ROYA) Alone, Year of Entry (YOE) Alone, and Overlap Populations by Month: ROYA Alone YOE Alone Overlap Month Percent MOE Percent MOE Percent MOE January February March April May June July August September October November December N 2,758,512 49,741 3,133,793 52,065 1,914,353 38,844 Notes: Restricted to household population ages 3 and above, with no imputation for ROYA and YOE questions. Source: U.S. Census Bureau, year American Community Survey files, special tabulations. 17
19 Table 2. Imputation of the Residence One Year Ago and Year of Entry Questions by Residence One Year Ago (ROYA) Alone, Year of Entry (YOE) Alone, and Overlap Populations: Question and imputation status ROYA Alone YOE Alone Overlap Percent MOE Percent MOE Percent MOE Residence one year ago Not imputed Imputed Year of entry Not imputed Imputed N 3,118,709 51,787 3,630,727 54,604 1,964,936 38,992 Notes: Restricted to household population ages 3 and above. Source: U.S. Census Bureau, year American Community Survey files, special tabulations. 18
20 Table 3. Demographic Characteristics of Residence One Year Ago (ROYA) Alone, Year of Entry (YOE) Alone, and Overlap Populations: Characteristic ROYA Alone YOE Alone Overlap Percent MOE Percent MOE Percent MOE World region of birth Latin America Asia Europe Africa Other Sex Male Female Age Household type Family Nonfamily N 2,758,512 49,741 3,133,793 52,065 1,914,353 38,844 Notes: Restricted to household population ages 3 and above, with no imputation for ROYA and YOE questions. Source: U.S. Census Bureau, year American Community Survey files, special tabulations. 19
21 Table 4. Social and Survey-Operation Characteristics of Residence One Year Ago (ROYA) Alone, Year of Entry (YOE) Alone, and Overlap Populations: ROYA Alone YOE Alone Overlap Characteristic Percent MOE Percent MOE Percent MOE School Enrollment 1 Enrolled Not enrolled Mode 1 CATI 2 /CAPI Mail N 2,758,512 49,741 3,133,793 52,065 1,914,353 38,844 Labor force status (Age 16+) Employed Unemployed Not in labor force N 2,434,618 43,933 2,641,868 44,802 1,637,500 32,998 Education (Age 25+) Less than high school High school Some college Bachelor s degree or above N 1,841,636 36,937 1,897,225 33,601 1,177,548 24,297 1 Restricted to household population ages 3 and above, with no imputation for ROYA and YOE questions. 2 Computer-Assisted Telephone Interview. 3 Computer-Assisted Personal Interview. Source: U.S. Census Bureau, year American Community Survey files, special tabulations. 20
22 Table 5. Multinomial Logistic Regression Models on Residence One Year Ago (ROYA) Alone, Year of Entry (YOE) Alone, and Overlap Populations: Model 1 Model 2 Model 3 ROYA Alone vs. YOE Alone YOE Alone vs. ROYA ROYA Alone vs. YOE Alone YOE Alone vs. ROYA ROYA Alone vs. YOE Alone YOE Alone vs. ROYA Model 4 Model 5 Characteristic Overlap vs. Overlap Alone Overlap vs. Overlap Alone Overlap vs. Overlap Alone Overlap vs. Overlap Alone Overlap vs. Overlap Alone Intercept 0.26 *** 0.71 *** 2.69 *** 0.25 *** 0.62 *** 2.49 *** 0.23 *** 0.88 ** 3.75 *** 0.20 *** 0.54 *** 2.73 *** 0.17 *** 0.59 *** 3.43 *** Region of Birth Latin America (ref.) Asia 0.66 *** 0.54 *** 0.82 *** 0.64 *** 0.55 *** 0.85 *** 0.68 *** 0.64 *** *** 0.59 *** 0.82 *** 0.72 *** 0.68 *** 0.94 * Europe 0.68 *** 0.40 *** 0.58 *** 0.67 *** 0.41 *** 0.61 *** 0.71 *** 0.45 *** 0.64 *** 0.76 *** 0.44 *** 0.58 *** 0.78 *** 0.50 *** 0.64 *** Africa 0.61 *** 0.65 *** *** 0.65 *** *** 0.71 *** 1.12 *** 0.64 *** 0.68 *** *** 0.73 *** 1.10 *** Other 0.81 *** 0.50 *** 0.61 *** 0.73 *** 0.49 *** 0.68 *** 0.75 *** 0.54 *** 0.72 *** *** 0.61 *** 0.81 ** 0.59 *** 0.73 *** Demographic characteristics Male 1.05 * 1.04 * *** *** Age *** 0.90 *** 1.07 ** 0.88 *** 0.91 *** * 0.89 *** (ref.) ** 0.92 *** 0.86 *** * *** *** *** 1.45 *** 1.06 * 0.73 *** 1.57 *** 1.08 ** 0.69 *** Family household 0.93 ** 1.19 *** 1.28 *** 0.85 *** 1.21 *** 1.42 *** Social characteristics Education Less than High School (ref.) High School * 0.93 * * 0.92 ** Some College ** 0.83 *** 1.16 * 0.97 * 0.84 *** Bachelor's Degree or Above 0.93 *** 0.66 *** 0.71 *** *** 0.73 *** School Enrollment 0.65 *** *** 0.63 *** *** Employment Employed (ref.) Unemployed *** 0.66 *** 1.18 ** 0.72 *** 0.61 *** Not in Labor Force 1.31 *** 0.80 *** 0.61 *** 1.41 *** 0.78 *** 0.55 *** Survey characteristics Mode Mail (ref.) CATI/CAPI 1.38 *** 1.36 *** *** 1.34 *** 0.96 ** ROYA Alone vs. YOE Alone YOE Alone vs. ROYA ROYA Alone vs. YOE Alone YOE Alone vs. ROYA Likelihood Ratio 1,625 *** 13,037 *** 33,970 *** 3,048 *** 73,902 *** *** p>.001, ** p>.01, * p>.05 n = 83,251 Note: All models controlled for year and month. Restricted to household population ages 3 and above, with no imputation for ROYA and YOE questions. Source: U.S. Census Bureau, year American Community Survey files, special tabulations. 21
23 Figure 1. Temporal Inconsistencies Between the ROYA and YOE Methods for Estimating Foreign-Born Immigration YOE Alone ROYA Alone Dec Nov Oct Sep Immigrant 1 Immigrant 2 Immigrant 3 Overlap Aug Jul Jun May Apr Month of Survey Mar Feb Jan Jan Feb Mar Apr May Jun Jul Aug Sep Oct Nov Dec Jan Feb Mar Apr May Jun Jul Aug Sep Oct Nov Dec Year Prior to the Survey Source: U.S. Census Bureau, Population Division. Month of Entry Survey Year 22
24 23
Measuring Mexican Emigration to the United States Using the American Community Survey
 Measuring Mexican Emigration to the United States Using the American Community Survey Eric Jensen and Matthew Spence Population Division U.S. Census Bureau International Forum on Migration Statistics January
Melissa Scopilliti Eric B. Jensen Population Division U.S. Census Bureau
 The Impact of Revising the International Migration Components on the 2010 Demographic Analysis Sex Ratios By Melissa Scopilliti Eric B. Jensen Population Division U.S. Census Bureau Poster to be presented
The U.S. Census Bureau s 2010 Demographic Analysis Estimates: Incorporation of Data from the 2010 Mexico Census
 Distr.: General 10 October 2012 Original: English Working paper 13 Economic Commission for Europe Conference of European Statisticians Group of Experts on Migration Statistics Work Session on Migration
The foreign born are more geographically concentrated than the native population.
 The Foreign-Born Population in the United States Population Characteristics March 1999 Issued August 2000 P20-519 This report describes the foreign-born population in the United States in 1999. It provides
Characteristics of the Ethnographic Sample of First- and Second-Generation Latin American Immigrants in the New York to Philadelphia Urban Corridor
 Table 2.1 Characteristics of the Ethnographic Sample of First- and Second-Generation Latin American Immigrants in the New York to Philadelphia Urban Corridor Characteristic Females Males Total Region of
Characteristics of People. The Latino population has more people under the age of 18 and fewer elderly people than the non-hispanic White population.
 The Population in the United States Population Characteristics March 1998 Issued December 1999 P20-525 Introduction This report describes the characteristics of people of or Latino origin in the United
New Patterns in US Immigration, 2011:
 Jeffrey S. Passel Pew Hispanic Center Washington, DC Immigration Reform: Implications for Farmers, Farm Workers, and Communities University of California, DC Washington, DC 12-13 May 2011 New Patterns
Introduction. Background
 Millennial Migration: How has the Great Recession affected the migration of a generation as it came of age? Megan J. Benetsky and Alison Fields Journey to Work and Migration Statistics Branch Social, Economic,
THE DEMOGRAPHY OF MEXICO/U.S. MIGRATION
 THE DEMOGRAPHY OF MEXICO/U.S. MIGRATION October 19, 2005 B. Lindsay Lowell, Georgetown University Carla Pederzini Villarreal, Universidad Iberoamericana Jeffrey Passel, Pew Hispanic Center * Presentation
Population Estimates
 Population Estimates AUGUST 200 Estimates of the Unauthorized Immigrant Population Residing in the United States: January MICHAEL HOEFER, NANCY RYTINA, AND CHRISTOPHER CAMPBELL Estimating the size of the
RECOMMENDED CITATION: Pew Research Center, May, 2015, Free Trade Agreements Seen as Good for U.S., But Concerns Persist
 NUMBERS, FACTS AND TRENDS SHAPING THE WORLD FOR RELEASE MAY 27, 2015 FOR FURTHER INFORMATION ON THIS REPORT: Carroll Doherty, Director of Political Research Jocelyn Kiley, Associate Director, Research
CLACLS. Demographic, Economic, and Social Transformations in Bronx Community District 5:
 CLACLS Center for Latin American, Caribbean & Latino Stud- Demographic, Economic, and Social Transformations in Bronx Community District 5: Fordham, University Heights, Morris Heights and Mount Hope, 1990
RECOMMENDED CITATION: Pew Research Center, June, 2015, Broad Public Support for Legal Status for Undocumented Immigrants
 NUMBERS, FACTS AND TRENDS SHAPING THE WORLD FOR RELEASE JUNE 4, 2015 FOR FURTHER INFORMATION ON THIS REPORT: Carroll Doherty, Director of Political Research Alec Tyson, Senior Researcher Rachel Weisel,
 Page 1 of 5 DP02 SELECTED SOCIAL CHARACTERISTICS IN THE UNITED STATES 2013 American Community Survey 1-Year Estimates Although the American Community Survey (ACS) produces population, demographic and housing
Youth at High Risk of Disconnection
 Youth at High Risk of Disconnection A data update of Michael Wald and Tia Martinez s Connected by 25: Improving the Life Chances of the Country s Most Vulnerable 14-24 Year Olds Prepared by Jacob Rosch,
Tracing Emigrating Populations from Highly-Developed Countries Resident Registration Data as a Sampling Frame for International German Migrants
 Tracing Emigrating Populations from Highly-Developed Countries Resident Registration Data as a Sampling Frame for International German Migrants International Forum on Migration Statistics, 15-16 January
LATINO DATA PROJECT. Astrid S. Rodríguez Ph.D. Candidate, Educational Psychology. Center for Latin American, Caribbean, and Latino Studies
 LATINO DATA PROJECT Demographic, Economic, and Social Transformations in the South Bronx: Changes in the NYC Community Districts Comprising Mott Haven, Port Morris, Melrose, Longwood, and Hunts Point,
The Reshaping of America. The Reshaping of America. The Reshaping of America. The Reshaping of America 9/17/2014
 Columbia Room B 9:45 AM 1:35 AM Hyatt Grand Regency Capitol Hill Tuesday September 9, 214 Welcome Today s Session Guest Speaker Questions and Answer Current Situation Changing demographics across the country
Marist College Institute for Public Opinion Poughkeepsie, NY Phone Fax
 Marist College Institute for Public Opinion Poughkeepsie, NY 12601 Phone 845.575.5050 Fax 845.575.5111 www.maristpoll.marist.edu POLL MUST BE SOURCED: McClatchy-Marist Poll* Nearly Half of Americans Support
Tell us what you think. Provide feedback to help make American Community Survey data more useful for you.
 DP02 SELECTED SOCIAL CHARACTERISTICS IN THE UNITED STATES 2016 American Community Survey 1-Year Estimates Supporting documentation on code lists, subject definitions, data accuracy, and statistical testing
Elizabeth M. Grieco, Patricia de la Cruz, Rachel Cortes, and Luke Larsen Immigration Statistics Staff, Population Division U.S.
 Who in the United States Sends and Receives Remittances? An Initial Analysis of the Monetary Transfers Data from the August 2008 CPS Migration Supplement 1 Elizabeth M. Grieco, Patricia de la Cruz, Rachel
Demographic, Economic and Social Transformations in Bronx Community District 4: High Bridge, Concourse and Mount Eden,
 Center for Latin American, Caribbean & Latino Studies Graduate Center City University of New York 365 Fifth Avenue Room 5419 New York, New York 10016 Demographic, Economic and Social Transformations in
Historical unit prices - Super - Australian Shares
 09 May 2012 $1.0024 $1.0000 16 May 2012 $0.9830 $0.9806 23 May 2012 $0.9414 $0.9392 30 May 2012 $0.9392 $0.9370 06 Jun 2012 $0.9465 $0.9443 14 Jun 2012 $0.9448 $0.9426 20 Jun 2012 $0.9433 $0.9411 27 Jun
Demographic, Economic, and Social Transformations in Queens Community District 3: East Elmhurst, Jackson Heights, and North Corona,
 Demographic, Economic, and Social Transformations in Queens Community District 3: East Elmhurst, Jackson Heights, and North Corona, 1990-2006 Astrid S. Rodríguez Fellow, Center for Latin American, Caribbean
2.2 THE SOCIAL AND DEMOGRAPHIC COMPOSITION OF EMIGRANTS FROM HUNGARY
 1 Obviously, the Population Census does not provide information on those emigrants who have left the country on a permanent basis (i.e. they no longer have a registered address in Hungary). 60 2.2 THE
RECOMMENDED CITATION: Pew Research Center, August, 2016, On Immigration Policy, Partisan Differences but Also Some Common Ground
 NUMBERS, FACTS AND TRENDS SHAPING THE WORLD FOR RELEASE AUGUST 25, 2016 FOR MEDIA OR OTHER INQUIRIES: Carroll Doherty, Director of Political Research Jocelyn Kiley, Associate Director, Research Bridget
Borders First a Dividing Line in Immigration Debate
 JUNE 23, 2013 More Say Legalization Would Benefit Economy than Cost Jobs Borders First a Dividing Line in Immigration Debate A Pew Research Center/USA TODAY Survey FOR FURTHER INFORMATION CONTACT THE PEW
info Poverty in the San Diego Region SANDAG December 2013
 info December 2013 SANDAG Poverty in the San Diego Region Table of Contents Overview... 3 Background... 3 Federal Poverty Measurements... 4 Poverty Status for Individuals in the San Diego Region... 6 Demographic
Supreme Court s Favorability Edges Below 50%
 JULY 24, 2013 Blacks Views of Court Turn More Negative Supreme Court s Favorability Edges Below 50% FOR FURTHER INFORMATION CONTACT THE PEW RESEARCH CENTER FOR THE PEOPLE & THE PRESS Michael Dimock Director
Institute for Public Policy and Economic Analysis
 Institute for Public Policy and Economic Analysis The Institute for Public Policy and Economic Analysis at Eastern Washington University will convey university expertise and sponsor research in social,
RECOMMENDED CITATION: Pew Research Center, October, 2015, On Immigration Policy, Wider Partisan Divide Over Border Fence Than Path to Legal Status
 NUMBERS, FACTS AND TRENDS SHAPING THE WORLD FOR RELEASE OCTOBER 8, 2015 FOR FURTHER INFORMATION ON THIS REPORT: Carroll Doherty, Director of Political Research Rob Suls, Research Associate Bridget Jameson,
Short-Term Transitional Leave Program in Oregon
 Short-Term Transitional Leave Program in Oregon January 2016 Criminal Justice Commission Michael Schmidt, Executive Director Oregon Analysis Center Kelly Officer, Director With Special Thanks To: Jeremiah
Monthly Census Bureau data show that the number of less-educated young Hispanic immigrants in the
 Backgrounder Center for Immigration Studies July 2009 A Shifting Tide Recent Trends in the Illegal Immigrant Population By Steven A. Camarota and Karen Jensenius Monthly Census Bureau data show that the
Peruvians in the United States
 Peruvians in the United States 1980 2008 Center for Latin American, Caribbean & Latino Studies Graduate Center City University of New York 365 Fifth Avenue Room 5419 New York, New York 10016 212-817-8438
Immigrants are playing an increasingly
 Trends in the Low-Wage Immigrant Labor Force, 2000 2005 THE URBAN INSTITUTE March 2007 Randy Capps, Karina Fortuny The Urban Institute Immigrants are playing an increasingly important role in the U.S.
Unemployment Rises Sharply Among Latino Immigrants in 2008
 Report February 12, 2009 Unemployment Rises Sharply Among Latino Immigrants in 2008 Rakesh Kochhar Associate Director for Research, Pew Hispanic Center The Pew Hispanic Center is a nonpartisan research
Growing share of public says there is too little focus on race issues
 FOR RELEASE DECEMBER 19, 2017 Most Americans Say Trump s Election Has Led to Worse Race Relations in the U.S. Growing share of public says there is too little focus on race issues FOR MEDIA OR OTHER INQUIRIES:
New Orleans s Latinos: Growth in an uncertain destination. Elizabeth Fussell, Washington State University Mim Northcutt, Amicus
 New Orleans s Latinos: Growth in an uncertain destination Elizabeth Fussell, Washington State University Mim Northcutt, Amicus Abstract: Latino immigrants arrived in New Orleans after Hurricane Katrina
Evaluating the Role of Immigration in U.S. Population Projections
 Evaluating the Role of Immigration in U.S. Population Projections Stephen Tordella, Decision Demographics Steven Camarota, Center for Immigration Studies Tom Godfrey, Decision Demographics Nancy Wemmerus
ESTIMATES OF INTERGENERATIONAL LANGUAGE SHIFT: SURVEYS, MEASURES, AND DOMAINS
 ESTIMATES OF INTERGENERATIONAL LANGUAGE SHIFT: SURVEYS, MEASURES, AND DOMAINS Jennifer M. Ortman Department of Sociology University of Illinois at Urbana-Champaign Presented at the Annual Meeting of the
FOR RELEASE NOVEMBER 07, 2017
 FOR RELEASE NOVEMBER 07, 2017 FOR MEDIA OR OTHER INQUIRIES: Carroll Doherty, Director of Political Research Jocelyn Kiley, Associate Director, Research Bridget Johnson, Communications Associate 202.419.4372
Immigration and Language
 NATIONAL CENTER ON IMMIGRANT INTEGRATION POLICY Immigration and Language Michael Fix Michael Fix Senior Vice President Earl Warren Institute University of California, Berkeley May 4, 2009 Points of Departure
Working Paper Series. Estimation of Voter Turnout by Age Group and Gender at the 2011 Federal General Election
 Working Paper Series Estimation of Voter Turnout by Age Group and Gender at the 2011 Federal General Election April 2012 Table of Contents Summary... 3 Acknowledgements... 4 Introduction... 4 National
The Latino Electorate in 2010: More Voters, More Non-Voters
 April 26, 2011 The Latino Electorate in 2010: More Voters, More Non-Voters Mark Hugo Lopez, Associate Director FOR FURTHER INFORMATION CONTACT: Pew Hispanic Center 1615 L St, N.W., Suite 700 Washington,
Unauthorized immigrants in the U.S.: Estimation methods, microdata & selected results
 Unauthorized immigrants in the U.S.: Estimation methods, microdata & selected results Jeffrey S. Passel Senior Demographer Measuring irregular migration: Innovative data practices Expert workshop, Global
Rural Child Poverty across Immigrant Generations in New Destination States
 Rural Child Poverty across Immigrant Generations in New Destination States Brian Thiede, The Pennsylvania State University Leif Jensen, The Pennsylvania State University March 22, 2018 Rural Poverty Fifty
CIRCLE The Center for Information & Research on Civic Learning & Engagement
 FACT SHEET CIRCLE The Center for Information & Research on Civic Learning & Engagement The Youth Vote 2004 By Mark Hugo Lopez, Emily Kirby, and Jared Sagoff 1 July 2005 Estimates from all sources suggest
Foreign Migration to the Cleveland-Akron-Lorain Metropolitan Area From 1995 to 2000
 EngagedScholarship@CSU Urban Publications Maxine Goodman Levin College of Urban Affairs 12-22-2005 Foreign Migration to the Cleveland-Akron-Lorain Metropolitan Area From 1995 to 2000 Mark Salling, m.salling@csuohio.edu
Population Estimates
 Population Estimates FeBrUary 2009 Estimates of the Unauthorized Immigrant Population Residing in the United States: January 2008 MicHael HoeFer, NaNcy rytina, and BryaN c. Baker This report provides estimates
NUMBERS, FACTS AND TRENDS SHAPING THE WORLD FOR RELEASE AUGUST 25, 2014 FOR FURTHER INFORMATION ON THIS REPORT:
 NUMBERS, FACTS AND TRENDS SHAPING THE WORLD FOR RELEASE AUGUST 25, 2014 FOR FURTHER INFORMATION ON THIS REPORT: Carroll Doherty, Director of Political Research Alec Tyson, Senior Researcher Rachel Weisel,
RECOMMENDED CITATION: Pew Research Center, February 2014, Public Divided over Increased Deportation of Unauthorized Immigrants
 NUMBERS, FACTS AND TRENDS SHAPING THE WORLD FOR RELEASE FEBRUARY 27, 2014 FOR FURTHER INFORMATION ON THIS REPORT: Carroll Doherty, Director of Political Research Rob Suls, Research Associate 202.419.4372
Assessment of Demographic & Community Data Updates & Revisions
 Assessment of Demographic & Community Data Updates & Revisions Scott Langen, Director of Operations McNair Business Development Inc. P: 306-790-1894 F: 306-789-7630 E: slangen@mcnair.ca October 30, 2013
THE EARNINGS AND SOCIAL SECURITY CONTRIBUTIONS OF DOCUMENTED AND UNDOCUMENTED MEXICAN IMMIGRANTS. Gary Burtless and Audrey Singer CRR-WP
 THE EARNINGS AND SOCIAL SECURITY CONTRIBUTIONS OF DOCUMENTED AND UNDOCUMENTED MEXICAN IMMIGRANTS Gary Burtless and Audrey Singer CRR-WP 2011-2 Date Released: January 2011 Date Submitted: December 2010
REGIONAL. San Joaquin County Population Projection
 Lodi 12 EBERHARDT SCHOOL OF BUSINESS Business Forecasting Center in partnership with San Joaquin Council of Governments 99 26 5 205 Tracy 4 Lathrop Stockton 120 Manteca Ripon Escalon REGIONAL analyst june
Left out under Federal Health Reform: Undocumented immigrant adults excluded from ACA Medicaid expansions
 Left out under Federal Health Reform: Undocumented immigrant adults excluded from ACA Medicaid expansions Jessie Kemmick Pintor, MPH Graduate Research Assistant State Health Access Data Assistance Center
State Estimates of the Low-income Uninsured Not Eligible for the ACA Medicaid Expansion
 March 2013 State Estimates of the Low-income Uninsured Not Eligible for the ACA Medicaid Expansion Introduction The Patient Protection and Affordable Care Act (ACA) will expand access to affordable health
This analysis confirms other recent research showing a dramatic increase in the education level of newly
 CENTER FOR IMMIGRATION STUDIES April 2018 Better Educated, but Not Better Off A look at the education level and socioeconomic success of recent immigrants, to By Steven A. Camarota and Karen Zeigler This
RECOMMENDED CITATION: Pew Research Center, May, 2015, Public Continues to Back U.S. Drone Attacks
 NUMBERS, FACTS AND TRENDS SHAPING THE WORLD FOR RELEASE MAY 28, 2015 FOR FURTHER INFORMATION ON THIS REPORT: Carroll Doherty, Directory of Political Research Alec Tyson, Senior Researcher Rachel Weisel,
Demographic Change How the US is Coping with Aging, Immigration, and Other Challenges William H. Frey
 Demographic Change How the US is Coping with Aging, Immigration, and Other Challenges William H. Frey Brookings Institution University of Michigan www.frey-demographer.org US: Total and Age 65+ Growth,
BY Rakesh Kochhar FOR RELEASE MARCH 07, 2019 FOR MEDIA OR OTHER INQUIRIES:
 FOR RELEASE MARCH 07, 2019 BY Rakesh Kochhar FOR MEDIA OR OTHER INQUIRIES: Rakesh Kochhar, Senior Researcher Jessica Pumphrey, Communications Associate 202.419.4372 RECOMMENDED CITATION Pew Research Center,
Individual and Community Effects on Immigrant Naturalization. John R. Logan Sookhee Oh Jennifer Darrah. Brown University
 Individual and Community Effects on Immigrant Naturalization John R. Logan Sookhee Oh Jennifer Darrah Brown University Abstract Becoming a citizen is a component of a larger process of immigrant incorporation
Using the American Community Survey to Measure Net International Migration
 Using the American Community Survey to Measure Net International Migration Victoria Velkoff Population Division U.S. Census Bureau Workshop on the American Community Survey Havana, Cuba November 16, 2010
PREDICTORS OF CONTRACEPTIVE USE AMONG MIGRANT AND NON- MIGRANT COUPLES IN NIGERIA
 PREDICTORS OF CONTRACEPTIVE USE AMONG MIGRANT AND NON- MIGRANT COUPLES IN NIGERIA Odusina Emmanuel Kolawole and Adeyemi Olugbenga E. Department of Demography and Social Statistics, Federal University,
Astrid S. Rodríguez Fellow, Center for Latin American, Caribbean & Latino Studies. Center for Latin American, Caribbean & Latino Studies
 Demographic, Economic, and Social Transformations in Bronx Community District 9: Parkchester, Unionport, Soundview, Castle Hill, and Clason Point, 1990-2006 Center for Latin American, Caribbean & Latino
Record Number Favors Removing U.S. Troops from Afghanistan
 TUESDAY, JUNE 21, 2011 Record Number Favors Removing U.S. Troops from Afghanistan FOR FURTHER INFORMATION CONTACT: Andrew Kohut President, Pew Research Center Carroll Doherty and Michael Dimock Associate
The Youth Vote in 2008 By Emily Hoban Kirby and Kei Kawashima-Ginsberg 1 Updated August 17, 2009
 The Youth Vote in 2008 By Emily Hoban Kirby and Kei Kawashima-Ginsberg 1 Updated August 17, 2009 Estimates from the Census Current Population Survey November Supplement suggest that the voter turnout rate
Selected trends in Mexico-United States migration
 Selected trends in Mexico-United States migration Since the early 1970s, the traditional Mexico- United States migration pattern has been transformed in magnitude, intensity, modalities, and characteristics,
Any Court Health Care Decision Unlikely to Please
 MONDAY, JUNE 18, 2012 Immigration: Public Backs AZ Law, But Also Path to Citizenship Any Court Health Care Decision Unlikely to Please FOR FURTHER INFORMATION CONTACT: Andrew Kohut President, Pew Research
Migrant population of the UK
 BRIEFING PAPER Number CBP8070, 3 August 2017 Migrant population of the UK By Vyara Apostolova & Oliver Hawkins Contents: 1. Who counts as a migrant? 2. Migrant population in the UK 3. Migrant population
Jail Population Trend Report April - June 2016
 Jail Population Trend Report April - June 206 Prepared by Mecklenburg County Criminal Justice Services Planning This report identifies and tracks emerging trends that may influence the operation of the
Heather Randell & Leah VanWey Department of Sociology and Population Studies and Training Center Brown University
 Heather Randell & Leah VanWey Department of Sociology and Population Studies and Training Center Brown University Family Networks and Urban Out-Migration in the Brazilian Amazon Extended Abstract Introduction
RECOMMENDED CITATION: Pew Research Center, July, 2014, Most Think the U.S. Has No Responsibility to Act in Iraq
 NUMBERS, FACTS AND TRENDS SHAPING THE WORLD FOR RELEASE JULY 18, 2014 FOR FURTHER INFORMATION ON THIS REPORT: Carroll Doherty, Director of Political Research Danielle Gewurz, Research Analyst Seth Motel,
BADAN PUSAT STATISTIK KEPALA BADAN PUSAT STATISTIK 1
 www.bps.go.id BADAN PUSAT STATISTIK KEPALA BADAN PUSAT STATISTIK 1 INDONESIA DURING THE GLOBAL ECONOMIC CRISIS: 2008 2009 HOW DEEP THE IMPACT? ISTANBUL, TURKEY MARCH 2010 BPS Statistics Indonesia 2 BPS
RECOMMENDED CITATION: Pew Research Center, May, 2017, Public Trust in Government Remains Near Historic Lows as Partisan Attitudes Shift
 NUMBERS, FACTS AND TRENDS SHAPING THE WORLD FOR RELEASE MAY 3, 2017 FOR MEDIA OR OTHER INQUIRIES: Carroll Doherty, Director of Political Research Jocelyn Kiley, Associate Director, Research Bridget Johnson,
Measuring International Migration- Related SDGs with U.S. Census Bureau Data
 Measuring International Migration- Related SDGs with U.S. Census Bureau Data Jason Schachter and Megan Benetsky Population Division U.S. Census Bureau International Forum on Migration Statistics Session
Patrick Adler and Chris Tilly Institute for Research on Labor and Employment, UCLA. Ben Zipperer University of Massachusetts, Amherst
 THE STATE OF THE UNIONS IN 2013 A PROFILE OF UNION MEMBERSHIP IN LOS ANGELES, CALIFORNIA AND THE NATION 1 Patrick Adler and Chris Tilly Institute for Research on Labor and Employment, UCLA Ben Zipperer
Demographic, Economic, and Social Transformations in Brooklyn Community District 4: Bushwick,
 Demographic, Economic, and Social Transformations in Brooklyn Community District 4: Bushwick, 1990-2007 Astrid S. Rodríguez Ph.D. Candidate, Educational Psychology Center for Latin American, Caribbean
Tariff 9900: OHD Percentage Based Fuel Cost Adjustment Historical Schedule ( )
") Tariff 9900: OHD Percentage Based Fuel Cost Adjustment Historical Schedule (2009-2011) Notice: As a consequence of the weather related closure of the EIA, the March 1-15, 2010 applied FCA uses the average
Tariff 9900: OHD Percentage Based Fuel Cost Adjustment Historical Schedule (2009-2011) Notice: As a consequence of the weather related closure of the EIA, the March 1-15, 2010 applied FCA uses the average
CLACLS. A Profile of Latino Citizenship in the United States: Demographic, Educational and Economic Trends between 1990 and 2013
 CLACLS Center for Latin American, Caribbean & Latino Studies A Profile of Latino Citizenship in the United States: Demographic, Educational and Economic Trends between 1990 and 2013 Karen Okigbo Sociology
Socio-Economic Mobility Among Foreign-Born Latin American and Caribbean Nationalities in New York City,
 Socio-Economic Mobility Among Foreign-Born Latin American and Caribbean Nationalities in New York City, 2000-2006 Center for Latin American, Caribbean & Latino Studies Graduate Center City University of
Older Immigrants in the United States By Aaron Terrazas Migration Policy Institute
 Older Immigrants in the United States By Aaron Terrazas Migration Policy Institute May 2009 After declining steadily between 1960 and 1990, the number of older immigrants (those age 65 and over) in the
WISCONSIN ECONOMIC SCORECARD
 RESEARCH BRIEF Q4 2013 Joseph Cera, PhD CUIR Survey Center University of Wisconsin Milwaukee WISCONSIN ECONOMIC SCORECARD The Wisconsin Economic Scorecard is a quarterly poll of Wisconsin residents conducted
GOP Seen as Principled, But Out of Touch and Too Extreme
 FEBRUARY 26, 2013 Images of the Parties: A Closer Look GOP Seen as Principled, But Out of Touch and Too Extreme FOR FURTHER INFORMATION CONTACT THE PEW RESEARCH CENTER FOR THE PEOLE & THE PRESS Michael
US Undocumented Population Drops Below 11 Million in 2014, with Continued Declines in the Mexican Undocumented Population
 Drops Below 11 Million in 2014, with Continued Declines in the Mexican Undocumented Population Robert Warren Center for Migration Studies Executive Summary Undocumented immigration has been a significant
Influence of Consumer Culture and Race on Travel Behavior
 PAPER Influence of Consumer Culture and Race on Travel Behavior JOHANNA P. ZMUD CARLOS H. ARCE NuStats International ABSTRACT In this paper, data from the National Personal Transportation Survey (NPTS),
ATTACHMENT 16. Source and Accuracy Statement for the November 2008 CPS Microdata File on Voting and Registration
 ATTACHMENT 16 Source and Accuracy Statement for the November 2008 CPS Microdata File on Voting and Registration SOURCE OF DATA The data in this microdata file are from the November 2008 Current Population
Far From the Commonwealth: A Report on Low- Income Asian Americans in Massachusetts
 University of Massachusetts Boston ScholarWorks at UMass Boston Institute for Asian American Studies Publications Institute for Asian American Studies 1-1-2007 Far From the Commonwealth: A Report on Low-
FOR RELEASE MAY 10, 2018
 FOR RELEASE MAY 10, 2018 FOR MEDIA OR OTHER INQUIRIES: Carroll Doherty, Director of Political Research Jocelyn Kiley, Associate Director, Research Olivia O Hea, Communications Assistant 202.419.4372 RECOMMENDED
NUMBERS, FACTS AND TRENDS SHAPING THE WORLD. FOR RELEASE September 12, 2014 FOR FURTHER INFORMATION ON THIS REPORT:
 NUMBERS, FACTS AND TRENDS SHAPING THE WORLD FOR RELEASE September 12, 2014 FOR FURTHER INFORMATION ON THIS REPORT: Carroll Doherty, Director of Political Research Jocelyn Kiley, Associate Director Rachel
MONTHLY MIGRATION TRENDS
 MONTHLY MIGRATION TRENDS MARCH 2010 DOL11131.10 MAR 10 MIGRATION TRENDS KEY INDICATORS REPORT: MARCH 2010 Purpose This report provides a brief summary of migration trends for the 2009/10 financial year
FOR RELEASE DECEMBER 14, 2017
 FOR RELEASE DECEMBER 14, 2017 FOR MEDIA OR OTHER INQUIRIES: Carroll Doherty, Director of Political Research Jocelyn Kiley, Associate Director, Research Olivia O Hea, Communications Assistant 202.419.4372
Internal migration and current use of modern contraception methods among currently married women age group between (15-49) years in India
 years in India") Internal migration and current use of modern contraception methods among currently married women age group between (15-49) years in India Pushpendra Mishra 1, Bhaskar Mishra 2 and Jay Shankar Dixit 3 Abstract:
Internal migration and current use of modern contraception methods among currently married women age group between (15-49) years in India Pushpendra Mishra 1, Bhaskar Mishra 2 and Jay Shankar Dixit 3 Abstract:
Attitudes towards foreign immigrants and returnees: new evidence for Uruguay
 GEDEMI Grupo de Estudios de Migración e Integración en Uruguay Attitudes towards foreign immigrants and returnees: new evidence for Uruguay International Forum on Migration Statistics 2018 15-16 January
Bowling Green State University. Working Paper Series
 http://www.bgsu.edu/organizations/cfdr/ Phone: (419) 372-7279 cfdr@bgnet.bgsu.edu Bowling Green State University Working Paper Series 2005-01 Foreign-Born Emigration: A New Approach and Estimates Based
RECOMMENDED CITATION: Pew Research Center, May, 2015, Negative Views of New Congress Cross Party Lines
 NUMBERS, FACTS AND TRENDS SHAPING THE WORLD FOR RELEASE MAY 21, 2015 FOR FURTHER INFORMATION ON THIS REPORT: Carroll Doherty, Director of Political Research Jocelyn Kiley, Associate Director, Research
The Economic and Social Outcomes of Children of Migrants in New Zealand
 The Economic and Social Outcomes of Children of Migrants in New Zealand Julie Woolf Statistics New Zealand Julie.Woolf@stats.govt.nz, phone (04 931 4781) Abstract This paper uses General Social Survey
RECOMMENDED CITATION: Pew Research Center, July, 2015, Iran Nuclear Agreement Meets With Public Skepticism
 NUMBERS, FACTS AND TRENDS SHAPING THE WORLD FOR RELEASE JULY 21, 2015 FOR FURTHER INFORMATION ON THIS REPORT: Carroll Doherty, Director of Political Research Jocelyn Kiley, Associate Director, Research
Pulling Open the Sticky Door
 Pulling Open the Sticky Door Social Mobility among Latinos in Nebraska Lissette Aliaga-Linares Social Demographer Office of Latino/Latin American Studies (OLLAS) University of Nebraska at Omaha Overview
Chapter 1: The Demographics of McLennan County
 Chapter 1: The Demographics of McLennan County General Population Since 2000, the Texas population has grown by more than 2.7 million residents (approximately 15%), bringing the total population of the
Dominicans in New York City
 Center for Latin American, Caribbean & Latino Studies Graduate Center City University of New York 365 Fifth Avenue Room 5419 New York, New York 10016 212-817-8438 clacls@gc.cuny.edu http://web.gc.cuny.edu/lastudies