the number of people living in highpoverty
|
|
|
- Laurence Waters
- 6 years ago
- Views:
Transcription

1 This report documents a dramatic decline in the 1990s in the number of high-poverty neighborhoods, their population, and the concentration of the poor in these Center on Urban and Metropolitan Policy Stunning Progress, Hidden Problems: The Dramatic Decline of Concentrated Poverty in the 1990s Paul A. Jargowsky 1 Findings A national analysis of high-poverty neighborhoods, and the concentration of poor individuals in those neighborhoods, in 1990 and 2000 indicates that: The number of people living in highpoverty neighborhoods where the poverty rate is 40 percent or higher declined by a dramatic 24 percent, or 2.5 million people, in the 1990s. This improvement marked a significant turnaround from the period, during which the population in high-poverty neighborhoods doubled. The steepest declines in highpoverty neighborhoods occurred in metropolitan areas in the Midwest and South. In Detroit, for instance, the number of people living in highpoverty neighborhoods dropped nearly 75 percent over the decade. Concentrated poverty the share of the poor living in high-poverty neighborhoods declined among all racial and ethnic groups, especially African Americans. The share of poor black individuals living in high-poverty neighborhoods declined from 30 percent in 1990 to 19 percent in The number of high-poverty neighborhoods declined in rural areas and central cities, but suburbs experienced almost no change. A number of older, inner-ring suburbs around major metropolitan areas actually experienced increases in poverty over the decade, though poverty rates there generally remain well below 40 percent. While the 1990s brought a landmark reversal of decades of increasingly concentrated poverty, the recent economic downturn and the weakening state of many older suburbs underscore that the trend may reverse once again without continued efforts to promote economic and residential opportunity for lowincome families. neighborhoods. I. Introduction For many years, the conditions of life in the poorest of poor neighborhoods have attracted the attention of filmmakers, journalists, and academic researchers. Each in their own way, these witnesses provide stark evidence about the devastating effects impoverished environments can have on those unfortunate enough to dwell within them, and about how these effects spill over into society at large. Poverty, in government statistics, is defined on the basis of a family s income relative to a fixed poverty line, a standard meant to reflect the cost of basic necessities. This narrow, May 2003 The Brookings Institution The Living Cities Census Series 1
2 bookkeeper s conception of poverty, however, fails to capture the multiple ways in which poverty acts to degrade the quality of life and limit the opportunities of those in its grip. One of the most important aspects of poverty not captured in the official statistics is its spatial dimension. In theory, poor families and their children could be widely dispersed throughout the population. In fact, they often tend to live near other poor people in neighborhoods with high poverty rates. The problem is particularly acute for the minority poor, who are segregated by both race and income. Why should we be concerned with the spatial organization of poverty? The concentration of poor families and children in high-poverty ghettos, barrios, and slums magnifies the problems faced by the poor. Concentrations of poor people lead to a concentration of the social ills that cause or are caused by poverty. Poor children in these neighborhoods not only lack basic necessities in their own homes, but also they must contend with a hostile environment that holds many temptations and few positive role models. Equally important, school districts and attendance zones are generally organized geographically, so that the residential concentration of the poor frequently results in low-performing schools. The concentration of poverty in central cities also may exacerbate the flight of middle-income and higher-income families to the suburbs, driving a wedge between social needs and the fiscal base required to address them. Between 1970 and 1990, the spatial concentration of the poor rose dramatically in many U.S. metropolitan areas. 2 The number of people living in high-poverty areas doubled; the chance that a poor black child resided in a high-poverty neighborhood increased from roughly one-in-four to one-in-three; and the physical size of the blighted sections of many central cities increased even more dramatically. By contrast, poverty measured at the family level did not increase during this period. Thus, there was a not a change in poverty per se, but a fundamental change in the spatial organization of poverty. The poor became more physically isolated from the social and economic mainstream of society. Two key factors contributed to the increasing concentration of poverty during the 1970s and 1980s. First, weaknesses in local or regional economies tended to disproportionately impact central cities. And secondly, exclusionary suburban development patterns contributed to increasing economic segregation. Policymakers have been anxious to know how the spatial organization of poverty may have changed in the 1990s. For most metropolitan areas and the country as a whole, the decade was a period of unparalleled economic growth. However, rapid suburban development continued and perhaps even accelerated during this period. The net effect of these trends on the concentration of poverty in the 1990s is therefore ambiguous. Only the decennial Census provides sufficient detail at the neighborhood level to examine the concentration of poverty. With the release of Census 2000, we are now able to assess the net impact of the economy, suburban development, and other forces on the spatial dimension of poverty over the last decade. Based on the trend of prior decades, one might have reasonably assumed that high-poverty neighborhoods were an unavoidable aspect of urban life and would continue to grow inexorably in size and population. The latest evidence contradicts this gloomy assessment. This report documents a dramatic decline in the 1990s in the number of high-poverty neighborhoods, their population, and the concentration of the poor in these neighborhoods. It also finds, however, several indications that poverty rose in the older suburbs of many metropolitan areas, even during a decade of economic expansion. The paper concludes with a discussion of the meaning of these trends, and the more recent decline in economic conditions, for poor families and communities in the current decade. II. Methodology This report examines the changes in the concentration of poverty in the 1990s using sample data (the long form ) from the 1990 and 2000 decennial censuses. For the purpose of this study, poverty is defined using official U.S. poverty guidelines. An individual is considered poor if he lives in a family whose income is less than a specific threshold that varies by family size and composition. While the official definition suffers from a number of known flaws and limitations, it is nevertheless widely accepted. 3 More importantly, the Census Bureau provides data on poverty status based on the long form of the census. In everyday usage, one can talk about a neighborhood in general terms without specifying exact boundaries. For tabulation purposes, however, every household in the nation must reside in one and only one geographically specific neighborhood. In this study, we use census tracts as proxies for neighborhoods. Census tracts are small, relatively homogeneous areas devised by the Census Bureau and local planning agencies, making use of bounding features such as major roads, railroad tracks, and rivers whenever possible. On average, they contain 4,000 persons, but in practice they vary widely in population. They also vary widely in geographic size due to differences in population density. When initially delineated, census tracts are meant to be relatively homogeneous with respect to social and economic characteristics and housing 2 May 2003 The Brookings Institution The Living Cities Census Series
3 The Federal Poverty Standard Developed by Molly Orshansky of the Social Security Administration in the 1960s for use in the War on Poverty, the federal poverty standard has been criticized from every conceivable angle. Despite its imperfections, it has endured as both an administrative tool to determine program eligibility and as a research tool. Persons are considered poor if they live in families whose total family income is less than a threshold meant to represent the cost of basic necessities. The thresholds vary by family size, and are adjusted each year for inflation. For example, in 2002, the poverty level was $15,260 for a typical family of three and $18,400 for a typical family of four. For more information, see Orshansky (1965), Fisher (1992), and the HHS poverty web site: aspe.hhs.gov/poverty/poverty.shtml. stock considerations. While they may not always capture the mental map of neighborhoods that city residents have, they do divide the nation along geographic lines. In less dense rural areas, one census tract may represent all or a substantial portion of a county. As populations grow and change, census tracts may be split, merged, or modified in other ways. In this research, contemporaneous tracts are used. That is, 1990 census tract boundaries are used to interpret 1990 data, and 2000 census tract boundaries are used for the 2000 figures. Using contemporaneous boundaries is important, because to do otherwise would invite a systematic bias into the analysis. For example, if the 2000 census tract grid were superimposed on 1970 data, average neighborhood population would be far smaller in 1970 than in Defining neighborhoods differently over time would systematically bias the results of any analysis that is sensitive to the size of the neighborhood units. 4 Combining the poverty dimension and the spatial dimension, a census tract is considered a high-poverty neighborhood if 40 percent or more of its residents are classified as poor using the federal poverty standard. While any specific threshold is inherently arbitrary, the 40 percent level has become the standard in the literature and has even been incorporated into federal data analysis and program rules. 5 In addition to tabulating the number of high-poverty neighborhoods and the number and characteristics of their residents, this paper examines the concentration of poverty defined as the percentage of the poor in some city or region that resides in highpoverty neighborhoods. These two concepts the incidence of high-poverty neighborhoods, and the concentration of poverty are not unrelated. In general, the greater the number of high-poverty neighborhoods in a city or metropolitan area is, the more likely poor residents of that place will be concentrated in those neighborhoods. However, each measure answers a different question. The former relates to the geographic footprint of very-low-income districts within a city or metropolitan area, which has important implications for economic development efforts and city planning. The latter captures the percentage of poor individuals who not only must cope with their own low incomes, but also with the economic and social effects of the poverty that surrounds them. The figures presented below include all census tracts in the United States, including both metropolitan and nonmetropolitan areas, except as noted. A metropolitan area usually consists of one or more population centers, or central cities, and the nearby counties that have close economic and commuting ties to the central cities. 6 The Census Bureau defines several types of metropolitan areas. There are stand-alone Metropolitan Statistical Areas (MSAs) and Primary Metropolitan Statistical Areas (PMSAs). PMSAs are part of larger constructions called Consolidated Metropolitan Statistical Areas (CMSAs). In this analysis, metropolitan areas are defined to include MSAs and PMSAs, not CMSAs. CMSAs are so large that they do not represent unified housing and labor markets, and so they are not considered in this analysis. 7 Like census tracts, the boundaries of metropolitan areas are adjusted over time. New counties are added, and existing counties are deleted or moved to different metropolitan areas if there are changes in their demographics, in the commuting patterns of their residents, or if the Census Bureau changes the rules for allocating counties to metropolitan areas. In this analysis, the definitions of metropolitan areas (including MSAs and PMSAs) in effect for Census 2000 are applied to both 1990 and 2000 data. In keeping with this, any changes in the figures for metropolitan areas shown below reflect actual changes in population demographics and not changes in boundaries or definitions. To examine variation among racial and ethnic groups, population is divided first by Hispanic origin, and then non-hispanics are further divided by racial group black, white, American Indian, Asian, and people who indicated more than one race (in 2000) or other race. Thus, a reference to whites refers to non-hispanic persons who indicated White or Caucasian as their sole racial group on the census form, a reference to blacks indicates non-hispanic persons who chose Black or African-American as their sole race, and so on. A final methodological note: A por- May 2003 The Brookings Institution The Living Cities Census Series 3
4 tion of this study analyzes levels and changes in high-poverty neighborhoods based on their location in central cities, suburbs, or rural areas. In practice, census tracts are subdivisions of counties, and thus often do not respect the municipal borders that define central cities. 8 In such cases, the tract s poverty status is classified by the poverty rate for the entire tract. That is, there is only one poverty rate for each whole census tract, no matter how many ways the tract is split over city or metropolitan boundaries. In this way, the count of persons residing in high-poverty areas is consistent, and systematic biases that would arise from the splitting of census tracts are avoided. III. Findings Figure 1. High-Poverty Neighborhoods and High-Poverty Neighborhood Population, U.S. Metropolitan Areas, High Poverty Neighborhoods 3,500 3,000 2,500 2,000 1,500 1, A. The number of people living in high-poverty neighborhoods where the poverty rate is 40 percent or higher declined by a dramatic 24 percent, or 2.5 million people, in the 1990s. The strong economic conditions that prevailed throughout most of the 1990s appear to have dramatically altered long-term trends in the spatial organization of poverty. The number of high-poverty neighborhoods census tracts with poverty rates of 40 percent or more declined by more than onefourth, from 3,417 in 1990 to 2,510 in 2000 nationwide. This is a stunning reversal of the trend between 1970 and 1990, as shown in Figure 1. 9 More importantly, the total number of residents of high-poverty areas declined by 24 percent, from 10.4 million in 1990 to 7.9 million in The sharp decline does not merely reflect declines in overall poverty. In fact, despite the strong economy, the number of persons classified as poor in the United States actually rose between 1990 and 2000, from 31.7 million to 33.9 million. The overall poverty rate did decline over the decade (from 13.1 percent to 12.4 percent), but by a much smaller degree than did the number of high-poverty neighborhoods. The implication is that there was a substantial change in the spatial organization of poverty during the 1990s. Poor neighborhoods, or at least the residents of high-poverty neighborhoods in 1990, benefited disproportionately from the boom. Virtually the whole spectrum of racial and ethnic groups benefited from the decline in the number of persons residing in high-poverty neighborhoods. The number of white residents of these areas declined by 29 percent (from 2.7 to 1.9 million), and the number of black residents declined by an even faster 36 percent (from 4.8 million to 3.1 million). Despite this decline, however, blacks remained the single largest racial/ethnic group living in high-poverty neighborhoods. The major exception to the pattern was Hispanics, whose numbers in high-poverty neighborhoods actually increased slightly, by 1.6 percent. At the same time, the number of Hispanics in the U.S. overall increased dramatically in the 1990s by ,000 8,000 7,000 6,000 5,000 4,000 3,000 2,000 1, High-Poverty Neighborhoods High-Poverty Neighborhood Population (thousands) Based on metropolitan areas as defined in year of census. High Poverty Neighborhood Population (1000s) percent, compared to only 3.4 percent growth for whites and 16.2 percent for blacks. In the context of this rapid population growth, fueled by the immigration of many low-income persons from Central and South America, as well as births to immigrant families, a growth rate of only 1.6 percent in the number of Hispanics in highpoverty neighborhoods could be viewed as a positive outcome. Given that different racial and ethnic groups were growing at different rates, the composition of high-poverty zones changed over the period. Figure 2 shows how the population in highpoverty neighborhoods changed between 1990 and 2000 by race and ethnicity. Hispanic and Asian shares increased, while those for whites and blacks declined. Most notably, Hispanics now comprise a larger share of high-poverty neighborhood residents than whites. B. The steepest declines in highpoverty neighborhoods occurred in metropolitan areas in the Midwest and South. 4 May 2003 The Brookings Institution The Living Cities Census Series
5 Figure 2. Racial/Ethnic Composition of High-Poverty U.S. Neighborhoods, Other 3% Asian 2% Other 4% Asian 4% Hispanic 22% White 24% Black 47% Black 39% White 26% Hispanic 29% Earlier research indicated that the expansion of high-poverty ghettos and barrios was particularly acute in the Midwest, especially in central city neighborhoods. Now, the Midwest has exhibited the most rapid turnaround during the boom of the 1990s. As shown in Figure 3, population changes in high-poverty areas varied dramatically across regions of the country. In general, places with the largest declines in the number of high-poverty neighborhoods also experienced the steepest drops in the number of people living in such areas. 10 The decline was largest in the Midwest, where the population of highpoverty neighborhoods was nearly halved over the decade. There was also a substantial decline in the South, which nonetheless remained home to the largest number of high-poverty neighborhoods in At the same time, the number of high-poverty neighborhoods in the Northeast remained virtually the same in 2000 as in 1990, and the West actually saw a substantial 26 percent increase in the population of these Population (thousands) Figure 3. Population of High-Poverty Neighborhoods by Region, ,000 4,500 4,000 3,500 3,000 2,500 2,000 1,500 1, ,839 1,823 Northeast (-0.3%) 2,526 1,374 Midwest (-45.6%) neighborhoods, albeit from a small base. In 1990, the population of highpoverty neighborhoods in the West was half that in the Midwest; by 2000, nearly 300,000 more people lived in 4,712 3,077 South (-34.7%) ,328 1,672 West (+25.9%) high-poverty neighborhoods in the West than in the Midwest. This increase is explained almost entirely by an increase in the size and population of Hispanic barrios; the number of May 2003 The Brookings Institution The Living Cities Census Series 5


6 non-hispanic persons in high-poverty areas in the West declined slightly. While only two out of four regions showed significant declines in the aggregate, the view at the state level is more positive. Figure 4 maps the percentage change in high-poverty neighborhood population by state. Fully 40 states had declines, with an average decline of 78,000 persons residing in high-poverty neighborhoods. Ten states, as well as the District of Columbia, had increases averaging 61,000 persons. Trends in the West as a whole are clearly driven by California, which had an 87 percent increase in the population of high-poverty neighborhoods. Table 1 shows the 15 metro areas with the largest decreases in highpoverty-area population. The regional flavor is readily apparent. Without exception, the metropolitan areas listed are located in the Midwest or in the South. Detroit s decline in the population of high-poverty neighborhoods was substantially larger than in any other metropolitan area. Chicago, however, experienced a comparable decrease in the number of highpoverty census tracts. All told, 200 out of 331 metropolitan areas (MSAs and PMSAs) saw declines in the number of people living in high-poverty neighborhoods (Appendix A shows relevant data for all U.S. metropolitan areas, and non-metropolitan areas by state). In most metropolitan areas, highpoverty neighborhoods tend to be clustered in one or two main agglomerations located in the central city. In this way, the United States differs markedly from most other nations of the world, in which poor neighborhoods are typically located on the periphery of urban areas. As these zones of concentrated poverty increased in size between 1970 and 1990, they contributed to a general process of population deconcentration that generated donut cities depopulating and impoverished urban cores surrounded by prosperous and growing Figure 4. Percentage Change in Population of High-Poverty Neighborhoods by State, suburbs. But then came the 1990s and a boon for central cities. Just as central cities bore the brunt of the fiscal, social, and economic burden of concentrating poverty in prior decades, they became prime beneficiaries of its Change, Table 1. Top 15 Metropolitan Areas by Decline in Population of High-Poverty Neighborhoods, Decline in % Decline in Decline in Metropolitan Area Population Population Census Tracts Detroit, MI 313, Chicago, IL 177, San Antonio, TX 107, Houston, TX 77, Milwaukee-Waukesha, WI 63, Memphis, TN-AR-MS 61, New Orleans, LA 57, Brownsville-Harlingen-San Benito, TX 50, Columbus, OH 48, El Paso, TX 44, Dallas, TX 41, St. Louis, MO-IL 38, Lafayette, LA 33, Minneapolis-St. Paul, MN-WI 32, Flint, MI 31, reduction in the 1990s. A case in point is the Detroit, MI metro area. Figure 5 shows the highpoverty zones in Detroit over three decades. From 1970 to 1990, there is a rapid growth in the number of neigh- 6 May 2003 The Brookings Institution The Living Cities Census Series


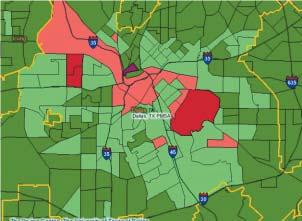
7 Figure 5. High-Poverty Neighborhoods in Detroit, Figure 6. High-Poverty Neighborhoods in Dallas, May 2003 The Brookings Institution The Living Cities Census Series 7


8 Figure 7. High-Poverty Neighborhoods in Los Angeles, Mapping Poor Neighborhoods The maps shown in these figures were produced using an interactive website. By visiting the web site, users can easily produce maps such as these for any metropolitan area in the United States. The address for the web site is Construction of the web site was funded by the Brookings Institution Center on Urban and Metropolitan Policy and the Bruton Center for Development Studies at the University of Texas at Dallas. Comments and suggestions about the web site are welcome. 11 borhoods with poverty rates of 40 percent or more. By 1990, nearly half the land area of the City of Detroit, the boundary of which is shown in yellow, had become a high-poverty zone. This trend is reversed between 1990 and The change is so dramatic, it strains credulity. To some extent, the vivid map colors may overstate the change, since many of Detroit s census tracts had all but emptied out by Thus, a movement or change in poverty status of just a few families could serve to change the color of an entire census tract on the map. Even so, the Detroit metro area underwent an astonishing 74.4 percent reduction in the number of people residing in high-poverty zones between 1990 and The growth of high-poverty zones between 1970 and 1990 and their subsequent declines were by no means limited to the Midwest. Figure 6 shows the trend in the Dallas metropolitan area over the last three decades. The poverty areas of Dallas experienced their greatest expansion between 1980 and 1990, after the collapse of the OPEC oil cartel led to sharply lower oil prices. At the same time, Dallas was also experiencing rapid suburban development. Plano, TX, a Boomburb just north of Dallas, was for years the fastest growing city in the nation. 12 After 1990, however, there was substantial redevelopment of the downtown area, including condominium and apartment developments just north of downtown and along Interstate 45. The overall decline in the population of Dallas s high-poverty areas was 45 percent between 1990 and The regional picture is quite different when we examine the metropolitan areas with the largest increases in high-poverty area population. Seven of the 15 metropolitan areas in Table 2 8 May 2003 The Brookings Institution The Living Cities Census Series
9 Table 2. Top 15 Metropolitan Areas by Increase in Population of High-Poverty Neighborhoods, Increase in % Increase Increase in Metropolitan Area Population in Population Census Tracts Los Angeles-Long Beach, CA 292, Fresno, CA 60, Riverside-San Bernardino, CA 58, Washington, DC-MD-VA-WV 56, Bakersfield, CA 42, San Diego, CA 33, McAllen-Edinburg-Mission, TX 28, (1) Providence-Fall River-Warwick, RI-MA 22, Chico-Paradise, CA 16, Middlesex-Somerset-Hunterdon, NJ 14,020 n/a* 3 Wilmington-Newark, DE-MD 12, Bryan-College Station, TX 11, Visalia-Tulare-Porterville, CA 11, Rochester, NY 9, Monmouth-Ocean, NJ 9, (1) *Middlesex-Somerset-Hunterdon, NJ, had no census tracts with poverty rates of 40 percent or higher in are located in one state California and six of those lie in either southern California or the state s agricultural hub, the San Joaquin Valley. Other metro areas include a handful in the Northeast (Providence, Wilmington, Rochester, and two suburban New Jersey metros) and two smaller metros in Texas. Altogether, a total of 91 out of 331 metropolitan areas had at least a nominal increase in persons living in high-poverty neighborhoods. It is worth noting that the size of the population increase in highpoverty zones falls off rapidly as we read down the list. The fifteenth metropolitan area, Monmouth-Ocean, NJ, had a 9,000-person increase in its high-poverty neighborhood population, whereas the fifteenth metropolitan area in Table 1 (Flint, MI) had a 32,000-person decline in its povertyarea population. Figure 7 illustrates the process in Los Angeles. The expansion of high-poverty neighborhoods, indicated in red, is quite apparent. Also apparent is a considerable increase in the number of neighborhoods with moderate poverty rates (between 20 and 40 percent). Los Angeles is notable for three factors that may explain its divergence from the national trend. First, the city experienced a deadly and destructive riot after the Rodney King verdict in 1992, and further heightening of racial tension due to the trial of O.J. Simpson in The riot and its aftermath almost certainly accelerated middle-class flight from the central city area, and the trial emphasized racial divisions in the region. Second, the Los Angeles region experienced tremendous immigration from Mexico and other Central and South American countries. 13 Riverside/San Bernadino, Fresno, and (to a lesser extent) San Diego also experienced a significant increase in low-income Hispanic population; the population of high-poverty neighborhoods increased in these areas as well. Third, the recession of the early 1990s was particularly severe in Southern California, and the economic recovery there was not as rapid as in other parts of California (such as the San Francisco/Silicon Valley area) that benefited from the Internet boom. The other major exception to the trend was the Washington, D.C. metro area. The number of high-poverty neighborhoods in the nation s capital more than doubled over the decade. The major factor at work here was likely the devastating fiscal crisis that plagued the District during the early and mid-1990s. The crisis undermined public confidence in the governance of the District and led to serious cutbacks in public services, including public safety. For this and other reasons, there was a rapid out-migration of moderate- and middle-income black families, particularly into suburban Maryland counties to the east of the central city. The poor were left behind in economically isolated neighborhoods with increasing poverty rates. The late 1990s real estate boom in Washington seems not to have improved conditions in these neighborhoods. Of course, these metros and others in Table 2 represent the exceptions to an overall decline in the number of high-poverty neighborhoods, and population of high-poverty neighborhoods, in the 1990s. Most areas of the U.S. saw improvements over the decade that were much greater in magnitude than the deterioration that occurred in a minority of metro areas. C. Concentrated poverty the share of the poor living in high-poverty neighborhoods declined among all racial and ethnic groups, especially African Americans. In the 1990s, consonant with the decline in high-poverty neighborhoods, the concentration of poverty defined as the proportion of the poor in a given area that resides in highpoverty zones dropped across most of the nation. The number of poor persons living in high-poverty areas declined 27 percent, from 4.8 million to 3.5 million. In 1990, the share of poor individuals nationwide who lived May 2003 The Brookings Institution The Living Cities Census Series 9
10 in high-poverty areas (the concentrated poverty rate) was 15 percent. By 2000, that figure had declined to 10 percent. These declines are both striking and gratifying. Between 1970 and 1990, the concentration of poverty grew steadily worse, especially for blacks. About one-fourth of the black poor lived in high-poverty areas in 1970; by 1990, the proportion had increased to one-third. The rate was even higher for black children, especially those in single-parent families. The economic and social isolation of these families and children prompted great concern among researchers investigating the opportunities and constraints facing low-income families in economically impoverished neighborhoods. 14 Some have argued that poor persons may benefit from having poor neighbors. For example, they may share coping strategies and draw on geographically-based support networks. Yet most researchers, and most of the general public, assume that the benefits of poor persons living in highpoverty neighborhoods are outweighed by the extra hardships that such neighborhoods impose, including their deleterious effects on child development and the ability of poor adults to achieve self-sufficiency. For those reasons, it is good news indeed that all racial and ethnic groups shared in the deconcentration of poverty of the 1990s, as shown in Figure 8. The decline was most significant for poor blacks; the percentage living in high-poverty neighborhoods declined from 30.4 percent in 1990 to 18.6 percent in American Indians experienced a similarly large decrease. Yet despite these substantial declines, blacks and American Indians still suffer the highest concentrated poverty rates, the former in highly segregated urban ghettos and the latter in remote rural reservations. The concentration of poverty among non-hispanic whites, low to start with, dropped by roughly one-sixth. The chances that a poor Hispanic lives in a high-poverty Percentage of Poor in High-Poverty Neighborhoods Figure 8. Concentration of U.S. Poor by Race/Ethnicity, White Black neighborhood dropped from more than one in five (21.2 percent) in 1990 to less than one in seven (13.8 percent) in The declines in concentrated poverty were not driven by a few large or unrepresentative metropolitan areas. Indeed, substantial declines were the national norm. Of the 331 metropolitan areas in the United States in 2000, 227 (69 percent) saw the concentration of poor blacks decrease between 1990 and 2000; another 49 (15 percent) had no change; and only 55 (17 percent) had increases (Appendix A). The story was similar for non-metropolitan areas: The concentration of poor blacks in rural areas declined in 29 of 49 states, and remained the same in another 11 states. 16 The numbers were similar, if not quite as positive, for Hispanics. More than half of all metropolitan areas had decreases in concentrated Hispanic poverty, 87 (26 percent) had increases, and the remainder experienced no change. The deconcentration of poverty for Hispanic American Indian Percentage Point Change Asian -2.9 racial and ethnic minorities spread widely across the nation s largest metropolitan areas. Table 3 reports concentrated poverty rates among blacks and Hispanics in the 20 largest metros, sorted by change in the concentrated black poverty rate between 1990 and Most of these areas experienced declines in the concentration of poverty for both groups. The largest declines for blacks were in Detroit (37.5 percentage points), Minneapolis-St. Paul (20.3) and Chicago (18.8). Four metropolitan areas had double-digit percentage point declines in the concentrated poverty rate for Hispanics: Detroit (29.1 percentage points), Minneapolis-St. Paul (12.3), Philadelphia (12.1), and Houston (10.3). To be sure, the percentage-point declines were generally largest in areas that had high rates of concentrated poverty to begin with; while the share of blacks living in high-poverty neighborhoods in the Seattle metro area was halved in the 1990s, this represented a decline of only 3.3 percentage points. Still, the extent of the 10 May 2003 The Brookings Institution The Living Cities Census Series
11 decline in places like Detroit and Minneapolis-St. Paul is remarkable compared to an area like New York, which despite modest declines still has very high concentrated poverty rates for both groups. Consistent with the data on the population of high-poverty areas, two areas of the country cut against the national trend. In Los Angeles-Long Beach and Riverside-San Bernardino, concentrated poverty increased among both the black and Hispanic poor; in San Diego, Hispanic concentrated poverty rose. In Washington, D.C., poor blacks became more spatially concentrated, but poor Hispanics did not. One additional note on Western high-poverty neighborhoods: In that region, the increase in high-poverty neighborhoods owed almost entirely to an increase in the number of barrios predominantly Hispanic high-poverty communities. While increasing concentrated poverty among Hispanics in southern California is certainly cause for concern, researchers have expended considerably greater effort studying the deleterious effects that high-poverty neighborhoods in the Midwest and Northeast have on the life chances of their residents, who are predominantly black. With their substantial immigrant populations, Western inner-city barrios could represent more of a gateway to residential and economic mobility than inner-city ghettos in other areas of the country. Regardless, the rise in concentrated Hispanic poverty in California during the 1990s highlights a need to better understand how the opportunity structure in these communities may differ from that in other types of highpoverty neighborhoods. 17 D. The number of high-poverty neighborhoods declined in rural areas and central cities, but suburbs experienced almost no change. So far, this paper has considered statistics on changes in high-poverty neighborhoods and the concentration of poverty at the national and metropolitan levels. These statistics obscure an important aspect of the trend in the 1990s that the maps help illuminate: Central cities, rather than suburbs, reaped the benefits of the decline. Not even the maps, however, reveal what transpired in rural America. This section examines changes within metropolitan areas, and outside them, in Table 3. Concentration of Black and Hispanic Poverty in the 20 Largest Metro Areas, Black Hispanic Metro Area Change Change Detroit, MI Minneapolis-St. Paul, MN-WI Chicago, IL St. Louis, MO-IL Baltimore, MD Dallas, TX Tampa-St. Petersburg-Clearwater, FL Houston, TX Phoenix-Mesa, AZ New York, NY Philadelphia, PA-NJ Boston, MA-NH Atlanta, GA Seattle-Bellevue-Everett, WA San Diego, CA Nassau-Suffolk, NY Orange County, CA Los Angeles-Long Beach, CA Riverside-San Bernardino, CA Washington, DC-MD-VA-WV Figures represent percentage of metro-wide poor individuals in each racial/ethnic group living in census tracts with poverty rates of 40 percent or higher. Increases shown in bold. May 2003 The Brookings Institution The Living Cities Census Series 11
12 Figure 9. Population of High-Poverty Neighborhoods by Location, Total U.S (-24%) Central City (-21%) Suburbs (-4%) Non- Metropolitan (-47%) 1,089 1, , ,000 2,000 3,000 4,000 5,000 6,000 7,000 8,000 9,000 10,000 11,000 Population (thousands) neighborhood poverty over the decade. All neighborhoods census tracts nationwide can be classified as lying within the central cities of metropolitan areas, the suburbs defined as the balance of metropolitan areas or non-metropolitan areas, which consist of rural areas and cities and towns too small or detached to be considered part of a metropolitan area. As shown in Figure 9, the decline in highpoverty area population was actually largest in non-metropolitan areas, where the decline was nearly 50 percent. Central city areas, as indicated by the maps, also experienced a large decline of 21 percent. It was the suburbs that had the slowest overall decline in poverty area residents only 4.4 percent. As a result of these differing declines, by 2000 suburban America was actually home to more neighborhoods of concentrated poverty than rural America. While the suburbs have more than twice the number of residents as nonmetropolitan areas, this finding is nonetheless striking given that the overall poverty rate outside metropolitan areas (14.6 percent) was considerably higher in 2000 than the poverty rate in suburbs (8.4 percent). Moreover, a careful inspection of trends in the geography of suburban poverty over the 1990s reveals some disturbing trends. Not only did the number of neighborhoods of high poverty decline slowly in the suburbs. Also, poverty rates actually increased along the outer edges of central cities and in the inner-ring suburbs of many metropolitan areas, including those that saw dramatic declines in poverty concentration. In short, poverty trends in these areas moved in the opposite direction from those in inner-city neighborhoods and booming suburbs at the metropolitan fringe. Several metropolitan areas illustrate the case. Figure 10 shows the change in the poverty rate by census tract between 1990 and 2000 for four Detroit, Chicago, Cleveland, and Dallas. Neighborhoods shaded in green had decreases in their poverty rates, while red indicates census tracts with increases in their poverty rates. In Detroit, central city tracts experienced dramatic decreases in their poverty rates in the 1990s, dropping many of them below the 40-percent threshold. However, a ring of neighborhoods just beyond the border of the central city located in the area s older suburbs saw increases in their poverty rates. Many of these neighborhoods still have poverty rates of below 20 percent, and so cannot be considered high-poverty. Yet it is notable that in a decade of widespread economic growth, the poverty rates in these older suburban neighborhoods were rising. The maps of Chicago, Cleveland, and Dallas also exhibit the distinctive bull s-eye pattern of improvements in the central city and increasing poverty in the inner ring of suburbs. This pattern is repeated in metro areas across the nation. The economic decline of inner-ring suburbs, already evident in earlier 5,988 7,560 7,946 10, decades, continued in the 1990s even as conditions were improving dramatically in most central cities. 18 The fact that inner-ring suburbs declined during this period is really quite astonishing. Census 2000 was conducted in April of 2000, coinciding with the peak of a long economic boom. Unemployment rates nationwide were 4 percent, and lower in some of these metropolitan areas. The economy, in all likelihood, will never be stronger than it was during this period, at least not for any extended period of time. A vigorous debate is underway concerning the role of suburban development in central city and older suburban decline and the concentration of poverty. There is, as yet, no consensus that rapid suburban development, characterized as sprawl by its opponents, exacerbates economic decline in the core. In fact, some argue the contrary, and contend that these development patterns are a consequence of the economic and social disorder of the inner cities. These questions will continue to engender 12 May 2003 The Brookings Institution The Living Cities Census Series


13 Figure 10. Poverty Rate Changes in Selected Metro Areas, Detroit Chicago Cleveland Dallas vigorous debate in the years ahead. However, it is clear from the data and maps presented here that there is reason to be concerned about the prospects for inner-ring suburbs. If poverty in these areas rose during the strongest economy we can reasonably expect to enjoy, then they may well have a bleak future and develop many of the same fiscal and social concerns that plagued central cities in earlier periods. IV. Conclusion The concentration of poverty is an important public policy concern because it has dynamic effects on income distribution, because it undermines the political and social fabric of the nation s major metropolitan areas, and most importantly because it restricts opportunity for some. Fortunately, the excellent economy of the 1990s reversed several decades of increasing concentration of poverty and central city decline. With few exceptions, metropolitan and rural areas across the U.S. saw a drop in concentrated poverty for all racial and ethnic groups. The extent to which some of these gains have already been erased by the downturn since the date of the Census is not known. However, even at the height of the boom, troubling signs could be found that the pattern of metropolitan development, with rapid growth at the periphery, might be undermining other parts of metropolitan areas, particularly the inner ring of suburbs. This quiet erosion, largely unnoticed during the good times of the 1990s, leaves metropolitan areas in a weaker state and reduces their ability to cope with the less robust economic conditions that prevail today. While the reductions in concentration of poverty in the 1990s are certainly welcome news, the long-run picture is far from sanguine. The snapshot of progress as of April 2000 may be as misleading as the level of the NASDAQ on that date. If the inner-ring suburbs provide any indication, then the underlying development pattern that leads to greater neighborhood stratification was still at work in the 1990s, and is likely to have continued in the considerably weaker economic climate of the last three years. If so, greater concentration of poverty and more geographically stratified metropolitan areas could exacerbate social problems in a host of areas, from public safety to education to transportation. We should celebrate the gains made during the 1990s, to the extent that they haven t already erased, but we should not ignore the warning signs that our society is still vulnerable to increasing concentration of poverty. May 2003 The Brookings Institution The Living Cities Census Series 13
14 Appendix A. Population and Number of Neighborhoods of High Poverty, and Concentrated Poverty Rates, U.S. Metropolitan and Non-Metropolitan Areas, Total Area High-Poverty Population in Concentrated Concentrated Concentrated Population Census Tracts High-Poverty Census Tracts Poverty Rate: Total Poverty Rate: Blacks Poverty Rate: Hispanics MSA/PMSA/Balance of State Name Change Change Change Change Change Abilene, TX 126, , Akron, OH 694, ,632 22,268-26, Albany, GA 120, ,725 18,700-5, Albany-Schenectady-Troy, NY 875, ,654 13,033 4, Albuquerque, NM 712, ,523 10,999-1, Alexandria, LA 126, ,204 11,854-3, Allentown-Bethlehem-Easton, PA 637, ,641 14,645 5, Altoona, PA 129, ,702 1, Amarillo, TX 217, ,093 3,168-4, Anchorage, AK 260, Ann Arbor, MI 578, ,182 28,937-7, Anniston, AL 112, ,498 5,076-1, Appleton-Oshkosh-Neenah, WI 358, ,348 5,614-1, Asheville, NC 225, ,127 4,507 1, Athens, GA 153, ,651 31,425 7, Atlanta, GA 4,112, ,053 92, Atlantic-Cape May, NJ 354, ,282 9, Auburn-Opelika, AL 115, ,357 23,876 1, Augusta-Aiken, GA-SC 477, ,132 18,246-3, Austin-San Marcos, TX 1,249, ,423 45, Bakersfield, CA 661, ,333 64,955 42, Baltimore, MD 2,552, ,648 75,643-31, Bangor, ME 90, ,132 4,241 3, Barnstable-Yarmouth, MA 162, Baton Rouge, LA 602, ,375 42,401-17, Beaumont-Port Arthur, TX 385, ,311 7,858-15, Bellingham, WA 166, ,941 6, Benton Harbor, MI 162, ,716 9,690-6, Bergen-Passaic, NJ 1,373, ,483 11,755 6, Billings, MT 129, ,088 3, Biloxi-Gulfport-Pascagoula, MS 363, , , Binghamton, NY 252, ,366 5,446 1, Birmingham, AL 921, ,871 33,631-21, Bismarck, ND 94, Bloomington, IN 120, ,622 32,689 9, Bloomington-Normal, IL 150, ,689 10, Boise City, ID 432, Boston, MA-NH 3,406, ,757 32, Boulder-Longmont, CO 291, ,530 6,806 1, Brazoria, TX 241, Bremerton, WA 231, Bridgeport, CT 459, ,086 6, Brockton, MA 255, ,385 2, Brownsville-Harlingen-San Benito, TX 335, ,312 85,753-50, Bryan-College Station, TX 152, ,934 51,680 11, Buffalo-Niagara Falls, NY 1,170, ,230 51,303-20, Burlington, VT 169, ,935 3, Canton-Massillon, OH 406, ,873 4,285-5, Casper, WY 66, Cedar Rapids, IA 191, , , Champaign-Urbana, IL 179, ,536 22,482-2, May 2003 The Brookings Institution The Living Cities Census Series
Cities, Suburbs, Neighborhoods, and Schools: How We Abandon Our Children
 Cities, Suburbs, Neighborhoods, and Schools: How We Abandon Our Children Paul A. Jargowsky, Director Center for Urban Research and Education May 2, 2014 Dimensions of Poverty First and foremost poverty
Racial and Ethnic Separation in the Neighborhoods: Progress at a Standstill
 Sponsored by American Communities Project Russell Sage Foundation us2010 discover america in a new century Racial and Ethnic Separation in the Neighborhoods: Progress at a Standstill John R. Logan (Brown
The Brookings Institution
 The Brookings Institution Center on Urban and Metropolitan Policy Bruce Katz, Director Census 2000: Key Trends & Implications for Cities Macalester College September 8, 2003 Overview I. II. III. About
The New Metropolitan Geography of U.S. Immigration
 The Brookings Institution Metropolitan Policy Program Audrey Singer, Immigration Fellow The New Metropolitan Geography of U.S. Immigration Mayors Institute on City Design Rethinking Neighborhoods for Immigrants
By 1970 immigrants from the Americas, Africa, and Asia far outnumbered those from Europe. CANADIAN UNITED STATES CUBAN MEXICAN
 In Search of the American Dream After World War II, millions of immigrants and citizens sought better lives in the United States. More and more immigrants came from Latin America and Asia. Between 940
Twenty-first Century Gateways: Immigrant Incorporation in Suburban America
 Audrey Singer, Immigration Fellow Twenty-first Century Gateways: Immigrant Incorporation in Suburban America Annual meeting of the Association of American Geographers April 18, 2007 New metropolitan geography
The New Latinos: Who They Are, Where They Are
 September 10, 2001 The New Latinos: Who They Are, Where They Are John R. Logan, Director Lewis Mumford Center for Comparative Urban and Regional Research University at Albany As the Hispanic population
Immigrant Incorporation and Local Responses
 Audrey Singer Senior Fellow Immigrant Incorporation and Local Responses American Sociological Association San Francisco, CA August 9, 2009 Questions --- Exploration How do we evaluate recent state and
The Youth Vote in 2008 By Emily Hoban Kirby and Kei Kawashima-Ginsberg 1 Updated August 17, 2009
 The Youth Vote in 2008 By Emily Hoban Kirby and Kei Kawashima-Ginsberg 1 Updated August 17, 2009 Estimates from the Census Current Population Survey November Supplement suggest that the voter turnout rate
The Brookings Institution
 The Brookings Institution Metropolitan Policy Program Bruce Katz, Director Understanding Regional Dynamics: Implications for Social and Economic Justice Understanding Regional Dynamics: Implications for
The Brookings Institution Metropolitan Policy Program Robert Puentes, Fellow
 The Brookings Institution Metropolitan Policy Program Robert Puentes, Fellow A Review of New Urban Demographics and Impacts on Housing National Multi Housing Council Research Forum March 26, 2007 St. Louis,
The Brookings Institution Metropolitan Policy Program Robert Puentes, Fellow
 The Brookings Institution Metropolitan Policy Program Robert Puentes, Fellow Good News and Bad News: Westchester County and America s First Suburbs Not-For-Profit Leadership Summit IV Rye, NY May 15, 2006
The Brookings Institution Metropolitan Policy Program Alan Berube, Fellow
 The Brookings Institution Metropolitan Policy Program Alan Berube, Fellow Confronting Concentrated Poverty in Fresno Fresno Works for Better Health September 6, 2006 Confronting Concentrated Poverty in
Dynamic Diversity: Projected Changes in U.S. Race and Ethnic Composition 1995 to December 1999
 Dynamic Diversity: Projected Changes in U.S. Race and Ethnic Composition 1995 to 2050 December 1999 DYNAMIC DIVERSITY: PROJECTED CHANGES IN U.S. RACE AND ETHNIC COMPOSITION 1995 TO 2050 The Minority Business
Boomers and Seniors in the Suburbs:
 Center on Urban and Metropolitan Policy Boomers and Seniors in the Suburbs: Aging Patterns in Census 2000 The maturing of the suburban population ushers in a new era for suburbia, and presents both opportunities
ECONOMIC COMMENTARY. The Concentration of Poverty within Metropolitan Areas. Dionissi Aliprantis, Kyle Fee, and Nelson Oliver
 ECONOMIC COMMENTARY Number 213-1 January 31, 213 The Concentration of Poverty within Metropolitan Areas Dionissi Aliprantis, Kyle Fee, and Nelson Oliver Not only has poverty recently increased in the United
Overview of Boston s Population. Boston Redevelopment Authority Research Division Alvaro Lima, Director of Research September
 Overview of Boston s Population Boston Redevelopment Authority Research Division Alvaro Lima, Director of Research September - 2011 Historic Trends Boston s Population Boston reached its population peak
IV. Residential Segregation 1
 IV. Residential Segregation 1 Any thorough study of impediments to fair housing choice must include an analysis of where different types of people live. While the description of past and present patterns
destination Philadelphia Tracking the City's Migration Trends executive summary
 destination Philadelphia October 6, 2010 executive summary An analysis of migration data from the Internal Revenue Service shows that the number of people moving into the city of Philadelphia has increased
African Immigrants in Metropolitan Washington A Demographic Overview
 The Brookings Institution Center on Urban and Metropolitan Policy African Immigrants in Metropolitan Washington A Demographic Overview Jill H.Wilson African Immigrants and Refugees Foundation Conference
Online Appendix for The Contribution of National Income Inequality to Regional Economic Divergence
 Online Appendix for The Contribution of National Income Inequality to Regional Economic Divergence APPENDIX 1: Trends in Regional Divergence Measured Using BEA Data on Commuting Zone Per Capita Personal
The Potomac Conference
 The Potomac Conference Alice M. Rivlin Director, Brookings February 2006 An Overview of the Washington DC Region Title Slide This conference is focused on the future. Everyone here is eager to develop
PRESENT TRENDS IN POPULATION DISTRIBUTION
 PRESENT TRENDS IN POPULATION DISTRIBUTION Conrad Taeuber Associate Director, Bureau of the Census U.S. Department of Commerce Our population has recently crossed the 200 million mark, and we are currently
16% Share of population that is foreign born, 100 largest metro areas, 2008
 Audrey Singer III. IMMIGRATION By the numbers 16% Share of population that is foreign born, 100 largest metro areas, 2008 1.13 Ratio of immigrants with college degrees to those without high school diplomas,
Population Change and Crime Change
 University of Nebraska at Omaha DigitalCommons@UNO Publications Archives, 1963-2000 Center for Public Affairs Research 5-1982 Population Change and Crime Change Deborah Caulfield University of Nebraska
Independent and Third-Party Municipal Candidates. City Council Election Reform Task Force April 8, :00 p.m.
 Independent and Third-Party Municipal Candidates City Council Election Reform Task Force April 8, 2010 2:00 p.m. 28 of the 32 cities surveyed, or 88%, have non-partisan elections, so they do not have special
WYOMING POPULATION DECLINED SLIGHTLY
 FOR IMMEDIATE RELEASE Wednesday, December 19, 2018 Contact: Dr. Wenlin Liu, Chief Economist WYOMING POPULATION DECLINED SLIGHTLY CHEYENNE -- Wyoming s total resident population contracted to 577,737 in
Children of Immigrants
 L O W - I N C O M E W O R K I N G F A M I L I E S I N I T I A T I V E Children of Immigrants 2013 State Trends Update Tyler Woods, Devlin Hanson, Shane Saxton, and Margaret Simms February 2016 This brief
SECTION TWO: REGIONAL POVERTY TRENDS
 SECTION TWO: REGIONAL POVERTY TRENDS Metropolitan Council Choice, Place and Opportunity: An Equity Assessment of the Twin Cities Region Section 2 The changing face of poverty Ebbs and flows in the performance
14 Pathways Summer 2014
 14 Pathways Summer 2014 Pathways Summer 2014 15 Does Immigration Hurt the Poor? By Giovanni Peri The United States has a famously high poverty rate. In recent years, the Great Recession and the slow recovery
The Brookings Institution Metropolitan Policy Program Robert Puentes, Fellow
 The Brookings Institution Metropolitan Policy Program Robert Puentes, Fellow The Changing Shape of the City Rail-Volution Chicago, IL November 7, 2006 The Changing Shape of the City I What is the context
The Brookings Institution Metropolitan Policy Program Bruce Katz, Director
 The Brookings Institution Metropolitan Policy Program Bruce Katz, Director State of the World s Cities: The American Experience Delivering Sustainable Communities Summit February 1st, 2005 State of the
Minority Suburbanization and Racial Change
 University of Minnesota Law School Scholarship Repository Studies Institute on Metropolitan Opportunity 2006 Minority Suburbanization and Racial Change Institute on Metropolitan Opportunity University
Are Republicans Sprawlers and Democrats New Urbanists? Comparing 83 Sprawling Regions with the 2004 Presidential Vote
 Are Republicans Sprawlers and Democrats New Urbanists? Comparing 83 Sprawling Regions with the 2004 Presidential Vote Stephen L. Sperry Associate Professor Clemson University College of Architecture, Arts
COMPARATIVE ANALYSIS OF METROPOLITAN CONTEXTS: ANNIE E. CASEY FOUNDATION CITIES
 ANNIE E. CASEY FOUNDATION MAKING CONNECTIONS INITIATIVE COMPARATIVE ANALYSIS OF METROPOLITAN CONTEXTS: ANNIE E. CASEY FOUNDATION CITIES G. Thomas Kingsley and Kathryn L.S. Pettit December 3 THE URBAN INSTITUTE
a rising tide? The changing demographics on our ballots
 a rising tide? The changing demographics on our ballots OCTOBER 2018 Against the backdrop of unprecedented political turmoil, we calculated the real state of the union. For more than half a decade, we
3Demographic Drivers. The State of the Nation s Housing 2007
 3Demographic Drivers The demographic underpinnings of long-run housing demand remain solid. Net household growth should climb from an average 1.26 million annual pace in 1995 25 to 1.46 million in 25 215.
Epicenter Cities and International Education 17th AIEC Melbourne, Victoria Australia
 Epicenter Cities and International Education 17th AIEC Melbourne, Victoria Australia Thursday, 23 October 2003 Todd Davis, Ph.D. Senior Scholar Institute of International Education The idea of the global
Silence of the Innocents: Illegal Immigrants Underreporting of Crime and their Victimization
 Silence of the Innocents: Illegal Immigrants Underreporting of Crime and their Victimization Stefano Comino, 1 Giovanni Mastrobuoni, 2 Antonio Nicolò 3 1 University of Udine, 2 University of Essex, 3 University
Commuting in America 2013
 Commuting in America 2013 The National Report on Commuting Patterns and Trends Brief 4. Population and Worker Dynamics September 2013 About the AASHTO Census Transportation Planning Products Program Established
The Brookings Institution Metropolitan Policy Program Robert Puentes, Fellow
 The Brookings Institution Metropolitan Policy Program Robert Puentes, Fellow Caution: Challenges Ahead A Review of New Urban Demographics and Impacts on Transportation Eno Foundation Forum on the Future
Online Appendix. Table A1. Guidelines Sentencing Chart. Notes: Recommended sentence lengths in months.
 Online Appendix Table A1. Guidelines Sentencing Chart Notes: Recommended sentence lengths in months. Table A2. Selection into Sentencing Stage (1) (2) (3) Guilty Plea Dropped Charge Deferred Prosecution
A Decade of Mixed Blessings: Urban and Suburban Poverty in Census 2000 The slight Findings overall poverty
 Center on Urban & Metropolitan Policy The slight overall poverty decline in the 1990s camouflaged sharper increases and decreases in certain parts of the nation. A Decade of Mixed Blessings: Urban and
Background Checks and Ban the Box Legislation. November 8, 2017
 Background Checks and Ban the Box Legislation November 8, 2017 Presented By Uzo Nwonwu Littler, Kansas City UNwonwu@littler.com, 816.627.4446 Jason Plowman Littler, Kansas City JPlowman@littler.com, 816.627.4435
THE DEMOGRAPHY OF MEXICO/U.S. MIGRATION
 THE DEMOGRAPHY OF MEXICO/U.S. MIGRATION October 19, 2005 B. Lindsay Lowell, Georgetown University Carla Pederzini Villarreal, Universidad Iberoamericana Jeffrey Passel, Pew Hispanic Center * Presentation
Megapolitan America. Luck Stone Corporation
 Megapolitan America Luck Stone Corporation Historical World Population Growth World population continually increases. With current world population over 6 billion (6,590,514,881 and counting) people, there
DETROIT IN FOCUS: A Profile from Census 2000
 DETROIT IN FOCUS: A PROFILE FROM CENSUS 2000 Living Cities: The National Community Development Initiative DETROIT IN FOCUS: A Profile from Census 2000 T he Brookings Institution Center on Urban and Metropolitan
The Brookings Institution Metropolitan Policy Program Robert Puentes, Fellow
 The Brookings Institution Metropolitan Policy Program Robert Puentes, Fellow Of First Burbs and Boom Burbs: Dealing with Suburban Transition in the 21st Century City of Plano, TX Annual Retreat October
New Home Affordability Trends. February 23, 2018
 New Home Affordability Trends February 23, 2018 1 Regional Director Territories Territory Experts Todd Britsch WA, OR Mark Gianopulos IA, IL, IN, MI, MN, MO, ND, OH, SD, WI Quita Syhapanya ME, NH, VT,
Immigration and Domestic Migration in US Metro Areas: 2000 and 1990 Census Findings by Education and Race
 Immigration and Domestic Migration in US Metro Areas: 2000 and 1990 Census Findings by Education and Race William H. Frey Population Studies Center The University of Michigan and The Brookings Institution
The Brookings Institution Metropolitan Policy Program Bruce Katz, Director
 The Brookings Institution Metropolitan Policy Program Bruce Katz, Director The State of American Cities and Suburbs Habitat Urban Conference March 18, 2005 The State of American Cities and Suburbs I What
SAN ANTONIO IN FOCUS: A Profile from Census 2000
 SAN ANTONIO IN FOCUS: A PROFILE FROM CENSUS 2000 Living Cities: The National Community Development Initiative SAN ANTONIO IN FOCUS: A Profile from Census 2000 T he Brookings Institution Center on Urban
State Governments Viewed Favorably as Federal Rating Hits New Low
 APRIL 15, 2013 State Governments Viewed Favorably as Federal Rating Hits New Low FOR FURTHER INFORMATION CONTACT THE PEW RESEARCH CENTER FOR THE PEOPLE & THE PRESS Michael Dimock Director Carroll Doherty
PORTLAND IN FOCUS: A Profile from Census 2000
 PORTLAND IN FOCUS: A PROFILE FROM CENSUS 2000 Living Cities: The National Community Development Initiative PORTLAND IN FOCUS: A Profile from Census 2000 T he Brookings Institution Center on Urban and Metropolitan
BOSTON IN FOCUS: A Profile from Census 2000
 BOSTON IN FOCUS: A PROFILE FROM CENSUS 2000 Living Cities: The National Community Development Initiative BOSTON IN FOCUS: A Profile from Census 2000 T he Brookings Institution Center on Urban and Metropolitan
Representational Bias in the 2012 Electorate
 Representational Bias in the 2012 Electorate by Vanessa Perez, Ph.D. January 2015 Table of Contents 1 Introduction 3 4 2 Methodology 5 3 Continuing Disparities in the and Voting Populations 6-10 4 National
Architecture of Segregation. Paul A. Jargowsky Center for Urban Research and Education Rutgers University - Camden
 Architecture of Segregation Paul A. Jargowsky Center for Urban Research and Education Rutgers University - Camden Dimensions of Poverty First and foremost poverty is about money Poverty Line compares family
Community Well-Being and the Great Recession
 Pathways Spring 2013 3 Community Well-Being and the Great Recession by Ann Owens and Robert J. Sampson The effects of the Great Recession on individuals and workers are well studied. Many reports document
Heading in the Wrong Direction: Growing School Segregation on Long Island
 Heading in the Wrong Direction: Growing School Segregation on Long Island January 2015 Heading in the Wrong Direction: Growing School Segregation on Long Island MAIN FINDINGS Based on 2000 and 2010 Census
Neighborhood Diversity Characteristics in Iowa and their Implications for Home Loans and Business Investment
 Economics Technical Reports and White Papers Economics 9-2008 Neighborhood Diversity Characteristics in Iowa and their Implications for Home Loans and Business Investment Liesl Eathington Iowa State University,
Americans and Britons:
 Metropolitan Policy Program Brookings/London School of Economics Comparative Urban Analysis Series Americans and Britons: Key Population Data from the Last Three U.S. and U.K. Censuses Rebecca Tunstall
Public and Subsidized Housing as a Platform for Becoming a United States Citizen
 Public and Subsidized Housing as a Platform for Becoming a United States Citizen John I. Carruthers The George Washington University Natasha T. Duncan Mercyhurst College Brigitte S. Waldorf Purdue University
Now is the time to pay attention
 Census & Redistricting : Now is the time to pay attention By Kimball Brace, President Election Data Services, Inc. Definitions Reapportionment Allocation of districts to an area Example: Congressional
The Brookings Institution Metropolitan Policy Program Bruce Katz, Director
 The Brookings Institution Metropolitan Policy Program Bruce Katz, Director Redefining Urban and Suburban America National Trust for Historic Preservation September 30, 2004 Redefining Urban and Suburban
January 17, 2017 Women in State Legislatures 2017
 January 17, 2017 in State Legislatures 2017 Kelly Dittmar, Ph.D. In 2017, 1832 women (1107D, 703R, 4I, 4Prg, 1WFP, 13NP) hold seats in state legislatures, comprising 24.8% of the 7383 members; 442 women
RULE 1.14: CLIENT WITH DIMINISHED CAPACITY
 American Bar Association CPR Policy Implementation Committee Variations of the ABA Model Rules of Professional Conduct RULE 1.14: CLIENT WITH DIMINISHED CAPACITY (a) When a client's capacity to make adequately
FSC-BENEFITED EXPORTS AND JOBS IN 1999: Estimates for Every Congressional District
 FSC-BENEFITED EXPORTS AND JOBS IN 1999: Estimates for Every Congressional District Prepared for National Foreign Trade Council July 2, 2002 National Economic Consulting FSC-BENEFITED EXPORTS AND JOBS IN
Regional Total Population: 2,780,873. Regional Low Income Population: 642,140. Regional Nonwhite Population: 1,166,442
 BALTIMORE REGION Neighborhood change in Baltimore is marked by a major city suburban divide, reflecting its long and troubled history of racial segregation. In the suburbs, only about one in six residents
The Brookings Institution Metropolitan Policy Program Bruce Katz, Director
 The Brookings Institution Metropolitan Policy Program Bruce Katz, Director The Council on Foundations May 8, 2006 Revitalizing Weak Market Cities in the U.S. Revitalizing Weak Market Cities in the U.S.
Incarcerated Women and Girls
 Incarcerated and Over the past quarter century, there has been a profound change in the involvement of women within the criminal justice system. This is the result of more expansive law enforcement efforts,
The New Geography of Immigration and Local Policy Responses
 1 Audrey Singer Senior Fellow The New Geography of Immigration and Local Policy Responses Brookings Mountain West University of Nevada Las Vegas 2 March 9, 2010 The New Geography of Immigration and Policy
Bearing the Brunt: Manufacturing Job Loss in the Great Lakes Region, Howard Wial and Alec Friedhoff. Metropolitan Policy Program
 Metropolitan Policy Program Bearing the Brunt: Manufacturing Job Loss in the Great Lakes Region, 1995 2005 Howard Wial and Alec Friedhoff The Great Lakes states account for a disproportionately large share
The Segregation Tax :
 Center on Urban & Metropolitan Policy Whether the value of the The Segregation Tax : The Cost of Racial Segregation to Black Homeowners By David Rusk 1 family home declines, is stable, or grows is vital
Prison Price Tag The High Cost of Wisconsin s Corrections Policies
 Prison Price Tag The High Cost of Wisconsin s Corrections Policies November 19, 2015 Wisconsin s overuse of jails and prisons has resulted in outsized costs for state residents. By emphasizing high-cost
Immigrants and the Hudson Valley Economy
 Immigrants and the Hudson Valley Economy A Fiscal Policy Institute Report www.fiscalpolicy.org December 2009 Executive Summary Immigrants in New York s Hudson Valley contribute to the local economy in
WILLIAMSON STATE OF THE COUNTY Capital Area Council of Governments
 WILLIAMSON STATE OF THE COUNTY 2011 Capital Area Council of Governments POPULATION Capital Area Council of Governments POPULATION THE RISE OF TEXAS During the past decade, the State of Texas has proved
SEVERE DISTRESS AND CONCENTRATED POVERTY: TRENDS FOR NEIGHBORHOODS IN CASEY CITIES AND THE NATION
 ANNIE E. CASEY FOUNDATION MAKING CONNECTIONS INITIATIVE SEVERE DISTRESS AND CONCENTRATED POVERTY: TRENDS FOR NEIGHBORHOODS IN CASEY CITIES AND THE NATION G. Thomas Kingsley and Kathryn L.S. Pettit October
Table 1. Top 100 Metro Areas in Established, New/Emerging, and Pre-Emerging Gateways
 Table 1. Top 100 Metro Areas in, New/Emerging, and Pre-Emerging Gateways Bakersfield, CA Honolulu, HI Providence-New Bedford, RI-MA* Boston-Cambridge-Quincy, MA-NH Houston-Sugar Land-Baytown, TX Riverside-San
Diversity Spreads Out:
 Metropolitan Policy Program Diversity Spreads Out: Metropolitan Shifts in Hispanic, Asian, and Black Populations Since 2000 William H. Frey At the turn of the 21st century, the nation s melting pot ideal
Background and Trends
 Background and Trends Kim English, Division of Criminal Justice Colorado Commission on Criminal and Juvenile Justice February 10, 2017 CCJJ / 02-10-2017 1/14 CCJJ / 02-10-2017 2/14 CCJJ / 02-10-2017 3/14
Migration Patterns in New Gateways of Texas The Innerburbs
 A resident of Wooten Park, Veronica moved from Ft. Worth to Austin to be close to friends and family. Migration Patterns in New Gateways of Texas The Innerburbs Pamela A. Rogers, Ph.D. Low-Income Housing
Migrant and Seasonal Head Start. Guadalupe Cuesta Director, National Migrant and Seasonal Head Start Collaboration Office
 Migrant and Seasonal Head Start Guadalupe Cuesta Director, National Migrant and Seasonal Head Start Collaboration Office The Migrant Seasonal Head Start (MSHS) program is one of the largest community based
U.S. Immigration Policy
 U.S. Immigration Policy Potential Impact on CRE September 2017 Introduction U.S. Immigration Policy Potential Impact on CRE SIGNIFICANT OVERHAUL OF IMMIGRATION LEGISLATION PROPOSED In early August, the
Exclusionary Zoning and Racial and Economic Segregation in New Jersey. Adam Gordon Staff Attorney Fair Share Housing Center October 2014
 Exclusionary Zoning and Racial and Economic Segregation in New Jersey Adam Gordon Staff Attorney Fair Share Housing Center October 2014 Overall Racial Segregation Source: Urban Institute Analysis of 1970-2010
Meanwhile, the foreign-born population accounted for the remaining 39 percent of the decline in household growth in
 3 Demographic Drivers Since the Great Recession, fewer young adults are forming new households and fewer immigrants are coming to the United States. As a result, the pace of household growth is unusually
ONE-FIFTH OF AMERICA: A COMPREHENSIVE GUIDE TO AMERICA S FIRST SUBURBS DATA REPORT
 ONE-FIFTH OF AMERICA: A COMPREHENSIVE GUIDE TO AMERICA S FIRST SUBURBS DATA REPORT Robert Puentes David Warren The Brookings Institution Metropolitan Policy Program A Discussion Paper Prepared for the
Produced by: SAFE City Program Interpersonal Violence Prevention Team February 2003 (907)
") General Facts of Reported Rape in Anchorage and Alaska Compared to the Nation 2001 ANCHORAGE In 2001, Anchorage ranked as the fifth highest city in the nation for the rate of reported rape per 100,000
General Facts of Reported Rape in Anchorage and Alaska Compared to the Nation 2001 ANCHORAGE In 2001, Anchorage ranked as the fifth highest city in the nation for the rate of reported rape per 100,000
Governing Board Roster
 AASA Governance AASA is the national association most directly concerned with public education leadership. Its practicing superintendents and other school system leaders establish and oversee AASA's goals.
REPORT. PR4: Refugee Resettlement Trends in the Midwest. The University of Vermont. Pablo Bose & Lucas Grigri. Published May 4, 2018 in Burlington, VT
 The University of Vermont PR4: Refugee Resettlement Trends in the Midwest REPORT Pablo Bose & Lucas Grigri Photo Credit: L. Grigri Published May 4, 2018 in Burlington, VT Refugee Resettlement in Small
Working Overtime: Long Commutes and Rent-burden in the Washington Metropolitan Region
 Working Overtime: Long Commutes and Rent-burden in the Washington Metropolitan Region By Kathryn Howell, PhD Research Associate George Mason University School of Public Policy Center for Regional Analysis
The Rise and Decline of the American Ghetto
 David M. Cutler, Edward L. Glaeser, Jacob L. Vigdor September 11, 2009 Outline Introduction Measuring Segregation Past Century Birth (through 1940) Expansion (1940-1970) Decline (since 1970) Across Cities
Geography of Homelessness, Part 4: Examining Urban Homelessness
 Geography of ness, Part 4: Examining ness While homelessness exists in all places, a majority of people experiencing homelessness are experiencing it in urban areas. Approximately 77 percent of the U.S.
Chapter 1: The Demographics of McLennan County
 Chapter 1: The Demographics of McLennan County General Population Since 2000, the Texas population has grown by more than 2.7 million residents (approximately 15%), bringing the total population of the
Georgia s Immigrants: Past, Present, and Future
 Georgia s Immigrants: Past, Present, and Future Douglas J. Krupka John V. Winters Fiscal Research Center Andrew Young School of Policy Studies Georgia State University Atlanta, GA FRC Report No. 175 April
RULE 2.4: LAWYER SERVING
 American Bar Association CPR Policy Implementation Committee Variations of the ABA Model Rules of Professional Conduct RULE 2.4: LAWYER SERVING AS THIRD-PARTY NEUTRAL (a) A lawyer serves as a third-party
The New Geography of Immigration and Local Policy Responses
 1 Audrey Singer Senior Fellow The New Geography of Immigration and Local Policy Responses Brookings Mountain West University of Nevada Las Vegas 2 March 9, 2010 The New Geography of Immigration and Policy
Bylaws of the Prescription Monitoring Information exchange Working Group
 Bylaws of the Prescription Monitoring Information exchange Working Group ` Table of Contents Table of Contents... 2 Article I. Introduction... 6 Article II. Purpose... 6 Article III. Membership... 6 Article
Racial integration between black and white people is at highest level for a century, new U.S. census reveals
 Thursday, Dec 16 2010 Racial integration between black and white people is at highest level for a century, new U.S. census reveals By Daily Mail Reporter Last updated at 1:11 PM on 16th December 2010 But
Trends in Medicaid and CHIP Eligibility Over Time
 REPORT Trends in Medicaid and CHIP Eligibility Over Time August 2015 Prepared by: Samantha Artiga and Elizabeth Cornachione Kaiser Family Foundation Executive Summary... 1 Section 1: Eligibility Trends
Where U.S. Immigrants Were Born 1960
 Where U.S. Immigrants Were Born 1960 2000 Latin America 9% Canada 10% Asia 5% Other 1% Other 6% Asia 26% Canada 3% Europe 15% Latino 22% Europe 75% Latin America 51% Foreign-Born Population by Region of