OCCASIONAL PAPER. India: Towards the Millennium Development Goals. United Nations Development Programme. Human Development Report Office
|
|
|
- Darrell Harris
- 6 years ago
- Views:
Transcription
1 United Nations Development Programme Human Development Report Office OCCASIONAL PAPER Background paper for HDR 2003 India: Towards the Millennium Development Goals Nirupam Bajpai 2003
2 Background Paper Human Development Report 2003 India: Towards the Millennium Development Goals Nirupam Bajpai January 27, 2003
3 India: Towards the Millennium Development Goals Nirupam Bajpai January 27, 2003 Abstract: Background Paper Human Development Report 2003 India s performance vis-à-vis human development has been mixed in the last decade. A high and sustainable rate of economic growth in the post reform period has reduced the number of people below the poverty line. Literacy rates have not only continued their trend rise but there has been a decline in the absolute number of illiterates for the first time. Population health, however, remains an area of neglect. Health indicators, while recording improvements over time, point to alarmingly high rates of malnutrition and mortality, especially among women and children, and widespread lack of access to medical care. Literacy rates have shown remarkable improvement in India in the last decade, both for males and females. Total literacy rates increased from 52% in 1991 to 66% in 2001, with male literacy rates increasing from 64% to 76% and female literacy rates increasing from 39% to 54%. The most heartening aspect of India s educational stride forward is the improvements recorded by the educationally backward states, especially the state of Madhya Pradesh. While there has been secular improvement in most health indicators, India continues to perform inferiorly in terms of health. Infant mortality rates have fallen and life expectancy has been rising. Maternal and child health, on the other hand, remain areas of neglect and as a result maternal mortality rates remain high, there is pervasive under-nutrition among children and women, and conditions of safe child birth elude large proportions of pregnant women. Kerala has stood apart from the Indian experience in both education and health, achieving social development levels that are close to those found in the rich developed countries. With vigorous public action accompanied by financial commitment determinedly focused on providing access to good education and health to every individual, Kerala boasts of high literacy rates of over 90% for both males and females, and the highest life expectancy and lowest infant mortality rates among all states of India. Moreover, the sex ratio in Kerala, unlike that for India as a whole and in sharp contrast to those of the rich states of Punjab and Haryana, is quite favorable for women. The state of Madhya Pradesh, historically one of the most socially backward states in India, has made rapid strides in education in the last decade. Between 1991 and 2001, literacy rates in Madhya Pradesh have jumped more than 20% points, increasing from 44.6% in 1991 to 64.11% in 2001, recording the highest decadal increase in literacy among Indian states. Moreover, female literacy rates in Madhya Pradesh improved more than male literacy rates, increasing from 39.29% in 1991 to 54.16% in To pursue the goal of mass literacy, Madhya Pradesh established 26,000 new primary schools within a year ( ), achieving universal access. The unique feature of the state s remarkable achievement has been the use of organizational support provided by village councils (Panchayats) to spread education to rural areas and to its large population of scheduled castes and tribes. 2
4 India: Towards the Millennium Development Goals 1. Introduction India is home to more than a billion people, accounting for nearly a sixth of the world s population. Any progress made by India in reaching the Millennium Development Goals will take a large part of humanity closer to reaching them. India has made some progress in covering the distance, more in some areas than in others. A lot more, however, remains to be done. India s better than average economic growth since 1991 has helped reduce extreme poverty. Enrolment in primary schools has increased for both girls and boys. Infant and child mortality have continued their secular decline. The historically backward states, especially the populous state of Madhya Pradesh in central India, has shown the greatest gains in education among all Indian states between 1991 and On the other hand, maternal health continues to be an area of persistent lack and neglect. Though there has been near universal reduction in infant mortality and child mortality rates, they remain at very high levels for large sections of the population. Child health remains precarious with very high levels of anemia found among children indicating pervasive under-nourishment. Gender bias continues to deprive millions of girls of higher education, proper nutrition and medical care. Caste too remains a salient social feature and people belonging to scheduled castes and tribes lag behind in terms of education and health. Endemic hunger and under-nutrition are still critical issues plagued by corruption and inertia, especially in a country where large areas are subject to frequent droughts. The burden of disease, to which HIV/AIDS has now been added, remains high creating excessive levels of mortality and morbidity. India has a federal structure and political jurisdiction is shared by the national government and the political parties in power at the state level. The lowest (sub-state) administrative level, however, is the district. All government programs and interventions are administered and implemented at the level of the district. Not only are there large variations in well-being outcomes across the states of India, but even within a single state, there are large variations in outcomes across districts. In this paper, we want to track India s progress in achieving the millennium development goals at the district level, data permitting. Where district level data is not available, state level data is used. 3
5 2. Social Attainments and Changes Human Development in a society has come to mean how well a society is doing in raising per capita incomes, education and health levels. While, it is not necessary that there be a straightforward relationship between these different aspects of well being, in general we would expect them to be correlated. In India, states that do better along one dimension do not necessarily do so along others. For example, Kerala has achieved very high levels of social development but has one of the lowest per capita incomes. Punjab, the state with the highest per capita income, on the other hand has, one of the worst sex ratios in the country. Human development at the state level in India depends not only on its level of resources but also on cultural norms, political willingness and support for human development. The economic climate in India has changed a lot since 1991 when a program of economic policy reform was put in place as a result of a fiscal and balance of payments crisis. It moved towards economic liberalization and privatization and greater integration with the world economy. More economic openness, both domestic and international, has raised the average rate of economic growth from 5.8 % per year in the 1980s to 6.1 % per year in the 1990s (World Development Report, 2000/2001). 1 There has been some debate on how much economic growth post-liberalization has contributed to poverty alleviation. However, as per the statistics available from the National Sample Survey Organization (NSSO) 2 on consumer expenditure, the poverty ratio on a 30 day recall basis is estimated at 27.09% in rural areas, 23.62% in urban areas and 26.10% for the country as a whole in 1999/00. The number of people below the poverty line has declined from 55% in 1973/74 to 36% in 1993/94 to 26% in 1999/00. Though the poverty ratio declined, the absolute number of poor remained around 320 million for a fairly long period of two decades ( ) due to a countervailing growth in population. The latest 1999/00 NSSO survey, however, shows a significant decline in this number to about 260 million out of a total population of 997 million. We need to investigate not only how changes in the macro-economy affect growth, poverty and inequality, but also whether and how these pervasive changes have 1 The significant difference between the growth rates of the 1980s and the 1990s is not only that the latter is higher but it is also sustainable. 2 NSSO 55 th Round Survey Data July 1999 June
6 affected health and educational attainments. In what follows, social development attainments and changes are described and discussed at the district level where data is available and where district level data is not available, the discussion is based on the state as the unit of observation. Little work exists measuring such change in India before and after the widespread economic reforms of Poverty Income poverty is an important component of economic and social deprivation. Income levels determine consumption levels as well as access to health and educational services. Poverty reduction has been an important goal of development policy in all poor countries and India is no exception. With one sixth of the world population living within its borders, any reduction in the number of poor people in India will make a vast difference to the extent of poverty in the world. Reduction in poverty requires raising income levels of the poor and the best engine for doing that is broad-based economic growth. India s rate of economic growth has been higher than average in the post-reform period of the 1990s compared to the past. The economic performance of different states, however, has been quite varied. According to calculations performed by Sachs, Bajpai and Ramiah (2002), the per capita state product in varied from Rs per month in Bihar (population 82 million), the poorest state, to Rs per month in Maharashtra (population 96 million), the richest state. The growth rate of income has been equally varied with Bihar registering a growth rate of 0.2% per year between and Gujarat 7.8% per year. Sachs et al hypothesize that the reason for such large differences in the economic performance of states is differences in the marginal productivity of investments by sub-sector, which depends on both the general business environment and specific geographical factors. The poverty reduction performance of the states vis-à-vis the better economic growth in the post-reform period has also been varied. Moreover, there are heterogeneities within states (except Bihar which is uniformly poor). The large states of Andhra Pradesh, Karnataka and Maharashtra show stark contrasts and some intra-state variations also exist in the smaller and richer states of Haryana and Punjab. Very high poverty rates of more than 60% exist in Southern Bihar, Southern Orissa, Madhya 5
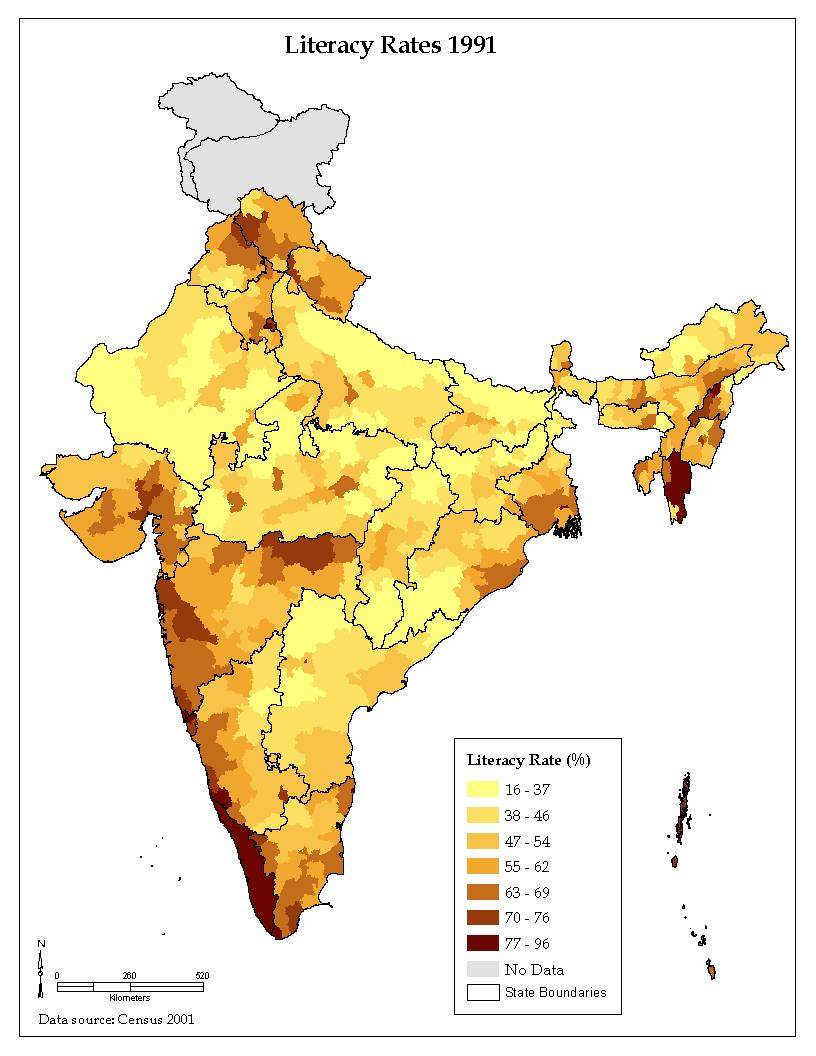
7 Pradesh and Southern Uttar Pradesh. These regions are either mainly tribal or rocky and dry, yet densely populated because of their agro-climactic features. Similarly, high poverty of 41-60% exists in other areas of Bihar, parts of Madhya Pradesh, inland Maharashtra, northern Tamil Nadu, eastern and central Uttar Pradesh and parts of West Bengal. These are also tribal, semi-arid thickly populated areas, which have been historically neglected. In the poorest states, especially the states of Bihar, Madhya Pradesh, Rajasthan and Uttar Pradesh which comprise what are known as the BIMARU ( sick ) states and Orissa, very high rates of poverty incidence are human failures rather than lack of natural resources. Except parts of western Rajasthan, parts of western Madhya Pradesh and southern Uttar Pradesh, the agro-climactic features have the potential to yield very high returns in agriculture. According to Datt and Ravallion (2002), had the poorest states participated more in post-reform economic growth, the historical trend in poverty reduction could have doubled. The proximate reasons for the lower poverty reduction response to economic growth by the poorer states are their initial low levels of rural and human development and large disparities between rural and urban areas. 2.2 Education Literacy rates have been rising over time in India. For the country as a whole, literacy rates increased from 52% in 1991 to 66% in Improvements were made in both male and female literacy rates. In 1991, only 39% of females were literate compared to 64% of males. In 2001, these rates had increased to 54% and 76% respectively. Though there were significant differences in the performance of different states, the historically educationally backward states recorded higher than average increases in Madhya Pradesh female literacy rates increased by almost 21% and in Rajasthan by 24% compared to the all-india decadal increase of 15%. In the ranking of states by education, Bihar continues to occupy the lowest rank in terms of both male and female and literacy rates while Kerala retains its position at the top. Maps 1 and 2 in the Appendix provide a visual picture of literacy rates in India at the district level in 1991 and In 1991, higher literacy rates are concentrated among the southern states as depicted by the darker colored districts. There are pockets of high 6
8 literacy in the North, mainly in the small hilly state of Himachal Pradesh and in districts belonging to the North Eastern states. Low levels of literacy, as depicted by the light yellow colored districts are concentrated in Rajasthan, Bihar, Uttar Pradesh, Bihar and Orissa. Of the twenty-five districts with the lowest literacy rates in 1991 (2001), 3 (2) were in Madhya Pradesh, 9 (12) in Bihar, 3 (4) in Rajasthan and 5 (5) in Uttar Pradesh, the BIMARU states. The remaining 5 (6) districts were in Orissa. The picture changes significantly in 2001, especially in Madhya Pradesh in central India. Very low levels of literacy rates are now concentrated in northern Uttar Pradesh, western Rajasthan, Orissa and Bihar, parts of Madhya Pradesh and Andhra Pradesh. In 1991 literacy rates ranged from a low of 18.62% in Nabarangapur in Orissa to a high of 95.72% in Kottayam in Kerala. In 2001, the district with the lowest literacy rate was Kishanganj in Bihar where it was 31.02%. Kottayam retained its position as the district with the highest literacy rate with 95.72% of its population literate. Map 3 shows absolute changes in literacy rates between 1991 and In absolute terms, the highest changes are concentrated in Rajasthan, Madhya Pradesh (including the new state of Chattisgarh) and northern Andhra Pradesh. As the baseline literacy rates are some of the lowest in the country, we have to be cautious in interpreting this map. However, it attaches a picture to the heartening fact that laggard districts and states in India are making progress in education. Uttar Pradesh too records absolute changes in literacy rates between 12-15% in many districts. Bihar, however, continues on its extremely slow road forward. Districts in Bihar continue to record the lowest literacy rates in the country and absolute improvement in the districts of Bihar over time continue to be small. Maps 4, 5 and 6 depict female literacy rates at the district level for 1991, 2001 and change between The pictures are similar to those for overall literacy rates. High female literacy rates in 1991 are concentrated in Kerala and along the western coast of India, in Maharashtra and Gujarat, in the hilly state of Himachal Pradesh, in southern West Bengal and the small north-eastern states with pockets of high literacy in central India. Within the overall jumps in both male and female literacy rates between are hidden disparities between genders, between caste groups, between income classes and between rural and urban areas. As the Census 2001 data on these measures 7
9 are yet to become available, a precise account of these disparities can be given only in the future. However, studies based on earlier data do find that where overall literacy rates are higher, in these regions literacy rates among the poor, females and caste groups also tend to be higher and disparities lower. For example, based on NCAER data, Shariff and Sudarshan (1996) show that in Rajasthan the overall literacy rates for males and females were 60% and 19% respectively whereas literacy rates were 39% and 7% for males and females for Scheduled Tribes and 52% and 9% for males and females for the Scheduled Castes. The literacy rates among landless wage earners were 44% and 5.6% for males and females respectively. Rajasthan ranks at the bottom in overall female literacy and this is as true of females belonging to the higher castes as of those who are members of scheduled castes and tribes. In general, historically, educationally backward regions do particularly badly in terms of education attainment of the marginalized groups. In what follows, we highlight some of the correlates of higher literacy: especially urbanization and provision of infrastructure. Higher literacy rates are associated with greater urbanization. As is well known, the rural-urban divide is much greater than differences based on caste, class and gender. Urban populations have greater access to schools and the quality of education is also better in urban areas. Moreover, the incentives to invest in education are higher in urban areas given the proximity to more and better paying jobs. Urban incomes are also higher compared to rural areas. As district-wise data on urban population is not yet available for 2001, Graph 1 in the Appendix shows a simple regression of literacy rates on percent of urban population at the district level for Without ascribing any causality to the association, according to the simple regression result, a 10% increase in the urban population at the district level is associated with a 2% increase in literacy rates. Higher literacy rates are also associated with greater infrastructure availability as can be seen from Graph 2 in the Appendix, which shows the results of simple OLS regression of literacy rates on the infrastructure index at the district level. The data on literacy rates belong to the year 2001 and the data on the infrastructure index for Again, while correlation does not establish causality, the positive association of urbanization and infrastructure with education indicates the kind of environment conducive to the provision of, and demand for, education. 8
10 Regionally in India, southern states have historically done better in terms of educational outcomes and continue to do so as is evident from the district level maps of literacy rates. There is greater public awareness and collective action efforts on the part of the people in the South. Politics is populist in almost all states but the governments of the southern states have paid more attention to education compared to the northern states and there has been effective intervention in terms of public schemes, an example being the provision of mid-day meals in schools in Tamil Nadu. Kerala has been a model state for some time in terms of human development not only for India but for the developing world as a whole. Among the laggard states, Madhya Pradesh has shown commendable improvement in literacy rates for both males and females. As has been noted above, some districts in Madhya Pradesh have recorded the highest increase in literacy rates between 1991 and In section 3, Kerala and Madhya Pradesh are presented as case studies to explore some of the reasons behind their attainments. 2.3 Health Health is an important aspect of human development. One of the most important predictors of health status is income. However, health is a dimension of human capital and healthier people are more productive. The relationship between health and income is bi-directional: the health status of a person influences his or her income status as well. Given the prevalence of mass poverty in India, the question is not only how to raise the incomes of the poor that will be instrumental in improving their health status but also to identify policy interventions that can improve people s health status at existing income levels (and can be instrumental in raising incomes). Provision of public health services 3 Here mention must also be made of the hilly state of Himachal Pradesh situated in the north of India in the foothills of the Himalayas. It is a small, sparsely populated state accounting for a little more than half a percent of India s population. Given the remoteness of its hilly topography and the fact that the state is situated in the Hindi belt, same as the BIMARU States with which it shares similar institutional and bureaucratic set-up, it s achievements in education and health are remarkable. [] These achievements are ascribed to the greater level of social capital, the better status of women and greater parental demand and pressure for education for their children, in the state. For a more detailed description of Himachal Pradesh s achievements, see Dreze and Sen (2002). 9
11 such as access to basic and preventive health care, sanitation, clean water and raising awareness about the causes of illness and their treatment are some of the ways in which the now industrialized countries improved the health of their citizenry at comparable levels of development and before the onset of the medical revolution. Health indicators have continued to improve over time in India. Infant mortality rates have shown a steady and secular decline in India and life expectancy too has continued its upward climb. Yet, the state of affairs is far from satisfactory: health indicators in India are inferior not only compared to the rich countries of the West but also compared to the achievements of other developing countries like China and Brazil. For example, despite greater resources, life expectancy in some states of India is similar to those in some of the poorest sub-saharan African countries. Only the state of Kerala records achievements in health that are better than not only the rest of India but also the rest of the developing world and often at par with the Western developed countries. Infant mortality is a good indicator at how well nations are doing in protecting their most vulnerable members. Both infant and child mortality have continued their trend decline but remain at high levels in India. Table 1 in the Appendix lists infant and child mortality rates for 11 states in India for and Kerala stands out with its low infant and child mortality rates of 16.3 and 2.6 in In all the states, except Madhya Pradesh and Rajasthan, which actually register an increase in these two rates, infant mortality and child mortality rates have declined. Sex ratio indicates both the absolute well being of women as well their relative well-being vis-à-vis men. Given adequate and equal nutrition and medical care, women live longer than men. In India, the overall sex ratio has always been unfavorable to women except in the states of the south. While, sex ratios improve with income in general, in India, the relatively richer states of Punjab and Haryana have historically recorded the worst sex ratios in the country as a whole. Between 1991 and 2001, improvements in the sex ratio have had mixed results. In the traditionally adverse to women states of Uttar Pradesh and Rajasthan sex ratios have improved and these increases are the highest overall, noting the fact that they start out at the lowest levels across districts. On the other hand, in many districts of Maharashtra and Gujarat sex ratios have actually declined. Punjab and Haryana, while recording some improvement, 10
12 continue to have some of the lowest sex ratios. Maps 7 and 8 in the Appendix provide a visual picture of sex ratios at the district level for the years 1991 and The pictures are not very different in the two years. The darker colors russet and maroon, which depict higher sex ratios, dominate in the southern states, parts of southern Gujarat, Himachal Pradesh and the small, hilly states of the northeast, in The picture remains much the same in 2001, with the darker colors dominating in the states of the South and their distribution in the rest of India follows a pattern similar to that in Socio-economic differentials across gender, caste and rural location There are wide disparities in poverty, health and education outcomes across different sections of the population and across different regions of the country as have been discussed to some extent in the section above. Rural and urban India record large differentials in all social development indicators. Apart from the rural-urban divide, gender, caste and class are also systematically associated with disparate well-being outcomes. Data on sex ratio and male and female literacy rates discussed above provide some indication of discrepancies in social well being that systematically vary with gender. Table 2 in the Appendix shows rural and urban life expectancy and infant mortality rates for the 14 major states. Except Kerala, in all states there are large discrepancies in these two health outcomes across rural and urban populations. This is especially true of infant mortality rates. Post-independence, India has consciously pursued a policy of affirmative action whereby the historically socially and economically backward scheduled castes and tribes have been given preferential treatment. However, even after 50 years since independence, the caste divide in India continues to mark the social landscape, especially in the rural areas and the hinterlands. Membership of scheduled castes and tribes systematically predicts education and health outcomes for the population. As has been noted in section 2.1, poverty is concentrated in areas with a greater presence of backward castes and tribes. As noted in section 2.2, Shariff and Sudarshan (1996) found that female literacy rates among members of scheduled tribes in Rajasthan and Madhya Pradesh were as low as 7% and 9% respectively. In order to provide some idea of how members of scheduled castes and tribes fare vis-à-vis the rest 11
13 of the population, Table 3 in the Appendix provides 1991 literacy data for the 14 major states, as 2001 Census data for Scheduled castes and tribes is not yet available. It can be seen from the table that Scheduled castes and tribes, while they have lower than average literacy rates in all states, fare particularly badly in the BIMARU states and in Haryana and Andhra Pradesh. Even as impressive advances have been made in the spread of literacy with the number of non-literates actually falling as per the 2001 census, the gaps between the education of males and females remains a cause for concern. The difference between male and female literacy rates in 1991 was 25 percentage points. Even as both male and female literacy rates recorded jumps in 2001, female literacy rates trailed behind male literacy rates by 22 percentage points. Education and health among Indian citizenry have been improving over time but the large disparities across sections of the population are worrisome. In terms of health and from the viewpoint of the framework of the epidemiological transition, different sections of Indian society seem to belong to different phases of the transition: the poor and vulnerable sections of the population suffer from diseases of poverty and undernutrition, largely infectious and gastro-enterical diseases; among the rising urban middle class, the diseases of affluence such as heart and non-communicable chronic degenerative diseases are more prevalent. Similarly, large sections of the population, especially rural, tribal and female continue to be deprived of basic education and literacy. 3. Case Studies Among the fourteen major states, Kerala has always stood out as a star in terms of social development, closely followed by Tamil Nadu and in some respects West Bengal. On the other hand, the BIMARU states have always ranked the lowest. However, in the last two decades, Madhya Pradesh has recorded impressive achievements in education as a result of greater and better public intervention. While there are lessons to be learnt from the success of Kerala, there are important lessons to be learnt from the improvements made by Madhya Pradesh. These lessons acquire great significance for the other BIMARU states which share cultural contiguity with Madhya Pradesh. In the following section, case studies for Kerala and Madhya Pradesh are presented to highlight the crucial 12
14 role played by public action in achieving social development at low levels of per capita income. Case Study: Kerala Kerala s achievements in social development are legendary especially in a scenario of low levels of per capita income and low rates of income growth. The key to Kerala s success has been social intermediation and active public action and financial commitment over time to provide education and health to every individual in the state. In terms of both health and education, Kerala ranks the highest among all Indian states. In 1991, the human development index for Kerala was compared to that of Punjab which had a human development index of On the other hand, Kerala s per capita income was only half that of Punjab in 1991 (Mehrotra and Jolly, 2000). The state of Kerala was formed by combining the provinces of Travancore, Cochin and Malabar. At the time of the formation of the state, Travancore and Cochin provinces had already achieved high rates of literacy and good health for their population. The statistics for Malabar, however, were not different from the average for India as a whole. However, by implementing policies and programs in Malabar that were already prevalent in the other two provinces and providing more budgetary assistance to it, within the span of a single generation, health and education in Malabar converged to those in Travancore and Cochin. What distinguishes Kerala s achievements is the promotion of education and widespread and equitable provision of health care and other services from an early stage. This has led to a snowball effect in social achievements over time. Helped by mass literacy, political activism in Kerala, especially the political organization of the deprived sections of society and the favorable position of women in society has played a crucial role in the reduction of social inequalities and in enabling the disadvantaged sections in participating in the economic and social development processes. Notwithstanding the unique cultural and historical characteristics that may have been conducive to the early social development achievements in Kerala, as the experience of Malabar in catching up with the other two regions shows, political participation and public action has played an 13
15 important role in Kerala s social development successes and that its experiences can be emulated by the other states of the Indian Union. Case Study: Madhya Pradesh Madhya Pradesh, situated in central India, is the largest state in the Indian Union geographically with a land area of 44,348 square kilometers. In 2001, it accounted for 5.8% of the Indian population, which meant that its population density was 196 persons per square kilometers, one of the lowest population densities among the 14 major states in India. Madhya Pradesh is a poor, tribal state and historically, it has been socially and economically backward, being one of the BIMARU states. In 1991, Scheduled Tribes comprised 23.27% of the total population of Madhya Pradesh, while scheduled castes comprised of 14.54% of the total population. The headcount index of poverty for Madhya Pradesh in was 44%, the highest among the major states and it accounted for 9.2% of national poverty (Datt and Ravallion, 2002). Between 1991 and 2001, however, Madhya Pradesh has made impressive gains in literacy rates, registering some of the largest increases in literacy rates for both males and females across all districts of India. In 1991, the average literacy rate across districts of Madhya Pradesh was 43% and the average for female literacy rates was only 27%. In 2001, the average literacy rates across had increased to 63% and for females to 49%. As can be seen from Maps 3 and 6 in the appendix, districts in Madhya Pradesh registered the largest increases in total and female literacy between 1991 and The remarkable gains in literacy made by Madhya Pradesh can be explained by the twin-pronged strategy of the Madhya Pradesh Government: (a) provision of schools and guaranteeing access and (b) a model for spreading literacy that makes use of the synergies between the community, the local and the state governments 4. Between 1997 and 1998, under the newly initiated Education Guarantee Scheme (EGS), Madhya Pradesh established 26,000 new schools, most of them in areas inhabited by Scheduled 4 The State government has empowered the Panchayats to set-up new schools in response to community demand, appoint teachers and locate land for schools. Importantly enough, the Panchayats also have the authority to dismiss teachers who are not performing. Education Committees comprising of Janpad Panchayat and District Panchayat members oversee all matters of school education like location of new schools, transfer of teachers within the District and staffing of District Institutes of Educational Training. The Gram Panchayats also manage all such schools that are set-up through the Education Guarantee Scheme. 14
16 Castes and Scheduled Tribes. This made possible for Madhya Pradesh to declare universal access to education. In order to address the challenge of mass literacy, Madhya Pradesh moved away from the Total Literacy Campaign (TLC) model at the national level and pioneered a new scheme, the Padhna Badhna Andolan (PBA). The PBA uses the organizational support provided by the institution of the Panchayati Raj (village councils) to broker the spread of education at the level of the community. The key elements of the PBA process are as follows: Non-literates come together as Padhna Badhna Samitis. They choose an educated person from the locality to be their teacher or Guruji. They register at the nearest Panchayat (village council) or Jan Shiksha Kendra (Cluster Resource Center) with their names and that of their proposed teacher. After verification of their non-literate status, the government registers the teacher and provides him/her with training and teaching-learning material. The teaching-learning material consists of 4 primers the first three on literacy and the fourth on rights (land, gender, forest, labor). The aim of the fourth primer is to reposition the Padhna Badhna Samiti as a self-help group. The government s role is only as an evaluator and for conducting examinations. There are monetary incentives for the teacher who receives an honorarium of Rupees 100 per learner (to which the community may add if it wishes). The response to the scheme was overwhelming with 217,000 Samitis with a total enrolment of 5.18 million people being formed (Rajiv Gandhi Missions Occasional Papers, 2001). The success of the scheme has translated into remarkable literacy results for Madhya Pradesh, with every 6 th person removed from the category of illiterates belonging to the state and every 5 th woman removed from the category of illiterates belonging to the state. The strategies pursued by the state to spread education make use of 15
17 conditions that also exist in other states and therefore provide a valuable way forward for similarly placed states. 4. Public Provision and Infrastructure India is moving forward towards greater literacy and better health for its population. While, gains in literacy have been impressive, those in health have been lackluster. Moreover, average gains hide large differences across districts within the same state and across different socio-economic groups. In India, provision of public goods in health and education has always been lackluster. One of the reasons why literacy rates displays a slow upward climb in the laggard states is the inability of public services to keep up with the increase in population size. Spread of education depends on the availability of, and access to, educational institutions. The issue of availability of, and access to schools, becomes even more critical in the face of increasing population size. In most districts, the availability of primary schools per 100,000 of population has fallen between 1991 and 2001 indicating the inability of the education system to keep up with population change. On the other hand, as the success of Madhya Pradesh in spreading education shows, access to schools is a crucial component of any policy effort towards the goal of mass literacy. The education system in India has been criticized for its neglect of primary education and its lopsided attention to higher levels of schooling. In a country where only a little over 10% of the school going population can afford private schooling, it becomes imperative for the government to provide its growing population with an adequate number of schools. The quality of schooling in India is also suspect. Field studies find parents disenchanted with the quality of education their children get in school. Bad schools reduce parental motivation to send children to school and keep them there and increase their motivation to put their children to work, contributing to the phenomenon of child labor. According to Ramachandran and Saihjee (2002), aggregate data hides a social hierarchy of access at ground level. India s performance in improving the health of its population has been much inferior compared to educational development. Infant, child and maternal mortality rates remain at very high levels. Among the proximate causes of infant and child mortality is 16
18 inadequate nutrition, among pregnant mothers and among small children. Rates of anemia among children are very high in India as can be seen from Table 1. Barring Kerala, where the percentage of children with anemia is 44%, all other states have more than 65% of children suffering from anemia. In Bihar, Rajasthan, Maharashtra and Orissa more than 70% children are anemic. Another proximate reason for childhood mortality is the extent of protection from infections and diseases of childhood. Adequate and timely immunization goes a long way in providing protection from polio, measles and diphtheria. The prevalence of complete immunization among children is heterogeneous across states and districts of India. In 1999, West Champaran in Bihar registered the abysmally low figure of 14% for children with complete immunization, which was a quarter of the mean of 60% for all districts. On the other hand, Madurai in Tamil Nadu recorded near universal immunization with 99.5% of all children having received complete doses. District averages clustered around 45% in the other four poorly performing states of Uttar Pradesh, Madhya Pradesh, Rajasthan and Orissa. With less than half of all children immunized, high childhood causalities are not surprising, though unacceptable. Maternal care, both pre-natal and post-natal is characterized by gross neglect in India, which has one of the highest levels of maternal mortality in the world. The average estimated maternal mortality rate between for the 14 major states was 580 per 100,000 birth. In Rajasthan and Uttar Pradesh, the estimated maternal mortality rates were as high as 938 and 935 respectively in this period. The reasons for such high maternal mortality range from poverty, high fertility rates, gender bias, under-nutrition and high incidence of anemia among pregnant mothers to the lack of access to primary medical care, lack of access to family planning and reproductive health services and nonavailability of trained medical personnel in rural areas. In Table 1, the percentage of anemic women in 11 major states is listed for the year The percentage of anemic women range from more than 63% in Bihar and Orissa to 22% in Kerala with the other states clustering around 50%. Apart from lack of nourishment, many women lose their lives in childbirth due to poor availability of medical infrastructure and personnel. For the 188 districts in the 14 major states for which data are available in 1999, the percentage of pregnant mothers who delivered infants in hospitals or under the supervision of trained 17
19 medical personnel at home was as low as 7.9% in Samastipur in Bihar, while 100% of mothers delivered their infants under proper supervision in Pathanamthitta in Kerala. The mean for all districts was 49% with a very high standard deviation of 25 percentage points. Districts with more than 50% of mothers who delivered babies with trained medical attendants present belonged to the southern states of Kerala, Karnataka, Andhra Pradesh and Tamil Nadu, the western state of Maharashtra and Gujarat, the northern states of Punjab and Haryana and West Bengal. Only two districts each belonging to Madhya Pradesh, Rajasthan and Orissa and three of Uttar Pradesh qualified in this area. In all districts of Bihar fewer than half the mothers delivered babies under safe conditions. Moreover, in these poorly performing states, the better statistics belonged to the relatively more urban districts and large cities. In Madhya Pradesh, the two large cities of Indore and Gwalior, 72% and 61% of mothers respectively delivered their babies in a safe environment. It is now widely accepted that aspects of women s agency are instrumental in reducing infant mortality rates and raising child health levels. High fertility rates and high female illiteracy rates are generally associated with high infant and child mortality rates and inferior child health outcomes. In India, fertility rates have been declining over time with Kerala having achieved a below replacement fertility rate of However, the decline in fertility rates has been varied across Indian states as is evident from Table 1. Although fertility rates have declined in all the states, in the BIMARU states, fertility rates are still very high ranging from 3.27 in Madhya Pradesh to 3.96 in Uttar Pradesh in Empirically, it has been proven that higher female literacy is associated with lower fertility. In a panel study for the districts in India, Dreze and Kingdon (2000) show that women s education is causal in lowering fertility. Moreover, more educated women are more likely to experience lower infant mortality and child mortality rates and are also more likely to invest more in their children s education. More educated mothers process information more effectively and are more likely to make use of maternal and child care services. Large disparities exist between literate and illiterate mothers in the production of child and infant health. These disparities are further exacerbated by membership of scheduled and low castes and tribes. However, rural or urban residence cut across education, caste and class groups with greater differentials in health outcomes between 18
20 rural and urban populations than across other socio-economic groupings. In order to improve the health of its population, India will have to redress existing inequalities that exist between rural and urban areas and across different socio-economic groups. One of the most important reasons for high levels of mortality and morbidity in India is under-nutrition. Food security continues to elude many. One of the contradictory aspects of Indian development is the continuing lack of access to food by large sections of the population in a period when national availability of food stocks per capita is at historic high levels. Endemic under-nourishment claims many more lives than large-scale famines. The former has less political visibility, which leads to its neglect in public discussion and the political agenda of political parties. As a result a huge proportion of the Indian population continues to suffer from chronic under-nutrition and the burden of avoidable illness and morbidity. Success at eradicating illness also depends on information available to people about the causes of illness and their prevention and treatment. Such knowledge is abysmally low, especially among the most vulnerable sections of the population. Added to the existing bundle of diseases is the spread of HIV/AIDS, which also requires raising public awareness as a critical component towards combating it. In India the approach to health planning at the national and state levels has been ad-hoc. Health policy has been pursued by way of multiple schemes, which are neither integrated with each other nor with development strategy in general. Such an approach further reduces the effectiveness of limited financial and human resources. Moreover, public services in India have historically been of low standards in both quantity and quality. The health infrastructure in India is either not in place, or is in place and nonfunctional. However, the quality of what is available is so low that people would rather see a private medical practitioner at great cost rather than make use of publicly provided health services. Better infrastructure is one of the keys to economic development in general. India s infrastructure network is large, developed and reaches all parts of the country. Yet, it is not enough and it is rightly touted as one of the major constraints to the future of economic growth and attainment of social development goals in India. States and districts with better infrastructure also have higher rates of literacy and better population health. 19
21 Better and modern infrastructure may not be directly causal towards better education and health as better infrastructure, literacy and health, all could be the result of a third factor such as greater governmental intermediation. Districts in the state of Punjab have the highest infrastructure index, yet Punjab has mixed results in social development terms. Nevertheless, better roads, electricity and telephones allow greater access to markets, schools and hospitals, and relevant and timely information. In general, better infrastructure leads to greater knowledge and participation by the masses in economic and social opportunities, especially for those who live in the hinterlands of the country. For 334 districts on which data is available in 1999, the mean of the infrastructure index across districts was 104, with Madras district in Tamil Nadu recording the highest with 472, followed by districts in Punjab and Mahbubnagar in Andhra Pradesh having a low of 65. India has done reasonably well in providing electricity to most of its villages 5. Only 17 districts out of the 285 had less than 60% villages without electricity. Of these 17 districts, 9 were in Uttar Pradesh. Jehanabad in Bihar had only 22% of its villages with electricity. The mean for all districts was 91%. In terms of availability of roads too, there is large variation across districts. Lack of roads contributes to rural poverty, making access to markets, health and educational facilities difficult. Due to lack of availability of data, a detailed discussion on the availability of roads in Indian districts cannot be provided but it can be surmised that districts with a higher infrastructure index also have more roads per 100,000 of population. 6 Towards the Millennium Development Goals: The following table shows where India should be in 2015 if it achieves the Millennium Development Goals and where it is located now 7 and the distance it needs to cover with respect to various indicators. 5 Of course, it should also be mentioned that almost all the State Electricity Boards (SEBs) are loss-making since they implement social subsidy policies of state governments leading to inefficient patterns of energy consumption, and even to non-recovery of their own costs. 6 For the 47 districts on which data is available for 1999, a simple regression of road length per 100,000 population on the infrastructure index was run: a 10% increase in the infrastructure index was associated with an increase in 7 kilometers of road length. 7 The indicators for India s present situation are based on the latest year for which information is available. 20
22 Indicators 2015 Present Infant Mortality Rate Under 5 Mortality Rate Maternal Mortality Rate Gross Enrolment Ratio in Primary Schools Boys Girls Total Female Literacy Rate/Male Literacy Rate Poverty Rate (%) For India to go further along the path of human development, it has to focus on providing better health services to its population and on eliminating existing disparities across caste, gender and rural-urban location. There is a great need for developing the health infrastructure and for providing better infrastructure in general. The backward states, especially Rajasthan, Uttar Pradesh and Bihar still lag behind the rest of India in human development. Madhya Pradesh has made some headway in education but does no better than the other BIMARU states in health. However, both Kerala and Madhya Pradesh provide proof that with effective social intermediation and public action, it is possible to achieve greater social development at low levels of income and in a relatively short time period. Moreover, social development is also the key for the backward states to reduce poverty and participate in the new economic growth. The role that Panchayats in Madhya Pradesh are playing may provide a strategy for all other states in India, especially with respect to their role in the area of primary education. Control and oversight of the schools and health centers at the local level is critical if they are to perform well. The prevailing system in India fails to perform as well since the control and oversight is presently with the state bureaucrats who are stationed in the state capitals. 21
23 References Datt, G and M. Ravallion, (2002), Is India s Economic Growth Leaving the Poor Behind? Manuscript. Dreze, J. and G. Kingdon, (2000), Fertility, Education and Development: Further Evidence from India, Development Economics Discussion Paper Series, STICERD, London School of Economics. Dreze, J. and A. Sen, (2002), India Development and Participation, Oxford University Press, New Delhi. Mehrotra, S. and R. Jolly (eds) (2000), Development With a Human Face: Experiences in Social Achievement and Economic Growth, Oxford University Press, Oxford. Ramachandran, V and A. Saihjee, (2002), The New Segregation: Reflections on Gender and Equity in Primary Education, Economic and Political Weekly, April 27. Sachs, J, N. Bajpai and A. Ramiah (2002), Understanding Regional Economic Growth in India, Asian Economic Papers, MIT Press, Volume 1, Number 3. Rededicating to the Continuing Challenge, Rajiv Gandhi Missions, Government of Madhya Pradesh, Occasional Papers, Document 9, June World Development Report 2000/2001, The World Bank, Washington D.C. 22
24 APPENDIX Data Sources: Data for district level total literacy rates, female literacy rates, male literacy rates 1991 and 2001 from Census India 1991 and Data for district level sex ratios for 1991 and 2001 from Census India 1991 and District level data for urbanization, infrastructure index, percentage children covered by complete immunization, percentage children with anemia, percentage of pregnant mothers who gave birth under safe conditions, percentage of villages with electricity, road length per 100,000 of population from Center for Monitoring the Indian Economy (CMIE) Database Profiles of Districts Graph 1: Regression of Literacy Rates 1991 on percentage urban population 1991 ˆ * y x ; R ; *significant at the 5% level; No. of observations = Fitted values Literacy Rates, Percentage Urban,
25 Graph 2: Regression of Literacy Rates 2001 on Infrastructure Index 1999 ˆ * y 0.20 x ; R ; *significant at the 5% level; No. of observations = Fitted values Literacy Rates, Infrastructure Index
26 Table 1: Health Indicators for Selected States States Infant Mortality Child Mortality Total Fertility Rate % of Children % of Women Rate Rate with Anemia with Anemia Andhra NA 68 NA 50 Pradesh Tamil Nadu NA 66.1 NA 56.5 Bihar NA 79.1 NA 63.6 Uttar Pradesh NA 70.8 NA 48.7 Madhya NA 71.5 NA 54.4 Pradesh Rajasthan NA 76.4 NA 48.7 Karnataka NA 65.8 NA 42.4 Kerala NA 44.2 NA 22.6 Gujarat NA 70 NA 46 Maharashtra NA 72.2 NA 48.6 Orissa NA 71.3 NA 63.1 Source: National Family Health Surveys Phases I and II 25
27 Table 2: Life Expectancy and Infant Mortality Rate, Rural versus Urban State Life Expectancy at Infant Mortality Rate 1995 Birth Rural Urban Rural Urban Total Andhra Pradesh Bihar Gujarat Haryana Karnataka Kerala Madhya Pradesh Maharashtra Orissa Punjab Rajasthan Tamil Nadu Uttar Pradesh West Bengal
28 Table 3: Literacy Rates, Scheduled Castes and Tribes, 1991 State % of % of Literacy Literacy Literacy Population Population Rates 7+ Rates 7+ Rates 7+ SC 1991 ST SC 1991 ST 1991 Andhra Pradesh Bihar Gujarat Haryana Karnataka Kerala Madhya Pradesh Maharashtra Orissa Punjab Rajasthan Tamil Nadu Uttar Pradesh West Bengal Source: Census of India,
29
30

31
Social Science Class 9 th
 Social Science Class 9 th Poverty as a Challenge Social exclusion Vulnerability Poverty Line Poverty Estimates Vulnerable Groups Inter-State Disparities Global Poverty Scenario Causes of Poverty Anti-Poverty
II. MPI in India: A Case Study
 https://ophi.org.uk/multidimensional-poverty-index/ II. in India: A Case Study 271 MILLION FEWER POOR PEOPLE IN INDIA The scale of multidimensional poverty in India deserves a chapter on its own. India
INDIAN SCHOOL MUSCAT SENIOR SECTION DEPARTMENT OF SOCIAL SCIENCE CLASS: IX TOPIC/CHAPTER: 03-Poverty As A Challenge WORKSHEET No.
 INDIAN SCHOOL MUSCAT SENIOR SECTION DEPARTMENT OF SOCIAL SCIENCE CLASS: IX TOPIC/CHAPTER: 0-Poverty As A Challenge WORKSHEET No. : 4 (206-7) SUMMARY WRITE THESE QUESTIONS IN YOUR CLASS WORK NOTE BOOK 5,
A Comparative Study of Human Development Index of Major Indian States
 Volume-6, Issue-2, March-April 2016 International Journal of Engineering and Management Research Page Number: 107-111 A Comparative Study of Human Development Index of Major Indian States Pooja Research
Policy for Regional Development. V. J. Ravishankar Indian Institute of Public Administration 7 th December, 2006
 Policy for Regional Development V. J. Ravishankar Indian Institute of Public Administration 7 th December, 2006 Why is regional equity an issue? Large regional disparities represent serious threats as
1400 hrs 14 June The Millennium Development Goals (MDGs): The Role of Governments and Public Service Notes for Discussion
: The Role of Governments and Public Service Notes for Discussion") 1400 hrs 14 June 2010 Slide I The Millennium Development Goals (MDGs): The Role of Governments and Public Service Notes for Discussion I The Purpose of this Presentation is to review progress in the Achievement
1400 hrs 14 June 2010 Slide I The Millennium Development Goals (MDGs): The Role of Governments and Public Service Notes for Discussion I The Purpose of this Presentation is to review progress in the Achievement
CHAPTER 3 SOCIO-ECONOMIC CONDITIONS OF MINORITIES OF INDIA
 CHAPTER 3 SOCIO-ECONOMIC CONDITIONS OF MINORITIES OF INDIA 73 List of Contents S.No. Chapter-3 Socio economic condition of Minorities of India on the Page number basis HDI indicators 3.1 Defination of
Population Stabilization in India: A Sub-State level Analysis
 Published Quarterly Mangalore, South India ISSN 0972-5997 Volume 5, Issue 4; Oct -Dec 2006 Original Article Population Stabilization in India: A Sub-State level Analysis Authors Brijesh C. Purohit Advisor,
Poverty in the Third World
 11. World Poverty Poverty in the Third World Human Poverty Index Poverty and Economic Growth Free Market and the Growth Foreign Aid Millennium Development Goals Poverty in the Third World Subsistence definitions
Narrative I Attitudes towards Community and Perceived Sense of Fraternity
 1 Narrative I Attitudes towards Community and Perceived Sense of Fraternity One of three themes covered by the Lok Survey Project is attitude towards community, fraternity and the nature of solidarity
DEMOGRAPHIC CHANGES AND GROWTH OF POPULATION IN UTTAR PRADESH: TRENDS AND STATUS
 DOI: 10.3126/ijssm.v3i4.15961 DEMOGRAPHIC CHANGES AND GROWTH OF POPULATION IN UTTAR PRADESH: TRENDS AND STATUS Sandeep Kumar Baliyan* Giri Institute of Development Studies (GIDS), Lucknow 226024 *Email:
On Adverse Sex Ratios in Some Indian States: A Note
 CENTRE FOR ECONOMIC REFORM AND TRANSFORMATION School of Management and Languages, Heriot-Watt University, Edinburgh, EH14 4AS Tel: 0131 451 4207 Fax: 0131 451 3498 email: ecocert@hw.ac.uk World-Wide Web:
SRIJAYA gurrudeva.weebly.com
 Development is a complex task. All persons do not have same notion of development. More days of work and better wages.. Landless rural labourer High income, cheap labourers.. Prosperous farmer Rains, Good
ROLE OF PANCHAYATI RAJ ACT AND SSA IN THE DEVELOPMENT OF RURAL LIBRARIES IN MADHYA PRADESH
 ROLE OF PANCHAYATI RAJ ACT AND SSA IN THE DEVELOPMENT OF RURAL LIBRARIES IN MADHYA PRADESH Jayant, Jaswant Singh and Zia, Yasmeen Dept. of Library and Information Science SNGGPG(NUTAN) COLLEGE, BHOPAL
Regional Inequality in India: A Fresh Look. Nirvikar Singh + Laveesh Bhandari Aoyu Chen + Aarti Khare* Revised December 2, 2002.
 Regional Inequality in India: A Fresh Look Nirvikar Singh + Laveesh Bhandari Aoyu Chen + Aarti Khare* Revised December 2, 2002 Abstract There are concerns that regional inequality in India has increased
Socio Economic and Regional Disparities: Some Implications for India
 Int. Journal of Management and Development Studies 5(4): 61-66 (2016) ISSN (Online): 2320-0685. ISSN (Print): 2321-1423 Impact Factor: 0.715 Socio Economic and Regional Disparities: Some Implications for
DISPARITY IN HIGHER EDUCATION: THE CONTEXT OF SCHEDULED CASTES IN INDIAN SOCIETY
 IMPACT: International Journal of Research in Humanities, Arts and Literature (IMPACT: IJRHAL) ISSN(E): 2321-8878; ISSN(P): 2347-4564 Vol. 2, Issue 4, Apr 2014, 35-42 Impact Journals DISPARITY IN HIGHER
International Institute for Population Sciences, Mumbai (INDIA)
") Kunal Keshri (kunalkeshri.lrd@gmail.com) (Senior Research Fellow, e-mail:) Dr. R. B. Bhagat (Professor & Head, Dept. of Migration and Urban Studies) International Institute for Population Sciences, Mumbai
Kunal Keshri (kunalkeshri.lrd@gmail.com) (Senior Research Fellow, e-mail:) Dr. R. B. Bhagat (Professor & Head, Dept. of Migration and Urban Studies) International Institute for Population Sciences, Mumbai
Perspective on Forced Migration in India: An Insight into Classed Vulnerability
 Perspective on in India: An Insight into Classed Vulnerability By Protap Mukherjee* and Lopamudra Ray Saraswati* *Ph.D. Scholars Population Studies Division Centre for the Study of Regional Development
Poverty alleviation programme in Maharashtra
 Poverty alleviation programme in Maharashtra 1. Mr. Dhiraj. R. Ovhal Asst. Prof. NSS College of Commerce & Eco. Tardeo. Mumbai 400034 2. Dr. Deepak. M. Salve The Bharat Education Society s Sant Gadge Maharaj
FACTORS INFLUENCING POVERTY AND THE ROLE OF ECONOMIC REFORMS IN POVERTY REDUCTION
 Journal of Social and Economic Policy, Vol. 11, No. 1, June 2014, pp. 83-91 FACTORS INFLUENCING POVERTY AND THE ROLE OF ECONOMIC REFORMS IN POVERTY REDUCTION N. NARAYANA * Poverty is a situation of helplessness
Visualizing. Rights C E SR. Making Human Rights Accountability More Graphic. Center for Economic and Social Rights. fact sheet no.
 Center for Economic and Social Rights India Making Human Rights Accountability More Graphic This fact sheet is intended to contribute to ongoing monitoring work to hold states accountable for their economic
Political participation and Women Empowerment in India
 Political participation and Women Empowerment in India Dr Satyavrat Singh Rawat Associate Professor, Department of Economics NREC College Khurja Abstract Political participation is a mechanism which enables
MIGRATION AND URBAN POVERTY IN INDIA
 1 Working Paper 414 MIGRATION AND URBAN POVERTY IN INDIA SOME PRELIMINARY OBSERVATIONS William Joe Priyajit Samaiyar U. S. Mishra September 2009 2 Working Papers can be downloaded from the Centre s website
NCERT Class 9th Social Science Economics Chapter 3: Poverty as a Challenge
 NCERT Class 9th Social Science Economics Chapter 3: Poverty as a Challenge Question 1. Describe how poverty line is estimated in India. A common method used to measure poverty is based on income or consumption
Migrant Child Workers: Main Characteristics
 Chapter III Migrant Child Workers: Main Characteristics The chapter deals with the various socio, educational, locations, work related and other characteristics of the migrant child workers in order to
Inequality in Housing and Basic Amenities in India
 MPRA Munich Personal RePEc Archive Inequality in Housing and Basic Amenities in India Rama Pal and Neil Aneja and Dhruv Nagpal Indian Institute of Technology Bobmay, Indian Institute of Technology Bobmay,
Human Development Indices and Indicators: 2018 Statistical Update. Eritrea
 Human Development Indices and Indicators: 2018 Statistical Update Briefing note for countries on the 2018 Statistical Update Introduction Eritrea This briefing note is organized into ten sections. The
The Human Population 8
 8 The Human Population Overview of Chapter 8 The Science of Demography Demographics of Countries Demographic Stages Age Structure Population and Quality of Life Reducing the Total Fertility Rate Government
Openness and Poverty Reduction in the Long and Short Run. Mark R. Rosenzweig. Harvard University. October 2003
 Openness and Poverty Reduction in the Long and Short Run Mark R. Rosenzweig Harvard University October 2003 Prepared for the Conference on The Future of Globalization Yale University. October 10-11, 2003
SDG-10: Reduce inequalities within the States
 SDG-10: Reduce inequalities within the States 10.1 Empirical evidence using cross-country income data - the most recent and comprehesive covering 121 countries between 1967 and 2011- concludes that the
Human Development Indices and Indicators: 2018 Statistical Update. Pakistan
 Human Development Indices and Indicators: 2018 Statistical Update Briefing note for countries on the 2018 Statistical Update Introduction Pakistan This briefing note is organized into ten sections. The
A lot of attention had been focussed in the past
 Chapter 7 CONCLUSION Regional economic disparities are a global phenomenon. These economic disparities among different regions or nations of the world have been an object of considerable concern to many,
Urban Women Workers. A Preliminary Study. Kamla Nath
 Urban Women Workers A Preliminary Study Kamla Nath Women constitute nearly a third of the working force in India. In 1961, out of a total working force of 188.4 million, 59.4 million or 31 per cent were
Corrupt States: Reforming Indian Public Services in the Digital Age
 Corrupt States: Reforming Indian Public Services in the Digital Age Jennifer Bussell Lyndon B. Johnson School of Public Affairs University of Texas at Austin Delivering Public Services Public service provision
Does Decentralization Matters For Human Development?
 1 Does Decentralization Matters For Human Development? J. Nagaraj Tejbir Singh Soni 2 Does Decentralization Matters For Human Development? Abstract: The objective of this paper is to answer the question
Poverty profile and social protection strategy for the mountainous regions of Western Nepal
 October 2014 Karnali Employment Programme Technical Assistance Poverty profile and social protection strategy for the mountainous regions of Western Nepal Policy Note Introduction This policy note presents
THE SLOW DECLINE IN THE INFANT MORTALITY RATE IN INDIA
 HEALTH & DEVELOPMENT RESEARRCH THE SLOW DECLINE IN THE INFANT MORTALITY RATE IN INDIA can governance be an explanation? INTRODUCTION Indrani Gupta and Mayur Trivedi The Infant Mortality Rate (IMR) remains
Human Development in State of New Andhra Pradesh- Emerging Issues and Policy Perspectives
 RESEARCH ARTCLE Human Development in State of New Andhra Pradesh- Emerging Issues and Policy Perspectives Dr. Guest faculty, Dept. of Economics,AcharyaNagarjuna University, Guntur ABSTRACT K. KISHORE BABU
Human Development Indices and Indicators: 2018 Statistical Update. Indonesia
 Human Development Indices and Indicators: 2018 Statistical Update Briefing note for countries on the 2018 Statistical Update Introduction Indonesia This briefing note is organized into ten sections. The
Reducing Poverty in the Arab World Successes and Limits of the Moroccan. Lahcen Achy. Beirut, Lebanon July 29, 2010
 Reducing Poverty in the Arab World Successes and Limits of the Moroccan Experience Lahcen Achy Beirut, Lebanon July 29, 2010 Starting point Morocco recorded an impressive decline in monetary poverty over
PANCHAYATI RAJ AND POVERTY ALLEVIATION IN WEST BENGAL: SUMMARY OF RESEARCH FINDINGS. Pranab Bardhan and Dilip Mookherjee.
 PANCHAYATI RAJ AND POVERTY ALLEVIATION IN WEST BENGAL: SUMMARY OF RESEARCH FINDINGS Pranab Bardhan and Dilip Mookherjee December 2005 The experience of West Bengal with respect to Panchayat Raj has been
Research Innovator: International Multidisciplinary Peer-Reviewed Journal ISSN: Print: ISSN: Online:
 Basic Infrastructural Development and Improvement of Social-Economic Indicator in Madhya Pradesh Dr. Rajesh Prasad Tiwari Professor of Economics, Sharda P.G. College, Sarla Nagar, Maihar, Dist. Satna (M.P.)
A PREVENTIVE APPROACH TO AVOID POVERTY FROM SOCIETY
 A PREVENTIVE APPROACH TO AVOID POVERTY FROM SOCIETY SUNITA RANI Research Scholar, department of economics CDLU, SIRSA (India) ABSTRACT The main reason of undevloping country is poverty. India is also one
IX Geography CHEPTER 6 : POPULATION
 IX Geography CHEPTER 6 : POPULATION Introduction: The people are important to develop the economy and society. The people make and use resources and are themselves resources with varying quality. Resources,
Human Development Indices and Indicators: 2018 Statistical Update. Cambodia
 Human Development Indices and Indicators: 2018 Statistical Update Briefing note for countries on the 2018 Statistical Update Introduction Cambodia This briefing note is organized into ten sections. The
Economic Geography Chapter 10 Development
 Economic Geography Chapter 10 Development Development: Key Issues 1. Why Does Development Vary Among Countries? 2. Where Are Inequalities in Development Found? 3. Why Do Countries Face Challenges to Development?
A Multi-dimensional Framework for Understanding, Measuring and Promoting Inclusive Economies Growth and Poverty Reduction: India s Experience
 A Multi-dimensional Framework for Understanding, Measuring and Promoting Inclusive Economies Growth and Poverty Reduction: India s Experience Shashanka Bhide Madras Institute of Development Studies, Chennai
Contemporary Human Geography, 2e. Chapter 9. Development. Lectures. Karl Byrand, University of Wisconsin-Sheboygan Pearson Education, Inc.
 Contemporary Human Geography, 2e Lectures Chapter 9 Development Karl Byrand, University of Wisconsin-Sheboygan 9.1 Human Development Index Development The process of improving the material conditions of
Or7. The Millennium Development Goals Report
 Or7 The Millennium Development Goals Report 2009 1 Goal 1 Eradicate extreme poverty and hunger Target 1.A Halve, between 1990 and 2015, the proportion of people whose income is less than one dollar a day
RECENT CHANGING PATTERNS OF MIGRATION AND SPATIAL PATTERNS OF URBANIZATION IN WEST BENGAL: A DEMOGRAPHIC ANALYSIS
 46 RECENT CHANGING PATTERNS OF MIGRATION AND SPATIAL PATTERNS OF URBANIZATION IN WEST BENGAL: A DEMOGRAPHIC ANALYSIS Raju Sarkar, Research Scholar Population Research Centre, Institute for Social and Economic
Human development in China. Dr Zhao Baige
 Human development in China Dr Zhao Baige 19 Environment Twenty years ago I began my academic life as a researcher in Cambridge, and it is as an academic that I shall describe the progress China has made
GLOBALIZATION, DEVELOPMENT AND POVERTY REDUCTION: THEIR SOCIAL AND GENDER DIMENSIONS
 TALKING POINTS FOR THE EXECUTIVE SECRETARY ROUNDTABLE 1: GLOBALIZATION, DEVELOPMENT AND POVERTY REDUCTION: THEIR SOCIAL AND GENDER DIMENSIONS Distinguished delegates, Ladies and gentlemen: I am pleased
June Technical Report: India State Survey. India State Survey Research Program
 June 2016 Technical Report: India State Survey India State Survey Research Program TABLE OF CONTENTS Overview... 3 Sampling Methodology... 3 Target Population/Coverage... 3 Sampling Frame... 3 Stratification/Sample
Halve, between 1990 and 2015, the proportion of people whose income is less than $1 a day
 6 GOAL 1 THE POVERTY GOAL Goal 1 Target 1 Indicators Target 2 Indicators Eradicate extreme poverty and hunger Halve, between 1990 and 2015, the proportion of people whose income is less than $1 a day Proportion
INCLUSIVE GROWTH IN INDIA: PAST PERFORMANCE AND FUTURE PROSPECTS
 INCLUSIVE GROWTH IN INDIA: PAST PERFORMANCE AND FUTURE PROSPECTS Dr.K. Selvakumar Asst. Professor, Dept. of Commerce, Madurai Kamaraj University College, Alagarkoil Road, Madurai Introduction Inclusive
Tribal Women Experiencing Panchayati Raj Institution in India with Special Reference to Arunachal Pradesh
 IOSR Journal Of Humanities And Social Science (IOSR-JHSS) Volume 22, Issue 1, Ver. 2 (January 2017) PP 46-50 e-issn: 2279-0837, p-issn: 2279-0845. www.iosrjournals.org Tribal Women Experiencing Panchayati
There is a seemingly widespread view that inequality should not be a concern
 Chapter 11 Economic Growth and Poverty Reduction: Do Poor Countries Need to Worry about Inequality? Martin Ravallion There is a seemingly widespread view that inequality should not be a concern in countries
Women and Wage Discrimination in India: A Critical Analysis March
 International Journal of Humanities and Social Science Invention ISSN (Online): 2319 7722, ISSN (Print): 2319 7714 Volume 2 Issue 4 ǁ April. 2013ǁ PP.06-12 Women and Wage Discrimination in India: A Critical
POVERTY BACKGROUND PAPER
 CAPE India, Supplementary Linked Document 3 POVERTY BACKGROUND PAPER 1. This report provides an overview of poverty trends in India in recent years, highlighting the diversity of these trends across India
POVERTY AND INEQUALITY IN SOUTH WEST BENGAL: AN OVERVIEW
 Jharkhand Journal of Social Development, Vol. V, No.1 & 2, 2013 ISSN 0974 651x POVERTY AND INEQUALITY IN SOUTH WEST BENGAL: AN OVERVIEW Rajarshi Majumder Associate Professor, Department of Economics, University
Prologue Djankov et al. (2002) Reinikka & Svensson (2004) Besley & Burgess (2002) Epilogue. Media and Policy. Dr. Kumar Aniket
 Reinikka & Svensson (2004) Besley & Burgess (2002) Epilogue. Media and Policy. Dr. Kumar Aniket") Media and Policy EC307 ECONOMIC DEVELOPMENT Dr. Kumar Aniket University of Cambridge & LSE Summer School Lecture 2 created on June 6, 2010 READINGS Tables and figures in this lecture are taken from: Djankov,
Media and Policy EC307 ECONOMIC DEVELOPMENT Dr. Kumar Aniket University of Cambridge & LSE Summer School Lecture 2 created on June 6, 2010 READINGS Tables and figures in this lecture are taken from: Djankov,
GROWTH AND INEQUALITY OF WAGES IN INDIA: RECENT TRENDS AND PATTERNS
 The Indian Journal of Labour Economics, Vol. 50, No. 4, 2007 GROWTH AND INEQUALITY OF WAGES IN INDIA: RECENT TRENDS AND PATTERNS Vinoj Abraham * The analysis of National Sample Survey (NSS) unit level
Ghana Lower-middle income Sub-Saharan Africa (developing only) Source: World Development Indicators (WDI) database.
 Source: World Development Indicators (WDI) database.") Knowledge for Development Ghana in Brief October 215 Poverty and Equity Global Practice Overview Poverty Reduction in Ghana Progress and Challenges A tale of success Ghana has posted a strong growth performance
Knowledge for Development Ghana in Brief October 215 Poverty and Equity Global Practice Overview Poverty Reduction in Ghana Progress and Challenges A tale of success Ghana has posted a strong growth performance
WELCOME! Professors Jay Aronson, Bernardine Dias, Joe Mertz and Rahul Tongia Fall 2007
 WELCOME! Professors Jay Aronson, Bernardine Dias, Joe Mertz and Rahul Tongia Fall 2007 Instructor Introductions Aronson and Mertz are main instructors for undergraduate version Dias and Tongia are main
Rural-Urban Partnership For Inclusive Growth In India
 ISSN: 2278 0211 (Online) Rural-Urban Partnership For Inclusive Growth In India Amar Kumar Chaudhary Registrar, Ranchi University, Ranchi, India Abstract: It is rightly appropriate that the academicians,
Chapter 6: Human Population & Its Impact How many is too many? 7 billion currently; 1.6 mill. more each week ~2.4 bill. more by 2050 Developing 82%
 Chapter 6: Human Population & Its Impact How many is too many? 7 billion currently; 1.6 mill. more each week ~2.4 bill. more by 2050 Developing 82% of population Developed high resource use; (more coming
The business case for gender equality: Key findings from evidence for action paper
 The business case for gender equality: Key findings from evidence for action paper Paris 18th June 2010 This research finds critical evidence linking improving gender equality to many key factors for economic
Dimensions of rural urban migration
 CHAPTER-6 Dimensions of rural urban migration In the preceding chapter, trends in various streams of migration have been discussed. This chapter examines the various socio-economic and demographic aspects
Levels and Dynamics of Inequality in India: Filling in the blanks
 Levels and Dynamics of Inequality in India: Filling in the blanks Peter Lanjouw (Vrije University Amsterdam) Summary of Findings from the India Component of the UNU-WIDER Inequality in the Giants Project
Calculating Economic Freedom
 2 Calculating Economic Freedom Laveesh Bhandari 1 Background As discussed in the previous chapter, the term economic freedom can have many connotations and depending upon which one is used the measurement
and with support from BRIEFING NOTE 1
 and with support from BRIEFING NOTE 1 Inequality and growth: the contrasting stories of Brazil and India Concern with inequality used to be confined to the political left, but today it has spread to a
Macroeconomics and Gender Inequality Yana van der Meulen Rodgers Rutgers University
 Macroeconomics and Gender Inequality Yana van der Meulen Rodgers Rutgers University International Association for Feminist Economics Pre-Conference July 15, 2015 Organization of Presentation Introductory
PRESS RELEASE. NCAER releases its N-SIPI 2018, the NCAER-STATE INVESTMENT POTENTIAL INDEX
 For more information, please contact: Shilpi Tripathi at +91-11-23452605, stripathi@ncaer.org Sudesh Bala at +91-11-2345-2722, sbala@ncaer.org PRESS RELEASE NCAER releases its N-SIPI 2018, the NCAER-STATE
CASTE BASED LABOUR MARKET DISCRIMINATION IN RURAL INDIA A Comparative Analysis of some Developed and Underdeveloped States
 [VOLUME 5 I ISSUE 2 I APRIL JUNE 2018] e ISSN 2348 1269, Print ISSN 2349-5138 http://ijrar.com/ Cosmos Impact Factor 4.236 CASTE BASED LABOUR MARKET DISCRIMINATION IN RURAL INDIA A Comparative Analysis
SHORT ANSWER TYPE QUESTIONS [3 MARKS]
![SHORT ANSWER TYPE QUESTIONS [3 MARKS]](/thumbs/76/73782979.jpg "SHORT ANSWER TYPE QUESTIONS [3 MARKS]") DEVELOPMENT SHORT ANSWER TYPE QUESTIONS [3 MARKS] 1. What is meant by economic development? What are the two bases of measuring economic development of a country? Economic development can be defined as
DEVELOPMENT SHORT ANSWER TYPE QUESTIONS [3 MARKS] 1. What is meant by economic development? What are the two bases of measuring economic development of a country? Economic development can be defined as
Who Put the BJP in Power?
 Decoding the Government s Mandate Center for the Advanced Study of India, University of Pennsylvania August 7, 2014 Orienting Questions Introduction Orienting Questions BJP s Overall Performance BJP won
Three Terms Congress rule in Assam Vs. Three Terms BJP rule in Gujarat, MP & Chhattisgarh
 Three Terms Congress rule in Assam Vs. Three Terms BJP rule in Gujarat, MP & Chhattisgarh Comparative Study on Socio-Economic Achievements By Ram Prasad Tripathy Dr. Syama Prasad Mookerjee Research Foundation
Population & Migration
 Population & Migration Population Distribution Humans are not distributed evenly across the earth. Geographers identify regions of Earth s surface where population is clustered and regions where it is
Test Bank for Economic Development. 12th Edition by Todaro and Smith
 Test Bank for Economic Development 12th Edition by Todaro and Smith Link download full: https://digitalcontentmarket.org/download/test-bankfor-economic-development-12th-edition-by-todaro Chapter 2 Comparative
OIC/COMCEC-FC/32-16/D(5) POVERTY CCO BRIEF ON POVERTY ALLEVIATION
 POVERTY CCO BRIEF ON POVERTY ALLEVIATION") OIC/COMCEC-FC/32-16/D(5) POVERTY CCO BRIEF ON POVERTY ALLEVIATION COMCEC COORDINATION OFFICE October 2017 1990 1991 1992 1993 1994 1995 1996 1997 1998 1999 2000 2001 2002 2003 2004 2005 2006 2007 2008
OIC/COMCEC-FC/32-16/D(5) POVERTY CCO BRIEF ON POVERTY ALLEVIATION COMCEC COORDINATION OFFICE October 2017 1990 1991 1992 1993 1994 1995 1996 1997 1998 1999 2000 2001 2002 2003 2004 2005 2006 2007 2008
vi. rising InequalIty with high growth and falling Poverty
 43 vi. rising InequalIty with high growth and falling Poverty Inequality is on the rise in several countries in East Asia, most notably in China. The good news is that poverty declined rapidly at the same
Scaling Up Poverty Reduction Conceptual Framework
 Conceptual Framework Table of Contents 1. BACKGROUND 3 2. OBJECTIVES 4 3. STRATEGIC PILLARS 6 3.1 Investment climate 6 3.2 Social inclusion 7 4. IMPLEMENTATION FACTORS 10 5. QUESTIONS FOR STUDY: 12 Conceptual
REGIONAL INEQUALITY OF SOCIAL SECTOR DEVELOPMENT IN INDIA
 REGIONAL INEQUALITY OF SOCIAL SECTOR DEVELOPMENT IN INDIA Hemanta Saikia* Debraj Roy College, Golaghat, Assam-78562 (India); Email: hemantaassam@yahoo.com *Address for correspondence Biographical note
Demography. Demography is the study of human population. Population is a dynamic open systems with inputs, processes and outputs.
 Population Demography Demography is the study of human population. Population is a dynamic open systems with inputs, processes and outputs. This means that change constantly occurs in population numbers,
Full file at
 Chapter 2 Comparative Economic Development Key Concepts In the new edition, Chapter 2 serves to further examine the extreme contrasts not only between developed and developing countries, but also between
Trade, Growth and Poverty in the context of Lao PDR
 Trade, Growth and Poverty in the context of Lao PDR Dr. Yan Wang Senior Economist The World Bank Ywang2@worldbank.Org Prepared for the joint workshop on Lao PDR: Trade and The Integrated Framework Vientiane
Chapter 6. A Note on Migrant Workers in Punjab
 Chapter 6 A Note on Migrant Workers in Punjab Yoshifumi Usami Introduction An important aspect of Industry-Agriculture, or Urban-Rural Linkage, is that of through labor market. Unlike the backward and
Where Does Level of Development Vary by Gender?
 288 The Cultural Landscape FIGURE 9-15 Developing regions with low HDIs: South Asia and sub-saharan Africa. (left) Sugarcane is transported by rickshaw to a wholesale market in Hyderabad, India. (right)
Democracy in India: A Citizens' Perspective APPENDICES. Lokniti : Centre for the Study of Developing Societies (CSDS)
") Democracy in India: A Citizens' Perspective APPENDICES Appendix 1: The SDSA II (India component) covered states of India. All major states were included in the sample. The smaller states of North East
Democracy in India: A Citizens' Perspective APPENDICES Appendix 1: The SDSA II (India component) covered states of India. All major states were included in the sample. The smaller states of North East
Estimates of Workers Commuting from Rural to Urban and Urban to Rural India: A Note
 WP-2011-019 Estimates of Workers Commuting from Rural to Urban and Urban to Rural India: A Note S Chandrasekhar Indira Gandhi Institute of Development Research, Mumbai September 2011 http://www.igidr.ac.in/pdf/publication/wp-2011-019.pdf
How does development vary amongst regions? How can countries promote development? What are future challenges for development?
 Chapter 9- Development How does development vary amongst regions? How can countries promote development? What are future challenges for development? Human Development Index (HDI) Development process of
Public Affairs Index (PAI)
") Public Affairs Index (PAI) A Closer look at Andhra Pradesh NOTE: All the data and rankings presented in PAI represent the united Andhra Pradesh (before the bifurcation) Contents of the Presentation About
Public Affairs Index (PAI) A Closer look at Andhra Pradesh NOTE: All the data and rankings presented in PAI represent the united Andhra Pradesh (before the bifurcation) Contents of the Presentation About
1. Global Disparities Overview
 1. Global Disparities Overview The world is not an equal place, and throughout history there have always been inequalities between people, between countries and between regions. Today the world s population
9.1 Human Development Index Development improving the material conditions diffusion of knowledge and technology Measure by HDI
 9: Development 9.1 Human Development Index Development improving the material conditions diffusion of knowledge and technology Measure by HDI Standard of living Access to knowledge Life expectancy 9.1
Does Political Reservation for Minorities Affect Child Labor? Evidence from India. Elizabeth Kaletski University of Connecticut
 Does Political Reservation for Minorities Affect Child Labor? Evidence from India Elizabeth Kaletski University of Connecticut Nishith Prakash University of Connecticut Working Paper 2014-12 May 2014 365
OXFAM IN ACTION. UN My World Survey - May 2013 Summary Results from India INTRODUCTION OXFAM INDIA S ROLE IN UN MY WORLD SURVEY INDIA
 OXFAM IN ACTION UN My World Survey - May 2013 Summary Results from India NO. 1 SEPTEMBER, 2015 INTRODUCTION My World is a global survey by the UN asking people what they want for a better future. The significance
United Nations Development Assistance Framework
 United Nations SRI LANKA United Nations Development Assistance Framework UN Photo / Evan Schneider UN / Neomi UN Photo / Martine Perret UNICEF UNITED NATIONS IN SRI LANKA Working together for greater impact
Does Migration Improves Indian Women s Health and Knowledge of AIDS
 Does Migration Improves Indian Women s Health and Knowledge of AIDS Research Paper for Oral presentation at 2004 Annual Meeting of Population Association of America April 1-3, 2004 Boston, USA By Praween
Economic and Social Council
 United Nations Economic and Social Council Distr.: General 27 December 2001 E/CN.3/2002/27 Original: English Statistical Commission Thirty-third session 5-8 March 2002 Item 7 (f) of the provisional agenda*