STUDY Russia s and the EU s sanctions: economic and trade effects, compliance and the way forward
|
|
|
- Erika Spencer
- 6 years ago
- Views:
Transcription
1


2 DIRECTORATE-GENERAL FOR EXTERNAL POLICIES POLICY DEPARTMENT STUDY Russia s and the EU s sanctions: economic and trade effects, compliance and the way forward ABSTRACT This report summarises empirical facts about the economic impact of the EU sanctions against Russia and the Russian countersanctions, both implemented in the summer of The observed decline in trade volumes between the EU and Russia is not only due to the sanctions, but also other economic factors, such as the downturn of the Russian economy, largely caused by the falling oil price and the ensuing ruble depreciation. Furthermore, empirical evidence suggests that European and Russian companies alike managed to partly divert trade flows to other international markets in response to the deteriorating trade relationships. Overall trade diversion, however, cannot nearly compensate for losses of EU exports to Russia and thus mitigate the economy-wide negative impacts. Finally, descriptive evidence and additional information seem to indicate that compliance with the sanctions was partly circumvented right after the implementation of the sanctions in 2014, in particular for agri-food goods via countries of the Eurasian Economic Union. Legal trade diversion through countries unaffected by the sanctions has also taken place. It is important to emphasise that this study does not assess the political costs or effectiveness of the sanctions, but merely analyses potential economic costs caused by all sanction measures in place. EP/EXPO/B/INTA/2017/11 October PE European Union, 2017 EN
3 Policy Department, Directorate-General for External Policies This paper was requested by the European Parliament's Committee on International Trade. English-language manuscript was completed on 20 September Printed in Belgium. Authors: Dr Oliver FRITZ, WIFO, Österreichisches Institut für Wirtschaftsforschung, Vienna (Austria) Dr Elisabeth CHRISTEN, WIFO, Österreichisches Institut für Wirtschaftsforschung, Vienna (Austria) Dr Franz SINABELL, WIFO, Österreichisches Institut für Wirtschaftsforschung, Vienna (Austria) Dr Julian HINZ, Kiel Institute for the World Economy, Kiel (Germany). Official Responsible: Mario DAMEN. Editorial Assistants: Jakub PRZETACZNIK and Elina STERGATOU. Feedback of all kind is welcome. Please write to: To obtain copies, please send a request to: poldep-expo@europarl.europa.eu. This paper will be published on the European Parliament's online database, 'Think tank'. The content of this document is the sole responsibility of the author and any opinions expressed therein do not necessarily represent the official position of the European Parliament. It is addressed to the Members and staff of the EP for their parliamentary work. Reproduction and translation for non-commercial purposes are authorised, provided the source is acknowledged and the European Parliament is given prior notice and sent a copy. ISBN: (pdf) ISBN: (paper) doi: / (pdf) doi: / (paper) Catalogue number: QA EN-N (pdf) Catalogue number: QA EN-C (paper)
4 Table of contents Russia s and the EU s sanctions: economic and trade effects, compliance and the way forward 1 Economic relationships between Russia and the EU in times of sanctions and economic downturn The history of EU and Russian economic sanctions Multiple factors weakening the Russian economy Recent development of trade relationships between Russia and the EU Wider economic impacts of the sanctions and the economic crisis in Russia Additional findings from the literature on sanction impacts Contribution of this report 14 2 Restrictions on imports of agri-food products International trade flows affected by the import ban Evidence for trade diversion Evidence for non-compliance 26 3 Estimation of sanction-induced trade effects Empirical approach: assessing the impact of the sanctions and limitations of the methodology Model results: the impacts on international trade flows Firm-level evidence on trade diversion from French firms 37 4 Conclusions 39 5 References 42 6 Appendix Details on the sectoral breakdown Gravity model of international trade and counterfactual simulation Workshop programme Workshop presentation slides 50 3
5 Policy Department, Directorate-General for External Policies 1 Economic relationships between Russia and the EU in times of sanctions and economic downturn 1.1 The history of EU and Russian economic sanctions In 2014, the political conflict between Russia and Western countries, which erupted due to the conflict in East Ukraine and Russia's destabilisation of Ukraine and annexation of the Crimea and Sevastopol, gave way to economic sanctions by the EU, USA and other Western countries against Russia. Restrictive measures were imposed gradually: In the spring of 2014 decisions were made concerning travel restrictions and asset freezes for selected individuals; an import ban on goods originating from Crimea or Sevastopol followed later on, before a comprehensive package of targeted economic sanctions was adopted 29 July 2014( 1 ). It includes measures to restrict Russia's access to EU capital markets, an embargo on the imports and exports of arms and related material from/to Russia, a prohibition of exports of dual use goods and technology for military use in Russia as well as of products that are destined for deep water oil exploration and production, arctic oil exploration or production and shale oil projects in Russia. In contrast to the USA, existing export contracts in the EU were exempted; the sanctions thus concerned only new contracts closed after the decisions had been made by the EU Council. They were extended several times since then, the latest such extension decided upon in June 2017 for the sanctions to be in force until 31 January Responding to the Western sanctions in early August 2014, Russia prohibited imports of certain agri-food goods from countries that imposed sanctions on Russia, in particular the USA, EU, Canada, Australia and Norway (extended later on to Albania, Montenegro, Iceland, Liechtenstein and the Ukraine). This import ban includes beef and pork of all kinds, poultry and poultry products, smoked foodstuffs and sausages, milk and milk products including raw milk and all foodstuffs containing milk as well as fish, vegetables and fruits( 2 ). It is important to stress that the EU sanctions concern only a very small group of products, exhibiting a minor share in total EU exports to Russia. The Russian embargo, on the other hand, seems more substantial both for the EU, with Russia being the second most important destination market for agri-food goods, and Russia since the EU is its largest supplier of agri-food products (see chapter 2 for further details). 1.2 Multiple factors weakening the Russian economy Whether and to what extent these sanctions by the Western economies and Russian retaliatory measures have impacted the Russian economy over the last three years is hard to assess since at the same time the sanctions came into force when the oil price, a major source of government revenues in Russia, dropped considerably, as Figure 1 depicts. This negative oil price shock adversely affected output growth and exchange rates (Rautava, J.; Ito, K.; Tuzova, Y. and Qayum, F.). Many economists have thus argued that these multiple shocks caused the economic problems Russia has faced since 2013/2014. A detailed portrait of the various roots of Russia's recession in the wake of the economic crisis 2008/2009 and the additional shocks of 2014 international sanctions and sharp decline in the international oil price is summarised by 1 See (Moret, E. et al.) and (Dreyer, I. and Luengo-Cabrera, J.) for a detailed presentation of the content and timeline of diplomatic decisions. 2 Products used specifically for the production of baby food are excluded from the ban. 4
6 Russia s and the EU s sanctions: economic and trade effects, compliance and the way forward (Dabrowski, M.). In the context of the 2014 events the Russian economy experienced (Tuzova, Y. and Qayum, F.; Nelson, R.; Kholodilin, K. et al.): an economic slowdown, with GDP growth slowing to 0.7 % in 2014, before contracting by 2.8 % in 2015; a massive depreciation of the ruble by more than 50 % against the US dollar in 2015; a substantial increase in the inflation rate, especially with respect to food prices (Gros, D. and Di Salvo, M.); budgetary pressure; a substantial outflow of capital, deteriorating Russia's capital and financial account balance. Figure 1: Economic trends in Russia since 2013 Percentage change against the previous year GDP (real) Industrial output (real) Agricultural output (real) 1.qu. 2.qu. 3.qu. 4.qu. 1.qu. 2.qu. 3.qu. 4.qu. 1.qu. 2.qu. 3.qu. 4.qu. 1.qu. 2.qu. 3.qu. 4.qu Percentage change against the previous year Rubel/USD Crude oil price (Brent - USD/barrel) 1.qu. 2.qu. 3.qu. 4.qu. 1.qu. 2.qu. 3.qu. 4.qu. 1.qu. 2.qu. 3.qu. 4.qu. 1.qu. 2.qu. 3.qu. 4.qu Source: wiiw Monthly Database, Russian Federal State Statistics Service, WDS - WIFO Data System, Macrobond. In addition, sanctions restricted Russia's access to international financial markets. According to (Dreyer, I. and Luengo-Cabrera, J.) the magnitude of capital outflows in 2014 was more severe than the immediate stop of capital inflows in the wake of the recession 2008/2009. Moreover, agricultural production deteriorated in late 2014 but gained pace again in early 2015 due to the shortages of agri-food products. 5
7 Policy Department, Directorate-General for External Policies In contrast, industrial output, which came to a halt in 2015, has started to resume only at the beginning of In the course of 2016 the Russian economy began to stabilise and GDP deteriorated only by 0.2 %, even though the sanctions remained in place. Moreover, the investment climate has been improving slightly, as the Russian government managed to sell new bonds on international capital markets and capital outflows slowed. According to (Nelson, R.) inward FDI into Russia, which came to a halt in 2014 and 2015, began to resume slightly in However, data for the EU FDI stock in Russia is only available until 2015 and does not yet depict this upward trend. According to the IMF forecasts, Russia s economy is projected to experience modest growth of 1.4 % in 2017 (EU 1.9 %) and 1.4 % in 2018 (EU 1.9 %) (World Economic Outlook Update, July 2017), as the economy is benefitting from the rising oil price, which increased from 43.7 USD/barrel in 2016 to 53.8 USD/barrel in the first quarter Recent development of trade relationships between Russia and the EU Disregarding the influence of other factors, all sanctions potentially entail severe economic consequences for the EU and Russia alike, given a high and steadily increasing volume of trade between these two economic areas in previous years. With a share of 7.7 % in total exports of the EU (2013, without deliveries within the EU) Russia was, after the USA, Switzerland and China, the fourth largest trading partner of the EU. On the other hand, with 42.4 % of total exports (2013) the EU was Russia's most important trading partner. As early as in 2013, and thus before the sanctions had been in force, EU trade relations with Russia suffered significantly from the economic downturn in Russia. The exports stagnated, while they had increased significantly in each of the previous years. As a consequence of the sanctions, but also due to other external factors weakening the Russian economy, EU exports to Russia declined by 20.7 % annually between 2013 and 2016, while they had increased by 20.0 % per year between 2009 and Providing descriptive statistics on monthly UN COMTRADE data( 3 ), Figure 2 separates EU countries according to their annual changes in exports to Russia being above or below the EU average for 2013/2016. No clear pattern in terms of country size or geography arises with respect to relative export losses. Even though two smaller economies( 4 ), Denmark (-28.9 %) and Austria (-27.9 %) experienced the strongest relative export declines in that period, the drop of Russian exports of larger and more distant economies like Spain and the UK was also above EU average. Not surprisingly the largest EU economies (Germany, France, and Italy) had to deal with the highest export losses in absolute terms. 3 Trade data reported in this study is sourced from monthly UN COMTRADE. The advantage of this dataset over other ones, such as Eurostat s COMEXT, is the availability of and consistency with other countries data, as needed in the econometric analysis below. The correlation between the reported numbers in COMTRADE and COMEXT is, at the lowest disaggregation CN6, and at the level of sectors as described in chapter 3. Moreover, monthly UN COMTRADE data is partly drawn from Eurostat's database. 4 The island economies of Malta and Cyprus had even higher export decline rates but are very specific cases in terms of the structure of their economies and trade patterns. 6

8 Russia s and the EU s sanctions: economic and trade effects, compliance and the way forward Figure 2: Changes in EU exports to Russia over the period 2013 to 2016 Source: UN Monthly COMTRADE, WIFO calculations. Proximity to Russia, but also historically formed economic relationships to Russia do matter in terms of impact when country-specific export portfolios are taken into account. The shares of Russia in total exports are significantly higher in Central and Eastern European as well as in Baltic countries, as Figure 3 shows. In 2013 more than 40 % of total exports of Lithuania, Latvia and Estonia were delivered to Russia. Consequently, as a result of the sanctions and the economic slowdown in Russia, export shares of these countries declined considerably and much more than for the EU as a whole (-3.2 percentage points) between 2013 and

9 Policy Department, Directorate-General for External Policies Figure 3: EU export shares to Russia relative to total exports in 2013 and changes over the period 2013 to 2016 Source: UN Monthly COMTRADE, WIFO calculations. Figure 4 complements the picture in terms of trade impacts by considering both export and import losses observed in the EU trade relations with Russia between 2013 and It also illustrates the heterogeneity of these impacts caused by sanctions, Russian retaliatory measures and economic slowdown in Russia across Member Countries. While Germany is most affected in absolute terms, exports to and imports from Russia halved in most of the EU countries over the last three years. The decline in nominal import values was certainly influenced by the devaluation of the Russian ruble, but may also reflect the aforementioned general deterioration of trade relationships between Russia and the EU. 8
10 Russia s and the EU s sanctions: economic and trade effects, compliance and the way forward Figure 4: EU trade relations with Russia: changes in exports to and imports from Russia in billion USD over the period 2013 to 2016 Imports Exports DEU ITA POL NLD FRA GBR FIN BEL LTU CZE AUT ESP SWE SVK HUN DNK EST ROU LVA SVN IRL BGR GRC HRV PRT Source: UN Monthly COMTRADE, WIFO calculations. Figures for Luxembourg, Cyprus and Malta too small to show. Table 1 highlights the significant decline in total exports to Russia over the period 2014 to 2016 in more detail by displaying semi-annual export patterns. In the second half of 2014 EU exports to Russia declined by 17.8 % and thus fell to a value of USD 66.5 bn. In most of the EU countries the reduction in exports to Russia intensified in the last quarter of 2014 and even more so in In the first six months of 2015 total EU exports to Russia decreased by 45 %, similar negative impacts on exports can be observed for the Czech Republic, Great Britain and Austria. However, countries like Estonia, Spain, Denmark, Lithuania and France experienced even greater reductions in exports to Russia in the first two quarters of the year, while the decline in exports of Hungary, Italy, Poland and Germany was around 40 % and slightly less (around 35 %) in Latvia and Slovenia. In 2016 exports to Russia still show a declining trend in most of the EU countries and began to recover only slightly for Belgium, France and Poland. A similar hit to exports since mid-2014 can be observed for the USA (-17.4 %). However, US trade flows were less affected compared to the EU in 2015, but dropped significantly stronger in 2016 (-18.2 %; EU -3.2 %). 9
11 Policy Department, Directorate-General for External Policies Table 1: Recent developments of exports to Russia HY 2.HY Year 1.HY 2.HY Year 1.HY 2.HY Year 1.HY 2.HY Year Percentage changes against the previous year AUT BEL BGR CYP CZE DEU DNK ESP EST FIN FRA GBR GRC HRV HUN IRL ITA LTU LUX LVA MLT NLD POL PRT ROU SVK SVN SWE EU CHE USA ARM BLR KAZ MKD SRB TUR Source: UN Monthly COMTRADE, WIFO calculations. Regarding the export pattern by sectors, Figure 5 shows that manufactured goods represent the most important product group in EU exports to Russia with a share of 54.3 %, followed by mining and chemical products (18.8 %). EU agri-food exports to Russia amount to 9.7 % of total trade flows and this share declined by 2.2 percentage points over the period 2013 to Similarly, also the importance of manufactured goods, although only partly covered by the sanctions, decreased significantly by 3.8 percentage points, while the export share of mining and chemical products grew considerably by more than 5 percentage points over the same period. (Giumelli, F.) argues along the same line when pointing out that not all economic sectors were affected the same way with some enhancing their exports to Russia even after the imposition of the sanctions. 10

12 Russia s and the EU s sanctions: economic and trade effects, compliance and the way forward Figure 5: Sectoral breakdown of EU exports to Russia, 2013 and 2016 Textiles USD7.6bn 4.8% Others USD1.1bn 0.7% 2013: USD bn Confidential USD3.1bn 2.0% Agri-food USD15.5bn 9.7% Raw mat. USD15.5bn 9.7% Textiles USD4.0bn 5.1% Others USD0.5bn 0.6% 2016: USD 79.6 bn Confidential USD1.8bn 2.2% Agri-food USD6.0bn 7.6% Raw mat. USD7.9bn 9.9% Manufact. USD86.6bn 54.3% Mining, chemicals USD29.9bn 18.8% Manufact. USD40.3bn 50.6% Mining, chemicals USD19.1bn 24.0% Percentage points Agri-food Raw mat. Mining, chemicals Change 2013/ Manufact. Textiles Others Confidential Source: UN Monthly COMTRADE, WIFO calculations. Details on the sectoral breakdown are displayed in the Appendix Wider economic impacts of the sanctions and the economic crisis in Russia The decline in EU exports to Russia, as shown by these official statistics, is undoubtedly the most significant economic impact related to the sanctions; however, for at least two reasons it may be an insufficient indicator for the total sanction-induced economic costs. Firstly, total economic costs need to include negative spillover effects on firms which are part of the supply chain for the companies/sectors exporting to Russia. The extent of these indirect multiplier impacts may even exceed the value of export losses. Since they cannot be observed directly they must be estimated by models taking into account inter-sectoral linkages within the European economy. While it is difficult to assess the impact of the sanctions for the EU and Russian economy in isolation from other factors, several studies nevertheless attempted to estimate the economic costs taking into account economy-wide multiplier effects. Some of these are cited by (Moret, E. et al.), which provide a first assessment of potential costs and impacts of the sanctions. According to releases by the (European Parliament, 2015) and EU Observer( 5 ), the European Commission summarises the damage to Europe's economy as "contained" and puts the overall costs of the sanctions and countersanctions at EUR 40 bn (-0.3 % of EU GDP) in 2014 and EUR 50 bn (-0.4 %) in An assessment by the (Institute of Economic 5 (retrieved 16 August 2017). 11
13 Policy Department, Directorate-General for External Policies Forecasting) estimates the potential impact of the sanctions for the Russian economy at 8 % to 10 % of GDP and the impact for the EU at 0.5 % of GDP. A study by (Havlik, P.) concludes that Ukraine's economy is hit strongest by the conflict with GDP contracting by up to 10 % in 2014, while the loss in Russian GDP is predicted to amount to EUR 20 bn and more than EUR 30 bn and EUR 50 bn in 2015 and 2016, respectively. Assuming a 10 % loss in exports of goods and services to Russia, he estimates a GDP loss for the EU of around EUR 11 bn (-0.1 % of GDP), while in a more extreme scenario with a decline in value added exports by 50 %, the predicted losses may account for EUR 55 bn (-0.4 % of GDP). Table 2: Comparison of economic impacts Christen, E. et al., 2014 Christen, E. et al., 2015 Christen, E. et al., 2016 Employment Value added Employment Value added Employment Value added In % of total employment mn % of total value added In % of total employment mn % of total value added In % of total employment mn % of total value added AUT BEL BGR CYP CZE DEU DNK ESP EST FIN FRA GBR GRC HUN IRL ITA LTU LUX LVA MLT NLD POL PRT ROU SVK SVN SWE EU Source: WIFO calculations. The Austrian Institute of Economic Research (WIFO) has conducted three studies since 2014 analysing the wider economic consequences of the weakening EU exports to Russia. For this purpose, export losses were first converted into direct value added and employment effects; thereafter indirect economic impacts through the linkages between the various sectors and countries were estimated applying a global econometric input-output model covering 27 Member States of the EU plus the economies of the most important trading partners (foremost Russia, but also the USA, China, South Korea etc.). The first two studies (Christen, E. et. al., 2014, 2015) took observed reductions in EU exports to Russia as a starting point for estimating direct and indirect value added and employment impacts. Both sanctions and other factors (oil price decline, ruble devaluation etc.) were acknowledged as underlying causes for the reduction in exports without isolating their specific contributions. The calculations thus merely produced upper benchmarks for the sanction-induced macroeconomic effects. For the EU 27 (without Croatia) these amounted to EUR 27.8 bn and EUR 33.5 bn loss in value added and a decline of and in terms of employment, respectively (see Table 2). These total effects are heavily influenced by sectoral and national spillovers, i.e. indirect channels of transmission. Austrian companies embedded in European supply chains of the automobile industry, for instance, suffered heavily from declining German automobile exports to Russia. 12
14 Russia s and the EU s sanctions: economic and trade effects, compliance and the way forward Another study published in 2016 (Christen et al., 2016) attempted to separate sanction-induced impacts from effects caused by other factors. Overall, compared to the 2015 benchmark numbers, about a third of the macroeconomic results could be specifically traced back to the sanctions. The 2016 calculations implied a potential decline of EUR 17.6 bn in value added and around jobs being endangered across all EU countries, accounting for 0.2 % of total value added and employment, respectively. A second reason why a sanction-induced decline of EU exports to Russia is not equivalent to total economic costs of the sanctions arises from adaptation measures undertaken by exporting companies and governments alike. In market economies, firms react to changes in the business environment they are operating in. If market opportunities in Russia deteriorate or disappear altogether, they will seek for alternative destination markets in other countries. The search for new market opportunities was partly supported by national export promotion schemes (e.g. the program "go international" in Austria and EU agricultural policies, see chapter 2) while at the same time governments further aggravated the sanction impacts by cancelling export guarantees for firms exporting to Russia. Consequently, the diversion of trade flows resulting from private firm initiatives and corresponding public policies may mitigate part of the economic losses caused by the sanctions; the various cost estimates cited above did not take these trade diversion effects into account and may thus overestimate the negative macroeconomic consequences. Existing empirical evidence, including the estimations below, however, point to a low magnitude of trade diversion. Furthermore, additional economic costs may arise since investment opportunities for European firms in Russia may suffer considerably from a deterioration of economic relationships between the EU and Russia; the aforementioned stagnating FDI flows into Russia provide first evidence of this type of impact. 1.5 Additional findings from the literature on sanction impacts This report builds on the knowledge and the empirical evidence that have been gathered on the economic implications of the sanctions in various research projects. A small but growing literature has aimed at evaluating the specific impacts of the financial sanctions imposed by the EU, USA and other countries. These measures affected the trading of certain financial instruments with a number of Russian financial institutions and energy and defence companies. (Gurvich, E. and Prilepskiy, I.) find that, akin to the findings for trade by (Crozet, M. and Hinz, J.), capital flows to and from entities not directly targeted were also affected. Furthermore, they stress that the effect of the financial sanctions on Russian GDP were 3.3 times lower than the effect of the oil price shock. This result resonates with (Tuzova, Y. and Qayum, F.) and (Dreger, C. et al.), who find little to no significant impact of the financial sanctions on the devaluation of the Russian ruble, instead pointing to the rapid decline in the oil price in early 2015 as the culprit. The findings by (Ahn, D. and Ludema, R.) point in a similar direction and state that sanctions induced smaller macroeconomic impacts on Russia than oil price volatility. Using detailed firm-level data, they find strong evidence that sanctions affected the financial health of targeted firms, which experience losses in operating revenues, asset values and employees as compared to non-sanctioned firms. In contrast, (Dreyer, I. and Popescu, N.) in an early ad-hoc assessment, speculate that the measures drove up interest rates in Russia by reducing the availability of capital, possibly contributing to an already damaged macroeconomic downturn. (Vymyatnina, Y.) concludes that external and internal borrowing in Russia were severely restricted by both the (financial) sanctions and the oil price decline, but much more by the first than by the latter. The resulting borrowing limitations are expected to decrease investment, especially in the oil and gas sector, but will eventually also lower Russian GDP. (Harrel, P.E. et al.) also suggest that the sectoral sanctions targeting the oil and gas industry, defence and financial sector in Russia generated the greatest economic impact, while asset freezes and travel bans on individuals and restrictions on doing business, investing and economic cooperation accelerated the general worsening of economic 13
15 Policy Department, Directorate-General for External Policies relations. (Bond, I. et al.), however, point out that the impact of the sanctions are likely to have short-run rather than long-run consequences as a large part of the capital flight from the Russian economy appears to be grounded more in uncertainty than in specific adverse measures. Since some of the sanctions, specifically financial restrictions and the ban on exports on certain energy equipment and energy-related services, were particularly harmful for large Russian energy firms, (Peters, E. S.) speculates that European consumers would therefore face higher gasoline prices. His empirical analysis, however, did not find any conclusive evidence for such effects. (Nikulina, A.K. and Kruk, M.N.) also focus on the Russian energy sector by pointing out that oil exploration activities in Russia are highly dependent on foreign technology and capital alike, access to which has been severely restricted by the sanctions. 1.6 Contribution of this report This study aims at consolidating and complementing the existing evidence in order to arrive at a conclusive assessment about the economic consequences of the sanctions. New evidence is generated by: updating the already existing econometric model that allows a separation of the sanction-induced impact on exports from the impact of other relevant factors. The new estimates are not only based on the most recent data on international trade flows, but also include trade diversion efforts that could mitigate export losses caused by the sanctions. In addition, further model testing is carried out to ensure plausibility, robustness and completeness of the results; collecting supplementary information on the issues of trade diversion (including trade with the countries of the Eurasian Economic Union( 6 )) and compliance with the sanctions. One caveat is to be mentioned explicitly: This report will present an assessment on the economic costs of the sanctions; political costs or targets (the latter being the main reason for implementing the sanctions by the EU in the first place) are not being addressed. However, (Hufbauer, G. et al.) have shown that roughly only one in three sanctions attain the desired political outcome( 7 ). While the first chapter describes the economic relationships between Russia and the European Union in times of sanctions and economic downturn to provide an upper benchmark on potential first round effects of the trade restrictions and summarises the state of knowledge on the potential economic costs of the EU and Russian sanctions in general, the report proceeds as follows. Chapter 2 is devoted to trade in agri-food products, part of which was banned by Russia. A first assessment of actual and potential trade diversion effects, which are of particular importance for the agri-food sector since many of these products cannot be stored for a longer period, is provided. Furthermore, the issue of non-compliance is discussed for this group of products even though evasion of Russian sanctions (as opposed to EU sanctions against Russia) does not appear to be of any concern to EU institutions, but is in fact of interest for the Russian government. However, neither dual use goods, which cannot easily be identified in official trade statistics, nor military goods, which make up a very small fraction of total trade with Russia, appear suitable for this kind of analysis. Moreover, possible non-compliance efforts with respect to banned agri-food products may also provide some insights into potential evasion activities with respect to other commodities for which trade was restricted by the EU. Chapter 3 describes the econometric model estimates on the specific contribution of the sanctions to the observed changes in trade flows between countries. It also examines the (re)allocation of these international trade flows in the post-sanction period and thus discusses empirical indications on trade diversion. This evidence is further complemented by results from a study on French firms. 6 Members of the Eurasian Economic Union (EEU) are Armenia, Belarus, Kazakhstan, Kygryzstan and Russia. 7 See (Kholodilin, K. et al.) for a deeper discussion on the effectiveness of sanctions. 14
16 Russia s and the EU s sanctions: economic and trade effects, compliance and the way forward Finally, the concluding chapter 4 synthesises all the empirical information gathered and the conclusions from other studies in order to summarise the current state of knowledge regarding the economic effects of the sanctions initiated in
17 Policy Department, Directorate-General for External Policies 2 Restrictions on imports of agri-food products 2.1 International trade flows affected by the import ban Despite the fact that Russia has become increasingly important for global agricultural production, it is a much larger agricultural importer than exporter. In 2013, Russia's agri-food imports amounted to USD 43.4 bn, while agri-food exports were USD 16.2 bn( 8 ). The reason for Russia s trade deficit in agri-food products is partly explained by its trade structure. While Russia mainly exports crops, such as grain and sunflower seed, it imports high value products, like meat, fruits, vegetables as well as processed foods (Liefert, W. and Liefert, O.). The EU represents the largest supplier of agri-food products to Russia, providing almost 35 % of the country's imports in 2013, valued at USD 15.2 bn. In contrast, Russian agri-food imports from the USA equalled only USD 1.7 bn in The Russian embargo against selected Western countries had a major impact in terms of agri-food trade: Measured on the basis of 2013 trade volumes, the products affected by the import restrictions accounted for more than 50 % of Russia's agri-food imports, corresponding to USD 9.6 bn. On average roughly 40 % of all affected products (measured by their import value) originated in either the USA, EU, Canada, Australia or Norway, while for specific goods, like pork, poultry, butter, cheese and fish the share of certain sanctioned countries is substantially higher (FAO). For the EU, Russia constitutes the second most important destination market for agri-food commodities, surpassed only by the USA, with exports amounting to USD 15.5 bn in total or 2.9 % of overall EU agri-food exports (European Parliament, 2014). The value of EU exports covered by the Russian import ban totals USD 7.3 bn in 2013 or 47.3 % of total agri-food exports to Russia in that year. While the trade embargo affects approximately 1.4 % of overall EU exports of agricultural products, the impact differs substantially across Member States and product groups. Measured in terms of the absolute value of banned goods in 2013, Lithuania and Poland are affected the most, followed by Germany, the Netherlands, Denmark, Spain, Finland, Belgium and France (compare also Figure 9). Figure 6 depicts differences in the export intensity of agri-food commodities across Member States. For six countries (Cyprus, Latvia, Denmark, Greece, Ireland and Lithuania) at least 30 % of agri-food exports were supplied to the Russian market in In comparison, for other EU countries, in particular Germany, Sweden, Romania, Slovenia, Great Britain, the Czech Republic, Slovakia and Malta, the Russian market accounts for less than 5 % of their overall agri-food exports( 9 ). As a result of the decline in agri-food exports to Russia due to the trade embargo, the importance of the Russian market in overall agri-food exports dropped significantly in almost all EU countries. A study by (Sinabell, F. et al.) dealt with the consequences of the Russian import ban of a number of agricultural products from the EU and other countries, analysing the direct and indirect consequences of these restrictions for agriculture and the food processing industries in Austria in both the short and longer term. For 2014 exports from Austria to Russia were estimated to decline by approximately EUR 50 mn compared to the previous year which implied a relative decline of about 50 %. Furthermore, measures for mitigating economic losses were discussed in detail. A similar study from the (BMEL-AG) came essentially to the same conclusions but showed that the exposure of Germany's agri-food sector to detrimental trade effects was even larger (Fedoseeva, S.). 8 Agricultural products comprise the CN chapters 1 to 24. Agri-food commodities affected by the ban include certain CN codes within the chapter 1 to 24 as well as CN code 2501 (salt). A list of banned goods is reported in (Sinabell, F. et al.) the most recent update is summarised in (WKO). 9 For a comprehensive picture of trade exposure to Russia in agri-food trade of countries affected by the import ban, see (DG AGRI) and (European Parliament, 2014, 2016). 16
18 Russia s and the EU s sanctions: economic and trade effects, compliance and the way forward Figure 6: Importance of agri-food exports to Russia, 2013 and 2016 Panel 6a) EU and USA Percentage shares in total exports CYP LVA DNK GRC IRL LTU ESP NLD PRT EST POL USA BEL HUN FRA BGR FIN ITA AUT HRV LUX DEU SWE ROU SVN GBR CZE SVK MLT Source: UN Monthly COMTRADE, WIFO calculations. Panel 6b) Eurasian Economic Union and selected third countries Percentage shares in total exports ARM BLR KGZ KAZ GEO SRB TUR UKR CHE CHN Source: UN Monthly COMTRADE, WIFO calculations. Following the recovery of the Russian economy in 2016 the share of agricultural products in exports to Russia increased in certain countries, as Figure 6 shows. At the same time Russia diverted its imports of banned agri-food products to other countries, specifically those in close neighbourhood. Consequently, between 2013 and 2016 these countries saw their share of agri-food exports to Russia increase significantly. This applies especially to Belarus and Kyrgyzstan, Georgia, Serbia and Turkey, while the importance of Russia as a destination market for China grew only marginally. The Russian embargo substantially affected EU agri-food exports to Russia, which dropped from around USD 15.5 bn in 2013 to around USD 6 bn in This significant reduction of agri-food imports from the EU by Russia is due to two separate decisions: i) a ban of imports of live pig and pig meat because of the outbreak of African Swine Fever (ASF) in areas in the EU in early 2014 and ii) an import ban on 30 types of products (notably meats, dairy products and fruit and vegetables) imposed in August Concerning 17
19 Policy Department, Directorate-General for External Policies the ban imposed in January 2014, the WTO's Appellate Body confirmed that Russia's import bans on live pigs, pork and other pig products from the EU is illegal under international trade rules in February 2017( 10 ). After the import ban of EU products it became evident that a potentially intended side effect of the embargo was the stimulation of domestic food processing in Russia. This point, namely the political economy and domestic consequence of the Russian agri-food countersanctions was also discussed by (Wengle, S.). She emphasises the link between the embargo and the Russian food security agenda aiming at boosting domestic food production and reducing import dependence of that sector. The sanctions in fact increased domestic production in some areas like pork and poultry and lower imports of cheese were also mainly substituted by an expansion of production of domestic dairies; for other food products, e.g. beef, the sanctions failed to boost domestic production. However, prices increased significantly due to higher production costs (Agra Europe). At the same time demand changes (e.g. substitution of beef by pork) were not only a result of the embargo but also due to a fall in the purchasing power of Russian households. Whereas agri-food exports to Russia shrank, overall EU exports of agricultural products continued to increase over the same period, amounting to USD 492 bn in 2016, 2.0 % higher than in 2015 and 0.2 % higher than in Nevertheless, products under embargo such as cheese, fruits, and meat, experienced lower export values than in 2013( 11 ). The scale of the import restrictions, however, affects the EU countries differently, as Figure 7 shows. For 12 countries the share of embargoed products accounts for more than 50 % of overall agri-food exports to Russia, including Cyprus, where more than 95 % of agri-food exports to Russia are affected by the ban. Also in terms of total exports to Russia the scale of banned products exceeds 25 % for Cyprus (53 %), Greece (30 %) and Denmark (25 %), while import restrictions also hit Lithuania (19 %) and Ireland (19 %) hard. Regarding the importance of the banned products for non-embargoed countries, Figure 7 shows that around 80 % of the agri-food exports of Belarus, Turkey and Serbia to Russia are sanctioned goods and thus are likely to increasingly substitute supply from Western economies. In terms of overall exports, the share of embargoed products amounts to more than 20 % in Belarus and approximately 15 % in Serbia, Turkey and Armenia, providing first insights that these countries may most likely benefit from the embargo. For some specific agricultural products the value of EU exports to Russia is especially high, underlining the importance of Russia as a significant commercial market for agri-food exports. The breakdown of EU exports to Russia by product groups in Figure 8 highlights that dairy products, fruits as well as meat and sausages are most affected by the trade embargo (see also European Parliament, 2014). Before the import ban, EU dairy exports to Russia amounted to USD mn (2013; 24.5 % of EU exports of banned products), while fruit and meat exports were worth USD mn (22.6 %) and USD mn (22.3 %), respectively. In comparison, the USA mainly exports meat and sausages (43.6 %) as well as fruits (29.7 %) to Russia and the value of exports covered by the Russian import ban amounted to USD 751 mn in A detailed account of regulatory changes since 2014 concerning import restrictions of EU agricultural products by Russia was published recently by (GTAI) (retrieved 26 June 2017). 11 European Commission: (retrieved 26 June 2017). 18
20 Russia s and the EU s sanctions: economic and trade effects, compliance and the way forward Figure 7: Share of embargoed products in agri-food and total exports to Russia, 2013 Panel 7a) EU and USA Percentage shares Agri-food Total 0 CYP GRC SVN POL LTU FIN DNK ESP USA LUX IRL BEL HRV AUT DEU NLD FRA EST GBR PRT HUN ITA SVK BGR SWE CZE LVA ROU Source: UN Monthly COMTRADE, WIFO calculations. Panel 7b) Eurasian Economic Union and selected third countries Percentage shares Agri-food Total 0 BLR KGZ ARM KAZ TUR SRB CHE CHN UKR GEO Source: UN Monthly COMTRADE, WIFO calculations. Members of the Eurasian Economic Union (EEU), which do not fall under the embargo, are likely to benefit most from the diversion of Russian agri-food imports, as depicted by Figure 8. The most important supplier to Russia is Belarus, its export value of products covered by the Russian trade embargo amounts to USD mn in 2013, mostly comprising dairy products as well as meat and sausages. In contrast, the exports of affected products by all other members of the Eurasian Economic Union only account for USD 109 mn in Other important suppliers to the Russian market in terms of banned agricultural products include Turkey (USD mn) and China (USD 908 mn) with respect to fruits, vegetables, and fish for the latter, while dairy products as well as meat and sausages are mainly delivered by the Ukraine (USD 767 mn), which was, however, added to the list of sanctioned countries later on. Exports of 19
21 Policy Department, Directorate-General for External Policies embargoed products of Serbia to Russia (with a total value of USD 14 mn in 2013) mainly concentrate on fruits and to a lesser extent on dairy goods, as Figure 8 shows. Figure 8: Percentage shares of embargoed exports to Russia by product groups, 2013 Panel 8a) EU and USA EU USA Food preparations Fruits Vegetables Dairy products Fish Meat and sausages Food preparations Fruits Vegetables Dairy products Fish Meat and sausages Source: UN Monthly COMTRADE, WIFO calculations. Panel 8b) Eurasian Economic Union and selected third countries Belarus Kazakhstan Food preparations Fruits Vegetables Dairy products Fish Meat and sausages Food preparations Fruits Vegetables Dairy products Fish Meat and sausages Food preparations Fruits Vegetables Dairy products Fish Meat and sausages Armenia Food preparations Fruits Vegetables Dairy products Fish Meat and sausages Kyrgyzstan
22 Russia s and the EU s sanctions: economic and trade effects, compliance and the way forward Panel 8b/continued Turkey China Food preparations Fruits Vegetables Dairy products Fish Meat and sausages Food preparations Fruits Vegetables Dairy products Fish Meat and sausages Food preparations Fruits Vegetables Dairy products Fish Meat and sausages Ukraine Food preparations Fruits Vegetables Dairy products Fish Meat and sausages Serbia Source: UN Monthly COMTRADE, WIFO calculations. In line with their specialisation in the production of agricultural products the impact of the ban among certain product groups differs across EU Member States. As Figure 9 shows, Lithuania and Poland are highly engaged in exports of fruits and vegetables; fruit exports also have a dominant position in Spain and Belgium. Dairy products account for a high share in the Netherlands, in Finland, Denmark, Germany, Lithuania and Poland. Regardless of the fact that in terms of meat exports the EU was confronted with SPS-related trade restrictions (sanitary and phytosanitary measures) by Russia even before the import embargo in summer 2014, Russia is still an important destination market for EU meat exports, in particular supplied by Germany, Denmark, Poland, Spain, the Netherlands and France. In addition, Norway held intensive trade relations with Russia with respect to fish and seafood (FAO). A recent detailed review of the situation in Germany showed that not all regions were affected in a likewise manner and that economic losses of exporters were also due to the sluggish economic performance of the Russian economy (Deutscher Bundestag). 21
23 Policy Department, Directorate-General for External Policies Figure 9: Percentage shares of embargoed exports to Russia by product groups and EU countries (ranked by export value), 2013 Meat and sausages Fish Dairy products Vegetables Fruits Food preparations LTU POL DEU NLD DNK ESP FIN BEL FRA ITA IRL GRC AUT EST HUN GBR LVA SVN SWE PRT CYP CZE BGR HRV SVK LUX ROU EU 28 Source: UN Monthly COMTRADE, WIFO calculations. The evolution of agri-food exports of the EU and the USA to Russia, the Eurasian Economic Union and other third countries since 2014 is summarised in Figure 10 and provides some first insights about potential trade diversion as a result of the Russian sanctions. While EU exports of total agricultural products (-22.3 %) and sanctioned goods (-42.2 %) to Russia dropped markedly in 2014, exports to the Eurasian Economic Union (+7.3 % and +5.1 %, respectively) and other third countries (+2.9 % and +5.1 %, respectively) increased significantly. In particular, EU exports of dairy products, fruits and vegetables to the members of the Eurasian Economic Union accelerated, while exports of meat and sausages decreased sharply in Despite supportive measures at the EU level, agri-food and banned agri-food exports in each of the product group have not recovered in 2015 and declined significantly, as Figure 10 shows. Only in 2016, the EU's agri-food sector managed to compensate for losses, as overall agri-food exports and supplies of embargoed goods to third countries increased by 2.1 % and 3.5 %, respectively. Similar patterns of potential trade diversion to other third markets are also observed for US trade flows with Russia. However in contrast to the EU, US exports to the Eurasian Economic Union decreased in 2014, except for vegetables and food preparations. 22
24 Russia s and the EU s sanctions: economic and trade effects, compliance and the way forward Figure 10: Percentage changes in agri-food exports to Russia, the Eurasian Economic Union and other countries, 2014 to 2016 Panel 10a) EU Russia Eurasian Economic Union Extra Agri-food Banned agri-food Meat and sausages Fish Dairy products Vegetables Fruits Food preparations Russia Eurasian Economic Union Extra Agri-food Banned agri-food Meat and sausages Russia Eurasian Economic Union Extra Fish Dairy products Vegetables Fruits Food preparations Agri-food Banned agri-food Meat and sausages Fish Dairy products Vegetables Fruits Food preparations Source: UN Monthly COMTRADE, WIFO calculations. Eurasian Economic Union excludes Russia. Extra comprises all other countries except for Russia and the Eurasian Economic Union. 23
25 Policy Department, Directorate-General for External Policies Panel 10b) USA Russia Eurasian Economic Union Extra Agri-food Banned agri-food Meat and sausages Fish Dairy products Vegetables Fruits Food preparations Russia Eurasian Economic Union Extra Agri-food Banned agri-food Russia Eurasian Economic Union Extra Meat and sausages 3, Fish Dairy products Vegetables Fruits Food preparations Agri-food -0.5 Banned agri-food Meat and sausages Fish Dairy products Vegetables Fruits Food preparations Source: UN Monthly COMTRADE, WIFO calculations. Eurasian Economic Union excludes Russia. Extra comprises all other countries except for Russia and the Eurasian Economic Union. 2.2 Evidence for trade diversion EU exports While alternative market opportunities for the EU do exist for certain agricultural products, rerouting trade flows to other foreign markets takes time; furthermore, diverting deliveries to other countries will in most cases go hand in hand with a decline in sales prices since any markets with higher profit opportunities than the Russian market would have been supplied even before the sanctions were in place, assuming profit maximising firm behaviour. To address this challenge and help mitigate the impact of the agri-food market 24
26 Russia s and the EU s sanctions: economic and trade effects, compliance and the way forward disturbances caused by the sanctions, the EU mobilised a common response through the usage of appropriate market mechanisms within the Common Agricultural Policy (CAP) to stabilise the internal market (Boulanger, P. et al.). Consequently, EU countries and the European Commission closely monitored all markets affected by the ban and took a range of emergency measures immediately after the embargo was imposed. Such measures are available based on Common Agricultural Policy procedures in case market frictions appear. A range of instruments to intervene in markets are available (under the CAP rules on reallocation and exceptional support) and were in fact triggered for dairy products and for fruits and vegetables. They were designed to help producers in dealing with increased market pressure (by withdrawal of products from the market; processing fruits to juice; donating to special groups), unstable prices (stabilisation achieved through coverage of storage costs of relevant products until prices recover), unstable farm incomes (applying in particular to milk producers in Baltic countries) and lost market opportunities (by exploring alternative sales opportunities through the promotion of sales in new markets; negotiations on free trade agreements; agreements on phytosanitary procedures between Member States and target markets). Agri-food exports to Russia were not only negatively affected by discretionary product-specific trade restrictions but also by unfavourable exchange rate movements. In early 2014 the exchange rate of slightly less than 50 rubles for one euro was relatively stable. When the year came to an end a massive depreciation to well over 70 rubles per euro was observed. However, no specific measures applying exclusively to the farm sector exist with respect to exchange rate risks but exporters may benefit from national measures like the export guarantee programme (Url, Th.) and export promotion schemes (e.g. "go international" initiative) in Austria. A sudden and unanticipated reduction of demand causes lower prices when supply cannot adjust. The measures listed above were taken in order to prevent prices from dropping to unsustainable levels or cover losses farmers incurred. Producers of vegetables were affected most heavily because such products cannot be stored. The same is true for many kinds of fruits. Lower prices not only hurt producers but may also open new market opportunities for agents on markets not hampered by the sanctions. Consider a food processing company in a country unaffected by the sanctions; it will profit from lower prices of inputs delivered by EU producers looking for alternative markets and is thus able to expand production (and possible exports to Russia). This actually applied to some food ingredients (e.g. fruit juice concentrates, meat, milk powder, butter) that became available on certain markets in the second half of Diversion of trade flows and changes in the supply chain of products originating in the EU may have led to an increase in production in third countries; finally, processed ingredients from EU producers appeared on the Russian market. According to our knowledge, studies on the quantitative effect of such trade diversion phenomena are not yet available; therefore it is not possible to provide any further evidence on their economic effects. The analysis of recent trade data points to increased trade flows in agricultural products to third countries. It confirms that the EU has managed to partly redirect agri-food exports to alternative third countries. Specifically, the annual value of EU agri-food exports to third markets grew by 2 % in 2016 compared to 25
27 Policy Department, Directorate-General for External Policies the previous year. The highest relative gains were achieved with respect to exports to the USA (+5.5 %), China (+13.3 %), Switzerland (+2.4 %) and Japan (+7.4 %)( 12 ) Russian imports The negative consequences of the import ban on the domestic Russian market (which led to shortages and price increases of food products, etc.) forced the Russian authorities to explore opportunities for new trading partners. In order to mitigate diminishing supply as a result of the trade embargo, banned agri-food products needed to either be sourced from non-sanctioning countries, for instance from countries in the Eurasian Economic Union, or be substituted by increased domestic production. However, in the short run imports from countries not affected by the import embargo may not fully replace lost foreign supply as they can be increased only gradually (FAO). First public announcements reveal that Russia intended to increase the exports of agricultural products especially from Turkey, Serbia and the countries of the Eurasian Economic Union. In particular, fruit imports were to be sourced from Azerbaijan and Turkey, while milk products may be mainly supplied by Belarus. As a result of intensified trade relations with South America in the previous years meat imports were likely to be replaced by deliveries from these countries; several companies in Brazil, for instance, were already approved to export to Russia. In order to facilitate imports of agricultural products, Russian authorities implemented a mutual recognition of certificates with certain trading partners and accelerated certification procedures (FAO). According to World Food Moscow( 13 ) imports from Pakistan, Serbia, Egypt as well as South America, especially Chile, Argentina and Brazil, increased significantly after the implementation of the embargo. 2.3 Evidence for non-compliance One might also take into account that certain quantities of banned import goods from the EU and other Western economies are re-exported( 14 ) to Russia via Belarus, Serbia or other countries outside the sanction alliance in order to ease food shortages; such activities are illegal by Russian law since they circumvent the trade embargo by violating the rules of origin of products (Liefert, W. and Liefert, O.). Both producers of banned agri-food products in the EU( 15 ) and companies in countries not included in the import ban (wholesalers, food processing companies, companies in the agri-food sector) have an incentive to engage in non-compliance activities. However, Russian authorities have reinforced their control of inflows of embargoed products from sanctioned countries through third countries, in particular within the Eurasian Economic Union, to prevent such non-compliance activities. As a result of the import ban, agri-food exports from Serbia and Belarus to Russia increased by 13 % between August 2014 and December 2014 as compared to the same period in According to (Liefert, W. and Liefert, O.) Russia allows imports of Belarusian processed foods that use banned EU agri-food commodities as "inputs" as long as the processing adds substantial value added. However, Russian authorities attempt to verify the origin of agri-food products entering their market in order to prevent non-compliance with their trade restrictions. Recently, severe disputes between Belarus and Russia have occurred in this respect, with Russia blocking the import of some Belarusian agricultural products supposedly originating in the EU( 16 ). As a consequence of Russian measures against non-compliance with 12 For further details, see -trade_en (retrieved 4 July 2017) (retrieved 30 June 2017) htm (retrieved 28 June 2017) (retrieved 28 June 2017) (retrieved 28 June 2017); (retrieved 28 June 2017). 26
28 Russia s and the EU s sanctions: economic and trade effects, compliance and the way forward the import ban, the export increase observed for Belarus in the fall of 2014 came to an end in the winter of the same year (Agricistrade). Information about the sincerity of efforts to prevent non-compliance on part of the Russian authorities, but also on part of authorities in third countries that have a vested interest in preserving good relationships with Russia has also been received from representatives of the Austrian chamber of commerce in Serbia. They conclude that even though such activities cannot be ruled out completely they are of very limited relevance and do not seriously thwart the effectiveness of the sanctions in place. On the other hand, it was pointed out that legal trade diversion efforts do work in that direction. More and more domestically produced agri-food commodities in Serbia were withdrawn from the home market and exported to Russia instead. Serbian domestic demand was increasingly satisfied by products imported from EU countries. Even though this observation cannot be confirmed here beyond any doubt, the descriptive data analysis showing both increasing EU exports to Serbia and rising Serbian exports to Russia hints in that direction. Further qualitative evidence on the issue of non-compliance both with respect to EU and Russian sanctions, however, is lacking. Official sources are very hesitant to share their possible (more or less anecdotal) knowledge of such activities. Numerous attempts to contact OECD officials dealing with the problem of non-compliance remained unsuccessful. Nevertheless, despite all this information pointing towards little relevance of the non-compliance issue, at least with respect to the import ban of agri-food products to Russia some suggestive empirical evidence for (legal or perhaps also illegal) circumventing trade through certain transit countries, in particular Belarus, Serbia and Macedonia, has been found. Figure 11 compares the change in banned agri-food exports to overall agri-food exports (excluding embargoed goods) on a quarterly basis between 2013 and 2016 for specific members of the EU, namely the Baltic countries (Estonia, Latvia and Lithuania), small EU countries (Austria, Italy, Denmark and Spain), large EU economies (Germany, France, Netherlands) and CEE countries (Hungary, Czech Republic, Poland, Slovenia, Slovakia). As the figure shows, for the case of Baltic countries exports of banned agri-food goods may have been partly redirected to Russia via Belarus, as exports of sanctioned goods flourished till the 4 th quarter of Similarly, banned exports of small Western economies to Serbia have increased exceptionally since mid-2014, while rerouting via Serbia is also obvious for large Western economies in the 3 rd and 4 th quarter of In line with media reports, CEE countries partly shifted their sanctioned exports via Macedonia to Russia, which explains the accelerated increase in exports of banned goods in the last two quarters of 2014, before Russia implemented stricter import controls. Figure 11: Percentage changes in agri-food EU exports to Belarus, Serbia and Macedonia, 2013 to 2016 Exports of Baltic countries to Belarus Banned agri-food Other agri-food qu. 2.qu. 3.qu. 4.qu. 1.qu. 2.qu. 3.qu. 4.qu. 1.qu. 2.qu. 3.qu. 4.qu. 1.qu. 2.qu. 3.qu. 4.qu
29 Policy Department, Directorate-General for External Policies Exports of large EU countries to Serbia Banned agri-food Other agri-food qu. 2.qu. 3.qu. 4.qu. 1.qu. 2.qu. 3.qu. 4.qu. 1.qu. 2.qu. 3.qu. 4.qu. 1.qu. 2.qu. 3.qu. 4.qu Exports of small EU countries to Serbia Banned agri-food Other agri-food qu. 2.qu. 3.qu. 4.qu. 1.qu. 2.qu. 3.qu. 4.qu. 1.qu. 2.qu. 3.qu. 4.qu. 1.qu. 2.qu. 3.qu. 4.qu Figure 11/continued Exports of CEE countries to Macedonia Banned agri-food Other agri-food 1.qu. 2.qu. 3.qu. 4.qu. 1.qu. 2.qu. 3.qu. 4.qu. 1.qu. 2.qu. 3.qu. 4.qu. 1.qu. 2.qu. 3.qu. 4.qu Source: UN Monthly COMTRADE, WIFO calculations. These insights on increased trade flows in sanctioned goods of EU countries with Belarus, Serbia and Macedonia, countries not affected by the import ban, are further supported by rising export flows of these countries to Russia, as Figure 12 depicts. Belarus increasingly supplied embargoed goods to the Russian market in the 3 rd and 4 th quarter of 2014, but the prospering development stopped with the blocking of suspected goods at the Russian border. In contrast, exports of banned goods from Macedonia and Serbia 28
30 Russia s and the EU s sanctions: economic and trade effects, compliance and the way forward to Russia kept growing until spring 2015, indicating weak evidence for supporting re-exports of the EU in the first month after the implementation of the trade embargo. It thus can be concluded that even though illegal re-exporting of EU agri-food products by Belarus, Serbia and Macedonia to evade the Russian countersanctions has been reportedly irrelevant, the empirical evidence cannot completely support these assertions. Nevertheless, this descriptive evidence is necessarily rather vague. Figure 12: Percentage changes in agri-food exports of Belarus, Serbia and Macedonia to Russia, 2013 to 2016 Exports of Belarus to Russia Banned agri-food Other agri-food qu. 2.qu. 3.qu. 4.qu. 1.qu. 2.qu. 3.qu. 4.qu. 1.qu. 2.qu. 3.qu. 4.qu. 1.qu. 2.qu. 3.qu. 4.qu Figure 12/continued Exports of Macedonia to Russia Banned agri-food Other agri-food qu. 2.qu. 3.qu. 4.qu. 1.qu. 2.qu. 3.qu. 4.qu. 1.qu. 2.qu. 3.qu. 4.qu. 1.qu. 2.qu. 3.qu. 4.qu
31 Policy Department, Directorate-General for External Policies Exports of Serbia to Russia 150 Banned agri-food Other agri-food qu. 2.qu. 3.qu. 4.qu. 1.qu. 2.qu. 3.qu. 4.qu. 1.qu. 2.qu. 3.qu. 4.qu. 1.qu. 2.qu. 3.qu. 4.qu Source: UN Monthly COMTRADE, WIFO calculations. 30
32 Russia s and the EU s sanctions: economic and trade effects, compliance and the way forward 3 Estimation of sanction-induced trade effects 3.1 Empirical approach: assessing the impact of the sanctions and limitations of the methodology The following assessment of the impacts of the sanctions on international trade flows is based on the use of a standard econometric model, built on recent advances of the so-called gravity approach of international trade. Using state of the art estimation techniques the model can predict changes in trade flows reflecting the emergence of certain impediments to trade, in this case the sanctions. As such, any type of bilateral sanctions between Russia on the one side and the EU and other allied Western countries on the other financial sanctions, "smart sanctions", the Russian embargo on certain food and agricultural products but also, and perhaps most importantly, the general worsening of trade relationships as a corollary of all sanction measures and political tensions are taken into account. Furthermore, the model provides some evidence concerning the role of the Eurasian Economic Union and other non-sanctioning countries with respect to possible trade diversion efforts by Russia to replace Western imports and by the sanctioning Western countries to compensate for lost export opportunities in Russia. The rationale behind the econometric model can be summarised as follows: The impact of an abrupt change in trade costs on trade caused in this case by a sudden imposition of sanctions can be estimated by simulating hypothetical trade flows in absence of sanctions and comparing those with observed trade flows. The model thus predicts a world without sanctions, i.e. a scenario with trade costs that remain unchanged after All country-specific shocks that have taken place since beginning of 2014, such as currency devaluations, the decline of international oil price or other macroeconomic and political events, however, are included in the counterfactual simulation so that their influence on trade can be separated from the impact of sanctions. The model allows us under certain assumptions and econometric constraints to make an informed statement about the impact of the sanctions and the implied diversion of trade flows to other markets for different sectors of the economy for both the sender and target countries. The technical details of the model are described in more detail in Appendix 6.2. This econometric model will thus be used to shed light on: direct impacts of the bilateral sanctions regime between Russia, the EU and other Western countries, i.e. provide an estimate of sanction-induced "lost exports"; potential indirect impacts reflected in the diversion of trade flows by companies of the European countries and Russia to third countries; sectoral effects of sanctions and potential trade diversion activities as their impact has been shown to be highly heterogeneous depending on various characteristics of firms and products. The statistical estimates thus represent the total change in exports for each country that resulted from the implementation of the sanctions and the potential mitigation efforts of firms exploiting new business opportunities in other global markets. The model is, however, limited with regard to the prediction of highly granular export flows, as e.g. in the case of dual use goods or highly specific components for arctic oil drilling, which EU regulations explicitly forbid to be exported to Russia. Consequently, as export losses with respect to these very specific commodities will not be included in the econometric model estimates, they need to be interpreted as lower-bound estimates of the true sanction-induced export losses. This limitation of the econometric analysis, however, weighs less heavily since trade in these products historically has constituted a marginal share in total exports. 31
33 Policy Department, Directorate-General for External Policies The econometric model and the counterfactual simulations have very limited data requirements and only demand information on export flows between all countries. We again use monthly flows from UN COMTRADE and aggregate them to six sectors: Food and agriculture, mining and chemicals, raw materials, manufacturing, textile, and other. We restrict the sample to data from the period 2012 to 2016 and to 97 reporting countries accounting for more than 98 % of world trade. 3.2 Model results: the impacts on international trade flows Overall trade effects In the following we provide an overview of the results of a counterfactual situation in which there are no bilateral sanctions between Russia and the 37 involved Western countries. As can be seen in Figure 13, the counterfactual scenario reflects a decline in exports, even for non-sanctioning countries, due to the strong downturn of the Russian economy, largely caused by the oil price shock of early months in 2015 and the ensuing ruble depreciation. These factors depressed Russian demand and thus by and large explain the drop in exports from sanctioning and non-sanctioning countries, as described by (Dreger, C. et al.). With the imposition of sanctions in mid-2014 a divergence of the observed flows (solid line) and the predicted flows (dotted line) can be observed. This divergence goes in opposite directions for sanctioning and non-sanctioning countries: sanctioning countries, not surprisingly, exported less to Russia than predicted (in a hypothetical world without sanctions), whereas non-sanctioning countries exported more than predicted. Figure 13: Sanctioning and non-sanctioning countries' exports to Russia: observed vs. predicted (hypothetical world without sanctions) flows Source: UN Monthly COMTRADE, WIFO calculations. 32
34 Russia s and the EU s sanctions: economic and trade effects, compliance and the way forward The figure also shows a clear shift in the source countries of Russian imports. Whereas in early 2012 almost exactly twice as much in value was imported from sanctioning countries compared to non-sanctioning countries (USD 12.7 bn vs. USD 6.3 bn January 2012), by the end of 2016 for the first time more imports came from the latter than the former (USD 6.5 bn vs. USD 6.7 bn) Impacts by sector and country Figure 14 zooms into the results for the EU and shows the observed and predicted exports to Russia disaggregated by sector. Except for exports of raw materials, all observed flows diverge from their predicted flows. While in relative terms the drop is strongest for agricultural and food products, arguably largely due to the Russian embargo on a range of these products, the drop in manufacturing exports is the most severe in absolute terms. This heterogeneity with respect to commodity groups also determines how European countries are affected, depending on their composition of exports. Figure 14: EU exports to Russia by sector Source: UN Monthly COMTRADE, WIFO calculations. Export losses across the entire EU are estimated at USD 7.9 bn in 2014, USD 12.9 bn in 2015 and USD 13.9 bn in As Table 3 shows, these effects are very heterogeneous across EU countries: Germany is bearing the brunt of the lost exports in absolute terms with around USD 13 bn over the three year period, a decrease of 13 % vis-à-vis predicted exports to Russia. In relative terms, other countries are more affected. The losses for Cyprus (35 %), Greece (23 %) and Croatia (21 %) are largely due to the decrease in exports of agricultural products. The average relative drop in total exports to Russia for EU countries is 11 %. 33
35 Policy Department, Directorate-General for External Policies Trade diversion effects The lost exports vis-à-vis Russia may have been compensated, at least partially, by shifting trade flows to other markets. There is mixed evidence if that has actually happened and if so to which extent (see also below discussion of firm-level evidence). Table 3: Total loss in EU exports to Russia over the period 2014 to 2016 Total Manufacturing Food, agricult. Mining, chemic. Raw materials Textiles Other Abs Rel Abs Rel Abs Rel Abs Rel Abs Rel Abs Rel Abs Rel AUT BEL BGR CYP CZE DEU DNK ESP EST FIN FRA GBR GRC HRV HUN IRL ITA LTU LUX LVA MLT NLD POL PRT ROU SVK SVN SWE EU Source: UN Monthly COMTRADE, WIFO calculations. Abs...total loss in bn USD; Rel...total loss as percent of predicted export flows. Figure 15 shows the predicted vs. observed exports of agri-food products by the EU to Russia (red line) as well as to China and African countries. Since the imposition of sanctions, exports to Russia have deviated strongly from their predicted values, decreasing by 23 % over the entire time period. For some European countries this drop is more pronounced than for others, e.g. agri-food exports declined by almost 90 % for Malta, but only by 2 % for Luxembourg, the differences are again largely determined by country-specific export structures and whether any of the agri-food exports were directly targeted by the Russian embargo. Figure 15 also provides some evidence that some of these lost exports to Russia may have been channelled to other destinations, two of them being the African continent and China. For both regions a clear deviation of observed from predicted flows is visible after the imposition of the sanctions regime, in particular in the medium to long run. While firms were unlikely to recover their losses in the short run (see discussion of Crozet, M. and Hinz, J.), also in the aggregate numbers exports appear to have at most only partially been diverted to other markets later on. 34
36 Figure 15: EU trade diversion of agri-food products Russia s and the EU s sanctions: economic and trade effects, compliance and the way forward Source: UN Monthly COMTRADE, WIFO calculations. Figures 16 and 17 display the export flows between the EU and Russia on the one side and the Eurasian Economic Union on the other. There is particular reason to believe that trade diversion has taken place within the Eurasian Economic Union. This suspicion appears to be merited. Both exports from Russia to other EEU countries as well as the inverse trade flow from EEU countries to Russia have visibly diverged from their prediction following the imposition of sanctions in March At the same time, interestingly, flows from the EU to EEU countries other than Russia have decreased over time, suggesting the affected EU countries did not divert their own trade away from Russia to other countries of the EEU; instead, the EU partly redirected agri-food exports to other third markets, such as USA and China (see chapter 2). Figure 16: EU and Russian exports to Eurasian Economic Union Source: UN Monthly COMTRADE, WIFO calculations. 35
37 Policy Department, Directorate-General for External Policies Figure 17: Eurasian Economic Union exports to EU and Russia Source: UN Monthly COMTRADE, WIFO calculations. A word of caution on these results is necessary, however, since 2014 the countries of the Eurasian Economic Union have pursued further steps of integration, establishing the "four freedoms", i.e. the free movements of goods, services, capital and people within the single market. Hence, as it is econometrically difficult to disentangle these effects from the diversion effect brought about by the sanctions, it cannot be ruled out that further integration of the countries of the EEU has also contributed to the difference between observed and predicted flows. Figure 18: Eurasian Economic Union exports of agri-food products to EU and Russia Source: UN Monthly COMTRADE, WIFO calculations. 36
38 Russia s and the EU s sanctions: economic and trade effects, compliance and the way forward One sector in which trade diversion from the Russian side is most likely to have happened are agricultural and food products. As the Russian embargo on certain meat and dairy products prohibited imports of these goods from European countries that had previously supplied these goods to customers in Russia, other partner countries had to be found. It appears as if a significant part of this diversion happened with respect to countries from the Eurasian Economic Union. EEU exports of these products to Russia increased by 13 % over the period from 2014 to 2016 (USD 913 mn increase per year), while the same flows to the EU over the same period decreased by 10 % (about USD 100 mn decrease per year). 3.3 Firm-level evidence on trade diversion from French firms As mentioned above, the interpretation of the results regarding trade diversion to and from the Eurasian Economic Union has to be taken with caution as sanctions were not the only variable to change over time. Furthermore, these aggregate numbers may shield some important effects at lower levels of aggregation. At the firm-level, e.g., companies previously doing business with Russia may struggle or even disappear in the face of sanctions that impede such transactions. A small but growing academic literature in the field of international trade has looked at the effects of sanctions on the firm-level. This body of work usually emphasises three different and equally important points and discusses: if firms sell less on affected markets or stop altogether (intensive vs. extensive margin); the mechanisms that drive these effects; the opportunities for affected firms to shift their sales to other markets. Two recent studies from (Haidar, J.I.) and (Crozet, M. and Hinz, J.) provide micro-level evidence in this respect. While so far there is no study on the firm-level effects of sanctions in the targeted economy in the case of Russia, (Haidar, J.I.) provides an enlightening study on the most comparable case the sanctions regime vis-à-vis Iran. He finds that large firms in Iran were better able to handle the shock and did so by shifting their sales from Western countries to China and India. Hence in the Iranian case, large firms were often able to compensate the incurred losses on affected markets in the EU and North America. (Crozet, M. and Hinz, J.) study the firm-level effects of the sanctions regime between Russia and Western countries. Aside from a global analysis of the overall "cost" of the Russian sanctions for all participants, very similar to the one conducted in this study, they use French firm-level data to answer to the three points raised above. Their analysis reveals multiple relevant results. First, French firms' exports were affected with respect to both margins of trade, i.e. the individual firm's participation on the Russian market (extensive margin) as well as the export value of those firms that stayed in that market (intensive margin). The analysis reveals that for agri-food products only about 25 % of the firms that had previously served the market were still active after the embargo was imposed; those that stayed in the market exported 89 % less than before. This should not come as a big surprise, however, as the very aim of the embargo was to prohibit trade of goods defined on the embargo list. More interestingly, perhaps, is that similar, albeit less strong, results are observed for goods that were not explicitly targeted by the embargo. Here, the export participation dropped by 15 % over the summer of 2014 and the export value of remaining firms dropped by 21 % during the same time. Second, the bulk of the costs incurred by French exporters was not caused by the Russian embargo but came as a by-product of Western sanctions, which was coined "friendly fire". More specifically, only 9 % of lost exports stemmed from the banned agri-food products. A main mechanism driving these results is identified as country risk, or political and legal instability, enhanced by the financial sanctions that were implemented in July 2014, negatively affecting the ability to financially secure international transactions. 37
39 Policy Department, Directorate-General for External Policies Another mechanism that had received some press coverage at the time of events, a consumer boycott of Western products, is effectively ruled out by the empirical analysis. Third, and particularly interesting in the context of this current report, (Crozet, M. and Hinz, J.) show that trade diversion, at least in the short run, was very limited. In fact those firms that had previously exported agri-food products banned by the Russian embargo were not able to recover their losses. These firms had, on average, an exposure to the Russian market of 20 % prior to the political crisis and lost, again on average, roughly 20 % of their total exports to all markets after the imposition of the embargo in August For firms that were exporting goods not banned by the embargo the effects were less severe, with an average exposure to the Russian market of 14 % and a decrease in total firm exports of 6 %. It is important to note that (Crozet, M. and Hinz, J.) limit their firm-level analysis to effects in the year 2014 and hence provide empirical evidence on firm behaviour in the very first time after the sanctions had been imposed. While this short-run focus may seem like a limitation, it made it possible to cleanly identify the effects, as other sources of disturbance with similar effects could effectively be ruled out. Over the medium to long run these initially strong short-run effects are likely to have partially dissipated. 38
40 4 Conclusions Russia s and the EU s sanctions: economic and trade effects, compliance and the way forward After the gradual introduction of the EU sanctions and the countervailing Russian sanctions in the first half of 2014, a discussion about the economic costs, mainly for European countries, but also for Russia, arose very quickly. Initially, the discussion focused on the negative welfare consequences of disrupting trade. It is largely undisputed among economists that additional barriers to trade and investment, raised in this case by restrictions on exports of certain commodities as well as financial restrictions, will reduce the volume of trade and foreign investment and consequently production, value added and employment of all trading partners. The specific contribution of the sanctions to the observed decline in EU trade with Russia after 2013, however, is more difficult to determine. Shortly before the sanctions were put in place, other factors, most importantly the slump in international oil price, damaged the Russian economy. The subsequent devaluation of the ruble reduced foreign import demand and thus contributed to declining trade volumes. Disentangling all different factors influencing trade flows between Russia and other countries at the same time thus posed the main challenge for researchers attempting to quantify the impact of sanction-induced economic costs. Adding to the difficulties of measuring the welfare effects of the sanctions, firms in market economies adapt to changing business conditions in their quest to maximise profits. If business opportunities in one market deteriorate or disappear altogether, they will seek for alternative destination markets in other countries to compensate for their losses. Disruptions of bilateral trade relationships may therefore lead to trade diversion effects which over time could make up for at least some of the exports lost after the sanctions entered into force and thus reduce negative welfare effects to a limited extent. Furthermore, some firms may also attempt to circumvent the introduced legal trade restrictions. Non-compliance with EU and Russian trade sanctions, for instance, may reduce economic costs, but thwart the intentions of policy makers. Finally, beyond the direct costs of specific trade restrictions, which in case of the sanctions/countersanctions only concern a limited group of commodities, additional (and much higher) costs may arise due to the implementation of financial sanctions (restricting the availability of funds for firms in Russia engaging, for example, in investment activities) and, even more importantly, due to a severe deterioration of the business climate between the EU and Russia in the wake of the sanctions and the political conflict. In fact, EU exports to Russia declined not only for commodity groups directly affected by the sanctions, but for most other non-sanctioned goods as well. Thus, the general worsening of economic relationships as a corollary of all sanction measures and political tensions seems most important. It is this indirect economic impact that the project at hand, like most other cost assessment attempts, is mainly concerned about. This report addresses all of these issues. The main conclusions can be summarised as follows: EU exports to Russia have declined significantly in recent years With a share of 7.7 % in total exports (2013, without deliveries within the EU) Russia was the fourth largest trading partner of the EU. On the other hand, in the same year 42.4 % of total Russian exports were delivered to EU countries, which made the EU Russia's most important export market. These economically important trade relationships have, however, suffered over the last few years. As a consequence of the sanctions, but also due to other external factors weakening the Russian economy, EU exports to Russia declined by 20.7 % annually between 2013 and 2016, while they had increased by 20.0 % per year between 2009 and Proximity to Russia and historically formed economic relationships to Russia do matter in terms of country-specific impacts. The shares of Russia in total exports of the Baltic countries, but also of Poland, the Czech Republic, Austria and Hungary declined considerably and much more than for the EU as a whole. 39
41 Policy Department, Directorate-General for External Policies Trade diversion has mitigated the economic costs of the sanctions only to a very limited extent While firms were unlikely to recover their sales in the short run, our analysis based on aggregate numbers provides rudimentary evidence that losses in EU exports to Russia may have been compensated, but only marginally, by rechanneling trade flows to other destinations, two of them being the African continent and China. A more detailed analysis on agri-food trade flows confirms that the EU has managed to partly redirect agri-food exports to alternative third markets, specifically they grew by 2 % in 2016 as compared to the previous year. The highest relative gains were achieved with respect to exports to the USA (+5.5 %), China (+13.3 %), Switzerland (+2.4 %) and Japan (+7.4 %). In contrast, it appears as if a significant part of trade diversion from the Russian side occurred with respect to countries from the Eurasian Economic Union. In particular, Russian agri-food imports from the EEU increased by 13% over the time period from 2014 to Evidence for initial non-compliance attempts and legal trade diversion Although non-compliance with the sanctions has reportedly been deemed irrelevant, at least with respect to exports of banned agri-food products to Russia, some empirical traces exist, suggesting that trade may have been rerouted to Russia through certain transit countries, in particular Belarus, Serbia and Macedonia. Not only did exports from EU countries to these three countries increase after the sanctions had been implemented, at the same time export flows between Belarus, Serbia, Macedonia and Russia intensified as well. For instance, agri-food exports from Serbia and Belarus to Russia increased by 13 % between August 2014 and December 2014 as compared to the same period a year before. However, to prevent non-compliance activities, Russian authorities reinforced the control of inflows of embargoed products from sanctioned countries through third countries, in particular within the Eurasian Economic Union, and blocked suspected products at the Russian border. Moreover, it was reported that some altogether legal diversion of trade flows render effects similar to non-compliance activities. This occurs when goods originally produced by a non-sanctioning country to be sold on the home market are being exported to Russia, replaced at home by imports from the EU. Sanction-induced export losses are estimated to account for 11 % of total EU exports for the years 2014 to 2016 The estimated sanction-specific loss of EU exports amounts to about USD 34.7 bn for the period 2014 to These estimates take into account all types of sanctions, financial sanctions, "smart sanctions", the Russian embargo on certain agri-food products, but also the general worsening of trade relationships as a corollary of all sanction measures and political tensions. Not surprisingly, in absolute terms Germany is bearing the brunt of lost exports to Russia, while in relative terms other countries like Cyprus, Greece and Croatia are more affected, mainly due to the decrease in exports of agricultural products. The average relative drop in total exports to Russia for EU countries amounts to 11 %. EU-wide impacts of export losses estimated at less than 0.2 % of total value added and employment The most recent estimations of direct and indirect valued added and employment effects of the sanctions were carried out by WIFO in the fall of The estimated sanction-induced decline of EU exports to Russia of about EUR 20 bn (USD 22 bn) for 2015 imply a 0.2 % loss in total value added (EUR bn) and employment ( jobs) for the EU as a whole. These estimates, however, did not consider any compensating trade diversion effects, which, however, reduce export losses only marginally. Based on the estimates presented in this study, which put export losses at EUR 11.6 bn (USD 12.9 bn) for 2015, the economy-wide impacts for the EU are likely to be less than 0.2 % of total value added and employment. The potential impact of the sanctions for the Russian economy is estimated at 8 % to 10 % of GDP. 40
42 Russia s and the EU s sanctions: economic and trade effects, compliance and the way forward Shortages in foreign investment and funding incur further potential economic costs Although the main impact of sanctions is derived from direct and indirect barriers to trade and a subsequent reduction in exports, other economic costs may arise. These include a decline of EU investments in Russia, but also a drop of total investment in the Russian energy sector, with long-run repercussions for energy production, a large share of which is exported to the EU and hence represents a major source of government revenues in Russia. 41
43 Policy Department, Directorate-General for External Policies 5 References Agra Europe, Russland gleicht Rückgang der Käse-Importe beinahe aus, Report, Agricistrade, Monitoring of Agri-food Trade Developments between Belarus and Russia in 2014, IPM Research Center, April Ahn, D. and Ludema, R., 'Measuring Smartness: Understandig the Economic Impact of Targeted Sanctions', U.S. Department of State, Office of the Chief Economist, Working Paper, , Anderson, J.E., van Wincoop, E., 'Gravity with Gravitas: A Solution to the Border Puzzle', American Economic Review, 93(1), 2003, pp BMEL-AG, Auswirkungen der russischen Importbeschränkungen auf die deutsche Agrar- und Ernährungswirtschaft, Bericht über die Auswirkungen des russischen Importstopps auf die EU-Märkte für landwirtschaftliche Erzeugnisse und Lebensmittel, Stand: , Bond, I., Odendahl, C., and Rankin, J., Frozen: The politics and economics of sanctions against Russia, Centre for European Reform, March Boulanger, P., Dudu, H., Ferrari, E. and Philippidis, G.,'Russian Roulette at the Trade Table: A Specific Factors CGE Analysis of an Agri-food Import Ban', Journal of Agricultural Economics, 67(2), 2016, pp Christen, E., Fritz, O., Huber, P. and Streicher, G., The Economic Impacts of the EU-Russia Trade Conflict, Research Report for the Austrian Federal Ministry of Science, Research and Economy, WIFO, Christen, E., Fritz, O. and Streicher, G., Effects of the EU-Russia Economic Sanctions on Value Added and Employment in the European Union and Switzerland, Research Report for LENA, the Leading European Newspaper Alliance, WIFO, Christen, E., Fritz, O., Streicher, G. and Hinz, J., Effects of the EU-Russia Economic Sanctions on Value Added and Employment in Austria and the EU, Research Report for the Austrian Federal Ministry of Science, Research and Economy, WIFO, Crozet, M. and Hinz, J., 'Friendly fire-the trade impact of the Russia sanctions and counter-sanctions', Kiel Working Paper, No. 2059, Dabrowski, M., The systemic Roots of Russia's recession, Bruegel Policy Contribution, October Deutscher Bundestag, 'Folgeschäden der Sanktionen der Europäischen Union gegenüber der Russischen Föderation sowie der Russischen Föderation gegenüber der Europäischen Union für die einzelnen Bundesländer', Wissenschaftliche Dienste, WD /17, DG AGRI, Information Note on the Russian Ban on Agri-food Products from the EU, Brussels, (retrieved 30 June 2017). Dreger, C., Fidrmuc, J., Kholodilin, K. and Ulbricht, D., 'Between the hammer and the anvil: The impact of economic sanctions and oil prices on Russia s ruble', Journal of Comparative Economics, 44(2), 2016, pp Dreyer, I. and Luengo-Cabrera, J. (eds.), On target? EU sanctions as security policy tools, European Union, Institute for Security Studies, Report No. 25, September Dreyer, I. and Popescu, N., 'Do sanctions against Russia work?', European Union Institute for Security Studies, Brief Issue, No. 35, December European Parliament, The Russian ban on agricultural products, Briefing, Brussels, EU Publishing, April European Parliament, Economic impact on the EU of sanctions over Ukraine conflict, Briefing, Brussels, EU Publishing, October European Parliament, The Russian Embargo: Impact on the Economic and Employment Situation in the EU, Briefing, Brussels, EU Publishing, October FAO, Russia's Restrictions on Imports of Agricultural and Food Products: An Initial Assessment, Rome, September Fedoseeva, S., 'Russian Agricultural Import Ban: Quantifying Losses of German Agri-food Exporters', Schriften der Gesellschaft für Wirtschafts- und Sozialwissenschaften des Landbaues, Landwirtschaftsverlag, Münster, Band 52, 2017, pp Giumelli, F., 'The Redistributive Impact of Restrictive Measures on EU Members: Winners and Losers from Imposing Sanctions on Russia', Journal of Common Market Studies, published online March
44 Russia s and the EU s sanctions: economic and trade effects, compliance and the way forward Gros, D. and Di Salvo, M., Revisting Sanctions on Russia and Counter-Sanctions on the EU: the economic impact three years later, CEPS Commentary, July GTAI (Germany Trade and Invest - Gesellschaft für Außenwirtschaft und Standortmarketing mbh), GTAI-Special Russland-Sanktionen, einfuhrverbot-fuer-lebensmittel-aus-der-eu,did= html. Gurvich, E. and Prilepskiy, I., 'The impact of financial sanctions on the Russian economy', Russian Journal of Economics, 1(4), 2015, pp Haidar, J.I., 'Sanctions and export deflection: evidence from Iran', Economic Policy, 32(90), 2017, pp Harrell, P.E., Keatinge, T., Lain, S. and Rosenberg, E., The Future of Transatlantic Sanctions on Russia, Center for a New American Security, Washington D. C., Havlik, P., 'Economic Consequences of the Ukraine Conflict', wiiw Policy Notes and Reports, No. 14, November Head, K. and Mayer, T., 'Gravity equations: Workhorse, toolkit, and cookbook', in Gopinath, G., Helpman, E. and Rogoff, K., Handbook of International Economics, Volume 4, Elsevier, Amsterdam, 2014, pp Head, K. and Mayer, T., 'What separates us? Sources of resistance to globalization', Canadian Journal of Economics, 46(4), 2013, pp Hinz, J., 'The Cost of Sanctions: Estimating Lost Trade with Gravity', mimeo, Hufbauer, G., Schott, J., Elliott, K. and Oegg, B., Economic Sanctions Reconsidered (3rd ed.), Peterson Institute for International Economics, Washington, D. C., Institute of Economic Forecasting, Estimating potential effect of sanctions on economic development in Russia and EU, Russian Academy of Science, Ito, K, 'The impact of oil price volatility on macroeconomic activity in Russia', Atlantic Review of Economics, 9(5), 2010, pp Kholodilin, K., Ulbricht, D. and Wagner, G., Are the Economic Sanctions against Russia Effective?, Deutsches Institut für Wirtschaftsforschung, DIW Roundup, Liefert, W. and Liefert, O., 'Russia's Economic Crisis and it's Agricultural and Food Economy', Choices, 30(1), 2015, pp Moret, E., Biersteker, T., Giumelli, F., Portela, C., Veber, M., Bastiat-Jarosz, D. and Bobocea, C., The New Deterrent? International Sanctions against Russia over the Ukraine Crisis: Impacts, Costs and further Action, Graduate Institute Geneva, Programme for the Study of International Governance (PSIG), October Nelson, R., U.S. Sanctions and Russia's Economy, Congressional Research Service, CRS Report, , February Nikulina, A.Y. and Kruk, M.N.,'Impact of Sanctions of European Union and Unites States of America on the Development of Russian Oil and Gaz Complex', International Journal of Economics and Financial Issues, 6(4), 2016, pp Peters, E.S., An Inquiry into the Effect of the 2014 Russian Sanctions on European Gasoline Markets, University of Tennessee Honors Thesis Projects, Rautava, J., 'The role of oil prices and the real exchange rate in Russia's economy-a cointegration approach', Journal of Comparative Economics, 32(2), 2004, pp Santos Silva, J.M.C. and Tenreyro, S., 'The Log of Gravit', Review of Economics and Statistics, 88(4), 2006, pp Sinabell, F., Egartner, S., Heinschink, K., Pistrich, K., Resl, T. and Tribl, C., Beschränkung der Agrarexporte in die Russische Föderation, Mögliche Auswirkungen für Österreich, WIFO, Wien, Tinbergen, J., Shaping the World Economy; Suggestions for an International Economic Policy, The Twentieth Century Fund, New York, Tuzova, Y. and Qayum, F., 'The impact on Putin's Russia', Energy Policy, 90(C), 2016, pp Url, T., 'Steigende Internationalisierung erzeugt neue Herausforderungen für staatliche Exportgarantien', WIFO-Monatsberichte, 89(8), 2016, pp Vymyatnina, Y., 'Credit Dynamics of Various Entities in Russia: Impact of Oil Prices and Sanctions', EcoMod, No. 9543,
45 Policy Department, Directorate-General for External Policies Wengle, S., 'The Domestic Effects of the Russian Food Embargo', Demokratizatsiya: The Journal of Post-Soviet Democratization, 24(3), 2016, pp WKO, Aktueller Stand der Sanktionen gegen Russland und die Ukraine, Stand 29. Juni 2017, (retrieved 30 June 2017). 44
46 6 Appendix Russia s and the EU s sanctions: economic and trade effects, compliance and the way forward 6.1 Details on the sectoral breakdown CN2 Description Sector 01 LIVE ANIMALS Agri-food 02 MEAT AND EDIBLE MEAT OFFAL Agri-food 03 FISH AND CRUSTACEANS, MOLLUSCS AND Others AQUATIC INVERTEBRATES Agri-food 04 DAIRY PRODUCE; BIRDS' EGGS; NATURAL HONEY; EDIBLE PRODUCTS OF ANIMAL ORIGIN, NOT ELSEWHERE SPECIFIED OR INCLUDED Agri-food 05 PRODUCTS OF ANIMAL ORIGIN, NOT ELSEWHERE SPECIFIED OR INCLUDED Agri-food 06 LIVE TREES AND Others PLANTS; BULBS, ROOTS AND THE LIKE; CUT FLOWERS AND ORNAMENTAL FOLIAGE Agri-food 07 EDIBLE VEGETABLES AND CERTAIN ROOTS AND TUBERS Agri-food 08 EDIBLE FRUIT AND NUTS; PEEL OF CITRUS FRUIT OR MELONS Agri-food 09 COFFEE, TEA, MATÉ AND SPICES Agri-food 10 CEREALS Agri-food 11 PRODUCTS OF THE MILLING INDUSTRY; MALT; STARCHES; INULIN; WHEAT GLUTEN Agri-food 12 OIL SEEDS AND OLEAGINOUS FRUITS; MISCELLANEOUS GRAINS, SEEDS AND FRUIT; INDUSTRIAL OR MEDICINAL PLANTS; STRAW AND FODDER Agri-food 13 LAC; GUMS, RESINS AND Others VEGETABLE SAPS AND EXTRACTS Agri-food 14 VEGETABLE PLAITING MATERIALS; VEGETABLE PRODUCTS NOT ELSEWHERE SPECIFIED OR INCLUDED Agri-food 15 ANIMAL OR VEGETABLE FATS AND OILS AND THEIR CLEAVAGE PRODUCTS; PREPARED EDIBLE FATS; ANIMAL OR VEGETABLE WAXES Agri-food 16 PREPARATIONS OF MEAT, OF FISH OR OF CRUSTACEANS, MOLLUSCS OR Others AQUATIC INVERTEBRATES Agri-food 17 SUGARS AND SUGAR CONFECTIONERY Agri-food 18 COCOA AND COCOA PREPARATIONS Agri-food 19 PREPARATIONS OF CEREALS, FLOUR, STARCH OR MILK; PASTRYCOOKS' PRODUCTS Agri-food 20 PREPARATIONS OF VEGETABLES, FRUIT, NUTS OR Others PARTS OF PLANTS Agri-food 21 MISCELLANEOUS EDIBLE PREPARATIONS Agri-food 22 BEVERAGES, SPIRITS AND VINEGAR Agri-food 23 RESIDUES AND WASTE FROM THE FOOD INDUSTRIES; PREPARED ANIMAL FODDER Agri-food 24 TOBACCO AND MANUFACTURED TOBACCO SUBSTITUTES Agri-food 2501 SALT Agri-food 27 MINERAL FUELS, MINERAL OILS AND PRODUCTS OF THEIR DISTILLATION; BITUMINOUS SUBSTANCES; MINERAL WAXES Raw materials 41 RAW HIDES AND SKINS (Others THAN FURSKINS) AND LEATHER Raw materials 42 ARTICLES OF LEATHER; SADDLERY AND HARNESS; TRAVEL GOODS, HANDBAGS AND SIMILAR CONTAINERS; Raw materials ARTICLES OF ANIMAL GUT (Others THAN SILKWORM GUT) 43 FURSKINS AND ARTIFICIAL FUR; MANUFACTURES THEREOF Raw materials 44 WOOD AND ARTICLES OF WOOD; WOOD CHARCOAL Raw materials 45 CORK AND ARTICLES OF CORK Raw materials 47 PULP OF WOOD OR OF Others FIBROUS CELLULOSIC MATERIAL; RECOVERED (WASTE AND SCRAP) PAPER OR PAPERBOARD Raw materials 48 PAPER AND PAPERBOARD; ARTICLES OF PAPER PULP, OF PAPER OR OF PAPERBOARD Raw materials 67 PREPARED FEATHERS AND DOWN AND ARTICLES MADE OF FEATHERS OR OF DOWN; ARTIFICIAL FLOWERS; Raw materials ARTICLES OF HUMAN HAIR 68 ARTICLES OF STONE, PLASTER, CEMENT, ASBESTOS, MICA OR SIMILAR MATERIALS Raw materials 69 CERAMIC PRODUCTS Raw materials 70 GLASS AND GLASSWARE Raw materials 71 NATURAL OR CULTURED PEARLS, PRECIOUS OR SEMI-PRECIOUS STONES, PRECIOUS METALS, METALS CLAD WITH PRECIOUS METAL, AND ARTICLES THEREOF; IMITATION JEWELLERY; COIN Raw materials 72 IRON AND STEEL Raw materials 73 ARTICLES OF IRON OR STEEL Raw materials 74 COPPER AND ARTICLES THEREOF Raw materials 75 NICKEL AND ARTICLES THEREOF Raw materials 76 ALUMINIUM AND ARTICLES THEREOF Raw materials 78 LEAD AND ARTICLES THEREOF Raw materials 45
47 Policy Department, Directorate-General for External Policies CN2 Description Sector 79 ZINC AND ARTICLES THEREOF Raw materials 80 TIN AND ARTICLES THEREOF Raw materials 81 Others BASE METALS; CERMETS; ARTICLES THEREOF Raw materials 83 MISCELLANEOUS ARTICLES OF BASE METAL Raw materials 25 SULPHUR; EARTHS AND STONE; PLASTERING MATERIALS, LIME AND CEMENT Mining, chemicals 26 ORES, SLAG AND ASH Mining, chemicals 28 INORGANIC CHEMICALS; ORGANIC OR INORGANIC COMPOUNDS OF PRECIOUS METALS, OF RARE-EARTH METALS, OF RADIOACTIVE ELEMENTS OR OF ISOTOPES Mining, chemicals 29 ORGANIC CHEMICALS Mining, chemicals 30 PHARMACEUTICAL PRODUCTS Mining, chemicals 31 FERTILISERS Mining, chemicals 32 TANNING OR DYEING EXTRACTS; TANNINS AND THEIR DERIVATIVES; DYES, PIGMENTS AND Others COLOURING MATTER; PAINTS AND VARNISHES; PUTTY AND Others MASTICS; INKS Mining, chemicals 33 ESSENTIAL OILS AND RESINOIDS; PERFUMERY, COSMETIC OR TOILET PREPARATIONS Mining, chemicals 34 SOAP, ORGANIC SURFACE-ACTIVE AGENTS, WASHING PREPARATIONS, LUBRICATING PREPARATIONS, ARTIFICIAL WAXES, PREPARED WAXES, POLISHING OR SCOURING PREPARATIONS, CANDLES AND SIMILAR ARTICLES, MODELLING PASTES, DENTAL WAXES AND DENTAL PREPARATION Mining, chemicals 35 ALBUMINOIDAL SUBSTANCES; MODIFIED STARCHES; GLUES; ENZYMES Mining, chemicals 36 EXPLOSIVES; PYROTECHNIC PRODUCTS; MATCHES; PYROPHORIC ALLOYS; CERTAIN COMBUSTIBLE Mining, chemicals PREPARATIONS 38 MISCELLANEOUS CHEMICAL PRODUCTS Mining, chemicals 39 PLASTICS AND ARTICLES THEREOF Mining, chemicals 40 RUBBER AND ARTICLES THEREOF Mining, chemicals 82 TOOLS, IMPLEMENTS, CUTLERY, SPOONS AND FORKS, OF BASE METAL; PARTS THEREOF OF BASE METAL Manufacturing 84 NUCLEAR REACTORS, BOILERS, MACHINERY AND MECHANICAL APPLIANCES; PARTS THEREOF Manufacturing 85 ELECTRICAL MACHINERY AND EQUIPMENT AND PARTS THEREOF; SOUND RECORDERS AND REPRODUCERS, TELEVISION IMAGE AND SOUND RECORDERS AND REPRODUCERS, AND PARTS AND ACCESSORIES OF SUCH ARTICLES 86 RAILWAY OR TRAMWAY LOCOMOTIVES, ROLLING STOCK AND PARTS THEREOF; RAILWAY OR TRAMWAY TRACK FIXTURES AND FITTINGS AND PARTS THEREOF; MECHANICAL (INCLUDING ELECTROMECHANICAL) TRAFFIC SIGNALLING EQUIPMENT OF ALL KINDS Manufacturing Manufacturing 87 VEHICLES Others THAN RAILWAY OR TRAMWAY ROLLING STOCK, AND PARTS AND ACCESSORIES THEREOF Manufacturing 88 AIRCRAFT, SPACECRAFT, AND PARTS THEREOF Manufacturing 89 SHIPS, BOATS AND FLOATING STRUCTURES Manufacturing 90 OPTICAL, PHOTOGRAPHIC, CINEMATOGRAPHIC, MEASURING, CHECKING, PRECISION, MEDICAL OR Manufacturing SURGICAL INSTRUMENTS AND APPARATUS; PARTS AND ACCESSORIES THEREOF 91 CLOCKS AND WATCHES AND PARTS THEREOF Manufacturing 92 MUSICAL INSTRUMENTS; PARTS AND ACCESSORIES OF SUCH ARTICLES Manufacturing 93 ARMS AND AMMUNITION; PARTS AND ACCESSORIES THEREOF Manufacturing 94 FURNITURE; BEDDING, MATTRESSES, MATTRESS SUPPORTS, CUSHIONS AND SIMILAR STUFFED FURNISHINGS; LAMPS AND LIGHTING FITTINGS, NOT ELSEWHERE SPECIFIED OR INCLUDED; ILLUMINATED SIGNS, ILLUMINATED NAMEPLATES AND THE LIKE; PREFABRICATED BUILDINGS Manufacturing 95 TOYS, GAMES AND SPORTS REQUISITES; PARTS AND ACCESSORIES THEREOF Manufacturing 96 MISCELLANEOUS MANUFACTURED ARTICLES Manufacturing 50 SILK Textiles 51 WOOL, FINE OR COARSE ANIMAL HAIR; HORSEHAIR YARN AND WOVEN FABRIC Textiles 52 COTTON Textiles 53 Others VEGETABLE Textiles FIBRES; PAPER YARN AND WOVEN FABRICS OF PAPER YARN Textiles 54 MAN-MADE FILAMENTS; STRIP AND THE LIKE OF MAN-MADE Textiles MATERIALS Textiles 55 MAN-MADE STAPLE FIBRES Textiles 56 WADDING, FELT AND NONWOVENS; SPECIAL YARNS; TWINE, CORDAGE, ROPES AND CABLES AND Textiles ARTICLES THEREOF 57 CARPETS AND Others Textiles FLOOR COVERINGS Textiles 58 SPECIAL WOVEN FABRICS; TUFTED Textiles FABRICS; LACE; TAPESTRIES; TRIMMINGS; EMBROIDERY Textiles 46
48 Russia s and the EU s sanctions: economic and trade effects, compliance and the way forward CN2 Description Sector 59 IMPREGNATED, COATED, COVERED OR LAMINATED Textiles FABRICS; Textiles ARTICLES OF A KIND SUITABLE FOR INDUSTRIAL USE Textiles 60 KNITTED OR CROCHETED FABRICS Textiles 61 ARTICLES OF APPAREL AND CLOTHING ACCESSORIES, KNITTED OR CROCHETED Textiles 62 ARTICLES OF APPAREL AND CLOTHING ACCESSORIES, NOT KNITTED OR CROCHETED Textiles 63 Others MADE-UP Textiles ARTICLES; SETS; WORN CLOTHING AND WORN Textiles ARTICLES; RAGS Textiles 64 FOOTWEAR, GAITERS AND THE LIKE; PARTS OF SUCH ARTICLES Textiles 65 HEADGEAR AND PARTS THEREOF Textiles 37 PHOTOGRAPHIC OR CINEMATOGRAPHIC GOODS Others 46 MANUFACTURES OF STRAW, OF ESPARTO OR OF Others PLAITING MATERIALS; BASKETWARE AND WICKERWORK Others 49 PRINTED BOOKS, NEWSPAPERS, PICTURES AND Others PRODUCTS OF THE PRINTING INDUSTRY; MANUSCRIPTS, TYPESCRIPTS AND PLANS 66 UMBRELLAS, SUN UMBRELLAS, WALKING STICKS, SEAT-STICKS, WHIPS, RIDING-CROPS AND PARTS THEREOF 97 WORKS OF ART, COLLECTORS' PIECES AND ANTIQUES Others 99 CONFIDENTIAL Confidential Others Others 6.2 Gravity model of international trade and counterfactual simulation The gravity model of international trade is recognised as one producing the most persistent and stable results of all models applied in the empirical trade literature (Head, K. and Mayer, T., 2014). The theoretical framework is originally based on an observation first stated by (Tinbergen, J.) that countries trade more with other countries, all other things being equal, (1) the larger they themselves as an exporting country are, (2) the larger the importing country is and (3) the closer the two countries are located to each other, i.e. the smaller their so-called bilateral resistance. In the past two decades the theoretical foundations have been dramatically improved such that almost all modern trade models exhibit a gravity-like expression of bilateral trade flows (Head, K. and Mayer, T., 2013). One of the most influential contributions is that by (Anderson, J.E. and van Wincoop, E.), who derive a structural gravity equation that features next to bilateral resistance exporter- and importer-specific multilateral resistance terms (MRT). MRT can be thought of as the importing or exporting countries ease of access to the world market. The theoretical trade model sketched below follows (Hinz, J.) and provides a general equilibrium counterfactual framework, i.e. it uses a setup that allows the computation of trade flows in a counterfactual situation that takes changes to bilateral resistances, multilateral resistances, expenditure and production figures into account. Let X ijt describe exports from country i to jj at time tt as X ijt = Y it Ω it X jt Φ jt ϕ ijt where Y it = j X ijt is the value of export production in i at time t and X jt = i X ijt is the value of export expenditures in j at time t. The aforementioned MRT are given by Ω it and Φ jt. The term ϕ ijt nests all bilateral trade impediments, including sanctions. This gravity model can then be estimated using a Poisson Pseudo Maximum Likelihood (PPML) estimator following (Santos Silva, J.M.C. and Tenreyro, S.) as X ijt = exp Ψ it + Θ jt + ϕ ijm + ϵ ijt 47
49 Policy Department, Directorate-General for External Policies where Ψ it and Θ jt are fixed effects that capture everything that is specific to the exporter or importer at a given time that affects all trading partners equally. In the current context this implies that all macroeconomic effects in Russia and sanctioning Western countries are captured. This in turn means that the computed sanctions effects can be cleanly separated from other macroeconomic shocks to Russia, such as the depreciation of the ruble in response to the oil price shock in early 2015 (see also Dreger, C. et al.). The estimated term ϕ ijm captures all bilateral monthly effects, hence it captures the effects of the sanctions. Following the model setup of (Hinz, J.), counterfactual flows can then be computed as X ijt = Y it Ω it X jt Φ jt ϕ ijt where X ijt are the hypothetical flows between countries ii and jj at time tt in absence of sanctions. Counterfactual production Y it, expenditure X jt and multilateral resistances Ω t and Φ t can be computed as Y it X jt = Ω it Ω it = Ω jt Ω jt 1 1 σ 1 1 σ X ijt l j X ijt l i Ω t = ϕ^m X 1 T 1 t Φ t and Φ t = ϕ^m Yt Ω t The lost trade between two countries, i.e. in a situation with and without sanctions in the present case, is then easily computed as the difference between observed and predicted trade flows: X ijt X ijt. 48
50 6.3 Workshop programme Russia s and the EU s sanctions: economic and trade effects, compliance and the way forward DIRECTORATE-GENERAL FOR EXTERNAL POLICIES POLICY DEPARTMENT For the Committee on International Trade (INTA) and the Delegation to the EU-Russia Parliamentary Cooperation Committee WORKSHOP Russia s and the EU s sanctions: economic and trade effects, compliance and the way forward Thursday, 7 September Brussels, Altiero Spinelli building (ASP), Room ASP A3E-2 PROGRAMME Welcome and introductory remarks by MEP Mr Hannu Takkula, Standing Rapporteur for Russia in the Committee on International Trade MEP Ms Liisa Jaakonsaari, First Vice Chair of the Delegation to the EU-Russia Parliamentary Cooperation Committee Presentation of the study of the WIFO Institute Dr Oliver Fritz, Senior Research Associate, Österreichisches Institut für Wirtschaftsforschung WIFO Reactions to the study from: Ms Hilde Hardeman, Head of the Service for Foreign Policy Instruments, European Commission Mr Petros Sourmelis, Head of Unit for Trade aspects of European neighbourhood policy & Trade relations with countries of the CIS and Balkans, European Commission, DG TRADE Dr Frank Schauff, Chief Executive Officer, Association of European Businesses in the Russian Federation (AEB) Questions & Answers / Debate Concluding remarks by MEP Mr Hannu Takkula and MEP Ms Liisa Jaakonsaari 49

51 Policy Department, Directorate-General for External Policies 6.4 Workshop presentation slides 50

52 Russia s and the EU s sanctions: economic and trade effects, compliance and the way forward 51

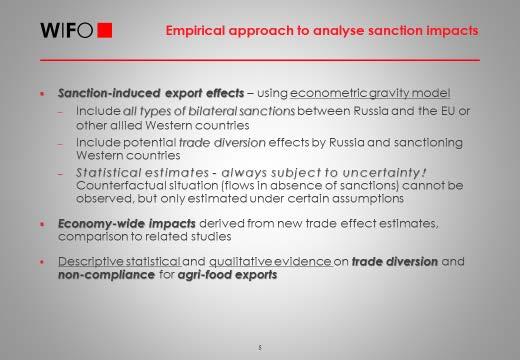
53 Policy Department, Directorate-General for External Policies 52

54 Russia s and the EU s sanctions: economic and trade effects, compliance and the way forward 53
Supplementary figures
 Supplementary figures Source: OECD (211d, p. 8). Figure S3.1 Business enterprise expenditure on R&D, 1999 and 29 (as a percentage of GDP) ISR FIN SWE KOR (1999, 28) JPN CHE (2, 28) USA (1999, 28) DNK AUT
The economic outlook for Europe and Central Asia, including the impact of China
 ECA Economic Update April 216 The economic outlook for and, including the impact of China Hans Timmer Chief Economist and Region April 7, 216 Kiev, Ukraine 1 Overview Low growth is expected in and (ECA),
CLOUDY OUTLOOK FOR GROWTH IN EMERGING EUROPE AND CENTRAL ASIA
 CLOUDY OUTLOOK FOR GROWTH IN EMERGING EUROPE AND CENTRAL ASIA Presentation by Laura Tuck, Vice President, ECA Hans Timmer, Chief Economist, ECA October 8, 2014 Annual Meetings Three key trends for Emerging
Labor Market Laws and Intra-European Migration
 European Journal of Population manuscript No. (will be inserted by the editor) Labor Market Laws and Intra-European Migration The Role of the State in Shaping Destination Choices ONLINE APPENDIX Table
Value added trade dynamics in the wider Europe before and after the crisis:
 Wiener Institut für Internationale Wirtschaftsvergleiche The Vienna Institute for International Economic Studies www.wiiw.ac.at Central Europe s Growth P New Normal World Session II: Real economy global
Council of Europe Annual Penal Statistics SPACE I & SPACE II Facts, figures and tendencies. Marcelo F. Aebi & Natalia Delgrande
 Council of Europe Conference of Directors of Prison Administration (CDPC) Council of Europe Annual Penal Statistics SPACE I & Facts, figures and tendencies Marcelo F. Aebi & Natalia Delgrande Categories
OECD ECONOMIC SURVEY OF LITHUANIA 2018 Promoting inclusive growth
 OECD ECONOMIC SURVEY OF LITHUANIA 218 Promoting inclusive growth Vilnius, 5 July 218 http://www.oecd.org/eco/surveys/economic-survey-lithuania.htm @OECDeconomy @OECD 2 21 22 23 24 25 26 27 28 29 21 211
South-East Europe s path to convergence
 South-East Europe s path to convergence Skopje, 16 February 2018 Carlo Monticelli Vice-Governor Council of Europe Development Bank 1998 1999 2000 2001 2002 2003 2004 2005 2006 2007 2008 2009 2010 2011
Challenges for Baltics as for the Eurozone countries having Advanced Economy status
 Challenges for Baltics as for the Eurozone countries having Advanced Economy status 4th European High-level Panel Discussion on Banking Vilnius, February 4, 216 Bas B. Bakker Senior Regional Resident Representative
Big Government, Small Government and Corruption: an European Perspective. Alina Mungiu-Pippidi Hertie School of Governance
 Big Government, Small Government and Corruption: an European Perspective Alina Mungiu-Pippidi Hertie School of Governance www.againstcorruption.eu Outline of this talk What is corruption in Europe? Big
Curing Europe s Growing Pains: Which Reforms?
 Curing Europe s Growing Pains: Which Reforms? Luc Everaert Assistant Director European Department International Monetary Fund Brussels, 21 November Copyright rests with the author. All rights reserved.
Key figures for 2012 In brief % 13% Survey 1/4
 April 2014 Executive Summary SPACE I 2012 Marcelo F. Aebi, Natalia Delgrande www.unil.ch/space Project SPACE at University of Lausanne, Switzerland www.coe.int/prison Council for Penological Co-operation
Macroeconomic Outlook and Challenges for the CEE Region. Luboš Komárek CFO Executive Summit Prague, 29 th April 2015
 Macroeconomic Outlook and Challenges for the CEE Region Luboš Komárek CFO Executive Summit Prague, 29 th April 2015 Outline I. Mapping out the current situation and economic forecast United States Euro
The Boom-Bust in the EU New Member States: The Role of Fiscal Policy
 The Boom-Bust in the EU New Member States: The Role of Fiscal Policy JVI Lecture, Vienna, January 21, 216 Bas B. Bakker Senior Regional Resident Representative for Central and Eastern Europe Outline The
SPACE I 2015 Facts & Figures
 EXECUTIVE SUMMARY MARCH 2017 SPACE I 2015 Facts & Figures Marcelo F. Aebi (PhD), Christine Burkhardt (MA), Mélanie M. Tiago (MA) www.unil.ch/space Project SPACE at the University of Lausanne, Switzerland
KEF-2016: Reforms for Inclusive Growth November 3 4, 2016
 KEF-216: Reforms for Inclusive Growth November 3 4, 216 CESEE regional economic outlook Dr. Bas Bakker, Senior Regional Resident Representative for Central and Eastern Europe, IMF European Department 216
DANMARKS NATIONALBANK
 DANMARKS NATIONALBANK TECHNOLOGICAL CHANGE AND THE DANISH LABOUR MARKET Niels Lynggård Hansen, Head of Economics and Monetary Policy May 22, 218 Outline 1) Past trends 2) The Danish labour-market model
SPACE I 2016 Facts & Numbers
 EXECUTIVE SUMMARY MARCH 2018 SPACE I 2016 Facts & Numbers Marcelo F. Aebi (PhD), Mélanie M. Tiago (MA), Léa Berger-Kolopp (MA). www.unil.ch/space Project SPACE at the University of Lausanne, Switzerland.
Asylum Levels and Trends: Europe and non-european Industrialized Countries, 2003
 Asylum Levels and Trends: Europe and non-european Industrialized Countries, 2003 A comparative overview of asylum applications submitted in 44 European and 6 non-european countries in 2003 and before 24
WILL CHINA S SLOWDOWN BRING HEADWINDS OR OPPORTUNITIES FOR EUROPE AND CENTRAL ASIA?
 ECA Economic Update April 216 WILL CHINA S SLOWDOWN BRING HEADWINDS OR OPPORTUNITIES FOR EUROPE AND CENTRAL ASIA? Maurizio Bussolo Chief Economist Office and Asia Region April 29, 216 Bruegel, Brussels,
BULGARIAN TRADE WITH EU IN THE PERIOD JANUARY - MARCH 2016 (PRELIMINARY DATA)
") BULGARIAN TRADE WITH EU IN THE PERIOD JANUARY - MARCH 2016 (PRELIMINARY DATA) In the period January - March 2016 Bulgarian exports to the EU grew by 2.6% in comparison with the same 2015 and amounted to
BULGARIAN TRADE WITH EU IN THE PERIOD JANUARY - MARCH 2016 (PRELIMINARY DATA) In the period January - March 2016 Bulgarian exports to the EU grew by 2.6% in comparison with the same 2015 and amounted to
BULGARIAN TRADE WITH EU IN THE PERIOD JANUARY - FEBRUARY 2017 (PRELIMINARY DATA)
") BULGARIAN TRADE WITH EU IN THE PERIOD JANUARY - FEBRUARY 2017 (PRELIMINARY DATA) In the period January - February 2017 Bulgarian exports to the EU increased by 9.0% to the same 2016 and amounted to 4 957.2
BULGARIAN TRADE WITH EU IN THE PERIOD JANUARY - FEBRUARY 2017 (PRELIMINARY DATA) In the period January - February 2017 Bulgarian exports to the EU increased by 9.0% to the same 2016 and amounted to 4 957.2
Monthly Inbound Update June th August 2017
 Monthly Inbound Update June 217 17 th August 217 1 Contents 1. About this data 2. Headlines 3. Journey Purpose: June, last 3 months, year to date and rolling twelve months by journey purpose 4. Global
Gender pay gap in public services: an initial report
 Introduction This report 1 examines the gender pay gap, the difference between what men and women earn, in public services. Drawing on figures from both Eurostat, the statistical office of the European
BULGARIAN TRADE WITH EU IN JANUARY 2017 (PRELIMINARY DATA)
") BULGARIAN TRADE WITH EU IN JANUARY 2017 (PRELIMINARY DATA) In January 2017 Bulgarian exports to the EU increased by 7.2% month of 2016 and amounted to 2 426.0 Million BGN (Annex, Table 1 and 2). Main trade
BULGARIAN TRADE WITH EU IN JANUARY 2017 (PRELIMINARY DATA) In January 2017 Bulgarian exports to the EU increased by 7.2% month of 2016 and amounted to 2 426.0 Million BGN (Annex, Table 1 and 2). Main trade
Study. Importance of the German Economy for Europe. A vbw study, prepared by Prognos AG Last update: February 2018
 Study Importance of the German Economy for Europe A vbw study, prepared by Prognos AG Last update: February 2018 www.vbw-bayern.de vbw Study February 2018 Preface A strong German economy creates added
ASYLUM LEVELS AND TRENDS IN INDUSTRIALIZED COUNTRIES, 2005
 ASYLUM LEVELS AND TRENDS IN INDUSTRIALIZED COUNTRIES, 2005 OVERVIEW OF ASYLUM APPLICATIONS LODGED IN EUROPE AND NON-EUROPEAN INDUSTRIALIZED COUNTRIES IN 2005 Click here to download the tables in zipped
International investment resumes retreat
 FDI IN FIGURES October 213 International investment resumes retreat 213 FDI flows fall back to crisis levels Preliminary data for 213 show that global FDI activity declined by 28% (to USD 256 billion)
Mark Allen. The Financial Crisis and Emerging Europe: What Happened and What s Next? Senior IMF Resident Representative for Central and Eastern Europe
 The Financial Crisis and Emerging Europe: What Happened and What s Next? Seminar with Romanian Trade Unions Bucharest, November 2, 21 Mark Allen Senior IMF Resident Representative for Central and Eastern
The Construction Industry in Central and Eastern Europe Bucharest, May 19 th 2014
 Interconnection Vienna I Bratislava I Oberstdorf I Lviv I Mexico City we show you the way www.interconnectionconsulting.com The Construction Industry in Central and Eastern Europe Bucharest, May 19 th
Belgium s foreign trade
 Belgium s FIRST 9 months Belgium s BELGIAN FOREIGN TRADE AFTER THE FIRST 9 MONTHS OF Analysis of the figures for (first 9 months) (Source: eurostat - community concept*) After the first nine months of,
The global and regional policy context: Implications for Cyprus
 The global and regional policy context: Implications for Cyprus Dr Zsuzsanna Jakab WHO Regional Director for Europe Policy Dialogue on Health System and Public Health Reform in Cyprus: Health in the 21
2014 BELGIAN FOREIGN TRADE
 2014 BELGIAN FOREIGN TRADE 2 3 01 \\ EXPORTS 6 1.1 Geographical developments 1.2 Sectoral developments 02 \\ IMPORTS 14 2.1 Geographical developments 2.2 Sectoral developments 03 \\ GEOGRAPHICAL TRADE
European patent filings
 Annual Report 07 - European patent filings European patent filings Total filings This graph shows the geographic origin of the European patent filings. This is determined by the country of residence of
BULGARIAN TRADE WITH EU IN THE PERIOD JANUARY - JUNE 2014 (PRELIMINARY DATA)
") BULGARIAN TRADE WITH EU IN THE PERIOD JANUARY - JUNE 2014 (PRELIMINARY DATA) In the period January - June 2014 Bulgarian exports to the EU increased by 2.8% to the corresponding the year and amounted to
BULGARIAN TRADE WITH EU IN THE PERIOD JANUARY - JUNE 2014 (PRELIMINARY DATA) In the period January - June 2014 Bulgarian exports to the EU increased by 2.8% to the corresponding the year and amounted to
25 years of the European Single Market. Study funded by the Danish Business Authority
 25 years of the European Single Market Study funded by the Danish Business Authority September 2018 25 years of the European Single Market 2018 Højbjerre Brauer Schultz Højbjerre Brauer Schultz Frederiksholms
The EU on the move: A Japanese view
 The EU on the move: A Japanese view H.E. Mr. Kazuo KODAMA Ambassador of Japan to the EU Brussels, 06 February 2018 I. The Japan-EU EPA Table of Contents 1. World GDP by Country (2016) 2. Share of Japan
2nd Ministerial Conference of the Prague Process Action Plan
 English version 2nd Ministerial Conference of the Prague Process Action Plan 2012-2016 Introduction We, the Ministers responsible for migration and migration-related matters from Albania, Armenia, Austria,
Shaping the Future of Transport
 Shaping the Future of Transport Welcome to the International Transport Forum Over 50 Ministers Shaping the transport policy agenda The International Transport Forum is a strategic think tank for the transport
THE NOWADAYS CRISIS IMPACT ON THE ECONOMIC PERFORMANCES OF EU COUNTRIES
 THE NOWADAYS CRISIS IMPACT ON THE ECONOMIC PERFORMANCES OF EU COUNTRIES Laura Diaconu Maxim Abstract The crisis underlines a significant disequilibrium in the economic balance between production and consumption,
GERMANY, JAPAN AND INTERNATIONAL PAYMENT IMBALANCES
 Articles Articles Articles Articles Articles CENTRAL EUROPEAN REVIEW OF ECONOMICS & FINANCE Vol. 2, No. 1 (2012) pp. 5-18 Slawomir I. Bukowski* GERMANY, JAPAN AND INTERNATIONAL PAYMENT IMBALANCES Abstract
The determinants of Entrepreneurship Gender Gaps: A cross-country Analysis
 Col.lecció d Economia E17/368 The determinants of Entrepreneurship Gender Gaps: A cross-country Analysis Marc Teignier Baque David Cuberes Sadia Priyanka UB Economics Working Papers 2017/368 The determinants
FIBRE CROPS WG REPORT FOR PHASE IX ( )
") FIBRE CROPS WG REPORT FOR PHASE IX (2014-2018) Submitted to the 15th Steering Committee Meeting, Thessaloniki, Greece, May 2018 by: Martin Pavelek Date of compilation: 19 February 2018 1. CONTRIBUTION
FIBRE CROPS WG REPORT FOR PHASE IX (2014-2018) Submitted to the 15th Steering Committee Meeting, Thessaloniki, Greece, May 2018 by: Martin Pavelek Date of compilation: 19 February 2018 1. CONTRIBUTION
EuCham Charts. October Youth unemployment rates in Europe. Rank Country Unemployment rate (%)
") EuCham Charts October 2015 Youth unemployment rates in Europe Rank Country Unemployment rate (%) 1 Netherlands 5.0 2 Norway 5.5 3 Denmark 5.8 3 Iceland 5.8 4 Luxembourg 6.3... 34 Moldova 30.9 Youth unemployment
EuCham Charts October 2015 Youth unemployment rates in Europe Rank Country Unemployment rate (%) 1 Netherlands 5.0 2 Norway 5.5 3 Denmark 5.8 3 Iceland 5.8 4 Luxembourg 6.3... 34 Moldova 30.9 Youth unemployment
European Tourism Trends & Prospects Executive Summary
 1 European Tourism Trends & Prospects Executive Summary Turkey Iceland Montenegro Serbia Slovenia Malta Cyprus Finland Croatia Latvia Netherlands Belgium Portugal Poland Romania Czech Rep Bulgaria Spain
EU exports to Indonesia, Malaysia and Thailand
 EU exports to Indonesia, Malaysia and Note prepared for the Malaysian Palm Oil Council May 2018 EU exports of goods to Indonesia, Malaysia and amounted to EUR 39.5 billion in 2017 and supported at least
Improving International Migration Statistics Selected examples from OECD
 CARIM-East Methodological Workshop II Warsaw, 27-28 October 2011 Improving International Migration Statistics Selected examples from OECD Jean-Christophe Dumont Head of International Migration Division
Course: Economic Policy with an Emphasis on Tax Policy
 Course: Economic Policy with an Emphasis on Tax Policy Instructors: Vassilis T. Rapanos email address: vrapanos@econ.uoa.gr Georgia Kaplanoglou email address: gkaplanog@econ.uoa.gr Course website: http://eclass.uoa.gr/courses/econ208/
VISA POLICY OF THE REPUBLIC OF KAZAKHSTAN
 VISA POLICY OF THE REPUBLIC OF KAZAKHSTAN Country Diplomatic Service National Term of visafree stay CIS countries 1 Azerbaijan visa-free visa-free visa-free 30 days 2 Kyrgyzstan visa-free visa-free visa-free
Session III Financial Markets Discussion
 Six Years After EU Enlargement Austria and Its Eastern Neighbors Session III Financial Markets Discussion Claire Waysand, Assistant Director European Department International Monetary Fund *copyright rests
European Parliament Elections: Turnout trends,
 European Parliament Elections: Turnout trends, 1979-2009 Standard Note: SN06865 Last updated: 03 April 2014 Author: Section Steven Ayres Social & General Statistics Section As time has passed and the EU
WORLDWIDE DISTRIBUTION OF PRIVATE FINANCIAL ASSETS
 WORLDWIDE DISTRIBUTION OF PRIVATE FINANCIAL ASSETS Munich, November 2018 Copyright Allianz 11/19/2018 1 MORE DYNAMIC POST FINANCIAL CRISIS Changes in the global wealth middle classes in millions 1,250
EUP2P. The Dual use Regulation: general frame, control regimes and weaknesses
 EUP2P The Dual use Regulation: general frame, control regimes and weaknesses Kiev, 14 March 2018 Angelo Minotti, Ph. D. CONTENTS - UN Resolution 1540 - Aims - Multilateral Export Control Regimes - EU Reg.
The new promotion policy
 PPA(15)8431:1 The new promotion policy Global context Diego CANGA-FANO European Commission DG Agriculture and Rural Development Director- Multilateral relations and Quality policy 22/10/2015 1 Overall
ASYLUM LEVELS AND TRENDS IN INDUSTRIALIZED COUNTRIES, 2006
 ASYLUM LEVELS AND TRENDS IN INDUSTRIALIZED COUNTRIES, 2006 OVERVIEW OF ASYLUM APPLICATIONS LODGED IN EUROPEAN AND NON-EUROPEAN INDUSTRIALIZED COUNTRIES IN 2006 23 MARCH 2007 FIELD INFORMATION AND COORDINATION
Which policies for improved access to employment? Main findings of the OECD project JOBS for YOUTH
 Organisation for Economic Co-operation and Development Transition to adulthood: How does it affect demographic trends? Seminar with the Expert Group on Demographics Issues, 25 November 2009, Brussels,
TRIPS OF BULGARIAN RESIDENTS ABROAD AND ARRIVALS OF VISITORS FROM ABROAD TO BULGARIA IN SEPTEMBER 2015
 TRIPS OF BULGARIAN RESIDENTS ABROAD AND ARRIVALS OF VISITORS FROM ABROAD TO BULGARIA IN SEPTEMBER 2015 In September 2015, the number of the trips of Bulgarian residents abroad was 450.9 thousand (Annex,
The regional and urban dimension of Europe 2020
 ESPON Workshop The regional and urban dimension of Europe 2020 News on the implementation of the EUROPE 2020 Strategy Philippe Monfort DG for Regional Policy European Commission 1 Introduction June 2010
GDP per capita in purchasing power standards
 GDP per capita in purchasing power standards GDP per capita varied by one to six across the Member States in 2011, while Actual Individual Consumption (AIC) per capita in the Member States ranged from
Perceptions of Welfare in the European Union
 Perceptions of Welfare in the European Union Background to Growing United: Upgrading Europe s Convergence Machine Jonathan Karver Gabriela Inchauste Change in life satisfaction, 2005-2016 (%, annualized)
Western Balkans Countries In Focus Of Global Economic Crisis
 Economy Transdisciplinarity Cognition www.ugb.ro/etc Vol. XIV, Issue 1/2011 176-186 Western Balkans Countries In Focus Of Global Economic Crisis ENGJELL PERE European University of Tirana engjell.pere@uet.edu.al
Letter prices in Europe. Up-to-date international letter price survey. March th edition
 Letter prices in Europe Up-to-date international letter price survey. March 2014 13th edition 1 Summary This is the thirteenth time Deutsche Post has carried out a study, drawing a comparison between letter
1.1. Trade in goods: main trends Rankings: imports, exports and overall trade volume Philippines trade with EU Member States
 Front Cover Contents Message from the EU Trade Commissioner 2 Overview 3 1. Trade Relations 1.1. Trade in goods: main trends 1.2. Trade in services 1.3. Rankings: imports, exports and overall trade volume
EU Innovation strategy
 EU Innovation strategy In principle fine, in particular recognising EU s limited powers Much is left to Member States, but they disappointed in Finland Good points: Links between research and markets Education
Introduction: The State of Europe s Population, 2003
 Introduction: The State of Europe s Population, 2003 Changes in the size, growth and composition of the population are of key importance to policy-makers in practically all domains of life. To provide
ARE EU EXPORTS GENDER-BLIND? SOME KEY FEATURES OF WOMEN PARTICIPATION IN EXPORTING ACTIVITIES IN THE EU 1
 ARE EU EXPORTS GENDER-BLIND? SOME KEY FEATURES OF WOMEN PARTICIPATION IN EXPORTING ACTIVITIES IN THE EU 1 Jose Manuel Rueda-Cantuche (DG JRC) and Nuno Sousa (DG TRADE) Issue 3 June 2017 Editor: Lucian
What can we learn from productivity dynamics over the crisis episode in the EU?
 What can we learn from productivity dynamics over the crisis episode in the EU? By Klaus S. Friesenbichler and Christian Glocker Vienna, 02 May 2018 ISSN 2305-2635 Policy Recommendations 1. Macroeconomic
European Parliament Eurobarometer (EB79.5) ONE YEAR TO GO TO THE 2014 EUROPEAN ELECTIONS Economic and social part DETAILED ANALYSIS
 ONE YEAR TO GO TO THE 2014 EUROPEAN ELECTIONS Economic and social part DETAILED ANALYSIS") Directorate-General for Communication Public Opinion Monitoring Unit Brussels, 18 October 2013 European Parliament Eurobarometer (EB79.5) ONE YEAR TO GO TO THE 2014 EUROPEAN ELECTIONS Economic and social
Directorate-General for Communication Public Opinion Monitoring Unit Brussels, 18 October 2013 European Parliament Eurobarometer (EB79.5) ONE YEAR TO GO TO THE 2014 EUROPEAN ELECTIONS Economic and social
EU Regulatory Developments
 EU Regulatory Developments Robert Pochmarski Postal and Online Services CERP Plenary, 24/25 May 2012, Beograd/Београд Implementation Market Monitoring Green Paper International Dimension 23/05/2012 Reminder
Evaluating migration policy effectiveness
 Evaluating migration policy effectiveness Mathias Czaika (IMI, University of Oxford) 8 July 2015, Athens Speaker name This talk gives an overview of various studies: Czaika, M. and de Haas, H., 2013. The
TRIPS OF BULGARIAN RESIDENTS ABROAD AND ARRIVALS OF VISITORS FROM ABROAD TO BULGARIA IN AUGUST 2016
 TRIPS OF BULGARIAN RESIDENTS ABROAD AND ARRIVALS OF VISITORS FROM ABROAD TO BULGARIA IN AUGUST 2016 In August 2016, the number of the trips of Bulgarian residents abroad was 590.6 thousand (Annex, Table
TRIPS OF BULGARIAN RESIDENTS ABROAD AND ARRIVALS OF VISITORS FROM ABROAD TO BULGARIA IN AUGUST 2015
 TRIPS OF BULGARIAN RESIDENTS ABROAD AND ARRIVALS OF VISITORS FROM ABROAD TO BULGARIA IN AUGUST 2015 In August 2015, the number of the trips of Bulgarian residents abroad was 512.0 thousand (Annex, Table
TRIPS OF BULGARIAN RESIDENTS ABROAD AND ARRIVALS OF VISITORS FROM ABROAD TO BULGARIA IN MAY 2017
 TRIPS OF BULGARIAN RESIDENTS ABROAD AND ARRIVALS OF VISITORS FROM ABROAD TO BULGARIA IN MAY 2017 In May 2017, the number of the trips of Bulgarian residents abroad was 653.3 thousand (Annex, Table 1) or
TRIPS OF BULGARIAN RESIDENTS ABROAD AND ARRIVALS OF VISITORS FROM ABROAD TO BULGARIA IN MARCH 2016
 TRIPS OF BULGARIAN RESIDENTS ABROAD AND ARRIVALS OF VISITORS FROM ABROAD TO BULGARIA IN MARCH 2016 In March 2016, the number of the trips of Bulgarian residents abroad was 354.7 thousand (Annex, Table
TRIPS OF BULGARIAN RESIDENTS ABROAD AND ARRIVALS OF VISITORS FROM ABROAD TO BULGARIA IN FEBRUARY 2017
 TRIPS OF BULGARIAN RESIDENTS ABROAD AND ARRIVALS OF VISITORS FROM ABROAD TO BULGARIA IN FEBRUARY 2017 In February 2017, the number of the trips of Bulgarian residents abroad was 366.8 thousand (Annex,
Eastern Europe: Economic Developments and Outlook. Miroslav Singer
 Eastern Europe: Economic Developments and Outlook Miroslav Singer Governor, Czech National Bank Distinguished Speakers Seminar European Economics & Financial Centre London, 22 July 2014 Miroslav Význam
Collective Bargaining in Europe
 Collective Bargaining in Europe Collective bargaining and social dialogue in Europe Trade union strength and collective bargaining at national level Recent trends and particular situation in public sector
European Parliament Eurobarometer (EB79.5) ONE YEAR TO GO UNTIL THE 2014 EUROPEAN ELECTIONS Institutional Part ANALYTICAL OVERVIEW
 ONE YEAR TO GO UNTIL THE 2014 EUROPEAN ELECTIONS Institutional Part ANALYTICAL OVERVIEW") Directorate-General for Communication Public Opinion Monitoring Unit Brussels, 21 August 2013. European Parliament Eurobarometer (EB79.5) ONE YEAR TO GO UNTIL THE 2014 EUROPEAN ELECTIONS Institutional
Directorate-General for Communication Public Opinion Monitoring Unit Brussels, 21 August 2013. European Parliament Eurobarometer (EB79.5) ONE YEAR TO GO UNTIL THE 2014 EUROPEAN ELECTIONS Institutional
ICT Strategic Study Part 1 Sectoral Outline May 2015
 ICT Strategic Study Part 1 Sectoral Outline May 215 Summary SUMMARY SYNTHESIS... 6 CHAPTER 1 - ECONOMIC IMPORTANCE... 8 1. THE GLOBAL MARKET...8 2. THE MARKET PER REGION...9 3. THE MARKET IN EUROPE...9
5-Year Evaluation of the Korea-EU FTA Implementation
 5-Year Evaluation of the Korea-EU FTA Implementation From Korea s perspective EU-Korea Business Forum "The EU-Korea FTA after five years: What s been achieved and what s next?" September 22 nd 2016, Seoul
1. Why do third-country audit entities have to register with authorities in Member States?
 Frequently Asked Questions (FAQ) Form A Annex to the Common Application Form for Registration of Third-Country Audit Entities under a European Commission Decision 2008/627/EC of 29 July 2008 on transitional
TRIPS OF BULGARIAN RESIDENTS ABROAD AND ARRIVALS OF VISITORS FROM ABROAD TO BULGARIA IN DECEMBER 2016
 TRIPS OF BULGARIAN RESIDENTS ABROAD AND ARRIVALS OF VISITORS FROM ABROAD TO BULGARIA IN DECEMBER 2016 In December 2016, the number of the trips of Bulgarian residents abroad was 397.3 thousand (Annex,
Regional Economic Outlook Caucasus and Central Asia. November 2, 2016
 Regional Economic Outlook Caucasus and Central Asia November 2, 216 Outline Global and Regional Environment Outlook and Policy Actions Policy Priorities 2 Global growth remains lackluster World U.S. Euro
Standard Note: SN/SG/6077 Last updated: 25 April 2014 Author: Oliver Hawkins Section Social and General Statistics
 Migration Statistics Standard Note: SN/SG/6077 Last updated: 25 April 2014 Author: Oliver Hawkins Section Social and General Statistics The number of people migrating to the UK has been greater than the
STATISTICAL REFLECTIONS
 World Population Day, 11 July 217 STATISTICAL REFLECTIONS 18 July 217 Contents Introduction...1 World population trends...1 Rearrangement among continents...2 Change in the age structure, ageing world
Cambridge International Examinations Cambridge International Advanced Subsidiary and Advanced Level
 Cambridge International Examinations Cambridge International Advanced Subsidiary and Advanced Level *4898249870-I* GEOGRAPHY 9696/31 Paper 3 Advanced Human Options October/November 2015 INSERT 1 hour 30
SEPTEMBER TRADE UPDATE ASIA TAKES THE LEAD
 Public Disclosure Authorized Public Disclosure Authorized Public Disclosure Authorized Public Disclosure Authorized SEPTEMBER TRADE WATCH SEPTEMBER TRADE UPDATE ASIA TAKES THE LEAD All regions show an
FINDINGS OF THE WORLD BANK STUDY OF UZBEKISTAN S NATIONAL QUALITY INFRASTRUCTURE
 1 FINDINGS OF THE WORLD BANK STUDY OF UZBEKISTAN S NATIONAL QUALITY INFRASTRUCTURE Jean-Louis Racine The World Bank The World Bank Main Findings 2 Firms have limited access to high quality inputs and to
Size and Development of the Shadow Economy of 31 European and 5 other OECD Countries from 2003 to 2013: A Further Decline
 January 31, 2013 ShadEcEurope31_Jan2013.doc Size and Development of the Shadow Economy of 31 European and 5 other OECD Countries from 2003 to 2013: A Further Decline by Friedrich Schneider *) In the Tables
8193/11 GL/mkl 1 DG C I
 COUNCIL OF THE EUROPEAN UNION Brussels, 25 March 2011 8193/11 AVIATION 70 INFORMATION NOTE From: European Commission To: Council Subject: State of play of ratification by Member States of the aviation
Transatlantic Divergences in Globalisation and the China Factor
 No 2017/19, May 2017 Transatlantic Divergences in Globalisation and the China Factor Jeanne Metivier, Mattia Di Salvo and Jacques Pelkmans Summary The EU and the United States are following divergent paths
Improving the accuracy of outbound tourism statistics with mobile positioning data
 1 (11) Improving the accuracy of outbound tourism statistics with mobile positioning data Survey response rates are declining at an alarming rate globally. Statisticians have traditionally used imputing
9 th International Workshop Budapest
 9 th International Workshop Budapest 2-5 October 2017 15 years of LANDNET-working: an Overview Frank van Holst, LANDNET Board / RVO.nl 9th International LANDNET Workshop - Budapest, 2-5 October 2017 Structure
Context Indicator 17: Population density
 3.2. Socio-economic situation of rural areas 3.2.1. Predominantly rural regions are more densely populated in the EU-N12 than in the EU-15 Context Indicator 17: Population density In 2011, predominantly
HIGHLIGHTS. There is a clear trend in the OECD area towards. which is reflected in the economic and innovative performance of certain OECD countries.
 HIGHLIGHTS The ability to create, distribute and exploit knowledge is increasingly central to competitive advantage, wealth creation and better standards of living. The STI Scoreboard 2001 presents the
Eurasian Economic Union and Armenia
 Eurasian Economic Union and Armenia Areg Gharabegian October 2015 The Eurasian Economic Union (EEU) is an economic union of states which was established on May 2014 by the leaders of Belarus, Kazakhstan,
REPORT FROM THE COMMISSION TO THE EUROPEAN PARLIAMENT, THE EUROPEAN COUNCIL AND THE COUNCIL. Fifteenth report on relocation and resettlement
 EUROPEAN COMMISSION Brussels, 6.9.2017 COM(2017) 465 final REPORT FROM THE COMMISSION TO THE EUROPEAN PARLIAMENT, THE EUROPEAN COUNCIL AND THE COUNCIL Fifteenth report on relocation and resettlement EN
Website: http//eeas.europa.eu/delegations/philippines
 30th Floor, Tower II, RCBC Plaza 6819 Ayala Ave., 1200 Makati City, Philippines E-mail: Delegation-Philippines@eeas.europa.eu Website: http//eeas.europa.eu/delegations/philippines Contents 1 Message from
Data on gender pay gap by education level collected by UNECE
 United Nations Working paper 18 4 March 2014 Original: English Economic Commission for Europe Conference of European Statisticians Group of Experts on Gender Statistics Work Session on Gender Statistics
Off to a Good Start? Youth Labour Market Transitions in OECD Countries
 ISBN 978-92-64-4632- Employment Outlook 28 Chapter 1 Off to a Good Start? Youth Labour Market Transitions in Countries The chapter first provides an overview of youth labour market performance over the