Asia Competitiveness Institute>>Accelerating Competitiveness Improvements
|
|
|
- Nathan Whitehead
- 6 years ago
- Views:
Transcription

1 Asia Competitiveness Institute>>Accelerating Competitiveness Improvements The Asia Competitiveness Institute (ACI) was established in August 2006 as a research centre at the Lee Kuan Yew School of Public Policy, National University of Singapore. It aims to provide intellectual leadership and partner with like-minded researchers and organizations in the ASEAN region to further our understanding of competitiveness issues facing Asian countries. The institute works in affiliation with Professor Michael E. Porter s Institute for Strategy and Competitiveness (ISC) at Harvard Business School. Leveraging on ISC s competitiveness concepts, data and analytical tools, ACI seeks to achieve its mission through research, outreach and education. Research ACI conducts competitiveness research on clusters and regions to identify mitigating issues and challenges for potential policy interventions. It also develops country-specific and cluster competitiveness case studies to promote the understanding of factors affecting economic performance. The institute also studies the integration of regional production networks in ASEAN to help develop linkages that enhance economic cooperation and lead to sustainable economic growth. Partnerships ACI cooperates with partners in a number of ways. These include formal partnerships with reputable institutions in the region for broad-based and long-term collaboration on research and education. For large scale research projects in ASEAN countries, the institute engages reputable local partners to work on joint studies. It also welcomes visiting scholars from regional academic and research institutes as well as advisory firms to work on issues of common interest. ACI interacts with other competitiveness agencies to explore areas for collaboration and organizes joint events such as forums, workshops and seminars. The institute hosts an annual two-day Asia Competitiveness Forum in May where regional researchers come together to share their work and discuss developments in their countries. Through these outreach efforts, ACI seeks to develop a network of scholars and experts on competitiveness in Asia. Education As part of its affiliation with ISC, faculty at ACI teaches Professor Porter s signature Microeconomics of Competitiveness course in the School s graduate programmes. Its flagship five-day executive program on Developing Clusters and National Competitiveness is offered on an open enrolment basis and targeted at leaders from the public, private and non-profit sectors. The executive program may also be offered on a customized basis within government institutions or business organizations. Contact Us We welcome you to explore with us possibilities for visits, research, executive programs and collaborative projects. ACI T: F: ACI@nus.edu.sg Web: 469C Bukit Timah Road Level 3 Oei Tiong Ham Building Singapore

2 Asia Competitiveness Institute Monograph Series The Competitiveness of ASEAN after the 1997 Asian Financial Crisis Wong Poh Kam Professor of Lee Kuan Yew School of Public Policy and NUS Business School DID: Fax: and Ng Kwan Kee Research Fellow DID: Fax: C Bukit Timah Road, Level 3 Singapore August 2008 The views expressed in the ACI Monograph Series are those of the authors(s) and do not necessarily reflect those of the institute, Lee Kuan Yew School of Public Policy or National University of Singapore. Copyright belongs to the author(s). Papers may be downloaded for personal use only.
3 Abstract ASEAN has been considered as one of the most successful regional groupings worldwide since its inception to the mid 1990s. However, economic realities have dramatically changed in the past 10 years with the onset of the Asian Financial Crisis in 1997 and the emergence of China and India as economic powerhouse in Asia since the mid-1990s. In this paper, we investigate the competitiveness performance of the ASEAN region in the decade after the onset of the Asian Financial Crisis. We found that ASEAN as a whole has not fully recovered from the Asian Financial Crisis. ASEAN s share in the world economy has shrunk and its real GDP per capita growth performance had slowed. Moreover, competitiveness performance had also been quite uneven among the ASEAN member nations, and such variations appear to be related to systematic differences in the various component determinants of competitiveness as identified by the Global Competitiveness Report. Keywords: ASEAN, competitiveness, GDP per capita, growth JEL Code: O11, O53, O57 1
4 THE COMPETITIVENESS OF ASEAN AFTER THE 1997 ASIAN FINANCIAL CRISIS 1. Introduction ASEAN has been considered as one of the most successful regional groupings worldwide since its inception to the mid 1990s. It experienced higher economic growth than virtually any other region in the world during this period. However, economic realities have dramatically changed in the past 10 years with the onset of the Asian Financial Crisis in 1997 and the emergence of China and India as economic powerhouse in Asia since the mid-1990s. In response to growing concerns with competitiveness after the 1997 Asian Financial Crisis, there has been increasing rhetoric by ASEAN political leaders on the need for greater economic integration of ASEAN. At the 2003 Summit in Bali, ASEAN Leaders declared the formation of an ASEAN Economic Community (AEC) by 2020 (later brought forward to 2015). This is one of the three pillars of the collective vision of ASEAN - the ASEAN Community 1. The aim of the AEC is to create a stable, prosperous and highly competitive ASEAN economic region through a higher level of regional economic integration (as outlined in the ASEAN Vision 2020) and with a final goal of being a common market in ASEAN, just like the European Union. The AEC is envisaged to be a single market and production base with free flow of goods, services, investments, capital and skilled labour, with equitable economic development and reduced poverty and socio-economic disparities (McKinsey & Company, 2003; ASEAN Secretariat, 2005; Hew & Das, 2008). The benefits, urgency and tracking of progress towards greater ASEAN economic integration resulting in an AEC in 2015 were emphasized during the Fortieth Meeting of the ASEAN Economic Ministers (AEM) on August 2008, and the High-level Symposium on Asian Economic Integration on 4 September 2008 in Singapore (Business Times Singapore, 2008; Joint Media Statement, 2008). In this monograph, we attempt to investigate the state of competitiveness of the ASEAN region in the decade after the 1997 Asian Financial Crisis by examining the relative role of ASEAN in the world economy, and the growth performance of ASEAN, both over time and relative to the rest of the world, since We also examine variations in competitiveness performance among the ASEAN member nations which might pose problems to regional economic integration. In addition, key competitiveness determinants of ASEAN as derived from the Global Competitiveness Report (GCR) in recent years are examined. 1 The other two are ASEAN Socio-Cultural Community (ASCC) and ASEAN Security Community (ASC) 2
5 2. Conceptual Framework and Measures of Regional Competitiveness Due to increasing global competition and growing openness of national economies, more and more business people, policy makers and researchers have recognised the importance of international competitiveness for enhancing economic growth and the standard of living of regions or nations. However, defining it is not trivial. Despite the growing literature on national & regional competitiveness over the years, there has been little agreement on how to define it conceptually and measure it empirically. While it is easier to define competitiveness for a firm (using performance indicators such as sales, market share or profitability), it is more difficult to define it for an economy or region. The factors or determinants that influence the competitiveness performance of nations and regions are also diverse, and there has been little agreement among scholars on the relative contributions of these determinants, and how they may vary for nations or regions at different stages of economic development. It is interesting to note that both the World Competitiveness Report and the Global Competitiveness Report have attempted to cover a very wide range of measures of potential competitiveness determinants, and that their batteries of measures have varied over time. In this paper, we make a clear distinction between the outcome or performance of regional competitiveness, and the determinants of such competitiveness performance. In particular, we focus on a small number of conceptual constructs for measuring regional competitiveness performance that relate to the notions of sustainable economic growth and economic prosperity relative to other regions. Specifically, we note the following conceptual definitions by OECD and Michael Porter that highlight the elements of sustainable growth and relative prosperity: Competitiveness [should] be understood as the ability of companies, industries, regions, nations and supranational regions to generate, while being and remaining exposed to international competition, relatively high factor income and factor employment levels on a sustainable basis (OECD, 1994) Competitiveness is the underpinning of prosperity, based on productive potential of a nation s economy, which in turn is ultimately set by the productivity of its companies determined by the sophistication of its company operations and strategy, and the quality of microeconomic business environment (Porter, Ketels, & Delgado, 2006) Based on the above, we propose in this paper to focus on two sets of conceptual measures of competitiveness performance: (a) measures of the relative role or weight of an economic region in the global economy an increasing share would suggest relative improvement of competitiveness; and (b) measures of the productivity growth rate of a region, both over time and relative to the rest of the world or selected benchmark regions. In terms of competitiveness determinants, this paper will use primarily the Global Competitiveness Index (GCI) s pillars of competitiveness framework first introduced by the Global Competitiveness Report in 2006 and subsequently refined in the 2007 and
6 reports. We prefer to use the GCI framework over other suggested frameworks in the literature (e.g. the classification framework as used in the World Competitiveness Index) due to its conceptual comprehensiveness and its broader empirical scope of coverage of ASEAN countries, including Vietnam (which was missing from WCI). 3. Empirical Measures of ASEAN Competitiveness Performance To operationalize the above conceptual constructs, we adopted the following empirical measures to examine the competitiveness performance and competitiveness determinants of ASEAN. a) Competitiveness performance In terms of empirical measures of competitiveness performance of ASEAN, we first analyze the role of the ASEAN economy in the global economy by analyzing its shares in world population, world GDP output, world total trade, and world total inward foreign direct investment. We also examine the share of intra-asean trade and FDI as a percentage of total trade and FDI to gauge the degree of regional economic integration. Secondly, we analyze the productivity level and growth of ASEAN in terms of real GDP per capita in PPP terms. Commonly used as a measure of the rate of change in the level of productivity or average living standards, real GDP per capita PPP growth rate per annum is a better gauge of competitiveness performance than real GDP growth per annum, as it adjusted for both population growth and changes in Purchasing Power Parity (PPP). Technical Appendix 1 provides a more detailed discussion of the merit of the selected measure, and compared the key GDP growth estimates with and without PPP adjustments to underline the importance of doing PPP adjustments, while Technical Appendix 2 compares the growth estimates using GDP and GDP per capita, emphasize the importance of controlling for population growth. A country with high real GDP growth rate may not be as well performing as it appears if it is being matched by rising population growth. As highlighted in a recent Economist article (15 Mar 2008), while US and Canada had higher real GDP growth rate (2.8% and 2.7%) than Japan (2.1%) over , in terms of real GDP per capita growth, the latter actually outperformed the former (2.0% vs. 1.8% and 1.7%). Real GDP per capita PPP growth rate of a region should also be benchmarked relative to the average of the World and other reference economic groups. In addition, Angus Maddison in his book The World Economy: A Millennial Perspective (Maddison, 2001) also noted the importance of taking into account population growth in the measure of prosperity and welfare. He used GDP, GDP per capita as well as population as indicators of welfare for his contour of world development. When a regional economy s shares of World real GDP (in PPP terms), trade and inward direct foreign investments are increasing, they indicate that the region s ability to create and compete for economic resources is expanding relative to the rest of the world. However, the relative economic share and significance of a region in the world needs to be benchmarked against its population share over time. 4
7 (b) Competitiveness Determinants To analyze the competitiveness determinants of ASEAN, we use the various component determinants derived from the Global Competitiveness Index (GCI) s Pillars of Competitiveness framework (Sala-I-Martin, et. al., 2007). The framework originally identified 9 pillars, but subsequently expanded to 12 pillars in the latest (2008) edition. Table 1 summarizes the key determinants covered under the 9/12 pillars of GCI. A 7-point Likert scale construct is used by GCI to measure the strength of each of these determinants for each economy. While the GCI measures are quite comprehensive in scope, its aggregated nature and its ordinal scale based largely on subjective measures may make it difficult to interpret the actual level and extent of development of some of these component determinants. To supplement the analysis using the GCI measures, we have also included analysis of a number of more disaggregated, quantitative constructs to better interpret selected component determinants that were found to be salient from the GCI analysis (e.g. innovation, institutions). 4. Role of ASEAN in the World Economy ASEAN (Association of Southeast Asian Nations) was formed in 1967 by five original member countries, namely, Indonesia, Malaysia, Philippines, Singapore, and Thailand. They were later joined by Brunei Darussalam (January 84), Vietnam (July 95), Laos & Myanmar (both July 97), and Cambodia (April 99). The main objectives of the formation of ASEAN were to accelerate the economic growth and to promote regional peace and stability of Southeast Asian nations. Since its inception to the mid 1990s, ASEAN has been considered as one of the most successful regional economic groupings in the world. Strategically located in Southeast Asia, ASEAN (Association of Southeast Asian Nations) countries are positioned at the crossroads of world shipping and airline routes, and Singapore is the hub of Southeast Asian trade (Figure 1). ASEAN countries are regarded as a major grouping in world trade negotiations by international agencies such as the General Agreement on Trade and Tariffs (GATT, now superseded by World Trade Organisation WTO), United Nations Conference on Trade and Development (UNCTAD), as well as by major world trading economies such as the USA, the European Union (EU), and Japan. In the Asia Pacific region, ASEAN countries constitute an important sub-group of countries in the Asia Pacific Economic Cooperation (APEC). Almost all the world's major economic powerhouses are today ASEAN's dialogue partners. Currently, ASEAN has the following dialogue partners: Australia, Canada, China, EU, India, Japan, New Zealand, South Korea, Russia and the United States. The United Nations Development Program (UNDP) also has dialogue status. As of 2006, the ASEAN region has a population of about 560 million, a total area of 4.5 million square kilometres, a combined gross domestic product of almost US$ 3 trillion (in nominal PPP terms), and a total trade of about US$ 1.45 trillion. 5
8 In this paper, because of the lack of data availability for some of the smaller and newer members, several different definitions of ASEAN region will be used: ASEAN4 refers to Indonesia, Malaysia, Philippines, and Thailand ASEAN5 refers to Indonesia, Malaysia, Philippines, Singapore, and Thailand ASEAN6a refers to Indonesia, Malaysia, Philippines, Singapore, Thailand and Brunei ASEAN6b refers to Indonesia, Malaysia, Philippines, Singapore, Thailand and Vietnam ASEAN10 refers to Indonesia, Malaysia, Philippines, Singapore, Thailand, Vietnam, Brunei Darussalam, Laos, Myanmar and Cambodia In evaluating the role and the importance of ASEAN in the world economy, we will study the ASEAN shares in world population, world GDP, world trade, and world total inward foreign direct investment. In addition, intra-asean trade, intra-asean FDI, population, GDP and trade shares among ASEAN member countries are analysed to highlight the importance of individual member countries in the ASEAN grouping Share in World Population As mentioned, population and population growth play a big part in determining economic welfare of the ASEAN people. In addition, the size of the population also indicates market size and market potential. This section highlights ASEAN total population, its share in world population, and growth trends. Table 2 shows that million or 8.6% of the world population reside in ASEAN in 2006, representing a sizeable market and market potential. However, population in ASEAN has been increasing at a declining rate in the last 30 years. From 1980 to 2006, share of ASEAN10 to world population has increased by about 0.6 percentage-point from 8% to 8.6%. In 2006, ASEAN6a made up of 72.2% of ASEAN10 total population, not much change from 72.7% in Growth Trends in ASEAN and World Population In terms of growth trends, Figure 2 and Table 3 show that ASEAN population grew at a faster rate than that of the world population, although growing at a declining rate. Relative to the world, this means that ASEAN is growing in importance as a single market but it also needs a higher economic growth rate to sustain its population growth to achieve sustainable prosperity Population Share within ASEAN In terms of population share within ASEAN, the distribution is uneven. Over the years, Indonesia, Philippines and Vietnam remained as top 3 most populous 6
9 nations in ASEAN (Table 4 and Figure 3). Between 1980 and 2006, population shares of Indonesia, Thailand, and Myanmar have declined while those of Philippines, Malaysia and Cambodia have increased (Figure 4) Share in World GDP Share in world GDP indicates the relative importance of ASEAN as an economic grouping in the world. Table 5 shows ASEAN total GDP in PPP and constant 2000 international dollar terms. Total GDP of ASEAN10 stood at $2.4 billion in 2006, constituted 4.2% of world GDP. Total ASEAN share of world GDP expanded up to 1997 when the Asian financial crisis struck, and had still not fully recovered in 2006 from its peak share in Table 6 shows ASEAN GDP and share with Brunei included, in PPP and current international dollar terms. It shows that the ASEAN GDP shares were slightly higher, but have similar pattern over time, compared to those measured in real PPP terms. Comparing ASEAN5 and ASEAN6b in total GDP and share in world GDP (nominal GDP in PPP terms) shows that GDP share of Brunei is negligible Growth Trends in ASEAN and World GDP The growth trends of ASEAN and World GDP are shown in Figure 5. ASEAN GDP grew at a faster rate than that of the world GDP over the period from 1975 to 2006, despite the decline during the Asian Financial Crisis. This shows the importance of ASEAN as an economic grouping is growing GDP Share within ASEAN In terms of GDP share within ASEAN, it is dominated by a selected few countries. This is shown in Figures 6 to 9, based on the various ASEAN definitions. In 2006, ASEAN6b made up of 97.9% of ASEAN10 total real GDP in PPP terms. Between 1980 & 2006, share of Indonesia and Philippines in ASEAN6b declined while others increased. Since the Asia Financial Crisis in 1997, share of Indonesia s GDP in ASEAN had been falling, while that of Thailand had been stagnant Share in World Total Trade ASEAN Total trade and share in world total trade indicate the importance of ASEAN as a regional trading bloc to the world. Table 7 indicates that ASEAN10 has 5.9% of the world total trade share in 2006, up from 3.3% in However the trade share had peaked in 1997, and despite some recovery in 2000, has generally declined over the last 6 years. Table 8 and Figure 10 compares the ASEAN share in world total trade to selected regional integration arrangements. ASEAN10 s world total trade share of 6% in 2006 is 7
10 still a far cry from 38% of EU-25 and 17% of NAFTA, indicating that ASEAN still has a long way to go before becoming a major and dominating trading bloc to the world ASEAN Trade Partners and Commodity Groups ASEAN as a trading bloc is well connected to leading as well as emerging economies of the world in terms of trade through its export markets and import origins (Tables 9 and 10). Japan, USA, EU-25, China and South Korea are the top 5 trading partners of ASEAN, excluding ASEAN as an intra-asean trading partner. Tables 11 and 12 show ASEAN s top ten trade commodity groups in 1998 and Between 1998 and 2006, parts and equipment of electric machinery, television and sound equipment still remain the top traded commodity group in ASEAN. Mineral fuels, oils and related products, plastics products and organic chemicals have become important traded commodity groups in Growth Trends in ASEAN and World Trade Figure 11 shows the growth trends in ASEAN and world trade from the inception of ASEAN to Trade of ASEAN10 grew at a much slower but steady pace as compared to world trade from 1970 till While world trade declined for much of the 1980s, trade of ASEAN10 grew during this period, temporarily slowed down during the recession but recovered to grow at a much faster rate since Singapore emerged as an importance trading nation after 1980, causing the trade of ASEAN5 to grow faster than that of ASEAN4. The growth gap between ASEAN5 and ASEAN4 widened after the Gulf War and throughout the period of the Asian Financial Crisis. The growth paths of ASEAN6a, ASEAN6b and ASEAN10 were very similar throughout the period from 1967 to Trade Share within ASEAN Trade Share within ASEAN member countries indicates the dominating ASEAN countries in terms of trade. Table 13 shows the shares in ASEAN total trade based on various ASEAN definitions. Significant share of Singapore can be seen from differences between ASEAN4 & ASEAN5. ASEAN4 s trade share within ASEAN has declined to about 57% in 2006, from about 63% in 1980 (mainly due to declining trade shares of Indonesia and Philippines). Figure 12 shows the trade share within ASEAN member countries in 1980 and It shows that Singapore has maintained its dominant position, with Malaysia and Thailand became the top three ASEAN countries in terms of trade share in Intra-ASEAN Trade and Free Flow of Goods Freer flow of goods is one of the aims of the AEC. Two widely used indicators of regional integration through trade are intra-asean trade as a percentage of total 8
11 trade and intra-asean trade as a percentage of GDP. Higher percentage values indicate a higher degree of integration. Tables 14 to 17 show the Intra-ASEAN trade values, shares and growth rates. Intra-ASEAN trade as a percentage of total trade measures the relative importance of intra-asean trade to the total trade of all ASEAN member countries. Share of intra-asean trade to ASEAN total trade increased steadily over , then dropped slightly during the Asian financial crisis, before rising again to reach above pre-crisis levels. However, the growth of intra-asean trade has slowed in the period compared to the period. Comparing the growth in intra-regional trade which is a proxy for measuring the success of economic integration initiatives, the share of intra-asean trade to total ASEAN trade reached 24.2% in 2006, still a long way compared to 65.7% of EU-25 and 41.8% of NAFTA. Pace of intra-regional trade integration had slowed down in the 2000s compared to the 1990s (Table 16 and Figure 13). Intra-ASEAN trade as a percentage of GDP measures the relative importance of intra-asean trade to the region s economy. In 2006, intra-asean trade constituted about one-third of total GDP of all ASEAN member countries (Table 18). This percentage has been increasing from 15.7% since Intra-ASEAN Trade Commodity Groups and Single Production Base The Vientiane Action Programme (VAP) adopted by the ASEAN Leaders at the 2004 Summit in Vientiane states that the acceleration of economic integration toward a single market and production base will start with 11 priority sectors. These consist of 7 priority goods sectors (agro-based, wood-based, rubber-based, fisheries, electronics, textiles and garments, and automotive) and 4 services sectors (air travel, tourism, e-asean and healthcare). A high intra-industry trade index for the region indicates that companies within the same industry have high volumes of trade, implying a high degree of specialization that can lead to a deepening of integration (ASEAN Secretariat, 2005). Without intra-industry trade which could be used as an indicator to measure the extent of integration in each of the priority sectors, we used the top ten intra-asean trade commodity groups as an indicator to at least provide some clues on the top industries with a high volume of intra-regional trade in ASEAN. This could imply the principal types of intra-regional industrial activities and/or production networks, products and components that are important among the ASEAN member countries. Tables 19 and 20 show the top ten intra-asean trade commodity groups in 1998 and Electric and electronics parts and equipment, nuclear appliances and parts and mineral oil products were the top 3 intra-asean trade commodity groups, as well as the top 3 ASEAN trade commodity groups in Pearls and articles of iron 9
12 and steel were more important in intra-asean trade, compared to ASEAN to world trade in Compared to the list of top 10 ASEAN trade commodity groups in 2006, electric and electronics parts and equipment, mineral oil products, and nuclear appliances and parts were the top 3 intra-asean trade commodity groups, as well as top 3 ASEAN trade commodity groups in Articles of iron or steel and copper and copper articles were important trade commodity groups in intra-asean trade, compared to ASEAN to world trade in Compared to 1998 s top 10 intra-asean trade commodity groups, mineral fuels and oil products have moved up to second from third; vehicles, copper and copper articles and rubber and rubber articles have become more important in intra-asean trade in The above findings seem to suggest that intra-regional production networks for electronics, automotive, rubber-based industries exist among ASEAN member countries Share in World Total Inward FDI Flows Share in world total inward FDI flows of ASEAN indicates ASEAN s attractiveness as a destination for capital flows relative to the rest of the world. According to the definition by UNCTAD, flows of FDI comprise capital provided (either directly or through other related enterprises) by a foreign direct investor to an enterprise, or capital received from an investing enterprise by a foreign direct investor. FDI has three components: equity capital, reinvested earnings and intra-company loans (United Nations Conference on Trade and Development, 2007). Share of ASEAN in world total inward FDI flows saw increases in the period , but had experienced sharp decline after the Asian financial crisis and despite some recovery, still unable to reach the peak level in Excluding Singapore, ASEAN s share of world total inward FDI flows had fallen below its share of world GDP after the financial crisis (Table 21) Intra-ASEAN FDI Inflow and Freer Flow of Capital When capital is freer to flow, more advanced economies within a regional bloc can play a big role in increasing intra-regional FDI flows by setting up production networks in neighbouring countries. Therefore, a good indicator of economic integration in the area of investment is the share of investment coming from ASEAN countries to the total inflows of foreign direct investment. 10
13 Tables 22 to 24 show the Intra-ASEAN inward FDI flow and share in 2006, total cumulative inward FDI to ASEAN10 and intra-asean share by source and host countries from 1995 to For the period from 1995 to 2005, intra-asean share of cumulative FDI inflows was 11.5% and for 2006, it was 11.9%. EU, USA and Japan were the top 3 sources of cumulative FDI inflows during this period. Over the same period, Laos, Myanmar and Malaysia had the largest intra-asean share of their respective FDI inflows received compared to other fellow ASEAN countries. The findings suggest that the major investors in the region are still coming from outside ASEAN Growth Trends of ASEAN and World Inward FDI Flows Figure 14 shows the growth trends of ASEAN4, ASEAN5, ASEAN6b and the world total inward FDI flows. ASEAN started to become attractive as a FDI destination in the late 1980s. Similar to the growth trends of ASEAN trade, growth of the ASEAN (ASEAN5 and ASEAN6b) inward FDI flows started to pick up pace during this period and grew at an increasing and faster pace than that of the world after that. ASEAN inward FDI flows fell during the Asian Financial Crisis while world total inward FDI flows continued to grow till ASEAN inward FDI flows temporarily grew for a year in and fell again and only started to grow steeply after 2002, a year earlier than that of the world. Similar to the growth trends in trade, the growth gap between ASEAN5 and ASEAN4 widened after the Gulf War and throughout the period of the Asian Financial Crisis Share in World Total Inward FDI Stock Share in world total inward FDI stock of ASEAN indicates ASEAN s attractiveness as a destination for capital stock relative to the rest of the world. According to the definition by UNCTAD, FDI stock is the value of the share of their capital and reserves (including retained profits) attributable to the parent enterprise, plus the net indebtedness of affiliates to the parent enterprise (United Nations Conference on Trade and Development, 2007). The differences between shares of ASEAN4 and ASEAN5 to world total inward FDI stock showed the disproportionate importance of Singapore as a FDI location. Share of ASEAN to world total inward FDI stock showed a trend of reaching a peak in 1997 and declined thereafter (Table 25) Growth Trends of ASEAN and World Inward FDI Stock Figure 15 shows the growth trends of ASEAN4, ASEAN5, ASEAN6b and the world total inward FDI stock. As observed in the growth trend of inward FDI inflows, ASEAN (ASEAN5 and ASEAN6b) began to be an attractive investment destination since Its inward FDI stock grew at a faster pace than that of the world since then, fell in and recovered to grow at about the same pace as that of the 11
14 world inward FDI stock. After the recession in 1986, ASEAN5 started to grow faster than ASEAN4 in its inward FDI stock. ASEAN4 was more hard hit by the Asian Financial Crisis than ASEAN5 which include Singapore, especially after Again, Singapore was resilient to the impact of the crisis and still remained an attractive investment destination in the 2000s Share of Total Inward FDI Stock within ASEAN The share of total inward FDI stock within ASEAN shows the relative attractiveness of ASEAN member countries as an investment destination. The total inward FDI stock for ASEAN10 in 1980 was US$18.9 billion (Figure 16), and the top three countries with the largest share were Singapore (28.3%), Malaysia (27.3%), and Indonesia (24.7%). The total stock in 2006 has increased to US$420 billion, about 22 times the value in Singapore not only held on to the top spot with the largest share but also increased its share to 50%. Thailand (16.2%) ranked second while Malaysia (12.8%) was relegated to third place. Indonesia has shrunk its share from 24.7% in 1980 to just 4.5% in Productivity Growth Performance of ASEAN 5.1. Real GDP Per Capita, PPP Terms As mentioned earlier and in the Technical Appendix 2, real GDP per capita is a better gauge of economic performance, sustainable prosperity and welfare than real GDP. Technical Appendix 1 shows that real GDP per capita in PPP terms is the right indicator for this purpose. Table 26 compares the real GDP per capita (PPP) of ASEAN based on various ASEAN definitions with selected groups of countries from 1980 to In general, real GDP per capita of ASEAN as a whole seems to be relatively lower and grow at a slower pace compared to lower middle income countries, East Asia and pacific countries and the world. The gap between ASEAN4 and ASEAN5 real GDP per Capita (PPP) widened over the years, same for the gap between ASEAN and USA. The real GDP per capita (PPP) of ASEAN4 and ASEAN5 were $2,256 and $2,321 in 1980 respectively. In 2006, the numbers were $4,969 and $5,224 respectively. On the other hand, the real GDP per capita (PPP) of USA in 1980 and 2006 were $22,568 and $38,165 respectively. Real GDP Per Capita (PPP) of ASEAN5 ($5,224) & ASEAN6b ($4,827) were overtaken by that of East Asia & Pacific countries ($5,862) in 2006 while real GDP Per Capita (PPP) of ASEAN6b was overtaken by lower middle income countries since
15 5.2. Growth Rate of Real GDP Per Capita, PPP Terms (CAGR, %) Table 27 shows the compound annual growth rates of real GDP per capita of a selected group of countries and country groupings. Real GDP Per Capita (PPP) growth of ASEAN4, 5 & 6b were overtaken by that of lower middle income and India in recent years (especially after the Asian Financial Crisis). For the period 1998 to 2006, the growth rates of ASEAN4, ASEAN5 and ASEAN6b were 3.2%, 3.3% and 3.6% respectively, slower than the growth rates of 4.2%, 6.4%, 3.1%, 8.5% and 5.3% for low income, lower middle income, upper middle income countries, China and India. If growth rates were computed inclusive of the period of the crisis, i.e., from 1997 to 2006, ASEAN countries performed below the world average of 2.7% Progress Made by ASEAN Countries based on World Bank Classification The progress made by ASEAN countries in raising their standard of living and prosperity level can be analyzed by comparing over two time point whether these countries have moved to a higher real per capita income bracket. World Bank classifies all World Bank member economies, and all other economies with populations of more than 30,000 for operational and analytical purposes. Economies are divided among income groups according to gross national income (GNI) per capita, calculated using the World Bank Atlas method. We compared the income groupings of a selected group of Asian, ASEAN, African and South American countries classified by World Bank between 1987 and 2006 to highlight the progress made by ASEAN countries (Table 28 2 ). Among ASEAN countries, Cambodia, Laos, Myanmar and Vietnam still remain in the same category of low income group over the period Malaysia moved from lower middle income to upper middle income group, Philippines and Thailand remained in lower middle income whereas Indonesia moved from low income to lower middle income group. Singapore and Brunei remained in high income group over the same period. The growth trends of these countries are shown in Figures 17 to Total Factor Productivity (TFP) To supplement the above analysis using real GDP per capita growth estimates, we also examine the available estimates of total factor productivity (TFP) for ASEAN countries. Table 29 and Figure 23 shows the TFP estimates of the 4 Asian NIEs, the 6 ASEAN countries, G7, selected Latin America countries, China and India, for the 16-year period In general, ASEAN countries had higher TFPs in compared to Asian NIEs, but most had negative TFPs during , and at about the same levels of the Asian NIEs from In general, although a number of ASEAN countries such as Indonesia, Malaysia and Thailand achieved some recovery in their TFP growth over , this was not sufficient to compensate for their poor TFP performance in the earlier period ( ) that covered the Asian Financial 2 For details of the World Bank classification, see note in Table
16 Crisis, resulting in an overall weaker TFP growth over the entire period of compared with the Asian NIEs. It is noteworthy that China had consistently achieved the highest TFP estimates over the entire period from while India had achieved higher TFP estimates than most ASEAN countries over the period Summary of ASEAN s Competitiveness Performance In summary, the first key finding is that, while ASEAN has increased its share of the world economy from 1980 to 1997, it has suffered a severe downturn from , and although there has been some recovery since, ASEAN s share in the world economy in 2006 was generally lower than in 1997 (Table 30). The second related key finding is that ASEAN growth performance had slowed over the last 10 years, both absolutely & relatively. Growth of real GDP Per Capita (PPP) of ASEAN6 had been below that of not only the East Asia & Pacific region, the Asian NIEs and China and India in the last decade, but also that of low, lower middle income, and upper middle income countries (Table 31 & 32). In fact, although growth of real GDP per capita (PPP) of ASEAN4, 5 and 6 was slightly above world average over , if the period of Asian Financial Crisis is taken into account ( ), ASEAN countries performed below the world average as well (Table 32) ASEAN countries performed relatively better on GDP growth than GDP per capita growth when compared to the more advanced countries, because of the relatively higher population growth in the region, as compared to the advanced economies (Table 32) China and India (combined) rose particularly strongly over the last 10 years the period when ASEAN performance improvement slowed (Table 30 & Tables 31). Indeed, by 2000, China s per capita real GDP PPP has already exceeded the average of ASEAN. As pointed out by some scholars, the global trading system is not a zero-sum game, in that the decline in the market share of ASEAN exports of finished products to developed countries can being compensated by the increase in the exports of ASEAN components to China as it emerged to become the global production base for a wide range of manufactured goods (Ravenhill, 2006; Liu & Luo, 2004). Indeed, the growing importance of China to ASEAN can be seen from the fact that ASEAN has become the 5th largest export markets for China and 4th largest import suppliers of China in 2006 (Table 33). Moreover, China was ranked by Indonesia, Malaysia, Singapore and Thailand as one of their top 5 export markets and import source countries in 2006 (Table 34). The above observations notwithstanding, it remains true that the rapid rise of China and 14
17 India in the last decade has certainly reduced the relative share of ASEAN in the world economy; in particular, the declining share of ASEAN in global inward FDI has been largely due to the rapid rise of China (and more recently India) as a FDI destination. The third key finding is that ASEAN member nations not only remain quite diverse in terms of income level (according to World Bank s classification using 2006 Gross National Income per capita, see Table 28), but their GDP per capita growth performance had also been very diverse. Indeed, diversity in performance had been observed even among member countries within the same income group. For example, Vietnam has performed much better than Indonesia in recent years, while Malaysia and Thailand had continued to perform better than Philippines since 2000, despite suffering more severe downturns in than the latter. Overall, Indonesia seems to be the laggard in ASEAN in terms of growth of real GDP per capita in the last decade, although Philippines grew the least over the last 3 decades. 6. Competitiveness Determinants of ASEAN 6.1. Summary of Competitiveness Determinants of ASEAN Figures 24 to 29 show the selected competitiveness determinants of ASEAN using the dimensions of determinants as reported by Global Competitiveness Index (GCI) (9 pillars in ; 12 pillars in normalised to 9 pillars), which were introduced by the Global Competitiveness Report since The following key findings can be highlighted: From , ASEAN countries did not make much progress in improving the fundamentals vital for their competitiveness, in fact, there was a decline in the health and primary education category (consists of indicators such as business impact of malaria, tuberculosis, HIV/AIDS, incidence/prevalence of these 3 diseases, infant mortality, life expectancy, quality of primary education, primary enrolment and education expenditure) On average, ASEAN as a whole was particularly lagging behind in institutions, infrastructure, higher education & training, technology readiness and innovation compared to high income countries Overall, there seems to be a close correlation between the level of GDP per capita and the scores of most competitiveness determinants. High income ASEAN country Singapore has higher determinant levels than the middle and lower income countries in virtually all dimensions, but particularly so in terms of infrastructures, technological readiness, institutions and innovations. Middle income countries score better than lower income countries in most dimensions, particularly infrastructure, institutions, and technological readiness. 15
18 Of the three middle income ASEAN countries, Thailand and Malaysia seem to have higher scores on most dimensions compared to selected reference countries in the same income group (Brazil, Mexico, South Africa), but Philippines seem to have levels comparable to Indonesia and Vietnam in the lower income group For lower income ASEAN countries (Vietnam and Indonesia), the level of infrastructure, macroeconomic stability and business sophistication seem to be below those of selected reference countries in the same income group (China, India) While the GCI 9 (12) competitiveness pillars framework represents a comprehensive conceptual model for categorizing the various factors that influence competitive performance, it does suffered from a lack of comparable data in earlier years before 2005, making it difficult to examine how ASEAN competitiveness determinants have changed over the last decade. Moreover, many of the actual measures for the various GCI sub-indices used were not based on objective measures, or were not sufficiently comprehensive in their coverage. In view of this, future research may need to examine other sources of data to identify more objective and more refined measures for some of the relatively weak measures currently used in GCI framework. For example, the GCI indices for market efficiency and institution could be supplemented with more detailed information from World Bank s annual Cost of Doing Business survey, which provides much more disaggregated measures of the various dimensions of market transaction costs and regulatory costs. As can be seen from Tables 35 and 36; Figures 30 and 31, there appears to be much greater variations in cost of doing business among the ASEAN countries based on the World Bank s Cost of Doing Business ranking of countries than is suggested by the GCR scores of market efficiency and institution pillars; in particular, while there are little variations between Vietnam, Philippines and Indonesia in the score of market efficiency and institution pillars of GCR, World Bank s Cost of Doing Business data suggest that Vietnam scores much higher than Philippines and Indonesia in ease of doing business (Tables 35 and 36; Figures 30 and 31). Similarly, while the GCR score for innovation capacity does show some differences between the middle and lower income ASEAN countries versus Singapore, an analysis of S&T performance using more objective indicators like scientific publications and patent outputs shows much higher disparity in performance between the high, middle and lower income ASEAN countries (Table 37), and even higher disparity when comparing the middle and lower ASEAN countries with the Asian NIEs of Taiwan, Korea and Hong Kong. 7. Conclusions ASEAN has been considered one of the most successful regional groupings in the world since its inception in 1967 to the mid 1990s. Over the period , ASEAN achieved higher economic growth than virtually any other region in the world. However, economic realities have dramatically changed in the past 10 years with the onset of the Asian Financial Crisis in 1997 and the emergence of China and India as economic powerhouse in Asia since the mid-1990s. After experiencing a sharp decline in economic performance over as a result of the Asian Financial Crisis, ASEAN as a group did rebound somewhat in the 16
19 ensuing period, but had never quite recovered its former competitiveness position in the world economy. Not only had ASEAN s share of world GDP, trade and inward direct foreign investment (FDI) declined between 1997 and 2006, ASEAN s productivity growth, as measured by the growth of real GDP PPP per capita in the period had declined both absolutely (when compared to the earlier period of ) and relatively (when compared to the average for all low and middle-income economies). In particular, ASEAN s declining competitiveness performance in the decade after the 1997 Asian financial crisis stands in strong contrast with the rapid increase in world market share and growth in productivity of China and India. Significant variations are also found among the individual ASEAN member countries in terms of competitiveness performance. In particular, among the low income countries, Vietnam had achieved significant catching up in the last decade, while Indonesia had performed less well. Despite being already a high-income country, Singapore had outperformed Thailand and Malaysia in the last decade. The variations in competitiveness performance among the ASEAN member countries appear to correlate with systematic variations in the underlying determinants of competitiveness as captured by the GCI ninepillar framework as well as by other data sources. As Asia entered the 21 st century, the global media had rightly highlighted the last decade of the 20 th century as the lost decade for the largest economy in Asia Japan. Although less obvious, it may well be that future economic historians will refer to the decade after the 1997 Financial Crisis as the lost decade for ASEAN. Yes, ASEAN did recover from the financial crisis and achieved moderate economic growth during that decade. And yes, the rise of the two Asian mega-economies -- China and India -- has contributed significantly to the relative decline of ASEAN in the expanding global economic pie. But virtually all economists would agree that the slow pace of economic integration and liberalization among the ASEAN member states has been an important contributing factor in the above observed erosion of the competitive positioning of ASEAN in the world economy. Throughout the last decade, intra-asean trade had been at or below one-quarter of total ASEAN trade, much less than in the case of the European Union (about two-thirds among EU25) and NAFTA (over 40%). As global competition continues to intensify, we can only hope that ASEAN will make up for lost time by speeding up the economic integration process in the next decade. 17
20 References ASEAN Secretariat. (2005). ASEAN Baseline Report: Measurements to Monitor Progress Towards The ASEAN Community. Jakarta: ASEAN Secretariat. ASEAN Secretariat. (2007). ASEAN Statistics. Retrieved from ASEAN Secretariat web site: ASEAN Secretariat. (2007). Statistics of Foreign Direct Investment in ASEAN, Seventh Edition, Retrieved from ASEAN Secretariat web site: Business Times Singapore (2008), Asean seen on track for economic integration, September 5. The Economist (2008), Economics Focus Grossly Distorted Picture, March 15. Hew, D., & Das, S. B. (2008). ASEAN Economic Community and CLMV Countries. Workshop on Production Networks, Industrial Clusterings and Industrialisation Strategy in Less Developed Southeast Asia. Singapore: ISEAS. International Monetary Fund. (April 2008). Frequently Asked Questions - World Economic Outlook. Retrieved from IMF website: International Monetary Fund. (April 2007). World Economic Outlook Database. Joint Media Statement (2008), The Fortieth ASEAN Economic Ministers (AEM) Meeting Singapore, August. Liu, Y., & Luo, H. (2004). Impact of Globalization on International Trade between ASEAN- 5 and China: Opportunities and Challenges. In Global Economy Journal, Vol. 4, Issue 1, Article 6. The Berkeley Electronic Press. Maddison, A. (2001). The World Economy: A Millennial Perspective. Paris: Development Centre, OECD. McKinsey & Company. (2003). ASEAN Competitiveness Study. McKinsey & Company. OECD. (1994). Globalisation and Competitiveness: Relevant Indicators. Paris: OECD Directorate for Science, Technology and Industry. Porter, M. (2006). Building The Microeconomic Foundations of Prosperity. In A. Lopez- Claros, M. Porter, X. Sala-i-Martin, & K. Schwab, The Global Competitiveness Report World Economic Forum. Porter, M., Ketels, C., & Delgado, M. (2006). The Microeconomic Foundations of Prosperity: Findings from the Business Competitiveness Index. In A. Lopez-Claros, M. Porter, X. Sala-i- Martin, & K. Schwab, The Global Competitiveness Report World Economic Forum. 18
21 Ravenhill, J. (2006). Is China an Economic Threat to Southeast Asia?. In Asian Survey, Vol. 46, Issue 5, pp University of California. Sala-I-Martin, X., Blanke, J., Hanouz, M.D., Geiger, T., Mia, I. and Paua, F. (2007), The Global Competitiveness Index: Measuring the Productive Potential of Nations. In Michael E. Porter, Xavier Sala-I-Martin, and Klaus Schwab, Global Competitiveness Report, United Nations Conference on Trade and Development. (2007). Key Data from World Investment Report Annex Tables: United Nations Conference on Trade and Development. Retrieved from United Nations Conference on Trade and Development: United Nations Industrial Development Organization. (2007). UNIDO Industrial Statistics Database. The World Bank. (2008). Statistical Manual Purchasing Power Parities. Retrieved from World Bank website: 9~theSitePK: ,00.html The World Bank. (2006/7). World Development Indicators on-line database. World Trade Organisation. (2007). World Trade Organisation- Time Series. Retrieved from World Trade Organisation website: 19
22 TABLES Table 1 - Dimensions of Determinants of Competitiveness by GCI Overall GCI for 2005/06, 2006/07 versions: Overall GCI for 2007/08 version: Basic Requirements subindex (pillars 1 to 4) Basic Requirements subindex (pillars 1 to 4) 1st pillar: Institutions 2nd pillar: Infrastructure 3rd pillar: Macroeconomy 4th pillar: Health and primary education 1st pillar: Institutions 2nd pillar: Infrastructure 3rd pillar: Macroeconomic stability 4th pillar: Health and primary education Efficiency Enhancers subindex (pillars 5 to 7) Efficiency Enhancers subindex (pillars 5 to 10) 5th pillar: Higher education and training 6th pillar: Market efficiency 7th pillar: Technological readiness Innovation Factors subindex (pillars 8 to 9) 8th pillar: Business sophistication 9th pillar: Innovation 5th pillar: Higher education and training 6th pillar: Goods Market efficiency 7th pillar: Labour Market efficiency 8th pillar: Financial market sophistication 9th pillar: Technological readiness 10th pillar: Market size Innovation and Sophistication subindex (pillars 11 to 12) 11th pillar: Business sophistication 12th pillar: Innovation Source: Global Competitiveness Report 2006, 2007 & 2008 Table 2 ASEAN Total Population and Share in World Population Total Population (millions) ASEAN ASEAN ASEAN6a ASEAN6b ASEAN Share in World Population (%) ASEAN4 5.8% 5.9% 6.0% 6.0% 6.0% 6.1% ASEAN5 5.8% 6.0% 6.1% 6.1% 6.1% 6.2% ASEAN6a 5.9% 6.0% 6.1% 6.1% 6.1% 6.2% ASEAN6b 7.1% 7.3% 7.4% 7.4% 7.4% 7.5% ASEAN10 8.0% 8.3% 8.5% 8.5% 8.5% 8.6% Source: World Bank World Development Indicators Online 20
23 Table 3 - Compound Annual Growth Rate of Total Population, % ASEAN10 World Note: ASEAN4, 5, 6a & 6b grew at the same rates as ASEAN10 in all the periods except in which all grew at 1.7% Source: World Bank World Development Indicators Online Table 4 - Population Share in ASEAN Countries, Various Years Country Name Brunei Darussalam 0.05% 0.06% 0.06% 0.06% 0.06% 0.07% Cambodia 1.86% 2.23% 2.42% 2.44% 2.48% 2.57% Indonesia 41.64% 40.89% 40.21% 40.14% 40.12% 39.97% Lao PDR 0.87% 0.94% 1.00% 1.00% 1.02% 1.03% Malaysia 3.86% 4.09% 4.35% 4.39% 4.47% 4.62% Myanmar 9.46% 9.35% 9.30% 9.29% 9.28% 9.13% Philippines 13.50% 14.02% 14.48% 14.55% 14.74% 15.16% Singapore 0.68% 0.70% 0.77% 0.78% 0.78% 0.79% Thailand 13.01% 12.53% 12.10% 12.04% 11.95% 11.60% Vietnam 15.08% 15.19% 15.31% 15.29% 15.10% 15.07% Source: World Bank World Development Indicators Online Table 5 ASEAN Total GDP and Share in PPP and Constant 2000 International $ Terms Total GDP ($million) ASEAN4 578, ,044 1,513,617 1,371,127 1,490,307 1,978,451 ASEAN5 600,876 1,018,707 1,595,081 1,451,470 1,585,101 2,102,803 ASEAN6b - 1,095,006 1,728,916 1,593,020 1,743,474 2,348,806 ASEAN10 600,876 1,099,331 1,752,874 1,618,099 1,773,485 2,398,137 Share in World GDP (%) ASEAN4 2.4% 2.9% 3.7% 3.3% 3.3% 3.4% ASEAN5 2.5% 3.1% 3.9% 3.5% 3.5% 3.6% ASEAN6b - 3.3% 4.2% 3.8% 3.8% 4.1% ASEAN10 2.5% 3.3% 4.3% 3.9% 3.9% 4.2% * GDP figures are in PPP terms at constant 2000 international $, million; no data for Brunei Source: World Bank World Development Indicators Online 21
24 Table 6 ASEAN Total GDP and Share in PPP and Current International $ Terms Total GDP ($ million) ASEAN4 332, ,802 1,472,173 1,347,639 1,520,733 2,354,107 ASEAN5 344, ,804 1,551,457 1,426,698 1,617,425 2,501,962 ASEAN6a - 861,488 1,557,942 1,433,219 1,624,589 2,511,691 ASEAN6b 368, ,020 1,678,960 1,563,046 1,775,558 2,788,352 ASEAN10 382, ,350 1,748,288 1,636,510 1,868,547 2,989,544 Share in World GDP (%) ASEAN4 2.8% 3.3% 3.8% 3.4% 3.4% 3.5% ASEAN5 2.9% 3.4% 4.0% 3.6% 3.6% 3.7% ASEAN6a - 3.5% 4.0% 3.6% 3.6% 3.7% ASEAN6b 3.1% 3.7% 4.3% 3.9% 3.9% 4.1% ASEAN10 3.2% 3.9% 4.5% 4.1% 4.1% 4.4% * GDP figures are in PPP (current international $, million) Source: International Monetary Fund World Economic Outlook Database, October 2007 Table 7 ASEAN Total Trade and Share in World Trade Total Trade (US$ billion) ASEAN ASEAN ,344.1 ASEAN6a ,353.5 ASEAN6b ,428.1 ASEAN ,454.8 Share in World Trade (%) ASEAN4 2.1% 2.6% 4.0% 3.4% 3.8% 3.4% ASEAN5 3.2% 4.2% 6.2% 5.3% 5.8% 5.5% ASEAN6a 3.3% 4.3% 6.3% 5.3% 5.9% 5.5% ASEAN6b 3.2% 4.3% 6.4% 5.4% 6.1% 5.8% ASEAN10 3.3% 4.4% 6.5% 5.5% 6.2% 5.9% Source: World Trade Organisation Table 8 - Share in World Total Trade by Regional Integration Arrangement (%) ASEAN (Association of South East Asian Nations) European Union (15) European Union (25) MERCOSUR (Southern Common Market) NAFTA (North American Free Trade Agreement) Notes: (1) Data for European Union (15) is from ; data for European Union (25) is from (2) EU-25 includes Austria, Belgium, Cyprus, Czech Republic, Denmark, Estonia, Finland, France, Germany, Greece, Hungary, Ireland, Italy, Latvia, Lithuania, Luxembourg, Malta, Netherlands, Poland, Portugal,Slovakia, Slovenia, Spain, Sweden, and United Kingdom. EU-15 refers to the 15 countries in the European Union before the expansion on 1 May They are: Austria, Belgium, Denmark, Finland, France, Germany, Greece, Ireland, Italy, Luxembourg, Netherlands, Portugal, Spain, Sweden, and United Kingdom. (3) NAFTA (North American Free Trade Agreement) includes USA, Canada and Mexico. (4) MERCOSUR (Southern Common Market) includes Argentina, Brazil, Paraguay and Uruguay. (5) Data for ASEAN includes data of all 10 member countries for all years Source: World Trade Organisation 22
25 Table 9 Top Ten ASEAN Trade Partner, 2006 value in US$ million; share in percent Trade partner country/region 1/ Value Share to total ASEAN trade Exports Imports Total trade Exports Imports Total trade ASEAN 189, , , Japan 81, , , USA 96, , , European Union-25 94, , , China 65, , , Republic of Korea 25, , , Australia 23, , , India 18, , , Taiwan 9, , , Hong Kong, SAR 13, , , Total top ten trade partner countries 617, , ,136, Others 2/ 133, , , Total 750, , ,404, Source: ASEAN Trade Database (compiled from data submission and/or websites of ASEAN Member Countries' national statistical offices and other relevant government agencies) Notes - not available as of publication time x not available/not compiled Some figures may not sum up to totals due to rounding off errors. 1/ includes Austria, Belgium, Cyprus, Czech Republic, Denmark, Estonia, Finland, France, Germany, Greece, Hungary, Ireland, Italy, Latvia, Lithuania, Luxembourg, Malta, the Netherlands, Poland, Portugal, Slovakia, Slovenia, Spain, Sweden, and United Kingdom 2/ includes trade of all other countries and those that could not be attributed to specific countries Table 10 Top Ten Export Markets and Import Origins, 2006 value in US$ million; share in percent Export market Import origin Country of destination 1/ Value of Share to exports total Country of origin 1/ Value of Imports Share to total ASEAN 189, ASEAN 163, USA 96, Japan 80, European Union-25 94, China 74, Japan 81, European Union-25 66, China 65, USA 64, Republic of Korea 25, Republic of Korea 26, Australia 23, Australia 13, India 18, Taiwan 12, Hong Kong, SAR 13, India 9, United Arab Emirates 11, Saudi Arabia 8, Total top ten destination countries 620, Total top ten origin countries 520, Others 2/ 130, Others 2/ 133, Total 750, Total 654, Source: ASEAN Trade Database (compiled from data submission and/or websites of ASEAN Member Countries' national statistical offices and other relevant government agencies) Notes 1/ identified/ranked based on share of total ASEAN exports/imports 2/ includes trade of all other countries and those that could not be attributed to specific countries 23
26 Table 11 - Top Ten ASEAN Trade Commodity Groups, 1998 value in US$ million; share in percent Commodity group 1/ Value Share to total ASEAN trade 2-digit HS code Description Exports Imports Total trade Exports Imports Total trade 85 Electric machinery, equipment and 66, , , parts; sound equipment; television equipment 84 Nuclear reactors, boilers, machinery 51, , , and mechanical appliances; parts thereof 27 Mineral fuels, mineral oils & products 22, , , of their distillation; bitumin substances; mineral wax 90 Optical, photographic, 3, , , cinematographic, measuring, checking, precision, medical or surgical instruments/apparatus; parts & accessories 39 Plastics and articles thereof 4, , , Organic chemicals 3, , , Animal/veg fats & oils & their 6, , cleavage products; prepared edible fats; animal or vegetable waxes 71 Natural or cultured pearls, precious or 5, , , semiprecious stones, precious metals and metals clad therewith and articles thereof; imitation jewelry; coin 44 Wood and articles of wood; wood 6, , charcoal 88 Aircraft, spacecraft, and parts thereof 1, , , Total top ten commodity groups 170, , , Others 61, , , Total 232, , , Source: The World Integrated Trade Solution (WITS), The World Bank Note: 1/ identified based on the share of the 2-digit classification (section) of the Harmonized System (HS) to total trade in
27 Table 12 Top Ten ASEAN Trade Commodity Groups, 2006 value in US$ million; share in percent Commodity group 1/ Value Share to total ASEAN trade 2-digit HS code Description Exports Imports Total trade Exports Imports 85 Electric machinery, equipment and parts; sound equipment; television equipment 206, , , Mineral fuels, mineral oils & products 107, , ,077.7 of their distillation; bitumin substances; mineral wax 84 Nuclear reactors, boilers, machinery and mechanical appliances; parts thereof 39 Plastics and articles thereof 20, , Organic chemicals 20, , Vehicles, (not railway, tramway, rolling stock); parts and accessories 17, , Optical, photographic, cinematographic, measuring, 14, ,873.4 checking, precision, medical or surgical instruments/apparatus; parts & accessories 72 Iron and steel 6, , Rubber and articles thereof 71 Natural or cultured pearls, precious or semiprecious stones, precious metals and metals clad therewith and articles thereof; imitation jewelry; coin Total trade , , , , , , ,266.3 Total top ten commodity groups 541, , ,033, , , , , , , , Others2/ 209, , , Total 750, , ,404, Source: ASEAN Trade Database (compiled from data submission and/or websites of ASEAN Member Countries' national statistical offices and other relevant government agencies) Notes - not available as of publication time x not available/not compiled Some figures may not sum up to totals due to rounding off errors. 1/ identified based on the share of the 2-digit classification (section) of the Harmonized System (HS) to total trade in / include products with unspecified codes and/or products that could not be explicitly classified according to the current HS Table 13 - Share in ASEAN total trade ASEAN ASEAN ASEAN6a ASEAN6b Source: World Trade Organisation 25
28 Table 14 Intra-ASEAN Import, Export and Trade Statistics (US$ million) Value (US$ million) Intra-ASEAN export 28,954 88,189 72, , ,385 Intra-ASEAN import 26,309 76,253 64,464 89, ,192 Intra-ASEAN trade 55, , , , ,577 ASEAN total export 144, , , , ,991 ASEAN total import 162, , , , ,855 ASEAN total trade 306, , , ,701 1,454,846 Note: ASEAN data includes all 10 ASEAN member countries for all years; For 2006, ASEAN total trade figure of US$1,454.8 billion from World Trade Organisation (WTO) differs from the ASEAN Trade Database figure shown in Table 12 of US$1,404.8 billion. The WTO ASEAN trade figures will be used in Tables 15, 16, 17 & 18 for aggregate-level comparisons of trade performance. Sources: World Trade Organisation Table 15 Intra-ASEAN Import, Export and Trade Share Statistics (%) Share of Intra-ASEAN export to ASEAN total export Share of Intra-ASEAN import to ASEAN total import Share of Intra-ASEAN trade to ASEAN total trade Share of Intra-ASEAN trade to extra-asean trade Note: ASEAN data includes all 10 ASEAN member countries for all years Sources: World Trade Organisation Share (%) Table 16 - Intra-Regional Trade as a Percentage of Total Trade by Regional Integration Arrangement (%) ASEAN (Association of South East Asian Nations) European Union (15) European Union (25) MERCOSUR (Southern Common Market) NAFTA (North American Free Trade Agreement) Notes: (1) Data for European Union (15) is from ; data for European Union (25) is from (2) EU-25 includes Austria, Belgium, Cyprus, Czech Republic, Denmark, Estonia, Finland, France, Germany, Greece, Hungary, Ireland, Italy, Latvia, Lithuania, Luxembourg, Malta, Netherlands, Poland, Portugal,Slovakia, Slovenia, Spain, Sweden, and United Kingdom. EU-15 refers to the 15 countries in the European Union before the expansion on 1 May They are: Austria, Belgium, Denmark, Finland, France, Germany, Greece, Ireland, Italy, Luxembourg, Netherlands, Portugal, Spain, Sweden, and United Kingdom. (3) NAFTA (North American Free Trade Agreement) includes USA, Canada and Mexico. (4) MERCOSUR (Southern Common Market) includes Argentina, Brazil, Paraguay and Uruguay. (5) Data for ASEAN includes data of all 10 member countries for all years (6) McKinsey report (McKinsey & Company, 2003) showed that although total ASEAN trade has grown, intra-asean trade as a percentage of total ASEAN trade has declined from 26% to 21% from 1994 to They were referring to ASEAN5 of Singapore, Malaysia, Thailand, Indonesia and Philippines, and not ASEAN10 as a whole. Source: World Trade Organisation 26
29 Table 17 Intra-ASEAN Import, Export and Trade Share Growth Rates (%) Compound Annual Growth Rate (%) Share of Intra-ASEAN export to ASEAN total export Share of Intra-ASEAN import to ASEAN total import Share of Intra-ASEAN trade to ASEAN total trade Share of Intra-ASEAN trade to extra- ASEAN trade Intra-ASEAN trade Note: ASEAN data includes all 10 ASEAN member countries for all years Sources: World Trade Organisation Table 18 Share of Intra-ASEAN trade to ASEAN total GDP (%) Intra-ASEAN trade (US$ mil) 55, , , , ,577 ASEAN Total GDP (US$ mil) 350, , , ,685 1,065,627 Intra-ASEAN trade to ASEAN total GDP (%) Note: ASEAN data includes all 10 ASEAN member countries for all years Sources: World Trade Organisation Table 19 - Top 10 Intra-ASEAN Trade Commodity Groups, 1998 value in US$ million; share in percent Commodity group Value Share to total Intra-ASEAN trade 2-digit HS Description Exports Imports Total trade Exports Imports Total trade code 85 Electric machinery, equipment and 19, , , parts; sound equipment; television equipment 84 Nuclear reactors, boilers, machinery 8, , , and mechanical appliances; parts thereof 27 Mineral fuels, mineral oils & 4, , , products of their distillation; bitumin substances; mineral wax 71 Natural or cultured pearls, precious 2, , or semiprecious stones, precious metals and metals clad therewith and articles thereof; imitation jewelry; coin 39 Plastics and articles thereof 1, , Organic chemicals , Articles of iron or steel , Optical, photographic, , cinematographic, measuring, checking, precision, medical or surgical instruments/apparatus; parts & accessories 15 Animal/veg fats & oils & their , cleavage products; prepared edible fats; animal or vegetable waxes 10 Cereals , , Total top ten commodity groups 39, , , Others 13, , , Total 53, , , Source: The World Integrated Trade Solution (WITS), The World Bank 27
30 Table 20 - Top 10 Intra-ASEAN Trade Commodity Groups, 2006 value in US$ million; share in percent Commodity group Value Share to total Intra-ASEAN trade 2-digit HS Description Exports Imports Total trade Exports Imports Total trade code 85 Electric machinery, equipment and 54, , , parts; sound equipment; television equipment 27 Mineral fuels, mineral oils & 31, , , products of their distillation; bitumin substances; mineral wax 84 Nuclear reactors, boilers, machinery 28, , , and mechanical appliances; parts thereof 39 Plastics and articles thereof 6, , , Organic chemicals 5, , , Vehicles other than railway,tramway, 4, , , roll-stock; parts and accessories 73 Articles of iron or steel. 3, , , Optical, photographic, 3, , , cinematographic, measuring, checking, precision, medical or surgical instruments/apparatus; parts & accessories 74 Copper and articles thereof 2, , , Rubber and articles thereof 2, , , Total top ten commodity groups 144, , , Others 37, , , Total 181, , , Source: The World Integrated Trade Solution (WITS), The World Bank 28
31 Table 21 ASEAN Total Inward FDI Flows and Share of World Total Total Inward FDI flows (US$ mil) ASEAN4 1,537 6,828 16,132 11,717 4,827 23,711 ASEAN5 2,773 12,403 29,885 19,031 21,311 47,918 ASEAN6a 2,753 12,410 30,586 19,604 21,860 48,352 ASEAN6b 2,774 12,583 32,472 20,731 22,600 50,233 ASEAN10 2,756 12,821 34,307 22,276 23,540 51,480 Share of World Total Inward FDI flows (%) ASEAN4 2.8% 3.4% 3.3% 1.7% 0.3% 1.8% ASEAN5 5.0% 6.2% 6.1% 2.7% 1.5% 3.7% ASEAN6a 5.0% 6.2% 6.3% 2.8% 1.5% 3.7% ASEAN6b 5.0% 6.2% 6.6% 2.9% 1.6% 3.8% ASEAN10 5.0% 6.4% 7.0% 3.1% 1.7% 3.9% Source: UNCTAD World Investment Report, 2007 Table 22 Intra-ASEAN FDI Net Inflow, Intra-ASEAN FDI net inflow 6,242 Extra-ASEAN FDI net inflow 46,137 Total net inflow of ASEAN 52,380 Intra-ASEAN FDI share to total net inflow of ASEAN 11.9% Note: value in US$million; share in % Source: ASEAN Foreign Direct Investments Database, ASEAN Secretariat 29
32 Table 23 - Top Sources of ASEAN Foreign Direct Investments Cumulative Inflow, (US$ million) SOURCE COUNTRY Total Cumulative Inward FDI to ASEAN10 by Source Country, Value (US$ mil) % of Total European Union 79, % USA 48, % Japan 34, % ASEAN 32, % Singapore 19, % Malaysia 6, % Indonesia 3, % Thailand 1, % Philippines % Brunei Darussalam % Viet Nam % Myanmar % Cambodia % Lao PDR % ANIEs 20, % Republic of Korea 4, % Taiwan (ROC) 8, % Hong Kong 7, % China 2, % India 1, % OTHERS 65, % TOTAL 284, % Source: ASEAN Secretariat - ASEAN FDI Database, 2006 Table 24 - Intra-ASEAN Share of foreign Direct Investments Inflows Received by Each ASEAN10 Host Country, (%) HOST COUNTRY Brunei Darussalam Cambodia Indonesia Lao PDR Malaysia Myanmar Philippines Singapore Thailand Viet Nam SOURCE Intra-ASEAN 15.8% 10.7% 17.4% 50.3% 19.2% 26.3% 9.6% 5.8% 17.4% 17.0% Extra-ASEAN 84.2% 89.3% 82.6% 49.7% 80.8% 73.7% 90.4% 94.2% 82.6% 83.0% TOTAL 100.0% 100.0% 100.0% 100.0% 100.0% 100.0% 100.0% 100.0% 100.0% 100.0% Source: ASEAN Secretariat - ASEAN FDI Database,
33 Table 25 ASEAN Total Inward FDI Stocks and Share of World Total Total Inward FDI stocks (US$ mil) ASEAN4 12,110 30,683 95, , , ,808 ASEAN5 17,460 61, , , , ,897 ASEAN6a 17,479 61, , , , ,758 ASEAN6b 18,876 62, , , , ,349 ASEAN10 18,936 63, , , , ,025 Share of World Total Inward FDI stocks (%) ASEAN4 2.2% 1.7% 2.7% 2.7% 2.1% 1.3% ASEAN5 3.2% 3.4% 4.8% 4.7% 4.0% 3.1% ASEAN6a 3.2% 3.4% 4.9% 4.8% 4.1% 3.1% ASEAN6b 3.4% 3.5% 5.2% 5.1% 4.4% 3.3% ASEAN10 3.4% 3.6% 5.4% 5.3% 4.5% 3.5% Source: UNCTAD World Investment Report, 2007 Table 26 Real GDP Per Capita, PPP Terms ASEAN4 2,256 3,121 4,318 3,853 4,067 4,969 ASEAN5 2,321 3,235 4,501 4,034 4,278 5,224 ASEAN6b - 2,874 4,022 3,651 3,891 4,827 USA 22,568 28,263 31,716 32,671 34,599 38,165 Low income countries 1,124 1,402 1,645 1,694 1,794 2,359 Lower middle income countries 1,753 2,542 3,607 3,683 4,050 6,066 Upper middle income countries 7,784 7,833 7,611 7,524 7,911 9,625 High income countries 17,921 22,456 25,167 25,623 27,127 29,911 East Asia & Pacific countries 1,045 1,857 3,273 3,336 3,750 5,862 World 5,443 6,324 6,994 7,071 7,474 8,862 *GDP per capita were expressed in PPP and constant 2000 international $ terms; no data for Brunei Note: World Bank classifies all World Bank member economies, and all other economies with populations of more than 30,000. For operational and analytical purposes, economies are divided among income groups according to 2006 gross national income (GNI) per capita, calculated using the World Bank Atlas method. The groups are: low income, $905 or less; lower middle income, $906 3,595; upper middle income, $3,596 11,115; and high income, $11,116 or more. Other analytical groups based on geographic regions are also used. Income classifications are in effect until 1 July Taiwan data is not available. Because GNI per capita changes over time, the country composition of income groups may change from one edition of World Development Indicators to the next. Once the classification is fixed for an edition, based on GNI per capita in the most recent year for which data are available (2006 in this edition), all historical data presented are based on the same country grouping. According to World Bank, in ASEAN, low income countries include Cambodia, Laos, Myanmar, Vietnam; lower middle income countries include Indonesia, Philippines and Thailand; Malaysia is being classified as a upper middle income country; High income countries include Singapore and Brunei. China is being classified as a lower middle income country whereas India is being classified as a low income country. All the ASEAN countries are classified as East Asia & Pacific countries except Singapore and Brunei which are unclassified by Region. China is being classified as an East Asia & Pacific country whereas India is being classified as a South Asia country. OECD countries are being classified as high income countries. Source: World Bank World Development Indicators Online 31
34 Table 27 - Growth Rate of Real GDP per capita, PPP Terms (CAGR, %) Compound Annual Growth Rates of Real GDP per capita (PPP) ASEAN ASEAN ASEAN6b Low income Lower middle income Upper middle income High income East Asia & Pacific OECD World Japan Hong Kong, China Singapore S Korea China India United States *GDP per capita were expressed in PPP and constant 2000 international $ terms; no data for Brunei See notes under Table 26 for country composition of income groups and region. Source: World Bank World Development Indicators Online 32
35 Table 28 Classification of Economies based on World Bank Analytical Classifications, 1987 and 2006 World Bank Analytical Classifications (presented in World Development Indicators) Gross National Income per capita in US$ (Atlas methodology) Low income (L) <= 480 <= 905 Lower middle income (LM) 481-1, ,595 Upper middle income (UM) 1,941-6,000 3,596-11,115 High income (H) > 6,000 > 11,115 ASEAN (ex-singapore) Brunei Darussalam H H Malaysia LM UM Thailand LM LM Philippines LM LM Indonesia L LM Cambodia L L Lao PDR L L Myanmar L L Vietnam L L ASIAN NIEs Hong Kong, China H H Singapore H H Taiwan H H South Korea UM H Other Asia Japan H H China L LM India L L Other Emerging Economies Brazil UM UM Mexico LM UM South Africa LM UM Egypt, Arab Rep. LM LM Note: World Bank classifies all World Bank member economies, and all other economies with populations of more than 30,000. For operational and analytical purposes, economies are divided among income groups according to gross national income (GNI) per capita, calculated using the World Bank Atlas method. The Atlas methodology is used to reduce the impact of exchange rate fluctuations in the cross-country comparison of national incomes. The Atlas conversion factor for any year is the average of a country's exchange rate for that year and its exchange rates for the two preceding years, adjusted for the differences between the rate of inflation in the country and that in Japan, the United Kingdom, the United States, and the Euro area). A country's inflation rate is measured by the change in its GDP deflator. The inflation rate for the above countries, representing international inflation, is measured by the changes in the SDR deflator. (Special drawing rights, or SDRs, are the IMF's unit of account.) Source: World Bank World Development Indicators Online 33
36 Table 29 Total Factor Productivity (TFP) Estimates of Asian Countries, Asian NIEs Hong Kong, China Singapore South Korea Taiwan ASEAN Countries (exclude Singapore) Cambodia Indonesia Malaysia Philippines Thailand Vietnam Emerging Asia China India G7 United States Canada France Germany Italy Japan United Kingdom Latin America Brazil Mexico Source: Jorgenson, Dale and Khuong Vu "Information Technology and the World Economy", in The Network Society From Knowledge to Policy, ed. Gustavo Cardoso and Manuel Castells, eds., Center For Transatlantic Relations and Johns Hopkins University Sais pp
37 Table 30 - Summary of ASEAN s Competitiveness Performance vs. China & India Share in World Population ASEAN4 5.8% 5.94% 6.02% 6.02% 6.04% 6.11% ASEAN5 5.8% 6.00% 6.09% 6.09% 6.11% 6.18% ASEAN6a 5.9% 6.00% 6.09% 6.10% 6.11% 6.18% ASEAN6b 7.1% 7.26% 7.38% 7.38% 7.39% 7.47% ASEAN10 8.0% 8.30% 8.47% 8.47% 8.48% 8.56% China 22.2% 21.62% 21.13% 21.02% 20.82% 20.13% India 15.5% 16.18% 16.58% 16.62% 16.75% 17.03% Share in World GDP ASEAN4 2.4% 2.9% 3.7% 3.3% 3.3% 3.4% ASEAN5 2.5% 3.1% 3.9% 3.5% 3.5% 3.6% ASEAN6b 3.3% 4.2% 3.8% 3.8% 4.1% ASEAN10 2.5% 3.3% 4.3% 3.9% 3.9% 4.2% China 3.2% 5.6% 9.7% 10.2% 11.0% 15.0% India 3.3% 4.2% 5.0% 5.2% 5.3% 6.4% Share in World Trade ASEAN4 2.1% 2.6% 4.0% 3.4% 3.8% 3.4% ASEAN5 3.2% 4.2% 6.2% 5.3% 5.8% 5.5% ASEAN6a 3.3% 4.3% 6.3% 5.3% 5.9% 5.5% ASEAN6b 3.2% 4.3% 6.4% 5.4% 6.1% 5.8% ASEAN10 3.3% 4.4% 6.5% 5.5% 6.2% 5.9% China 0.9% 1.6% 2.9% 2.9% 3.6% 7.2% India 0.6% 0.6% 0.7% 0.7% 0.7% 1.2% Share of World Total Inward FDI flows ASEAN4 2.8% 3.4% 3.3% 1.7% 0.3% 1.8% ASEAN5 5.0% 6.2% 6.1% 2.7% 1.5% 3.7% ASEAN6a 5.0% 6.2% 6.3% 2.8% 1.5% 3.7% ASEAN6b 5.0% 6.2% 6.6% 2.9% 1.6% 3.8% ASEAN10 5.0% 6.4% 7.0% 3.1% 1.7% 3.9% China 0.1% 1.7% 9.3% 6.4% 2.9% 5.3% India 0.1% 0.1% 0.7% 0.4% 0.3% 1.3% Share of World Total Inward FDI stock ASEAN4 2.2% 1.7% 2.7% 2.7% 2.1% 1.3% ASEAN5 3.2% 3.4% 4.8% 4.7% 4.0% 3.1% ASEAN6a 3.2% 3.4% 4.9% 4.8% 4.1% 3.1% ASEAN6b 3.4% 3.5% 5.2% 5.1% 4.4% 3.3% ASEAN10 3.4% 3.6% 5.4% 5.3% 4.5% 3.5% China 0.2% 1.2% 4.4% 4.2% 3.3% 2.4% India 0.1% 0.1% 0.3% 0.3% 0.3% 0.4% Sources: World Bank World Development Indicators Online, World Trade Organisation, UNCTAD World Investment Report,
38 Table 31 - Summary Table on GDP Per Capita, Level and Growth Compound Annual Growth Rate of Real GDP per capita (PPP) Real GDP per capita (PPP) ASEAN ASEAN4 2,256 3,121 4,318 3,853 4,067 4,969 ASEAN ASEAN5 2,321 3,235 4,501 4,034 4,278 5,224 ASEAN6b ASEAN6b - 2,874 4,022 3,651 3,891 4,827 Low income Low income 1,124 1,402 1,645 1,694 1,794 2,359 Lower middle Lower middle income income 1,753 2,542 3,607 3,683 4,050 6,066 Upper middle Upper middle income income 7,784 7,833 7,611 7,524 7,911 9,625 High income High income 17,921 22,456 25,167 25,623 27,127 29,911 East Asia & East Asia & Pacific countries Pacific countries 1,045 1,857 3,273 3,336 3,750 5,862 OECD OECD 18,146 23,105 25,933 26,437 28,013 30,897 World World 5,443 6,324 6,994 7,071 7,474 8,862 Japan Japan 16,737 23,289 25,573 25,060 25,646 27,992 Hong Kong, Hong Kong, China China 11,929 19,678 24,872 23,432 26,214 32,901 Korea, Rep Korea, Rep. 4,780 9,814 14,932 13,808 16,149 20,572 China China 774 1,626 3,217 3,435 3,940 6,621 India India 1,165 1,655 2,106 2,194 2,364 3,308 United States United States 22,568 28,263 31,716 32,671 34,599 38,165 Indonesia Indonesia 1,440 2,224 3,292 2,821 2,905 3,570 Malaysia Malaysia 4,035 5,561 8,597 7,771 8,573 10,091 Philippines Philippines 3,982 3,703 3,931 3,829 4,032 4,731 Singapore Singapore 9,245 14,986 21,472 20,480 23,594 28,305 Thailand Thailand 2,546 4,596 6,651 5,892 6,321 8,065 Vietnam Vietnam - 1,153 1,774 1,850 2,040 2,925 South Africa South Africa 10,051 9,147 8,793 8,633 8,764 10,338 Mexico Mexico 7,981 7,751 8,316 8,603 9,262 9,967 Brazil Brazil 6,828 6,480 7,150 7,046 7,154 7,826 Egypt, Arab Rep Egypt, Arab Rep. 2,087 2,800 3,210 3,277 3,527 4,031 *GDP per capita were expressed in PPP and constant 2000 international $ terms; no data for Brunei See notes under Table 26 for country composition of income groups and region. Source: World Bank World Development Indicators Online 36
39 Table 32 - Summary Table on GDP Per Capita Growth and GDP Growth Compound Annual Growth Rate of Real GDP per capita (PPP) Compound Annual Growth Rate of Real GDP (PPP) ASEAN ASEAN ASEAN ASEAN ASEAN6b ASEAN6b Low income Low income Lower middle Lower middle income income Upper middle income Upper middle income High income High income East Asia & Pacific East Asia & Pacific countries countries OECD OECD World World Japan Japan Hong Kong, China Hong Kong, China Korea, Rep Korea, Rep China China India India United States United States Indonesia Indonesia Malaysia Malaysia Philippines Philippines Singapore Singapore Thailand Thailand Vietnam Vietnam South Africa South Africa Mexico Mexico Brazil Brazil Egypt, Arab Rep Egypt, Arab Rep *GDP and GDP per capita were expressed in PPP and constant 2000 international $ terms; no data for Brunei See notes under Table 26 for country composition of income groups and region. Source: World Bank World Development Indicators Online 37
40 Table 33 Importance of China to ASEAN as a whole China s Top Ten Export Markets China s Top Ten Import Suppliers Hong Kong United States 1 Japan Japan 2 Japan EU 2 United States EU 3 United States Hong Kong 3 West Germany South Korea 4 West Germany Japan 4 Australia ASEAN 5 United Kingdom ASEAN 5 Canada Taiwan 6 Romania South Korea 6 Hong Kong United States 7 Singapore Taiwan 7 United Kingdom Australia 8 North Korea Russia 8 Romania Russia 9 Italy Canada 9 France Saudi Arabia 10 France India 10 North Korea Brazil Source: IMF Direction of Trade Statistics and Ministry of Commerce, China Table 34 Importance of China to Individual ASEAN Countries China s Ranking as Export Market China s Ranking as an Import Source Country Australia Brazil India Indonesia Japan South Korea Malaysia Russia Singapore Taiwan na 1 na 2 Thailand United States EU-15 (excl Intra-EU Trade) Source : UN Comtrade and IMF Direction of Trade Statistics 38
41 Table 35 - Ease of Doing Business Ranking of ASEAN Countries Ease of Doing Business Ranking Economy 2007 Ease of Doing Business Rank 2008 Ease of Doing Business Rank Singapore 1 1 Hong Kong, China 4 4 Thailand Malaysia South Africa Mexico China Brazil Indonesia Egypt Philippines Vietnam India Cambodia Lao PDR Note: Number of countries for 2007 is 175 and for 2008 is 178 Source: World Bank, The Doing Business Database Table 36 - Time (days) Needed for Starting a Business in ASEAN Countries Economy Starting a Business, Time (days) Singapore 6 5 Hong Kong, China Egypt 19 9 Malaysia Mexico South Africa Thailand China Philippines Indonesia Brazil India Vietnam Cambodia Lao PDR Note: Data for 2006 and 2007 were reported in Ease of Doing Business, 2007 and 2008 respectively Source: World Bank, The Doing Business Database 39
42 Table 37 - Share in of World Total Publications/Patents (%) PUBLICATIONS PATENTS Asia Pacific(Ex- Japan) Asian NIEs Singapore South Korea Taiwan Emerging Economies China (incl HK) India ASEAN Malaysia Thailand Indonesia Philippines Other Asia Pacific ex Jpn Japan US World N 2,188,812 2,589,316 3,144,518 3,612,976 3,942, , , , , ,799 Source: Wong (2007) 40
 Source: World Bank World Development Indicators")
43 FIGURES Figure 1 Map of ASEAN Figure 2 ASEAN10 and World Population Trends (1960=100) Source: World Bank World Development Indicators Online 41


44 Figure 3 Population Share in ASEAN Countries, Various Years Source: World Bank World Development Indicators Online Figure 4 Population Share in ASEAN Countries, 1980 and 2006 Source: World Bank World Development Indicators Online 42
 Source: World Bank")


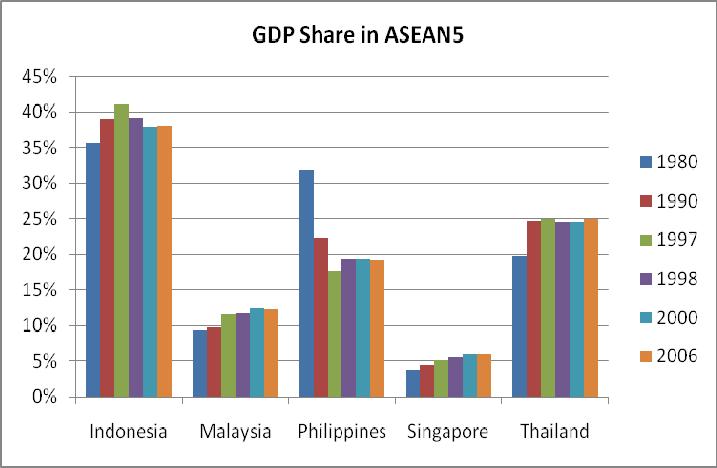
45 Figure 5 ASEAN and World Total GDP Trends (1975=100) Source: World Bank World Development Indicators Online Figure 6 GDP Share in ASEAN4, various years Source: World Bank World Development Indicators Online Figure 7 GDP Share in ASEAN5, various years Source: World Bank World Development Indicators Online 43

 Source: World Trade")
46 Figure 8 GDP Share in ASEAN6b, various years Source: World Bank World Development Indicators Online Figure 9 GDP Share in ASEAN6b, 1985 and 2006 Source: World Bank World Development Indicators Online Figure 10 Share in World Total Trade by Regional Integration Arrangement (%) Source: World Trade Organisation 44
47 Figure 11 Growth Trends in ASEAN and World Trade (1967=100) 45

48 Figure 12 Trade Share in ASEAN, 1980 and 2006 Source: World Trade Organisation Figure 13 Intra-Regional Trade as a Percentage of Total Trade, Various Years Source: World Trade Organisation 46
49 Figure 14 - Growth Trends of ASEAN and World Total Inward FDI Flows (1970=100) 47


50 Figure 15 - Growth Trends of ASEAN and World Total Inward FDI Stock (1980=100) Figure 16 - Share of Total Inward FDI Stock within ASEAN, 1980 and 2006 Source: UNCTAD World Investment Report,


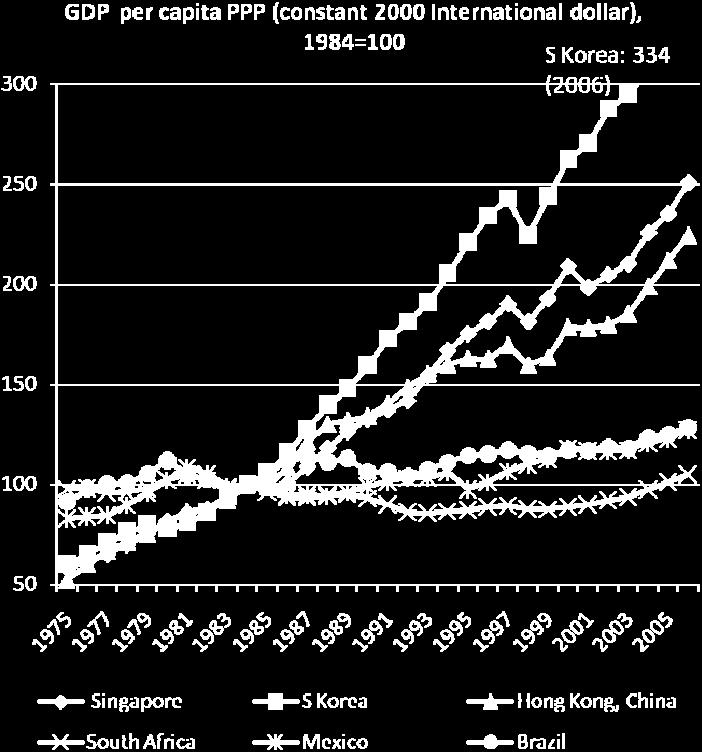
51 Figure 17 Growth Trends of Countries Started off from Low/Lower Middle Income Group in 1975 Figure 18 Growth Trends of Countries Started off from Upper Middle Income Group in


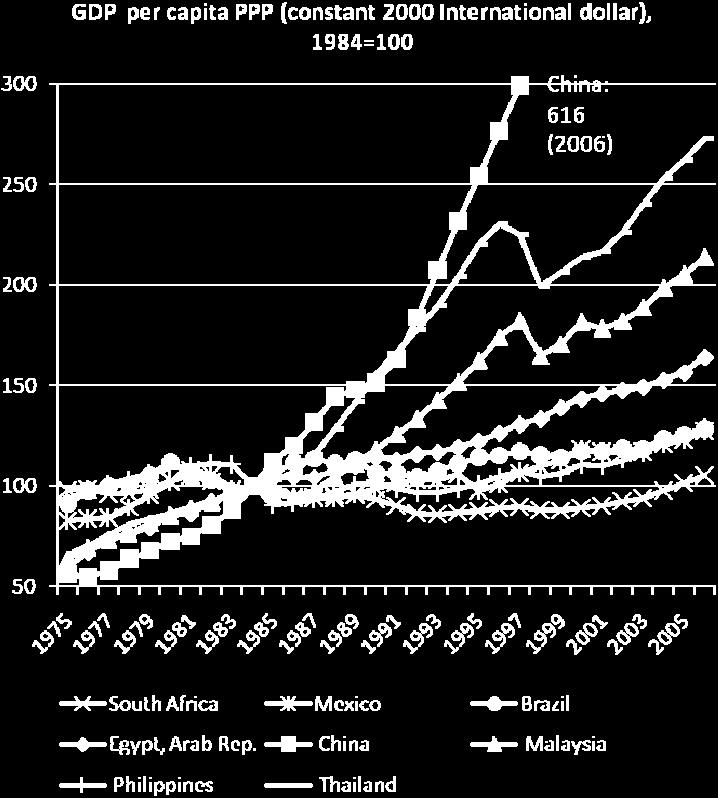
52 Figure 19 Growth Trends of Countries Remaining in Lower Middle Income Group from Figure 20 Growth Trends of Countries Remaining in Lower Middle Income Group from


53 Figure 21 Growth Trends of Countries in High Income Group in 2006 Figure 22 Growth Trends of ASEAN4, ASEAN5 and ASEAN6b from 1975 to
54 Figure 23 - Total Factor Productivity (TFP) Estimates, Derived from source: Jorgenson, Dale and Khuong Vu "Information Technology and the World Economy", in The Network Society From Knowledge to Policy, ed. Gustavo Cardoso and Manuel Castells, eds., Center For Transatlantic Relations and Johns Hopkins University Sais pp
55 Figure 24 Overall GCI and subindices, ASEAN6 ( vs vs ) Note: ASEAN6 refers to Indonesia, Malaysia, Philippines, Singapore, Thailand and Vietnam Source: World Economic Forum Global Competitiveness Reports 53
56 Figure 25 Overall GCI and subindices, vs (Singapore, HK & ASEAN6 Average) 54
57 Figure 26 Overall GCI and subindices, vs (Thailand, Brazil, Malaysia, Mexico) 55
58 Figure 27 Overall GCI and subindices, vs (Thailand, Malaysia, S Africa) 56
59 Figure 28 Overall GCI and subindices, vs (Indonesia vs Philippines and Vietnam) 57
60 Figure 29 Overall GCI and subindices, vs (Indonesia vs China India & Egypt) 58
61 Figure 30 Comparison of 2007 & 2008 Ease of Doing Business Rankings Source: World Bank, The Doing Business Database Figure 31 Starting A Business, Time (Days) Source: World Bank, The Doing Business Database 59
62 TECHNICAL APPENDIX 1 COMPARING GDP AND GDP PER CAPITA ESTIMATES ADJUSTED FOR PURCHASING POWER PARITY (PPP) GDP and GDP per capita numbers are reported in different forms by national statistical agencies, and by international data sources such as World Bank s World Development Indicators Online Database, International Monetary Fund s World Economic Outlook (WEO) Database and the Conference Board and Groningen Growth and Development Centre s Total Economy Database. They are being reported in the following forms: (a) GDP and GDP per capita in current prices, national currency (b) GDP and GDP per capita in constant prices, national currency (c) GDP and GDP per capita in current prices, US dollar (d) GDP and GDP per capita in constant prices, US dollar (e) GDP and GDP per capita in constant prices, in Purchasing Power Parity terms (international dollars) GDP and income data are commonly reported in current prices and in Purchasing Power Parity (PPP) terms but not in constant prices and in PPP terms. Sources that reported the latter include World World Development Indicators Online Database and the Conference Board and Groningen Growth and Development Centre s Total Economy Database. In the study of ASEAN s competitiveness, we believe that using GDP and GDP per capita expressed in international dollars (PPP terms) as well as in constant prices is important for international comparison of key growth rates. This is superior to using GDP and GDP per capita expressed in either international dollars (PPP terms) or in current prices only, but not both. This is because GDP and national incomes are affected both by Purchasing Power Parities and by inflation. Needless to say, comparing GDP and national incomes per capita without adjusted for PPP will yield distorted pictures due to different purchasing power of the currencies of the countries compared. In this technical appendix, we provided a definition of PPP, two methods of PPP rates derivation, and information on the United Nations International Comparison Programme (ICP) which is a worldwide effort to compare country income levels on a purchasing power adjusted basis. More importantly, we also provided a comparison of key growth rates using GDP numbers with and without PPP adjustment to underline the importance of doing PPP adjustment. International organisations such as the World Bank converted different countries' Gross Domestic Product (GDP) and Gross National Income (GNI) per capita measured in national currency into a common currency - usually the US$ - or some other common currency, so that comparison can be made internationally. In converting to a common currency, a choice has to be made whether to use exchange rates, some kind of adjusted exchange rates (e.g., 60
63 Atlas method) or purchasing power adjusted conversion factors (purchasing power parities, PPPs). PPP eliminates the inconsistencies inherent in exchange rate conversions, which are sometimes volatile and fail to reflect properly the differences in price levels between countries - particularly with respect to non-traded items (Devaluation of a country s currency will reduce its GDP in US$ over night, but it does not make the citizens less well off unless they buy imported goods. The exchange rate is the price on foreign currency, and is relevant for actual transfers across the border, but it is not too relevant for the part of GDP that does not enter international trade). The World Bank defined the PPP rate as the number of units of a country s currency that is required to buy the same amount of goods and services in the country as one US$ would buy in the US. PPP as a rate of conversion ensures that money exchanged for a dollar buys the same volume of goods and services in every country. By equalizing prices, PPP rates deliver a measure of relative GDP which is based on what constitutes "real" income, the volume of goods and services embodied in GDP (World Bank, 2008). In the IMF WEO online database, PPP rate is expressed as local currency per U.S. dollar (IMF, 2008). As to actual PPP-adjusted data, there are concerns related to coverage, continuity and timeliness of surveys, quality of results and aggregation procedures. The World Bank does not use PPP converted data for administrative purposes. For setting the terms for lending at the World Bank, the atlas method is used to convert income from local currencies to a common currency (US$). However, the World Bank uses available PPP-based numbers for analytical and poverty reduction policy purposes, as demonstrated in recent editions of the World Development Report and the World Development Indicators. As documented by the World Bank, PPP rates can be derived using several methods, each yielding different estimates. PPP rates are estimated on the basis of data from special price surveys. Price ratios of comparable items between countries are computed, and aggregated using corresponding weights based on GDP expenditure data. Several methods of aggregation exist, and there is no universal agreement as to which is superior as it depends on the purpose. PPPs can be used either for binary comparisons, or for comparison of a group of countries. Binary comparisons between pairs of countries are obtained by computing the ideal index, the Fisher index. However, the Fisher index is not transitive, thus, other methods are (should be) used for multilateral comparisons. (Transitivity means that comparing country A with C directly should give the same result as comparing country A with B and C with B -- making the comparison of A and C indirectly.) The two most commonly used methods of aggregation in multilateral comparisons are (i) the Geary-Khamis and (ii) the Elteto, Koves and Szulc, which both produce transitive and base-country invariant results (World Bank, 2008). 61
64 (i) The Geary-Khamis method involves using observed price and expenditure data to obtain implicit quantity estimates, and evaluate these quantities at a single set of average international prices denominated in a common currency, like the international dollar. (An international dollar has the same purchasing power as an US$ for total GDP in the US, but the purchasing power of the components are determined by the average international price structure, not the US price relatives.) (ii) The Elteto, Koves and Szulc, involves a two-step process. First step is to get a set of binary Fisher indexes for all pairs of countries, and step two is to make these comparisons transitive by computing geometric means of all the direct and indirect indexes. The results using the Geary-Khamis method will generally differ both in ranking and level compared to the results using the Elteto, Koves and Szulc method. The Geary-Khamis method has one advantage over the Elteto, Koves and Szulc method: it is additive. This means that components can be added to reach a total, making it possible to add expenditure at international prices to reach GDP at international prices. Thus, the use of the Geary- Khamis method makes it possible to put up an internally consistent set of national accounts data at international prices. However, the Geary-Khamis method tends to result in inflated quantity estimates for poorer countries. For an illustration of the computation using the Geary-Khamis method, please refer to the Statistical Manual of the World Bank as referenced (World Bank, 2008). The effort to convert national incomes for international comparison has started much earlier by the United Nations. The United Nations International Comparison Programme (ICP) was launched in 1968 as a worldwide effort to compare country income levels on a purchasing power adjusted basis. The initiative has been developed under the guidance of a group from the University of Pennsylvania in cooperation with international agencies, including the United Nations Statistical Office, the Statistical Office of the European Union, the Statistical Office of the Organization of Economic Cooperation and Development and the World Bank. In ICP, GDP by expenditure is divided into 150 (or more) groups/basic headings, in which all items selected for pricing are classified. Out of a list of specifications containing approximately 2000 items, each country collects the prices on 3 or more items per basic heading. An average price for each group / basic heading is estimated, in order to derive price ratios for each of these groups (un-weighted parities). These price ratios are then aggregated, a procedure which involves weighting and summing up, to arrive at PPPs and "real" expenditures for each category of expenditure up to the level of GDP. For the purpose of aggregation, two alternative methods of aggregation can be / are used in the ICP programme, the Geary-Khamis and the Elteto, Koves and Szulc. As mentioned earlier, both methods produce multilateral, rather than binary comparisons, and both methods lead to transitive and base-country invariant results. Special price surveys are conducted at about five year intervals, and have so far covered about 90 countries at one point of time. However, while surveys have been regular 62
65 and more or less complete in the industrialized countries, surveys for developing countries and countries in transition have been less regular and of more uncertain quality. Since not all countries have participated in all years, it has been necessary to extrapolate to construct an array for a given year for all the 90 countries. Furthermore, a recourse has been taken to shortcut procedures for the estimation of numbers for countries that have not participated in the ICP. As PPP numbers are available every fifth year, PPP-adjusted data like GDP and private consumption expenditure are extrapolated using real growth of the respective countries adjusted for US inflation. However, using this method, the estimates never match data based on a new benchmark year (new price survey), and there is no reason they should. This method allows prices only to change, while PPP-estimates include the effect of changes in quantities as well. This extrapolation method is also used whenever figures for a country are not available for a new benchmark year. Using this method means that data are less reliable the further away from the last benchmark year. In addition to extrapolation over time, it has also been necessary to come up with ICP or PPP numbers for countries not participating in the ICP programme. The usual method has been to use regression techniques to establish a structural relationship between ICP-type estimates on the one hand and a set of easily observable explanatory variables on the other. The World Bank has in World Development Indicators, World Development Report and World Bank Atlas published PPP-estimates derived on the basis of two independent variables; Atlas estimates of per capita GDP and secondary school enrolment. Such short-cut estimates are useful for analytical purposes, even though the estimates can have large residual errors. Despite limitations, the ICP-database constitutes the largest single source of data on international comparisons of price and expenditure patterns. For the purpose of making meaningful comparisons of GDP and GDP per capita between countries, despite limitations stated above, we make use of data expressed in PPP and real terms (constant 2000 international dollars) downloaded from World Bank s World Development Indicators Online database in March The following tables A1.1 to A1.6 aimed to illustrate the merit of using GDP (and GDP per capita) data measured in PPP and real terms. Before comparing GDP growth rates based GDP numbers in current prices, and/or PPP terms, Tables A1.1 to A1.3 below show the GDP of various ASEAN definitions and forms, and their shares to the world s total GDP. It is obvious from Table A1.1 that doing comparison using GDP expressed in current prices is not feasible because the shares of world GDP of various ASEAN definitions are distorted due to price and PPP effects. 63
66 Table A1.1 GDP of ASEAN in current prices (US$ million) Total GDP ASEAN4 185, , , , , ,084 ASEAN5 196, , , , , ,239 ASEAN6a - 339, , , , ,800 ASEAN6b 224, , , , ,391 1,030,234 ASEAN10 231, , , , ,685 1,065,627 Share in World GDP (%) ASEAN4 0.0% 0.0% 0.1% 0.0% 0.0% 0.0% ASEAN5 0.0% 0.0% 0.1% 0.0% 0.0% 0.1% ASEAN6a - 0.0% 0.1% 0.0% 0.1% 0.1% ASEAN6b 0.0% 0.0% 0.1% 0.0% 0.1% 0.1% ASEAN10 0.0% 0.0% 0.1% 0.0% 0.1% 0.1% * GDP figures are in current prices (US$ million) Source: International Monetary Fund World Economic Outlook Database, October 2007 Table A1.2 GDP of ASEAN in PPP (current international $, million) Terms Total GDP ASEAN4 332, ,802 1,472,173 1,347,639 1,520,733 2,354,107 ASEAN5 344, ,804 1,551,457 1,426,698 1,617,425 2,501,962 ASEAN6a - 861,488 1,557,942 1,433,219 1,624,589 2,511,691 ASEAN6b 368, ,020 1,678,960 1,563,046 1,775,558 2,788,352 ASEAN10 382, ,350 1,748,288 1,636,510 1,868,547 2,989,544 Share in World GDP (%) ASEAN4 2.8% 3.3% 3.8% 3.4% 3.4% 3.5% ASEAN5 2.9% 3.4% 4.0% 3.6% 3.6% 3.7% ASEAN6a - 3.5% 4.0% 3.6% 3.6% 3.7% ASEAN6b 3.1% 3.7% 4.3% 3.9% 3.9% 4.1% ASEAN10 3.2% 3.9% 4.5% 4.1% 4.1% 4.4% * GDP figures are in PPP (current international $, million) Source: International Monetary Fund World Economic Outlook Database, October
67 Table A1.3 GDP of ASEAN in PPP (constant 2000 international $, million) Terms Total GDP ASEAN4 578, ,044 1,513,617 1,371,127 1,490,307 1,978,451 ASEAN5 600,876 1,018,707 1,595,081 1,451,470 1,585,101 2,102,803 ASEAN6b - 1,095,006 1,728,916 1,593,020 1,743,474 2,348,806 ASEAN10 600,876 1,099,331 1,752,874 1,618,099 1,773,485 2,398,137 Share in World GDP (%) ASEAN4 2.4% 2.9% 3.7% 3.3% 3.3% 3.4% ASEAN5 2.5% 3.1% 3.9% 3.5% 3.5% 3.6% ASEAN6b - 3.3% 4.2% 3.8% 3.8% 4.1% ASEAN10 2.5% 3.3% 4.3% 3.9% 3.9% 4.2% * GDP figures are in PPP terms at constant 2000 international $, million; no data for Brunei Source: World Bank World Development Indicators Online, accessed in March 2008 Based on the GDP numbers stated in the Tables A1.1 to A1.3, GDP growth rates of ASEAN were computed and shown in Tables A1.4 to A1.6 below. Table A1.4 GDP growth rates of ASEAN based on GDP in current price s (US$ million) GDP (current prices, US$ million), CAGR ASEAN ASEAN ASEAN6a ASEAN6b ASEAN Table A1.5 GDP growth rates of ASEAN based on GDP in PPP (current international $, million) Terms GDP, PPP (current international $, million), CAGR ASEAN ASEAN ASEAN6a ASEAN6b ASEAN
68 Table A1.6 GDP growth rates of ASEAN based on GDP in PPP (constant 2000 international $, million) Terms GDP, PPP (constant 2000 interna tional $, million), CAGR ASEAN ASEAN ASEAN6b ASEAN In Table A1.4, (negativ e) growth rates of A SEAN bas ed on current prices were grossly m agnified during the Asian Financial Crisis in in excess of 30% per annum amidst plunging exchanging rates and rising inflation in ASEAN. While Table A1.5 reported a more believable set of growth rates of ASEAN GDP in PPP terms after taking into account purchasing power parity, it is still in nominal terms. Table A1.6 is the best set of indicator as GDP growth rates are based on both PPP and real terms, having removed the inflation effect and maintained purchasing power parity. 66
69 TECHNICAL APPENDIX 2 COMPARING GROWTH RATES USING GDP AND GDP PER CAPITA ESTIMATES As highlighted by a re cent article in The Economist (15 Mar 2008), real GDP per capita growth is a better gauge of economic perform ance than real GDP growth, due mainly t o the part played by population growth or decline. A country with high real GDP growth rate may n ot be well off if it is being matched by rising population growth. This article highlighted that, while US and Canada had higher real GDP growth rate (2.8% and 2.7%) than Japan (2.1%) over , in terms of real GDP per capita growth, the latter actually outperformed the former (2.0% vs. 1.8% and 1.7%) due to its slower population growth. Commonly used as a measure of prosperity or average living standards, growth of real GDP per capita should be used as a measure of competitiveness performance. Angus Maddison in his book The World Economy: A Millennial Perspective (Maddison, 2001) also noted the importance of taking into account population growth in the measure of prosperity and welfare. He used GDP, GDP per capita as well as population as indicators of welfare for his contour of world development. He mentioned that over the past millennium, world population has risen 22 fold. Per capita income increased 13 fold, world GDP nearly 300 fold. This contrasts sharply with the preceding millennium, when world population grew by only a sixth, and there was no advance in per capita income. From the year 1000 to 1820 the advance in per capita income was a slow crawl the world average rose about 50 per cent. Most of the growth went to accommodate a fourfold increase in population. Since 1820, world development has been much more dynamic. Per capita income rose more than eightfold, population more than fivefold. The following tables and charts show the growth trends of GDP, GDP per capita and population in ASEAN. ASEAN4, 5 & 6b have relatively high GDP growth rates of about 6.6% p.a. in the period before the Asian Financial Crisis and about 4.7% in the period after it ( ). If we did not factor in the population growth during these periods, we would have neglected the welfare loss to the ASEAN people as a result of having to share the fruits of economic growth with a larger ASEAN population. After taking into account the declining population growth in ASEAN, GDP per capita growth rates are at about 4.8% and 3.3% respectively. These growth rates are obviously lower than the GDP growth rates, after controlled for the effect of population growth. 67
70 Table A2.1 - GDP Per Capita Growth and GDP Growth Compound Annual Compound Annual Growth Rate of Growth Rate of Real Real GDP per GDP (PPP) capita (PPP) ASEAN ASEAN ASEAN ASEAN ASEAN6b ASEAN6b Low income Low income Lower middle Lower middle income income Upper middle income Upper middle income High income High income East Asia & Pacific East Asia & Pacific countries countries OECD OECD World World Japan Japan Hong Kong, China Hong Kong, China Korea, Rep Korea, Rep China China India India United States United States Indonesia Indonesia Malaysia Malaysia Philippines Philippines Singapore Singapore Thailand Thailand Vietnam Vietnam South Africa South Africa Mexico Mexico Brazil Brazil Egypt, Arab Rep Egypt, Arab Rep *GDP and GDP per capita were expressed in PPP and constant 2000 international $ terms; no data for Brunei See notes under Table 26 for country composition of income groups and region. Source: World Bank World Development Indicators Online, accessed in March
71 Table A2.2 - Population Growth Population, CAGR ASEAN ASEAN ASEAN6b Lower middle income countries Low & middle income countries East Asia & Pacific countr ies High income: OECD World Japan Hong Kong, China Korea, Rep China India United States Indonesia Malaysia Philippines Singapore Thailand Vietnam South Africa Mexico Brazil Egypt, Arab Rep

72 Figure A2.1 GDP, Population and GDP Per Capita Growth Rates of ASEAN, *GDP and GDP per capita were expressed in PPP and constant 2000 international $ terms; no data for Brunei Source: World Bank World Development Indicators Online, accessed in March
Turning Trade Opportunities and Challenges into Trade: Implications for ASEAN Countries
 Turning Trade Opportunities and Challenges into Trade: Implications for ASEAN Countries Dr. Ponciano Intal, Jr The OECD-WB Global Forum on Globalization, Comparative Advantage and Trade Policy Chengdu,
SECTION THREE BENEFITS OF THE JSEPA
 SECTION THREE BENEFITS OF THE JSEPA 1. Section Two described the possible scope of the JSEPA and elaborated on the benefits that could be derived from the proposed initiatives under the JSEPA. This section
Building an ASEAN Economic Community in the heart of East Asia By Dr Surin Pitsuwan, Secretary-General of ASEAN,
 Building an ASEAN Economic Community in the heart of East Asia By Dr Surin Pitsuwan, Secretary-General of ASEAN, Excellencies Ladies and Gentlemen 1. We are witnessing today how assisted by unprecedented
ASEAN 2015: OPPORTUNITIES AND CHALLENGES
 ASEAN 2015: OPPORTUNITIES AND CHALLENGES Dr. Wilfrido V. Villacorta Former Philippine Ambassador and Permanent Representative to ASEAN; Former Deputy Secretary-General of ASEAN PACU ASEAN 2015 SEMINAR,
THAILAND SYSTEMATIC COUNTRY DIAGNOSTIC Public Engagement
 THAILAND SYSTEMATIC COUNTRY DIAGNOSTIC Public Engagement March 2016 Contents 1. Objectives of the Engagement 2. Systematic Country Diagnostic (SCD) 3. Country Context 4. Growth Story 5. Poverty Story 6.
Charting Indonesia s Economy, 1H 2017
 Charting Indonesia s Economy, 1H 2017 Designed to help executives interpret economic numbers and incorporate them into company s planning. Publication Date: January 3 rd, 2017 Next Issue: To be published
Charting Singapore s Economy, 1H 2017
 Charting Singapore s Economy, 1H 2017 Designed to help executives interpret economic numbers and incorporate them into company s planning. Publication Date: January 3 rd, 2017 Next Issue: To be published
Has Globalization Helped or Hindered Economic Development? (EA)
") Has Globalization Helped or Hindered Economic Development? (EA) Most economists believe that globalization contributes to economic development by increasing trade and investment across borders. Economic
Has Globalization Helped or Hindered Economic Development? (EA) Most economists believe that globalization contributes to economic development by increasing trade and investment across borders. Economic
THE AEC PROGRESS, CHALLENGES AND PROSPECTS
 THE AEC PROGRESS, CHALLENGES AND PROSPECTS Siow Yue CHIA Singapore Institute of International Affairs Conference on Future of World Trading System: Asian Perspective ADBI-WTO, Geneva 11-12 March 2013 Drivers
Charting South Korea s Economy, 1H 2017
 Charting South Korea s Economy, 1H 2017 Designed to help executives interpret economic numbers and incorporate them into company s planning. Publication Date: January 3 rd, 2017 Next Issue: To be published
1.3. Rankings: imports, exports and overall trade volume Philippines trade with EU Member States Structure and trends by product
 Front Cover Contents 1 Overview 2 1. Trade Relations 1.1. Trade in goods: main trends 1.2. Trade in services 1.3. Rankings: imports, exports and overall trade volume 1.4. Comparison of EU-Philippines
Proliferation of FTAs in East Asia
 Proliferation of FTAs in East Asia Shujiro URATA Waseda University and RIETI April 8, 2005 Contents I. Introduction II. Regionalization in East Asia III. Recent Surge of FTAs in East Asia IV. The Factors
Charting Cambodia s Economy
 Charting Cambodia s Economy Designed to help executives catch up with the economy and incorporate macro impacts into company s planning. Annual subscription includes 2 semiannual issues published in June
Charting Australia s Economy
 Charting Australia s Economy Designed to help executives catch up with the economy and incorporate macro impacts into company s planning. Annual subscription includes 2 semiannual issues published in June
Trans-Pacific Trade and Investment Relations Region Is Key Driver of Global Economic Growth
 Trans-Pacific Trade and Investment Relations Region Is Key Driver of Global Economic Growth Background The Asia-Pacific region is a key driver of global economic growth, representing nearly half of the
INTRODUCTION The ASEAN Economic Community and Beyond
 1 INTRODUCTION The ASEAN Economic Community and Beyond The ten countries of Southeast Asia Brunei, Cambodia, Indonesia, Laos, Malaysia, Myanmar, the Philippines, Singapore, Thailand and Vietnam are achieving
Southeast Asian Economic Outlook With Perspectives on China and India, 2013
 Southeast Asian Economic Outlook With Perspectives on China and India, 2013 October 2012 I. What is the Outlook? First launched in 2010, the Southeast Asian Economic Outlook: With Perspectives on China
ASEAN: THE AEC IS HERE, FINALLY 2030: NOMINAL GDP USD TRILLION US CHINA EURO AREA ASEAN JAPAN UK $20.8 $34.6 IN IN
 14: NOMINAL GDP USD TRILLION US EURO AREA CHINA JAPAN UK $2.9 $4.6 : THE AEC IS HERE, FINALLY $1.4 $13.4 $17.4 3: NOMINAL GDP USD TRILLION US CHINA EURO AREA JAPAN UK $6.8 $6.4 $8.5 $.8 $34.6 $33.6 $2.5
Globalisation and Open Markets
 Wolfgang LEHMACHER Globalisation and Open Markets July 2009 What is Globalisation? Globalisation is a process of increasing global integration, which has had a large number of positive effects for nations
Shifting the balance of global economic power: The Sinosphere in ascension towards dominance
 Shifting the balance of global economic power: The Sinosphere in ascension towards dominance Sierra Rayne a,, Kaya Forest b a Chemologica Research, 318 Rose Street, PO Box 74, Mortlach, Saskatchewan, Canada,
SINO-ASEAN ECONOMIC INTEGRATION AND ITS IMPACT ON INTRA-ASEAN TRADE
 SINO-ASEAN ECONOMIC INTEGRATION AND ITS IMPACT ON INTRA-ASEAN TRADE Sarah Y. TONG & LIM Tin Seng EAI Working Paper No. 144 ISSN 219-1318 ISBN 978-981-8-2359-7 All rights reserved Date of Publication: 8
Chapter 5: Internationalization & Industrialization
 Chapter 5: Internationalization & Industrialization Chapter 5: Internationalization & Industrialization... 1 5.1 THEORY OF INVESTMENT... 4 5.2 AN OPEN ECONOMY: IMPORT-EXPORT-LED GROWTH MODEL... 6 5.3 FOREIGN
Understanding AEC : Implication for Thai Business MRS. SRIRAT RASTAPANA
 Understanding AEC : Implication for Thai Business MRS. SRIRAT RASTAPANA Director-General Department of Trade Negotiations April 20, 2011 Outline of Presentation 1. Thailand vs. ASEAN 2. Development on
EXECUTIVE SUMMARY. Shuji Uchikawa
 EXECUTIVE SUMMARY Shuji Uchikawa ASEAN member countries agreed to establish the ASEAN Economic Community by 2015 and transform ASEAN into a region with free movement of goods, services, investment, skilled
ASEAN in the Global Economy An Enhanced Economic and Political Role
 ASEAN in the Global Economy An Enhanced Economic and Political Role By Anita Prakash & Ikumo Isono 1. The Growth of ASEAN as a Major Economic Group 2. ASEAN Economic Community (AEC) as a Hub of Services
GDP Per Capita. Constant 2000 US$
 GDP Per Capita Constant 2000 US$ Country US$ Japan 38,609 United States 36,655 United Kingdom 26,363 Canada 24,688 Germany 23,705 France 23,432 Mexico 5,968 Russian Federation 2,286 China 1,323 India 538
Southeast Asian Economic Outlook: With Perspectives on China and India Thematic focus: Narrowing development gaps 2013 edition
 Southeast Asian Economic Outlook: With Perspectives on China and India Thematic focus: Narrowing development gaps 2013 edition November 2012, Bangkok, Thailand Kensuke Tanaka Head of Asia Desk OECD Development
TOWARDS AN ASEAN ECONOMIC COMMUNITY: THE CHALLENGES AHEAD
 TOWARDS AN ECONOMIC COMMUNITY: THE CHALLENGES AHEAD Dr. Poppy S. WINANTI Universitas Gadjah Mada, Indonesia Abstract s ambition to accelerate regional trade liberalisation has been strengthened by the
Free Trade Vision for East Asia
 CEAC Commentary introduces outstanding news analyses and noteworthy opinions in Japan, but it does not represent the views of CEAC as an institution. April 28, 2005 Free Trade Vision for East Asia By MATSUDA
Charting Philippines Economy, 1H 2017
 Charting Philippines Economy, 1H 2017 Designed to help executives interpret economic numbers and incorporate them into company s planning. Publication Date: January 3 rd, 2017 Next Issue: To be published
Economic Trends Across the Asia Pacific Region. Pansy Yau Deputy Director of Research
 Economic Trends Across the Asia Pacific Region Pansy Yau Deputy Director of Research 2 Rebalancing of the World Economy % 70.00 65.00 60.00 55.00 50.00 45.00 40.00 35.00 Share of world total GDP (PPP)
VIETNAM FOCUS. The Next Growth Story In Asia?
 The Next Growth Story In Asia? Vietnam s economic policy has dramatically transformed the nation since 9, spurring fast economic and social development. Consequently, Vietnam s economy took off booming
UNDERSTANDING TRADE, DEVELOPMENT, AND POVERTY REDUCTION
 ` UNDERSTANDING TRADE, DEVELOPMENT, AND POVERTY REDUCTION ECONOMIC INSTITUTE of CAMBODIA What Does This Handbook Talk About? Introduction Defining Trade Defining Development Defining Poverty Reduction
ARANGKADA PHILIPPINES 2010: A BUSINESS PERSPECTIVE. Figure 10: Share in world GDP,
 Living in the High Growth Neighborhood The Philippines is located in the world s fastest growing region. Figure 10 shows that the ASEAN-6 plus 4 (China, India, Japan, and Korea) in 2009 had about the same
Globalization GLOBALIZATION REGIONAL TABLES. Introduction. Key Trends. Key Indicators for Asia and the Pacific 2009
 GLOBALIZATION 217 Globalization The People s Republic of China (PRC) has by far the biggest share of merchandise exports in the region and has replaced Japan as the top exporter. The largest part of Asia
Hinrich Foundation Sustainable Trade Index Country overview: Vietnam
 Hinrich Foundation Sustainable Trade Index Country overview: Vietnam Vietnam ranks 11 th on inaugural Hinrich Foundation Sustainable Trade Index The country over-performs its level of per capita GDP. The
Towards ASEAN Economic Community 2025!
 ISSN 2335-6677 #43 2013 RESEARCHERS AT SINGAPORE S INSTITUTE OF SOUTHEAST ASIAN STUDIES SHARE THEIR UNDERSTANDING OF CURRENT EVENTS Singapore 8 Jul 2013 Towards ASEAN Economic Community 2025! By Sanchita
ASEAN WHAT IS ASEAN? A regional grouping that promotes economic, political and security cooperation among its member states.
 ASEAN Instructor: Professor Matthieu CROZET Presented by: Tionardy Giovanni WEN, Chan-Chun Tu, Chang-Chieh WHAT IS ASEAN? A regional grouping that promotes economic, political and security cooperation
Employment opportunities and challenges in an increasingly integrated Asia and the Pacific
 Employment opportunities and challenges in an increasingly integrated Asia and the Pacific KEIS/WAPES Training on Dual Education System and Career Guidance Kee Beom Kim Employment Specialist ILO Bangkok
HAS GROWTH PEAKED? 2018 growth forecasts revised upwards as broad-based recovery continues
 HAS GROWTH PEAKED? 2018 growth forecasts revised upwards as broad-based recovery continues Regional Economic Prospects May 2018 Stronger growth momentum: Growth in Q3 2017 was the strongest since Q3 2011
TRADE FACILITATION: Development Perspectives and Approaches of ASEAN in presented by
 TRADE FACILITATION: Development Perspectives and Approaches of ASEAN in 2004 presented by Noordin Azhari Director, Bureau for Economic Integration ASEAN Secretariat at the Seminar on Trade Facilitation
Indonesia and The Implementation of ASEAN Economic Community
 Indonesia and The Implementation of ASEAN Economic Community International Business Management Esther Kezia Simanjuntak 3099190 ABSTRACT Asean Economic Community (AEC) 2015 is a free market realization
The Nanning-Singapore Economic Corridor:
 The Nanning-Singapore Economic Corridor: Challenges for China and ASEAN John WONG* To compete for GDP growth, many provinces and loccalities in China are developing their own going out strategies. Yunnan
Trends in inequality worldwide (Gini coefficients)
") Section 2 Impact of trade on income inequality As described above, it has been theoretically and empirically proved that the progress of globalization as represented by trade brings benefits in the form
Section 2 Impact of trade on income inequality As described above, it has been theoretically and empirically proved that the progress of globalization as represented by trade brings benefits in the form
International Business Global Edition
 International Business Global Edition By Charles W.L. Hill (adapted for LIUC2016 by R.Helg) Copyright 2013 by The McGraw-Hill Companies, Inc. All rights reserved. Chapter 9 Regional Economic Integration
ASEAN. Overview ASSOCIATION OF SOUTHEAST ASIAN NATIONS
 ASEAN Overview ASSOCIATION OF SOUTHEAST ASIAN NATIONS "Today, ASEAN is not only a well-functioning, indispensable reality in the region. It is a real force to be reckoned with far beyond the region. It
To be opened on receipt
 Oxford Cambridge and RSA To be opened on receipt A2 GCE ECONOMICS F585/01/SM The Global Economy STIMULUS MATERIAL *6373303001* JUNE 2016 INSTRUCTIONS TO CANDIDATES This copy must not be taken into the
Economic Development: Miracle, Crisis and Regionalism
 Economic Development: Miracle, Crisis and Regionalism Min Shu School of International Liberal Studies Waseda University 18 Dec 2017 IR of Southeast Asia 1 Outline of the Lecture Southeast Asian economies
ASEAN5 s economies have held up very well despite the global economic down turn, with domestic spending as the main driver.
 ASEAN5 s economies have held up very well despite the global economic down turn, with domestic spending as the main driver. Average GDP growth 2009-2012 Unit: %YOY 7 6 5 4 3 2 1 0 Contributions of GDP
ASEAN Cooperation on Trade in Health Services. Prince Mahidol Award Conference 2008
 ASEAN Cooperation on Trade in Health Services Prince Mahidol Award Conference 2008 30 January - 1 February 2008 Bangkok Prepared by Dr. Bounpheng Philavong, ASEAN Secretariat Outline of presentation An
Keynote Speech by H.E. Le Luong Minh Secretary-General of ASEAN at the ASEAN Insights Conference 11 September 2014, London
 Keynote Speech by H.E. Le Luong Minh Secretary-General of ASEAN at the ASEAN Insights Conference 11 September 2014, London Mr Michael Lawrence, Chief Executive, Asia House Excellencies, Distinguished Guests,
IIPS International Conference
 助成 Institute for International Policy Studies Tokyo IIPS International Conference Building a Regime of Regional Cooperation in East Asia and the Role which Japan Can Play Tokyo December 2-3, 2003 Potential
Mizuho Economic Outlook & Analysis
 Mizuho Economic Outlook & Analysis The 18th Questionnaire Survey of Japanese Corporate Enterprises Regarding Business in Asia (February 18) - Japanese Firms Reevaluate China as a Destination for Business
Asia-Pacific to comprise two-thirds of global middle class by 2030, Report says
 Strictly embargoed until 14 March 2013, 12:00 PM EDT (New York), 4:00 PM GMT (London) Asia-Pacific to comprise two-thirds of global middle class by 2030, Report says 2013 Human Development Report says
5 th International Federation of Surveyors Regional Conference for Africa
 5 th International Federation of Surveyors Regional Conference for Africa 5 th International Federation of Surveyors Regional Conference for Africa Promoting Land Administration and Good Governance Implementing
Creating an enabling business environment in Asia: To what extent is public support warranted?
 Creating an enabling business environment in Asia: To what extent is public support warranted? Tilman Altenburg, Christian von Drachenfels German Development Institute, Bonn Bangkok, 28 December 2006 1
Population. C.4. Research and development. In the Asian and Pacific region, China and Japan have the largest expenditures on R&D.
 Statistical Yearbook for Asia and the Pacific 2013 C. Education and knowledge C.4. (R&D) is a critical element in the transition towards a knowledgebased economy. It also contributes to increased productivity,
Chapter 11. Trade Policy in Developing Countries
 Chapter 11 Trade Policy in Developing Countries Preview Import-substituting industrialization Trade liberalization since 1985 Trade and growth: Takeoff in Asia Copyright 2015 Pearson Education, Inc. All
Report. This version available at: Originally available from LSE IDEAS. Available in LSE Research Online: May 2012
 Dionisius A. Narjoko and Teguh Y. Wicaksono ASEAN: perspectives on economic integration: achieving the ASEAN Economic Community agenda: an Indonesian perspective Report Original citation: Narjoko, Dionisius
Hinrich Foundation Sustainable Trade Index Country overview: Thailand
 Hinrich Foundation Sustainable Trade Index Country overview: Thailand Thailand ranks 8 th on inaugural Hinrich Foundation Sustainable Trade Index The country over-performs its level of per capita GDP and
External Partners in ASEAN Community Building: Their Significance and Complementarities
 External Partners in ASEAN Community Building: Their Significance and Complementarities Pushpa Thambipillai An earlier version of this paper was presented at the ASEAN 40th Anniversary Conference, Ideas
ASEAN Integration & ICT Opportunities. Mark Hefner
 ASEAN Integration & ICT Opportunities Mark Hefner Contents Some ICT Information ASEAN Introduction AEC Introduction ICT & ASEAN Integration International Business International Trade Rules ASEAN Framework
AFTA as Real Free trade Area
 1 Executive Summary AFTA as Real Free trade Area Submitted to Department of Business Economics Ministry of Commerce By Kwanjai Sothitorn Nualnoi Pongsa Arunsmith Mallikamas Treerat Pornchaiwiseskul January
WORLD ECONOMIC EXPANSION in the first half of the 1960's has
 Chapter 5 Growth and Balance in the World Economy WORLD ECONOMIC EXPANSION in the first half of the 1960's has been sustained and rapid. The pace has probably been surpassed only during the period of recovery
HOW ECONOMIES GROW AND DEVELOP Macroeconomics In Context (Goodwin, et al.)
") Chapter 17 HOW ECONOMIES GROW AND DEVELOP Macroeconomics In Context (Goodwin, et al.) Chapter Overview This chapter presents material on economic growth, such as the theory behind it, how it is calculated,
Chapter 17 HOW ECONOMIES GROW AND DEVELOP Macroeconomics In Context (Goodwin, et al.) Chapter Overview This chapter presents material on economic growth, such as the theory behind it, how it is calculated,
Japan s Policy to Strengthen Economic Partnership. November 2003
 Japan s Policy to Strengthen Economic Partnership November 2003 1. Basic Structure of Japan s External Economic Policy -Promoting Economic Partnership Agreements with closely related countries and regions
Mega-Regionalism in Asia: 5 Economic Implications
 Mega-Regionalism in Asia: 5 Economic Implications Ganeshan Wignaraja Advisor, Economic Research and Regional Cooperation Department, Asian Development Bank gwignaraja@adb.org London October 16, 2015 Selected
ASEAN-INDIA STRATEGIC PARTNERSHIP AND DESIGN OF FUTURE REGIONAL TRADING ARCHITECTURE
 AIFTA ASEAN-INDIA STRATEGIC PARTNERSHIP AND DESIGN OF FUTURE REGIONAL TRADING ARCHITECTURE Agus Syarip Hidayat Economic Research Center, Indonesian Institute of Sciences (LIPI) Roundtable ASEAN-India Network
Test Bank for Economic Development. 12th Edition by Todaro and Smith
 Test Bank for Economic Development 12th Edition by Todaro and Smith Link download full: https://digitalcontentmarket.org/download/test-bankfor-economic-development-12th-edition-by-todaro Chapter 2 Comparative
Survey on International Operations of Japanese Firms (FY2007)
") on International Operations of Japanese Firms () March 26 (JETRO) Contents I. outline; profile of respondent firms 3 China now the top site for overseas R&D bases 4 5 (1) More plan overseas than domestic
on International Operations of Japanese Firms () March 26 (JETRO) Contents I. outline; profile of respondent firms 3 China now the top site for overseas R&D bases 4 5 (1) More plan overseas than domestic
The Asian Development Bank. Transportation Infrastructure in Asia and the Pacific
 The Transportation Infrastructure in Asia and the Pacific NCSL Legislative Summit July 22-26, 2008 New Orleans, Louisiana Transportation Committee North American Representative Office (ADB) July 2008 1
General Assembly Twenty-second session Chengdu, China, September 2017 Provisional agenda item 4
 General Assembly Twenty-second session Chengdu, China, 11-16 September 2017 Provisional agenda item 4 A/22/4 Madrid, 9 September 2017 Original: English Statement by the Secretary-General I. Tourism at
China ASEAN Relations: Opportunities and Challenges for Development
 Rising Powers Workshop 1 Beijing, 15-16 July 2010 China ASEAN Relations: Opportunities and Challenges for Development Prof. Dr. Dang Nguyen Anh Vietnam Academy of Social Sciences (VASS) ASEAN The Association
HIGHLIGHTS. There is a clear trend in the OECD area towards. which is reflected in the economic and innovative performance of certain OECD countries.
 HIGHLIGHTS The ability to create, distribute and exploit knowledge is increasingly central to competitive advantage, wealth creation and better standards of living. The STI Scoreboard 2001 presents the
ASEAN and the EU. Political dialogue and security cooperation. Working closely for 40 years. Wednesday, 11 May, :22
 Wednesday, 11 May, 2016-14:22 ASEAN and the EU The EU and ASEAN have a dynamic partnership in a number of areas, from political dialogue, cooperation in non-traditional security areas, trade and investment
THE RECENT TREND OF ROMANIA S INTERNATIONAL TRADE IN GOODS
 THE RECENT TREND OF ROMANIA S INTERNATIONAL TRADE IN GOODS Andrei Cristian Balasan * Abstract: The article analyses the recent developments regarding the Romania trade in goods. We highlight how Romania
HIGHLIGHTS. Part I. Sustainable Development Goals. People
 xxix HIGHLIGHTS Part I. Sustainable Development Goals The Millennium Development Goals (MDGs) had shaped development policies around the world with specific, time-bound, and quantifiable targets since
REFERENCE NOTE. No.5/RN/Ref./March/2018 INDIA AND ASEAN
 MEMBERS REFERENCE SERVICE LARRDIS LOK SABHA SECRETARIAT NEW DELHI REFERENCE NOTE For the use of Members of Parliament NOT FOR PUBLICATION No.5/RN/Ref./March/2018 INDIA AND ASEAN Prepared by Smt. Neelam
Prospects for future economic cooperation between China and Belt & Road countries
 www.pwccn.com Prospects for future economic cooperation between China and Belt & Road countries Top ten Belt & Road (B&R) economies account for 64% of overall GDP of B&R countries Content 1 Overview of
1.1. Trade in goods: main trends Rankings: imports, exports and overall trade volume Philippines trade with EU Member States
 Front Cover Contents Message from the EU Trade Commissioner 2 Overview 3 1. Trade Relations 1.1. Trade in goods: main trends 1.2. Trade in services 1.3. Rankings: imports, exports and overall trade volume
Integrating the Mekong Region into ASEAN. Chia Siow Yue. Singapore Institute of International Affairs
 1 Integrating the Mekong Region into ASEAN Chia Siow Yue Singapore Institute of International Affairs chiasy@singnet.com.sg Paper for presentation at the Seminar on Accelerating Development in the Mekong
EABER WORKING PAPER SERIES
 EAST ASIAN BUREAU OF ECONOMIC RESEARCH EABER WORKING PAPER SERIES PAPER NO.49 GLOBAL FINANCIAL CRISIS: IMPACT ON SINGAPORE AND ASEAN SHANDRE M THANGAVELU CRAWFORD SCHOOL OF ECONOMICS AND GOVERNMENT AND
International Business
 International Business 10e By Charles W.L. Hill Copyright 2015 McGraw-Hill Education. All rights reserved. No reproduction or distribution without the prior written consent of McGraw-Hill Education. Chapter
Cambodia During Economic Integration Issues and Challenges
 Cambodia During Economic Integration Issues and Challenges February 2007 Neou Seiha EIC Researcher 1 Contents 1. Evolution Cambodian Trade Policy 2. Cambodian Economic Situation during Integration 3. Challenges
Full file at
 Chapter 2 Comparative Economic Development Key Concepts In the new edition, Chapter 2 serves to further examine the extreme contrasts not only between developed and developing countries, but also between
Trade Facilitation and Better Connectivity for an Inclusive Asia and Pacific
 Trade Facilitation and Better Connectivity for an Inclusive Asia and Pacific Highlights Trade Facilitation and Better Connectivity for an Inclusive Asia and Pacific Highlights Creative Commons Attribution
Inclusive Growth: Challenges For The East Asia Region
 Inclusive Growth: Challenges For The East Asia Region ADFIAP International CEO Forum XI New World Makati Hotel, Makati City, Dec 8, 2015 Rogier van den Brink Lead Economist and Program Leader World Bank
strategic asia asia s rising power Ashley J. Tellis, Andrew Marble, and Travis Tanner Economic Performance
 strategic asia 2010 11 asia s rising power and America s Continued Purpose Edited by Ashley J. Tellis, Andrew Marble, and Travis Tanner Economic Performance Asia and the World Economy in 2030: Growth,
Hinrich Foundation Sustainable Trade Index Country overview: Indonesia
 Hinrich Foundation Sustainable Trade Index Country overview: Indonesia Indonesia ranks 14 th on inaugural Hinrich Foundation Sustainable Trade Index The country embarks on a development strategy to move
The Comparative Advantage of Nations: Shifting Trends and Policy Implications
 The Comparative Advantage of Nations: Shifting Trends and Policy Implications The Nobel Prize-winning economist Paul Samuelson once famously argued that comparative advantage was the clearest example of
China and India:Convergence and Divergence
 China and India:Convergence and Divergence I. "What China is good at, India is not and vice versa. The countries are inverted mirror of each other».. «very real possibility that China and India will in
PRESS STATEMENT. BY THE CHAIRPERSON OF THE 9th ASEAN SUMMIT AND THE 7th ASEAN + 3 SUMMIT BALI, INDONESIA, 7 OCTOBER 2003
 PRESS STATEMENT BY THE CHAIRPERSON OF THE 9th ASEAN SUMMIT AND THE 7th ASEAN + 3 SUMMIT BALI, INDONESIA, 7 OCTOBER 2003 1. ASEAN leaders held a very productive meeting this morning following a working
Seminar on Trade Facilitation in East Asia November 2004, Shanghai, China
 Seminar on Trade Facilitation in East Asia November 2004, Shanghai, China TRADE FACILITATION: Development Perspectives and Approaches of ASEAN in 2004 Presentation by Noordin Azhari Director, Bureau for
Charting Singapore s Economy, 1Q 2016 Publication Date: December 8 th, 2015 Number of pages: 58
 Charting Singapore s Economy, 1Q 2016 Publication Date: December 8 th, 2015 Number of pages: 58 Attribution-NonCommercial-NoDerivatives 4.0 International (CC BY-NC-ND 4.0) You are free to: Share copy and
Hinrich Foundation Sustainable Trade Index Country overview: Singapore
 Hinrich Foundation Sustainable Trade Index Country overview: Singapore Singapore ranks 1 st on inaugural Hinrich Foundation Sustainable Trade Index The country scores best on the economic pillar and ranks
NBER WORKING PAPER SERIES THE TRADE PERFORMANCE OF ASIAN ECONOMIES DURING AND FOLLOWING THE 2008 FINANCIAL CRISIS. Jing Wang John Whalley
 NBER WORKING PAPER SERIES THE TRADE PERFORMANCE OF ASIAN ECONOMIES DURING AND FOLLOWING THE 2008 FINANCIAL CRISIS Jing Wang John Whalley Working Paper 16142 http://www.nber.org/papers/w16142 NATIONAL BUREAU
Statistical Yearbook. for Asia and the Pacific
 Statistical Yearbook for Asia and the Pacific 2015 Statistical Yearbook for Asia and the Pacific 2015 Sustainable Development Goal 1 End poverty in all its forms everywhere 1.1 Poverty trends...1 1.2 Data
Mega-regionalism and Developing Countries
 Mega-regionalism and Developing Countries Michael G. Plummer, Director, SAIS Europe, and Eni Professor of International Economics, Johns Hopkins University Presentation to Lee Kuan Yew School of Public
LABOUR AND EMPLOYMENT
 5 LABOUR AND EMPLOYMENT The labour force constitutes a key resource that is vital in the growth and development of countries. An overarching principle that guides interventions affecting the sector aims
Vietnam: The Political Economy of the Middle Income Trap
 Sum of Percentiles World Bank Governance Indicators 2011 Vietnam: The Political Economy of the Middle Income Trap Background There is a phrase used by political economists more than economists the middle