WORKING PAPER 00/07 INTERNAL MIGRATION AND REGIONAL POPULATION DYNAMICS IN EUROPE: FINLAND CASE STUDY
|
|
|
- Timothy Harrison
- 6 years ago
- Views:
Transcription
1 WORKING PAPER 00/07 INTERNAL MIGRATION AND REGIONAL POPULATION DYNAMICS IN EUROPE: FINLAND CASE STUDY Marek Kupiszewski 1,2 Elli Heikkilä 3 Mauri Nieminen 4 Helen Durham 1 Philip Rees 1 Dorota Kupiszewska 5 1 School of Geography The University of Leeds Leeds LS2 9JT, UK 2 Institute of Geography and Spatial Organisation Polish Academy of Sciences Twarda 51/ Warsaw, Poland 3 Institute of Migration Piispankatu Turku Finland 4 Statistics Finland, Tilastokeskus, FIN Statistics Finland Finland 5 Wiejska 9 m Warszawa, Poland PUBLISHED NOVEMBER 2000 ALL RIGHTS RESERVED For further copies contact the Working Paper Secretary, School of Geography, University of Leeds, Leeds LS2 9JT Telephone
2 ii
3 CONTENTS Page LIST OF TABLES LIST OF FIGURES ACKNOWLEDGMENTS ABSTRACT v v vi vii 1. CONTEXT 1 2. INTERNAL MIGRATION AND POPULATION CHANGE REVIEWED 2 3. METHODS USED AND DATA EMPLOYED Geographical scale, geographical units and variables used Mapping techniques and problems Variables and key indicators used Population and population change data Migration Births and deaths Population density Size class of communes Functional classification of communes Unemployment THE PATTERN OF INTERNAL MIGRATION BETWEEN SUBREGIONS 13 THROUGH THE LIFE COURSE, 1984 AND In-migration patterns In-migration in the adolescent and young adult ages In-migration in the family and older labour force ages In-migration in the retirement and elderly ages Out-migration patterns Out-migration in the adolescent and young adult ages Out-migration in the family and older labour force ages Out-migration in the retirement and elderly ages Net migration patterns Net migration in the adolescent and young adult ages Net migration in the family and older labour force ages Net migration in the retirement and elderly ages 27 iii
4 5. POPULATION CHANGE AND MIGRATION BY MUNICIPALITY Population change in Finland by communes In-migration patterns by municipality 1984 and Out-migration patterns by municipality 1984 and Net migration patterns by municipality 1984 and The demographic sources of population change The consequences of migration: sex structure deformation RELATIONSHIP TO THE URBAN SYSTEM Relationship to settlement size Relationship to population density Relationship to municipality type Relationship of migration to the degree of rurality RELATIONSHIP OF MIGRATION TO UNEMPLOYMENT SUMMARY AND CONCLUSIONS 53 BIBLIOGRAPHY 55 Page iv
5 LIST OF TABLES Page 1: The distribution of sub-regions by in-migration rate band for broad age groups, 17 Finland, 1984 and : The distribution of sub-regions by out-migration rate band for broad age groups, 22 Finland, 1984 and : The distribution of sub-regions by net migration rate band for broad age groups, 26 Finland, 1984 and : Types of population change in Finland in : Net migration and migration effectiveness by population size bands, Finland, : Net migration and migration effectiveness by population density bands, Finland, : Net migration and migration effectiveness by the degree of urbanisation, Finland, : Net migration and migration effectiveness by the type of rural areas, Finland, : Net migration and migration effectiveness by unemployment bands, Finland, LIST OF FIGURES 1: The regions and sub-regions of Finland, 1998 boundaries 8 2: The municipalities of Finland, 1998 boundaries 9 3: In-migration rates by sub-regions, Finland, : In-migration rates by sub-regions, Finland, : Out-migration rates by sub-regions, Finland, : Out-migration rates by sub-regions, Finland, : Net migration rates by sub-regions, Finland, : Net migration rates by sub-regions, Finland, : Population change by municipality, Finland, : In-migration rates by municipality, Finland, 1984 and : Out-migration rates by municipality, Finland, 1984 and : Net migration rates by municipality, Finland, 1984 and : The Webb classification of Finnish municipalities, : Females per 100 males by municipality, all ages, Finland, : Females per 100 males by municipality, by broad ages, Finland, : Population density by municipality, Finland, : A classification of municipalities by the degree of urbanisation, Finland, : A classification of municipalities by the type of rural areas, Finland, : Unemployment rates by municipalities, Finland, v
6 ACKNOWLEDGMENTS This Report was financed through research award R from the Economic and Social Research Council on Internal Migration and Population Change in Europe: a Comparative Study with support of the Council of Europe (Directorate of Social and Economic Affairs, Population and Migration Division). The authors are very grateful to Statistics Finland and Mr Heikki Keranen of the Research and Development Centre of Kajaani of the University of Oulu, who made available to us all data used in this study. vi
7 ABSTRACT Both natural increase and internal migration have played roles in the shaping of population distribution of Finland since Far reaching recent changes in the economy have brought about massive shift of jobs from agriculture to manufacturing and services. As a result people have relocated from rural to urban areas. Both natural change and net migration have distinct geographical patterns, resulting in serious depopulation in remote areas in the east and north of the country. Internal migration benefits the south, the west, coastal areas, urban agglomerations and suburban areas. International migration is a marginal phenomenon in Finland and has little impact on population dynamics. Net migration losses in the past were offset by high natural increase and in recent decades Finnish emigrants have returned. Urban concentration is a dominant feature of the Finnish migration system. At the subregional level, suburbanisation is visible, but is not as strong as in the overcrowded metropolises of Western Europe. The relationships between migration and size of municipality, migration and population density and migration and urban/rural class of municipalities show that the process of concentration is the strongest force at work in shifting people to urban agglomerations and their suburban rings. Regional patterns of migration show strong transfers of population from north and east to south and to lesser extent to west of the country. The Baltic Sea coast has a strong attraction to migrants. Migration is sex-selective, with a much higher propensity of females to leave remote and rural areas and migrate to urban centres and the southern part of the country. The result is a significant gender imbalance: a deficiency of females in rural areas and in the north and east of the country and a surplus in urban and semi-urban areas. However, the economic indicator unemployment has a rather weak and imprecise effect on migrants. vii
8 1. CONTEXT This study funded by a research grant of the Economic and Social Research Council Internal Migration and Population Change in Europe. A Comparative Study and constitutes a continuation of a research project on Internal Migration and Regional Population Dynamics in Europe commissioned to the School of Geography of the University of Leeds by the Council of Europe and the European Commission over the period Within the ESRC project ten countries evenly distributed across Europe are being studied, adding to earlier ten case studies completed within the Council of Europe and the European Commission funded project, providing in total 20 case studies based on a unified methodology and carrying out a spatial analysis in each country. The analyses are designed to be as comparable as possible, keeping in mind differences in how migration is defined and operational differences in how migration data are being acquired by National Statistical Offices. The aims of this study are: + to compare the patterns of internal migration and population change in Finland in the 1980s (using data for 1984) and the 1990s (using data for 1996) + to examine the way in which these patterns differ between different life course stages, again comparing 1984 and to establish the contribution of internal migration to regional population change against the contributions of external migration and natural change + to review how internal migration is structured in terms of the spatial organisation of the country using classifications relating to settlement size, population density, municipality type and degree of rurality
9 + to assess, from this analysis, the degree to which internal migration is contributing concentration or deconcentration, and whether deconcentration is merely suburbanisation unit large (periurbanisation) or represents a return to scattered rural settlements, and + to ascertain the degree to which internal migration is responsive to economic labour market conditions, as tracked by the level of unemployment. The focus of attention in this case study, as in the others, is migration internal to the country. Comparisons across European countries in the levels and structure of internal migration at a fine spatial scale are needed because previous work has focussed on the total population change or total net migration (which includes the balance of international migration), and usually for large regional divisions which hide the complexities of settlement structure. 2
10 2. INTERNAL MIGRATION AND POPULATION CHANGE REVIEWED Finland is, in terms of the population size, one of Europe s smaller states. Her territory is extensive (338,145 sq.km.), sparsely populated, with a long coast line and numerous inland lakes. Richly endowed in natural resources (timber, non-ferrous metals) Finland s economy relied on them the past. However, in recent decades it has experienced profound changes, developing an industrial base in metal and shipbuilding industries, but also poineering in high technology industries and services. The success is well known of Finland s largest company by value, NOKIA, which leads the world in inventing and developing wireless telephony ( mobile phones ). This economic shift resulted in an extensive occupational restructuring of Finnish society. Between 1950 and 1996 population of Finland increased from 4.03 millions to 5.13 millions, that is by 27%. International migration has never made a decisive contribution to population change in Finland. Net migration losses or gains have oscillated over time around 1-2 persons per thousand. A major share of immigration and emigration came from and went to other Scandinavian countries, mainly to Sweden. Cultural differences between Scandinavian countries are small by world standards, which has facilitated population exchanges. The healthy population increase had two sources: high and stable fertility and decreasing mortality. Total fertility was well above 2 children per female up to 1970s and between 2 and 1.6 since then. Simultaneously, mortality decreased: life expectancy improved from 68.6 years for males and 65.9 years for females in 1950 to 72.8 and 80.2 years in A substantial contribution to this increase came from rapid improvement in infant mortality, which dropped from 43.5 per thousand live births in 1950 to 4.7 in However, the longevity increase (Martelin 1987) together with falling gently fertility did not allow Finland to escape the ageing process. Karjalainen (1993a:22) calculated that between 1950 and 1989 the share of the age group more than doubled and the share of population at the age 75 3
11 and over increased by over 2.5 times. The elderly population is located mostly in the southern half of the country with exception of largest urban centres on the south coast. One of the peculiarities of the Finnish spatial population system is its extremely unequal distribution. The Uusimaa region itself, containing capital Helsinki, accounts for around a quarter of the total population of the country but only 3% of its territory, whereas some distant communities are hardly inhabited at all. The municipality with the smallest population, Sottunga, has only 123 inhabitants. The Helsinki agglomeration (Helsinki, Espoo, Vantaa and Kauniainen) attracts migrants from all over the country (Valkonen, Summa 1985). Fast urbanisation partly contributed to this polarisation. In % of Finnish population was classified as urban. This indicator had increased to 68% in Average European values equalled to 52.4% and 73.5% respectively (Heilig 1997). Such a rapid urbanisation process required large scale population shifts from rural to urban areas. Age selective migration from rural areas had an inevitable negative impact on the age structure of rural population (Karjalainen 1993b) and reduced fertility (Karjalaninen 1991). The pattern of internal migration evolved substantially over time. The underlying reasons for the change in migration patterns were the shifts in the structure of Finnish economy and its transformation from a farming, forestry and fishing based economy to a manufacture and service based economy. After the first World War around 4/5 of the work force were employed in the primary sector. In the early 1960s around 1/3 of the employed worked in each of the sectors of economy (primary, secondary, tertiary). In the 1980s the share of employment in primary sector plummeted to well below 1/5 whereas the share in tertiary sector exceeded 50% (Kultalahti 1984). In % of labour force worked in agriculture and forestry, 28% in manufacturing and 65% in services (Statistics Finland). Kultalahti (1984) noted that the structural changes that in Finland took thirty years, took two centuries in Norway. These changes in the structure of economy and employment triggered 4
12 massive internal migration (Hietala 1981). Post-war rapid urbanisation fuelled migration from rural to urban areas. The share of rural to urban migration exceeded the share of migration in the opposite direction up to the early 1980s. Simultaneously the role of urban to urban migration increased and the role of rural to rural migration decreased (Heikkilä 1996). The increase in the share of urban to urban migration is linked to the process of suburbanisation where people migrate from large urban centres to smaller suburban settlements and periurban towns. Long lasting migration from rural and remote to urban areas led to depopulation of the former (Naukkarinen 1990). The rural population reached its maximum in the 1950s and has been declining since then. The most significant outflow from rural areas occurred in 1960s. The relocation of population occurred from the north and east towards the south and southeast (Alestalo 1983). Some municipalities lost over a half of its population (Kultalahti 1984). In the regions of population concentration at the regional scale a simultaneous process of deconcentration on subregional scale occurred (Naukkarinen 1981). This process started in the 1970s when urban areas exhibited negative net migration a sign of counterurbanisation. One consequence of rural depopulation was the acceleration of the ageing process in rural populations because of the exodus of young migrants (Naukkarinen 1990). International migration has played a limited role in the population dynamics of Finland. Traditionally the main destination and the main source of international migrants was Sweden. Over the period out of 705 thousand of emigrants moved to Sweden. Return migration from Sweden was a substantial part of international inflow to Finland (Korkiasaari, Söderling 1999). Up to the early 1970s Finland had nearly constant net outflow. In the decade of the 1970s the balance changed and from the early 1980s Finland has maintained a constant positive net international migration. Since the Second World War Finland has lost on balance 246 thousand persons due to international migration. Korkiasaari 5
13 (1993) estimates that without emigration the Finnish population would have reached from 6 to 7 millions, compared with its 1996 level of 5 millions. In 1980s a significant change in the structure of international migration occurred: migration to and from Sweden and other Nordic countries decreased and the inflow of migrants from Central Europe and since 1989 from former Soviet Union increased. The number of asylum seekers increased in early 1990s, but stricter policies reduced this flow in recent years. In comparison with other European countries international migration had a restricted impact on population growth in Finland in the last fifty years. Large scale return migration of Finns effectively reduced the migration-induced losses of population. The inflow of foreigners, both migrants and asylum seekers, to Finland was low in comparison to the inflow to other European countries as the share of foreign-born in the national population is low. 6
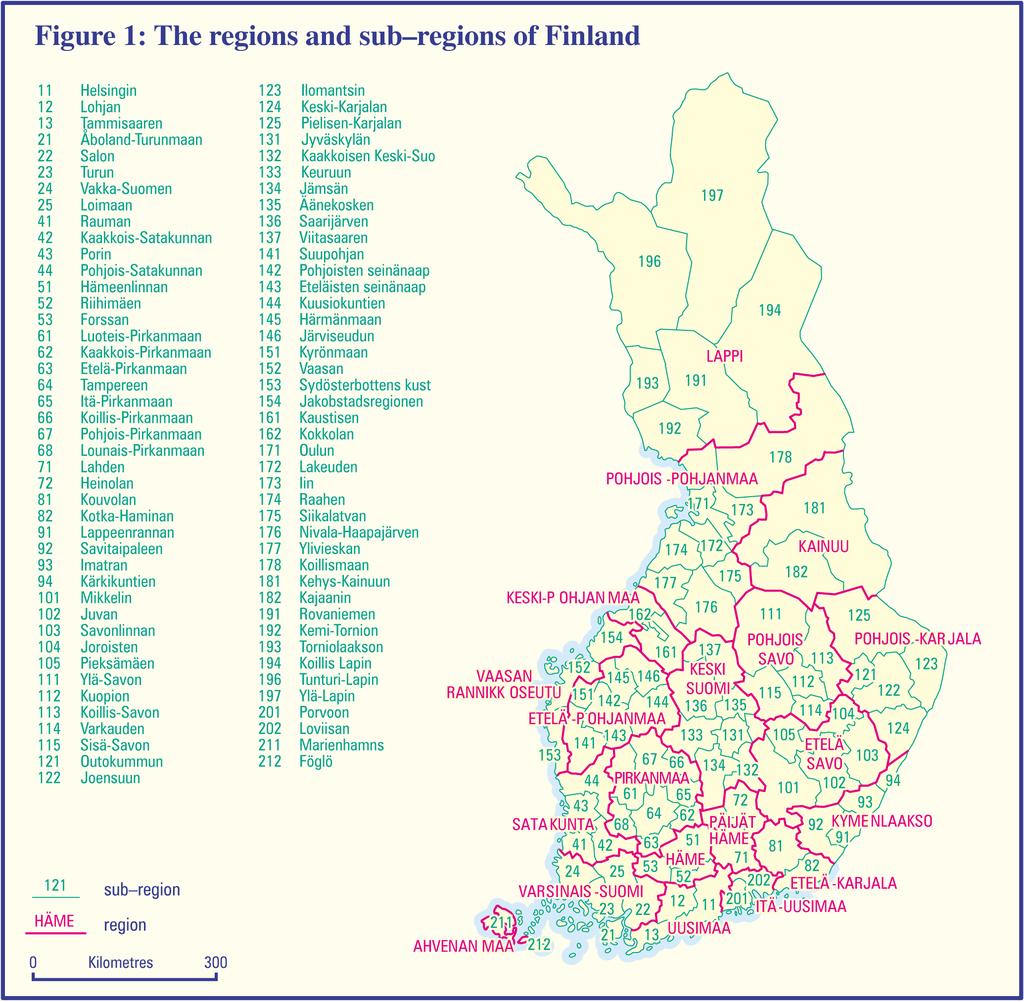
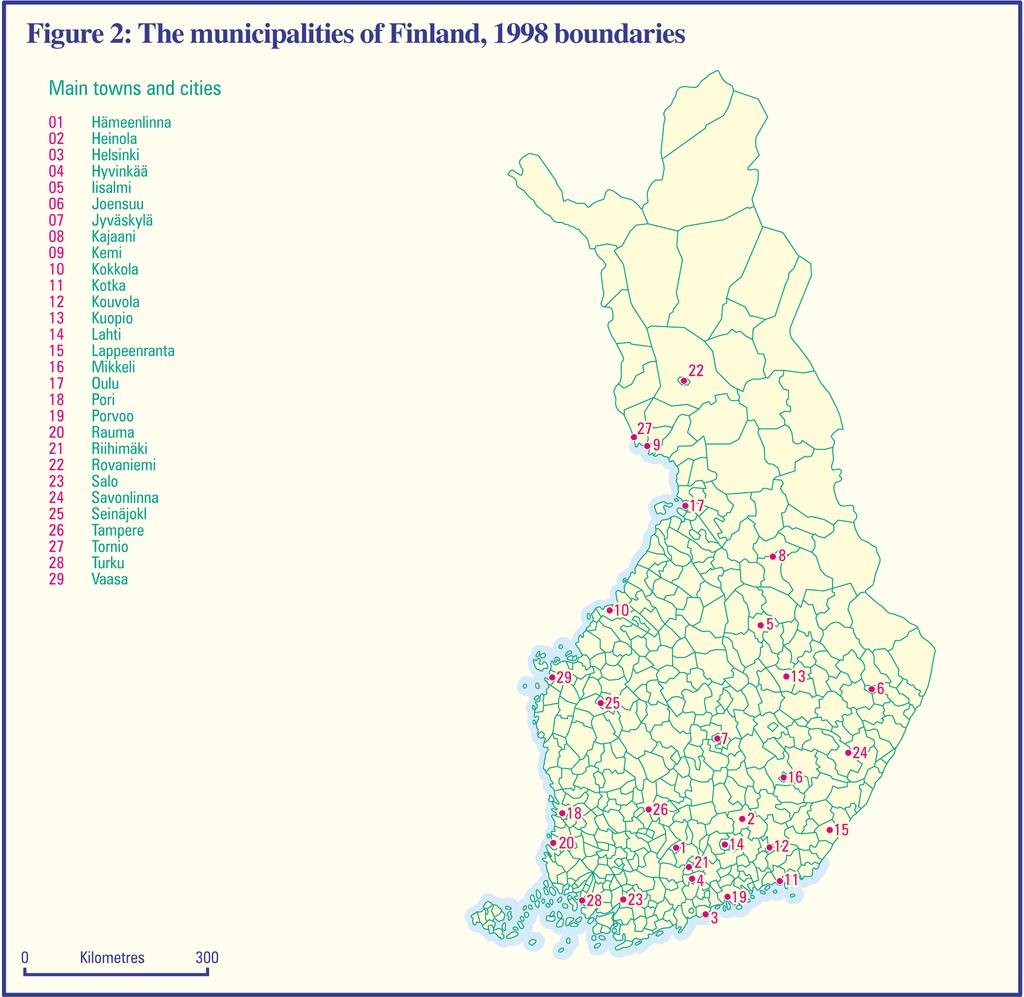
14 3. METHODS USED AND DATA EMPLOYED 3.1 Geographical scale, geographical units and variables used For the investigation of population dynamics and migration in Finland two geographies have been used: 452 municipalities (kunnat) and 20 regions. Figure 1 shows the regions and subregions of Finland used in this study. Figure 2 maps the municipality boundaries and identifies the principal cities. Data for 1984, 1994 and 1996 were converted to the administrative divisions of the country as in 1998, for which we had digital boundaries. The extraordinary sophistication of spatial statistics in Finland, in which all records in the country s population register are given accurate geo-coordinates, allowed a direct extraction of statistical data for various years recalculated to the predefined spatial division. The Research and Development Centre of Kajaani at the University of Oulu and Statistics Finland very kindly provided us with most of the data recalculated to the 1998 administrative division of the country. 3.2 Mapping techniques and problems The mapping techniques used in this study were explained fully in Rees, Durham and Kupiszewski (1996). For mapping purposes we obtained from the Research and Development Centre of Kajaani of the University of Oulu the Finnish digital boundaries for 452 municipalities, 85 subregions, 20 regions and 12 provinces for 1996 and 1998, which nest hierarchically. 7
15
16
17 3.3 Variables and key indicators used In order to extract from a large amount of data on inter-area migration by age and sex the significant information characterising migration patterns and population dynamics we applied a number of fairly simple procedures. The first one was to present the data in cartographic form, which allows for easy identification of spatial patterns. The second technique applied was to reconstruct the full origin-destination migration matrices for clusters of municipalities banded together based on similar values of selected variables. The variables used in this study were: size of municipality, population density and unemployment level. Discussion of variables and indicators used for mapping purposes and for construction of bands is offered below. Finland operates a system of excellent population registers dating back to the early 17 th century (Statistics Finland 1999, Nieminen 1981). Its modern version is run at local level by Evangelican-Lutheran and Orthodox parishes and municipalities and records such events as births, deaths, internal migrations and international migrations. The data collected at local level are passed on to the Population Register Centre, an institution responsible for population registers in Finland. Data processed by the Population Register Centre are supplied to Statistics Finland which, after all necessary checks and corrections, produces the final counts of population and demographic events (Nieminen 1981) Population and population change data Data on population stocks for municipalities for 1984, 1994 and 1996 were obtained. The Research and Development Centre of Kajaani at the University of Oulu recalculated these data to the 1998 administrative divisions of the country. Based on this data indices of population change for each administrative unit were calculated. 10
18 3.3.2 Migration Finland is one of the countries with the most detailed information in terms of spatial resolution and demographic characteristics of migrants. All data come from population registers. Inflows and outflows by age, sex and municipality were obtained from Statistics Finland for 1984, 1994 and They were used for construction of in-migration, outmigration and net migration maps by municipalities as well as for construction of tables of flows between various bands of municipalities defined by selected variables. Maps of inmigration, out-migration and net migration by age between regions were generated from these tables Births and deaths Data on births and deaths were obtained for 1996 computed by the administrative division current in The data were used for construction of the Webb typology, in which areas are assigned to one of eight types, depending on the level and direction of rates of population change, natural change and migration change Population density Population density was calculated based on population data for municipalities in 1996 and administrative boundaries for Size class of communes Size class of communes was calculated based on population data for municipalities in 1996 and administrative boundaries for 1998 and expressed as persons per square kilometre. 11
19 3.3.6 Functional classifications of communes Two functional classifications have been used. The first, presented in the Regional Classification Handbook (Statistics Finland 1998), divides all municipalities into three classes: urban, in which at least 90% of population lives in urban settlements or in which the largest urban settlement has at least inhabitants; semi-urban with the share of population living in urban settlements between 60% and 90% or with the largest urban settlement between 4000 and inhabitants and rural encompassing all other municipalities. This classification is designed to express the location of communes on the rural-urban continuum. The University of Oulu developed another, more complicated classification which concentrates on the precise characteristics of rural areas. For 1998 the following classes have been defined: remote rural areas, islands, nuclear rural areas, rural areas close to urban settlements and urban areas. This classification is very helpful in exposing the processes going on in rural areas. This classification resembles to some extent classifications into urban, suburban, periurban and rural areas frequently used in high-density countries, but is adapted to the specific geographic conditions of sparsely populated Finland Unemployment The unemployment data (rate of unemployment calculated as the share of unemployed in the total labour force by municipalities) for 1996 has been provided by the Finnish Ministry of Labour. The data were recalculated to the 1998 administrative division of the country. 12
20 4. THE PATTERN OF INTERNAL MIGRATION BETWEEN SUBREGIONS THROUGH LIFE COURSE, 1996 Migration has been shown to be selective with respect to the migrant characteristics. The age structure of the migrants affects regional development in in both sending and receiving regions. In-migration and out-migration together create a new demographic situation in an area; net migration classified by age shows the combination of the migration inflows and outflows influences population structures. In this section of the paper we map and interpret the internal migration dynamics of Finland by subregions and age to identify the differences between life course stages and in 1984 and 1996 in order to identify shifts between the two decades, separated by the dissolution of the Soviet Union and economic decline in its successor states, which had a profound impact on the Finnish economy. In the analysis we use six broad age groups, which correspond to different stages of life course: 0-14 the childhood ages the adolescent and young adult ages the labour force and family ages the older labour force ages the retirement ages 75 and over the elderly ages In order to make the discussion more compact and comprehensible, these six broad age group have been further aggregated into three groups, which have similar migration patterns. The first group consists of the adolescent and young adult ages (15-29 years), which have been found by Rees and Kupiszewski (1999) to exhibit distinctive migration preferences different from all other ages. The second group consists of family and older labour force ages (0-14, and 45-13
21 59 years), shown to have quite similar migration patterns, quite different from those of the adolescent and young adult age group. The third group consists of the retirement and elderly ages (60-74 and 75+ age groups), in which migration is much less intense and which has distinct directions of flow. 4.1 In-migration Figure 3 contain six maps plotting in-migration rates, one for each broad age group (Figure 3A (0-14), 3B (15-29), 3C (30-44), 3D (45-59), 3D (60-74) and 3F (75+). Figure 4 provides the equivalent maps for Table 1 summarises the distribution of municipalities across the migration bands and assesses the degree of stability versus change between the two years In-migration in the adolescent and young adult ages Adolescent and young adults are the age group most prone to migration, an observation confirmed by many analyses (see Karjalainen 1986, Karjalainen 1989:3). The availability of an educated, young labour force is a very important factor for regional development in Finland. Regions vary significantly in their ability to attract such human capital and to retain it (Heikkilä 1997, 173). In-migration rates for ages in Finland in 1984 are shown in Figure 3B. The highest in-migration rates are mostly located in the central and southern part of Finland, but high rates are also found close to the Oulu area. These subregions are situated in general in areas around cities. In the middle of the 1980s people in their twenties were moving out from the cities to the nearby areas, looking for better and cheaper living areas for bringing up their young children. In-migration was weak along the west coast and in north-eastern Finland. 14
22 Figure 3: In-migration rates by sub-regions, Finland, In-migration rate per 1000 inhabitants 50 or more (17) 25 to <50 (50) 10 to <25 (16) 5 to <10 (2) 0 to <5 (0) In-migration rate per 1000 inhabitants 50 or more (49) 25 to <50 (31) 10 to <25 (5) 5 to <10 (0) 0 to <5 (0) In-migration rate per 1000 inhabitants 50 or more (12) 25 to <50 (51) 10 to <25 (18) 5 to <10 (3) 0 to <5 (1) In-migration rate per 1000 inhabitants 50 or more (1) 25 to <50 (8) 10 to <25 (31) 5 to <10 (36) 0 to <5 (9) In-migration rate per 1000 inhabitants 50 or more (0) 25 to <50 (2) 10 to <25 (25) 5 to <10 (37) 0 to <5 (21) In-migration rate per 1000 inhabitants 50 or more (0) 25 to <50 (2) 10 to <25 (3) 5 to <10 (24) 0 to <5 (56)
23 Figure 4: In-migration rates by sub-regions, Finland, In-migration rate per 1000 inhabitants 50 or more (14) 25 to <50 (50) 10 to <25 (17) 5 to <10 (4) 0 to <5 (0) In-migration rate per 1000 inhabitants 50 or more (66) 25 to <50 (16) 10 to <25 (3) 5 to <10 (0) 0 to <5 (0) In-migration rate per 1000 inhabitants 50 or more (18) 25 to <50 (49) 10 to <25 (16) 5 to <10 (2) 0 to <5 (0) In-migration rate per 1000 inhabitants 50 or more (3) 25 to <50 (26) 10 to <25 (41) 5 to <10 (12) 0 to <5 (3) In-migration rate per 1000 inhabitants 50 or more (0) 25 to <50 (4) 10 to <25 (27) 5 to <10 (37) 0 to <5 (17) In-migration rate per 1000 inhabitants 50 or more (0) 25 to <50 (1) 10 to <25 (2) 5 to <10 (27) 0 to <5 (55)
24 Table 1: The distribution of sub-regions by in-migration rate band for broad ages, Finland, 1984 and 1996 Age group Year In-migration rate per 1000 inhabitants 0-<5 5-<10 10-<25 25-<50 50-< In the second half of the 1990 s internal migration rose to a new level in Finland. This can be seen also on Figure 4B, which shows that there were 25 subregions in the top category of 100 in-migrations per 1000 population in 1996 compared with only 11 in The Oulu region in the north and many fast growing areas locating in central and southern Finland attract young people. The lowest in-migration occurs in the Kajaani subregion in the eastern part of Finland In-migration in the family and older labour force ages In 1984 the highest in-migration rate for the age group 0-14 years old was observed only in three subregions of Finland (Figure 3A). Two of those are located close to the city of Oulu and the third one in central Finland. The high in-migration (and out-migration) of children in the Oulu region is mostly due to the large number of children in old Lutheran families. The 17
25 lowest in-migration rates are found along the west coast. In-migration rates for the age group 0-14 years old in 1996 (Figure 4A) are quite similar to those in The highest inflows are directed to two subregions, but these are the same as in the 1980s. The lowest rates are again on the west coast and to Jämsä subregion in central Finland. People s propensity to migrate has been shown to decrease as life advances (Karjalainen 1989). The in-migration rates are clearly smaller in family age groups (0-14 and 30-44) compared to the young adult ages in The subregions with highest rates of inmigration are the same for the family age groups (30-44) and the ages 0-14 (Figure 3A, 3C). Also the lowest in-migration subregions are similar for these two age groups. This is, of course, natural as children migrate with their families and not independently. A very similar structure is seen for the year 1996 in these two age groups (Figures 4A, 4C). Little change in migration patterns over time was identified for the family ages. The older labour force s in-migration rates are much smaller compared to younger age groups. There is only one subregion, Lakeus, close to Oulu, which has an in-migration rate in the highest class (Figure 3D). Mostly in-migration was channelled to central and eastern parts of Finland. In 1996 (Figure 4D) the in-migration rates are clearly higher compared to The highest rates are for Ii, Lakeus and the south-eastern part of central Finland. The lowest values are found on the west coast In-migration in the retirement and elderly ages The elderly population (65 years and older) contribute very little to total migration, as their share of internal migration in Finland is only 2% (Karjalainen 1993:120). In-migration rates show also the same phenomenon. Two thirds of the subregions belongs to the two lowest categories on the map of in-migration for ages in 1984 (Figure 3E). The highest rates are in the areas close to Oulu city. The structure of in-migration for this age group is very similar in 1996 (Figure 4E) to that
26 In-migration rates for the elderly ages (75+) are the lowest of all age categories. Two thirds of the subregions belong to the lowest rate category and nearly 95 % of subregions are classified to the two lowest rate groups in 1984 (Figure 3F). In 1996 (Figure 4F) the level and pattern of in-migration rates are very similar to those for Out-migration Figure 5 contains six maps plotting out-migration rates, one for each broad age group (Figure 5, maps A, B, C, D, E and F. Figure 6 provides the equivalent maps for Table 2 summarises the distribution of municipalities across the migration bands and assesses the degree of change between the two years. Note that there is a fair degree of correlation with the previous in-migration maps. The reason is that a large proportion of migrations involve either labour market or housing market vacancy chains. When an employee migrates out to a job in another region, they may be replaced by another person who migrates in. Where this does not occur when jobs are lost, then the out-migration may not be replaced by an inmigration. We consider these shifts at the margin when describing this pattern of net migration. The vacancy chain effect also applies to retired persons who own their own home and want to more. There needs to be a willing buyer for most moves to be made possible Out-migration in the adolescent and young adult ages The out-migration rates of young adults (15-29 years) are high. In % fall into the two highest rate classes (Figure 5B). These subregions are located all over the country. Outmigration has grown significantly from 1984 to 1996 (Figure 5B, Table 2). The number of subregions in the highest category more than doubled in the period Some urbanised subregions, such as Helsinki, Jyväskylä and Kuopio, have a lower level of outmigration in 1996, reflecting their greater ability to retain migrants through job growth. 19
27 Figure 5: Out-migration rates by sub-regions, Finland, Out-migration rate per 1000 inhabitants 50 or more (14) 25 to <50 (41) 10 to <25 (26) 5 to <10 (4) 0 to <5 (0) Out-migration rate per 1000 inhabitants 50 or more (63) 25 to <50 (15) 10 to <25 (7) 5 to <10 (0) 0 to <5 (0) Out-migration rate per 1000 inhabitants 50 or more (12) 25 to <50 (37) 10 to <25 (29) 5 to <10 (7) 0 to <5 (0) Out-migration rate per 1000 inhabitants 50 or more (1) 25 to <50 (4) 10 to <25 (36) 5 to <10 (27) 0 to <5 (17) Out-migration rate per 1000 inhabitants 50 or more (0) 25 to <50 (2) 10 to <25 (19) 5 to <10 (39) 0 to <5 (25) Out-migration rate per 1000 inhabitants 50 or more (0) 25 to <50 (1) 10 to <25 (8) 5 to <10 (19) 0 to <5 (57)
28 Figure 6: Out-migration rates by sub-regions, Finland, Out-migration rate per 1000 inhabitants 50 or more (19) 25 to <50 (33) 10 to <25 (29) 5 to <10 (4) 0 to <5 (0) Out-migration rate per 1000 inhabitants 50 or more (71) 25 to <50 (13) 10 to <25 (1) 5 to <10 (0) 0 to <5 (0) Out-migration rate per 1000 inhabitants 50 or more (21) 25 to <50 (38) 10 to <25 (24) 5 to <10 (2) 0 to <5 (0) Out-migration rate per 1000 inhabitants 50 or more (4) 25 to <50 (14) 10 to <25 (46) 5 to <10 (16) 0 to <5 (5) Out-migration rate per 1000 inhabitants 50 or more (0) 25 to <50 (4) 10 to <25 (26) 5 to <10 (36) 0 to <5 (19) Out-migration rate per 1000 inhabitants 50 or more (0) 25 to <50 (0) 10 to <25 (8) 5 to <10 (26) 0 to <5 (51)
29 Table 2: The distribution of sub-regions by out-migration rate band for broad ages, Finland, 1984 and 1996 Age group Year Out-migration rate per 1000 inhabitants 0-<5 5-<10 10-<25 25-<50 50-< Out-migration in the family and older labour force ages Out-migration of children in 1984 has been highest in two areas: Lakeus and and south-east of central Finland (Figure 5A). Other high out-migration areas were situated in the northern and eastern part of country. There is a chain of the lowest out-migration areas in southeastern part of Finland. Out-migration rates for 1996 (Figure 6A) are quite similar to those for the year The subregions with the lowest rates are now more widespread than in Out-migration patterns in the family age group parallel those of children in 1984 (Figure 5A, 5C). The age group has lower migration propensities than the age group. Out-migration rates have grown from 1984 to 1996 for the family age group (Figure 5C, 6C). Lowest rates are found in central Finland. Out-migration rates, like in-migration rates, are low for the older labour force age group. In 1984 over half of the subregions belonged to the two lowest rate categories (Figure 22
30 5D, Table 2). In central Finland the rates were the lowest. Out-migration rates have grown from 1984 to 1996 for ages (Figure 5D, 6D, Table 2): only 25 % of the subregions were classified in the two lowest rate groups in Out-migration in the retirement and elderly ages People in retirement ages demonstrate very low out-migration levels: in % of subregions fall into the two lowest out-migration rates categories (Figure 5E, Table 2). Highest values are found close to the city of Oulu. The mobility for year-olds has risen a little from 1984 to 1996 (Figure 5E, 6E, Table 2): fewer subregions fall in the bottom category. Out-migration rates for the elderly people have very low values and two thirds of the subregions fall into the lowest value category in 1984 (Figure 5F). Only one subregion, Lakeus, has remarkably high out-migration rate for the elderly. In 1996 the out-migration rates increased slightly since some subregions have moved up from the lowest rate category to the second lowest group (Figure 6F, Table 2). 4.3 Net migration Figure 7 contains six maps plotting out-migration rates, one for each broad age group (Figure 7A (0-14), 7B (15-29), 7C (30-44), 7D (45-59), 7D (60-74) and 7F (75+). Figure 8 provides the equivalent maps for Table 3 summarises the distribution of municipalities across the migration bands and assesses the degree of stability versus change between the two years. The net migration rate, measuring the balance between in-migration and outmigration, is the indicator which gives a clear view of which areas are losing population and which subregions are the winners. 23
31 Figure 7: Net migration rates by sub-regions, Finland, Net migration rate per 1000 population 10 or more (14) 5 to <10 (24) 0 to <5 (13) -5 to <0 (18) -10 to <-5 (9) Less than -10 (7) Net migration rate per 1000 population 10 or more (10) 5 to <10 (3) 0 to <5 (5) -5 to <0 (9) -10 to <-5 (12) Less than -10 (46) Net migration rate per 1000 population 10 or more (10) 5 to <10 (13) 0 to <5 (25) -5 to <0 (21) -10 to <-5 (11) Less than -10 (5) Net migration rate per 1000 population 10 or more (1) 5 to <10 (8) 0 to <5 (44) -5 to <0 (28) -10 to <-5 (4) Less than -10 (0) Net migration rate per 1000 population 10 or more (1) 5 to <10 (7) 0 to <5 (43) -5 to <0 (26) -10 to <-5 (5) Less than -10 (3) Net migration rate per 1000 population 10 or more (1) 5 to <10 (2) 0 to <5 (48) -5 to <0 (27) -10 to <-5 (7) Less than -10 (0)
32 Figure 8: Net migration rates by sub-regions, Finland, Net migration rate per 1000 population 10 or more (9) 5 to <10 (4) 0 to <5 (21) -5 to <0 (26) -10 to <-5 (14) Less than -10 (11) Net migration rate per 1000 population 10 or more (10) 5 to <10 (1) 0 to <5 (1) -5 to <0 (4) -10 to <-5 (5) Less than -10 (64) Net migration rate per 1000 population 10 or more (9) 5 to <10 (5) 0 to <5 (22) -5 to <0 (21) -10 to <-5 (15) Less than -10 (13) Net migration rate per 1000 population 10 or more (5) 5 to <10 (12) 0 to <5 (39) -5 to <0 (19) -10 to <-5 (7) Less than -10 (3) Net migration rate per 1000 population 10 or more (1) 5 to <10 (6) 0 to <5 (50) -5 to <0 (24) -10 to <-5 (3) Less than -10 (1) Net migration rate per 1000 population 10 or more (1) 0 to <5 (40) -5 to <0 (38) -10 to <-5 (5) Less than -10 (1)
33 Table 3: The distribution of sub-regions by net migration rate band for broad ages, Finland, 1984 and 1996 Age Year Net internal migration rate band per 1000 inhabitants group < < < <-5-5- <0 0-<5 5- < < < Net migration in the adolescent and young adult ages That the population is concentrating in the South of Finland can be seen when looking at the migration balance of young adults. In 1984 the whole of northern Finland lost population aged years old and the gainers are found in the southern part of the country (Figure 7B). Among the gaining subregions are, for example, Loimaa situated close to the city of Turku and the Helsinki subregion. The net migration map showed in 1996 (Figure 8B) an even stronger concentration process than in 1984 and the net growth more clearly concentrates in major cities of Finland such as Helsinki, Tampere, Turku and Oulu (Figure 8B). Areas with net outflows increased their losses between 1984 and
34 4.3.2 Net migration in the family and older labour force ages Net migration rate for the ages 0-14 divides Finland into two parts in 1984 (Figure 7A): the northern part of the country has been losing children and south-eastern part of Finland has been gaining. Negative net rates are also observed on the west coast. Regional patterns were very similar in 1996 (Figure 8A). The north has experienced net out-migration. Only the Mountain Lapp subregion moved from the losing to the gaining class. The number of subregions losing migrants has increased between 1984 and 1996 (Table 3). In % of subregions lost migrants. The share increased to 60% in The regional pattern of net migration rates for family age groups is more balanced than for young adults. Loser areas are located mainly in the western and eastern part of Finland. The gainer areas are spread all over the country. In 1996 the migration balance for ages was positive in the southern part of Finland. Net out-migration characterises most of the other parts of the country (Figure 8C). In the north the Mountain Lapp subregion has a positive net migration rate. In 1984 the older labour force ages had lower net migration rates than the younger age groups (Figure 7D). The regional pattern is thus more balanced and few subregions had extreme values of net migration. The highest positive balance is in the Loimaa subregion as well as in four areas in the South and the North. The regional pattern of rates became a little bit more varied 1996 (Figure 8D). The gainers are located in the south-east of central Finland and the highest losses have been in north-eastern Lapland, the Tornio Valley and Vakka- Finland Net migration in the retirement and elderly ages Net migration rates for the retirement ages are quite close to balance because there are few extreme values in 1984 (Figure 7E). The highest positive rates are found in southern and 27
35 central part of Finland. The highest net migration gain was in the Ii subregion. The regional pattern of the migration balance for aged people in 1996 (Figure 8E) is also quite balanced because 87% of the subregions belong to the categories where rate value is between 5 to 5 persons per 1000 inhabitants. The most negative value is found in north-eastern Lapland. Elderly people who are 75 years old and over have also very balanced structure of net migration in 1984 (Figure 7F). Nearly 90 % of the subregions has net migration rate between 5 to -5. The Ii subregion has the highest rate and the lowest values are located mostly in the western part of the country. The migration balance in 1996 (Figure 8F) varies very little because of the low level of migration activity at advanced ages. The most negative rate is in Lakeus. 28
36 5. POPULATION CHANGE AND MIGRATION BY MUNICIPALITY In the previous section, we reviewed internal migration patterns for six broad age groups linked to significant life course stages. In this section we examine both overall population change and in-, out- and net-migration at the municipality scale which provide a spatial frame closer to the functional spatial organisation of Finland than subregions. We concentrate, however, on presenting the all age patterns, which are an average concealing in particular the very different migration behaviour of young adults, family migrants and older ages. 5.1 Population change in Finland by communes The Finnish population increased by 5%% over the 12 year-period The geographical pattern of changes is shown on Figure 9. Out of 452 communes and municipalities, a minority of 200 increased their population in this period. The growth of large cities was about twice as fast as the growth of the entire country. Among cities with over inhabitants, the slowest growth was observed in Turku, Helsinki and Tampere which increased their populations by 3%, 10% and 11% respectively, but within these urban agglomerations some municipalities grew vigorously. Esboo in the Helsinki metropolitan area grew by amazing 28%. Esboo is the location for NOKIA s Headquarters and many divisions. The fastest growth of population occurred not in the large city cores but in their suburban rings. The Helsinki agglomeration s inner ring of suburban communes (the municipalities of Vantaa, Tuusula, Kerava, Sipoo) experienced growth between 10 and 20%. In the outer ring increases were even higher with Pornainen gaining 44%, and Järvenpää, Kirkkonummi, Nurmijärvi, and Mäntsälä all showed gains more than 20 percent of their 1984 populations. The entire region of Uusimaa constitutes a growth pole for population. An equally dynamic growth of population and a similar spatial pattern can be seen in the Turku agglomeration. 29
37 Figure 9: Population change by municipality, Finland, Population change (1984 = 100) 120 or more (28) 110 to <120 (46) 105 to <110 (52) 100 to <105 (74) 95 to <100 (86) 90 to <95 (92) 0 to <90 (74)
38 The inner ring of municipalities surrounding Turku demonstrated faster growth than the inner ring of the Helsinki agglomeration. Around Turku exists a cluster of municipalities with remarkably high population increases: Merimasku with 42% increase and the communes of Velkua, Lemu, Masku and Vahto with increases exceeding 30 %. The smaller urban centres show patterns of population growth and concentration similar to the large ones. Tampere, Jyväskylä and Oulu have all been growing themselves quite quickly as did their suburban rings. Small urban centres, around in population, show moderate growth with two exceptions medium growth of Joensuu and decline of Kotka, typical of the entire Kymenlaakso region. Population decline features mostly in sparsely populated municipalities, in central and northern parts of the country. Most affected were communes of western regions of Satakunta and Etelä-Pohjanmaa as well as those lying on the Russian border. Out of 24 such municipalities only 4 increased their populations over the period In fact the Eastern part of Finland suffers the greatest depopulation in rural areas. All rural communes of the Pohjois-Karjala and Kainuu regions and substantial part of Etelä-Savo and Pohjois-Savo regions suffered population decrease. The picture of population change in Finland is pretty clear and uniform: very fast growing suburban rings, growing urban centres and depopulating countryside. 5.2 In-migration patterns by municipality 1984 and 1996 The in-migration pattern by municipalities in Finland (Figure 10) is relatively flat with majority of units (312 in 1984, 277 in 1994 and 283 in 1996) gaining between 25 and 50 persons per 1000 inhabitants. Lower in-migration ratios can be seen along eastern border and Vaasa Kajaani axis, extending from the coast in the West to the state boundary in the East. This axis is more visible on the map representing in-migration ratios in 1994 and
39 Figure 10: In-migration rates by municipality, Finland 1984, 1994 and 1996 A: 1984 B: 1994 C: 1996 Inmigration per 1000 inhabitants 75 or more (8) 50 to <75 (74) 25 to <50 (312) 15 to <25 (55) 0 to <15 (3) Inmigration per 1000 inhabitants 75 or more (4) 50 to <75 (83) 25 to <50 (277) 15 to <25 (86) 0 to <15 (2) Inmigration per 1000 inhabitants 75 or more (5) 50 to <75 (105) 25 to <50 (283) 15 to <25 (55) 0 to <15 (4)
40 Higher than prevailing in-migration benefited cities and urban agglomerations, in particular Helsinki, Turku, Oulu, Jyväskylä and towns such as Rovaniemi or Mikkeli. The southern coastal part has higher than average rates of in-migration. In 1994 and 1996 the differences between areas were slightly higher than in 1984, but general pattern remained unaffected. 5.3 Out-migration patterns by municipality 1984 and 1996 Out-migration patterns (Figure 11) are even less varied than in-migration with majority of units (376 in 1984, 326 in 1994 and 295 in 1996) losing between 25 and 50 persons per 1000 inhabitants. Lower out-migration rates can be seen in scattered municipalities in the western part of the country, with higher rates along the south coast. In 1994 and 1996 the variation in migration intensities was slightly higher than in Net migration patterns by municipality 1984 and 1996 Net migration rates by municipalities in 1984 and 1996 are shown in Figure 12. In municipalities had positive net migration rate and 228 negative. A clear pattern of suburbanisation was visible with core cities (Helsinki, Turku, Oulu, Vaasa, Jyväskylä) all losing population due to migration and their suburban rings gaining population. Urban agglomerations have created large growth poles, extending in the south to almost entire regions. This is the case in the Varsinais-Suomi and Uusimaa regions. In the latter over a half of municipalities gained due to net migration over 1 percent of population. The largest net migration losses were suffered by municipalities in the North, along the Finnish-Russian boundary and in northern Pirkanmaa, Etelä-Pohjanmaa, Keski- Pohjanmaa or Pohjos-Pohjanmaa. 33
This is a repository copy of Internal Migration and Regional Population Dynamics in Europe: Sweden Case Study.
 This is a repository copy of Internal Migration and Regional Population Dynamics in Europe: Sweden Case Study. White Rose Research Online URL for this paper: http://eprints.whiterose.ac.uk/519/ Monograph:
IMMIGRANTS AND IMMIGRATION POLICY IN AGEING FINLAND
 BULLETIN OF GEOGRAPHY Socio economic Series No. 15/2011 ANNA ŁOBODZIŃSKA Jagiellonian University, Poland IMMIGRANTS AND IMMIGRATION POLICY IN AGEING FINLAND DOI: http://dx.doi.org/10.2478/v10089-011-0003-z
Population Structure 2010
 Population 2011 Population Structure 2010 Over quarter of a million aged 80 and over in Finland According to Statistics Finland's statistics on the population structure, there were 255,912 persons aged
One 40-year-old woman in five has no children
 Population 0 Population Structure 00 Annual Review One 0-year-old woman in five has no children According to Statistics Finland's statistics on the population structure, per cent of the 0-year-old women
State of the Nordic Region 2018
 2 State of the Nordic Region 2018 Lunch seminar Julien Grunfelder, Head of GIS department April 23 rd 2018, Helsinki Outline Demography Labour Force Economy Regional Potential Index Introduction What is
STRENGTHENING RURAL CANADA: Fewer & Older: The Coming Population and Demographic Challenges in Rural Newfoundland & Labrador
 STRENGTHENING RURAL CANADA: Fewer & Older: The Coming Population and Demographic Challenges in Rural Newfoundland & Labrador An Executive Summary 1 This paper has been prepared for the Strengthening Rural
STRENGTHENING RURAL CANADA: Fewer & Older: Population and Demographic Crossroads in Rural Saskatchewan. An Executive Summary
 STRENGTHENING RURAL CANADA: Fewer & Older: Population and Demographic Crossroads in Rural Saskatchewan An Executive Summary This paper has been prepared for the Strengthening Rural Canada initiative by:
State of the Nordic Region 2018
 2 0 / 0 4 / State of the Nordic Region 2018 State of the Nordic Region 2018 gives you a unique look behind the scenes of the world s most integrated region, comprised of Denmark, Finland, Iceland, Norway
1. A Regional Snapshot
 SMARTGROWTH WORKSHOP, 29 MAY 2002 Recent developments in population movement and growth in the Western Bay of Plenty Professor Richard Bedford Deputy Vice-Chancellor (Research) and Convenor, Migration
Statistics on offences and coercive methods
 Justice 2016 Statistics on and coercive methods Offences known to the authorities 2015 Drunken driving caused by narcotic substances increased by 19.7 per cent According to Statistics Finland's data, a
8AMBER WAVES VOLUME 2 ISSUE 3
 8AMBER WAVES VOLUME 2 ISSUE 3 F E A T U R E William Kandel, USDA/ERS ECONOMIC RESEARCH SERVICE/USDA Rural s Employment and Residential Trends William Kandel wkandel@ers.usda.gov Constance Newman cnewman@ers.usda.gov
Introduction: The State of Europe s Population, 2003
 Introduction: The State of Europe s Population, 2003 Changes in the size, growth and composition of the population are of key importance to policy-makers in practically all domains of life. To provide
People. Population size and growth. Components of population change
 The social report monitors outcomes for the New Zealand population. This section contains background information on the size and characteristics of the population to provide a context for the indicators
Foreigners in Helsinki 2013
 40 2013 Foreigners in Helsinki 2013 Other 24 % Russian 21 % Persian 2 % Turkish 2 % Vietnamese 2 % French 2 % German 2 % Spanish 3 % Kurdish 3 % Chinese 4 % Arabic 5 % English 6 % Somali 10 % Estonian
Chapter One: people & demographics
 Chapter One: people & demographics The composition of Alberta s population is the foundation for its post-secondary enrolment growth. The population s demographic profile determines the pressure points
The population development of regions is going into different directions
 Population Population Structure 9 Annual Review The population development of regions is going into different directions In 9, population increased in regions, having grown in in the previous year. Population
Current review of development in the region 2018 EUROPEAN COMPARISON. Regional economy. Housing market. Traffic and environment
 Current review of development in the region 2018 2018 Regional economy Strong growth in production continues Housing market Rents of premium offices in European capitals in 2017 EUR/m2/month 40 30 39 20
Preliminary population statistics
 Population 201 Preliminary population statistics 201, March Finland s preliminary population figure,04,913 at the end of March New releases will not be produced on preliminary population statistics any
Preliminary population statistics
 Population 2018 Preliminary population statistics 2018, June Finland s preliminary population figure 5,516,343 at the end of June According to Statistics Finland's preliminary data, Finland's population
Levels and trends in international migration
 Levels and trends in international migration The number of international migrants worldwide has continued to grow rapidly over the past fifteen years reaching million in 1, up from million in 1, 191 million
Changing Times, Changing Enrollments: How Recent Demographic Trends are Affecting Enrollments in Portland Public Schools
 Portland State University PDXScholar School District Enrollment Forecast Reports Population Research Center 7-1-2000 Changing Times, Changing Enrollments: How Recent Demographic Trends are Affecting Enrollments
Leisure trips to the Canary Islands and cruises to Sweden increased in September to December 2016
 Transport and Tourism 01 Finnish Travel 01, Autumn (1 Sep to 1 Dec 01) Leisure trips to the Canary Islands and cruises to Sweden increased in September to December 01 According to Statistics Finland s
People. Population size and growth
 The social report monitors outcomes for the New Zealand population. This section provides background information on who those people are, and provides a context for the indicators that follow. People Population
Post-Secondary Education, Training and Labour September Profile of the New Brunswick Labour Force
 Post-Secondary Education, Training and Labour September 2018 Profile of the New Brunswick Labour Force Contents Population Trends... 2 Key Labour Force Statistics... 5 New Brunswick Overview... 5 Sub-Regional
Population Table 1. Population of Estonia and change in population by census year
 Population 1881 2000 A country s population usually grows or diminishes due to the influence of two factors: rate of natural increase, which is the difference between births and deaths, and rate of mechanical
Country Reports Nordic Region. A brief overview about the Nordic countries on population, the proportion of foreign-born and asylum seekers
 Country Reports Nordic Region A brief overview about the Nordic countries on population, the proportion of foreign-born and asylum seekers Nordic collaboration for integration of refugees and migrants
This is a repository copy of Internal Migration and Regional Population Dynamics in Europe: France Case Study.
 This is a repository copy of Internal Migration and Regional Population Dynamics in Europe: France Case Study. White Rose Research Online URL for this paper: http://eprints.whiterose.ac.uk/5025/ Monograph:
Maria del Carmen Serrato Gutierrez Chapter II: Internal Migration and population flows
 Chapter II: Internal Migration and population flows It is evident that as time has passed, the migration flows in Mexico have changed depending on various factors. Some of the factors where described on
No. 1. THE ROLE OF INTERNATIONAL MIGRATION IN MAINTAINING HUNGARY S POPULATION SIZE BETWEEN WORKING PAPERS ON POPULATION, FAMILY AND WELFARE
 NKI Central Statistical Office Demographic Research Institute H 1119 Budapest Andor utca 47 49. Telefon: (36 1) 229 8413 Fax: (36 1) 229 8552 www.demografia.hu WORKING PAPERS ON POPULATION, FAMILY AND
DEPARTMENT FOR RESCUE SERVICES SOME ASPECTS ON NATIONAL CRISIS PREPAREDNESS IN FINLAND
 SOME ASPECTS ON NATIONAL CRISIS PREPAREDNESS IN FINLAND Pentti Partanen Director General, Rescue Services Ministry of the Interior FINLAND IN EUROPE SOME FACTS ABOUT FINLAND Population: 5,2 million Area:
Demography. Demography is the study of human population. Population is a dynamic open systems with inputs, processes and outputs.
 Population Demography Demography is the study of human population. Population is a dynamic open systems with inputs, processes and outputs. This means that change constantly occurs in population numbers,
Migration of early middle-aged population between core rural areas to fast economically growing areas in Finland in
 Migration of early middle-aged population between core rural areas to fast economically growing areas in Finland in 2004-2007 Paper to be presented in European Population Conference in Stockholm June,
Preliminary population statistics
 Population 2014 Preliminary population statistics 2013, December Number of births has fallen in three successive years According to Statistics Finland's preliminary data, 58,120 children were born in Finland
Context Indicator 17: Population density
 3.2. Socio-economic situation of rural areas 3.2.1. Predominantly rural regions are more densely populated in the EU-N12 than in the EU-15 Context Indicator 17: Population density In 2011, predominantly
Migrant population of the UK
 BRIEFING PAPER Number CBP8070, 3 August 2017 Migrant population of the UK By Vyara Apostolova & Oliver Hawkins Contents: 1. Who counts as a migrant? 2. Migrant population in the UK 3. Migrant population
THE ROLE OF INTERNATIONAL MIGRATION IN MAINTAINING THE POPULATION SIZE OF HUNGARY BETWEEN LÁSZLÓ HABLICSEK and PÁL PÉTER TÓTH
 THE ROLE OF INTERNATIONAL MIGRATION IN MAINTAINING THE POPULATION SIZE OF HUNGARY BETWEEN 2000 2050 LÁSZLÓ HABLICSEK and PÁL PÉTER TÓTH INTRODUCTION 1 Fertility plays an outstanding role among the phenomena
Population Structure 2009
 Population 2010 Population Structure 2009 Number of persons aged under 15 in Finland s population lowest in over 100 years According to Statistics Finland s statistics on the population structure there
SPANISH NATIONAL YOUTH GUARANTEE IMPLEMENTATION PLAN ANNEX. CONTEXT
 2013 SPANISH NATIONAL YOUTH 2013 GUARANTEE IMPLEMENTATION PLAN ANNEX. CONTEXT 2 Annex. Context Contents I. Introduction 3 II. The labour context for young people 4 III. Main causes of the labour situation
3Z 3 STATISTICS IN FOCUS eurostat Population and social conditions 1995 D 3
 3Z 3 STATISTICS IN FOCUS Population and social conditions 1995 D 3 INTERNATIONAL MIGRATION IN THE EU MEMBER STATES - 1992 It would seem almost to go without saying that international migration concerns
Rural Manitoba Profile:
 Rural Manitoba Profile: A Ten-year Census Analysis (1991 2001) Prepared by Jennifer de Peuter, MA and Marianne Sorensen, PhD of Tandem Social Research Consulting with contributions by Ray Bollman, Jean
HIGHLIGHTS. There is a clear trend in the OECD area towards. which is reflected in the economic and innovative performance of certain OECD countries.
 HIGHLIGHTS The ability to create, distribute and exploit knowledge is increasingly central to competitive advantage, wealth creation and better standards of living. The STI Scoreboard 2001 presents the
HOW TO MEET DEMOGRAPHIC CHANGES. Appendix 2: A HANDBOOK FOR INSPIRATION AND ACTIONS IN NORDIC MUNICIPALITIES AND REGIONS 2012
 HOW TO MEET DEMOGRAPHIC CHANGES A HANDBOOK FOR INSPIRATION AND ACTIONS IN NORDIC MUNICIPALITIES AND REGIONS 2012 Appendix 2: TECHNICAL NOTES FOR MAPS AND DATA How to meet demographic changes A handbook
GCE. Edexcel GCE. Geography A (8214 / 9214) Summer Edexcel GCE. Mark Scheme (Results) Geography A (8214 / 9214)
 Summer Edexcel GCE. Mark Scheme (Results) Geography A (8214 / 9214)") GCE Edexcel GCE Geography A (8214 / 9214) 6462 Summer 2005 Mark Scheme (Results) Edexcel GCE Geography A (8214 / 9214) 6462 6462 Summer 2005 Mark Scheme SECTION A 1 Study Figure 1 which shows global variations
GCE Edexcel GCE Geography A (8214 / 9214) 6462 Summer 2005 Mark Scheme (Results) Edexcel GCE Geography A (8214 / 9214) 6462 6462 Summer 2005 Mark Scheme SECTION A 1 Study Figure 1 which shows global variations
2001 Census: analysis series
 Catalogue no. 96F0030XIE2001006 2001 Census: analysis series Profile of the Canadian population by mobility status: Canada, a nation on the move This document provides detailed analysis of the 2001 Census
Recent Demographic Trends in Nonmetropolitan America: First Evidence from the 2010 Census Executive Summary
 Recent Demographic Trends in Nonmetropolitan America: First Evidence from the 2010 Census Executive Summary Kenneth M. Johnson Department of Sociology and Carsey Institute University of New Hampshire This
Geo Factsheet September 2000 Number 97
 September 2000 Number 97 Rural and Urban Structures - How and why they vary in LEDCs and MEDs Introduction structure is the percentage distribution of males and females by age group within an area and
8. United States of America
 (a) Past trends 8. United States of America The total fertility rate in the United States dropped from 3. births per woman in 19-19 to 2.2 in 197-197. Except for a temporary period during the late 197s
ILO Global Estimates on International Migrant Workers
 ILO Global Estimates on International Migrant Workers Results and Methodology Executive Summary Labour Migration Branch Conditions of Work and Equality Department Department of Statistics ILO Global Estimates
Population structure 2017
 Population 2018 Population structure 2017 Population with foreign background Average age of second generation immigrants with foreign background 11 years According to Statistics Finland, the average age
In small groups work together to create lists of places you can think of that have highest populations. What continents are these countries located
 In small groups work together to create lists of places you can think of that have highest populations. What continents are these countries located on? What about most populated cities? DO NOT USE A PHONE!!!!!
Demographics. Chapter 2 - Table of contents. Environmental Scan 2008
 Environmental Scan 2008 2 Ontario s population, and consequently its labour force, is aging rapidly. The province faces many challenges related to a falling birth rate, an aging population and a large
Worcestershire Migration Report
 This report examines the patterns of migration into and out of Worcestershire and the districts. Internal, Inter-Regional, Intra-Regional and International migration flows are all considered. Worcestershire
Population & Migration
 Population & Migration Population Distribution Humans are not distributed evenly across the earth. Geographers identify regions of Earth s surface where population is clustered and regions where it is
Fiscal Impacts of Immigration in 2013
 www.berl.co.nz Authors: Dr Ganesh Nana and Hugh Dixon All work is done, and services rendered at the request of, and for the purposes of the client only. Neither BERL nor any of its employees accepts any
BRIEFING. Migrants in the UK: An Overview.
 BRIEFING Migrants in the UK: An Overview AUTHOR: DR CINZIA RIENZO DR CARLOS VARGAS-SILVA PUBLISHED: 21/02/2017 NEXT UPDATE: 21/02/2018 6th Revision www.migrationobservatory.ox.ac.uk This briefing provides
Impact of Migration and Development on Population Aging in Malaysia: Evidence. from South-East Asian Community Observatory (SEACO)
") Impact of Migration and Development on Population Aging in Malaysia: Evidence from South-East Asian Community Observatory (SEACO) Introduction: Population aging is an important public health issue related
Impact of Migration and Development on Population Aging in Malaysia: Evidence from South-East Asian Community Observatory (SEACO) Introduction: Population aging is an important public health issue related
A Profile of CANADiAN WoMeN. NorTHerN CoMMuNiTieS
 A Profile of CANADiAN WoMeN in rural, remote AND NorTHerN CoMMuNiTieS DeMogrAPHiC Profile in 2006, the last census year for which data are currently available, approximately 2.8 million women resided in
Internal migration determinants in South Africa: Recent evidence from Census RESEP Policy Brief
 Department of Economics, University of Stellenbosch Internal migration determinants in South Africa: Recent evidence from Census 2011 Eldridge Moses* RESEP Policy Brief february 2 017 This policy brief
December 2011 OVERVIEW. total population. was the. structure and Major urban. the top past 15 that the. Census Economic Regions 1, 2,3 4, 5, 7, 10 6
 December 2011 RECENT DEMOGRAPHIC TRENDS IN ALBERTA S ECONOMIC REGIONS INTRODUCTION s population has expanded significantly over the past few decades. Since 1980, s total population has grown from about
June Study coordinated by ADE
 Study on the relevance and the effectiveness of ERDF and Cohesion Fund support to Regions with Specific Geographical Features Islands, Mountainous and Sparsely Populated areas Second Intermediate Report
Population & Migration
 Population & Migration Population Distribution Humans are not distributed evenly across the earth. Geographers identify regions of Earth s surface where population is clustered and regions where it is
Sustainable cities, human mobility and international migration
 Sustainable cities, human mobility and international migration Report of the Secretary-General for the 51 st session of the Commission on Population and Development (E/CN.9/2018/2) Briefing for Member
The Jordanian Labour Market: Multiple segmentations of labour by nationality, gender, education and occupational classes
 The Jordanian Labour Market: Multiple segmentations of labour by nationality, gender, education and occupational classes Regional Office for Arab States Migration and Governance Network (MAGNET) 1 The
Alberta Population Projection
 Alberta Population Projection 213 241 August 16, 213 1. Highlights Population growth to continue, but at a moderating pace Alberta s population is expected to expand by 2 million people through 241, from
PRESENT TRENDS IN POPULATION DISTRIBUTION
 PRESENT TRENDS IN POPULATION DISTRIBUTION Conrad Taeuber Associate Director, Bureau of the Census U.S. Department of Commerce Our population has recently crossed the 200 million mark, and we are currently
Britain s Population Exceptionalism within the European Union
 Britain s Population Exceptionalism within the European Union Introduction The United Kingdom s rate of population growth far exceeds that of most other European countries. This is particularly problematic
THE DEMOGRAPHIC PROFILE OF THE ARAB COUNTRIES
 Distr. LIMITED E/ESCWA/SDD/2013/Technical paper.14 24 December 2013 ORIGINAL: ENGLISH ECONOMIC AND SOCIAL COMMISSION FOR WESTERN ASIA (ESCWA) THE DEMOGRAPHIC PROFILE OF THE ARAB COUNTRIES New York, 2013
Population and Dwelling Counts
 Release 1 Population and Dwelling Counts Population Counts Quick Facts In 2016, Conception Bay South had a population of 26,199, representing a percentage change of 5.4% from 2011. This compares to the
INCREASE IN LABOR FORCE PARTICIPATION RATE AND URBANIZATION IN TAIWAN
 -133- INCREASE IN LABOR FORCE PARTICIPATION RATE AND URBANIZATION IN TAIWAN Minq-Cheno Chang* INTRODUCTION The crude activity rate in Taiwan increased rapidly from 1956 to 1969: from 28.6% to 34.9%-an
New Brunswick Population Snapshot
 New Brunswick Population Snapshot 1 Project Info Project Title POPULATION DYNAMICS FOR SMALL AREAS AND RURAL COMMUNITIES Principle Investigator Paul Peters, Departments of Sociology and Economics, University
REGIONAL DISPARITIES IN EMPLOYMENT STRUCTURES AND PRODUCTIVITY IN ROMANIA 1. Anca Dachin*, Raluca Popa
 REGIONAL DISPARITIES IN EMPLOYMENT STRUCTURES AND PRODUCTIVITY IN ROMANIA 1 Anca Dachin*, Raluca Popa Academy of Economic Studies of Bucharest Piata Romana, No. 6, Bucharest, e-mail: ancadachin@yahoo.com
ASSESSING THE ECONOMIC IMPACT OF FOREIGN WORKERS IN MALTA
 ASSESSING THE ECONOMIC IMPACT OF FOREIGN WORKERS IN MALTA Article published in the Quarterly Review 2016:1, pp. 39-44 BOX 3: ASSESSING THE ECONOMIC IMPACT OF FOREIGN WORKERS IN MALTA 1 Between the late
2014: :36 FOREIGNERS IN HELSINKI Foreign-language residents by mother tongue in Helsinki on 1 Jan Source: Statistics Finland
 2014:37 2014:36 Foreign-language residents by mother tongue in Helsinki on 1 Jan. 2014 1 Contents FOREWORD... 3 SUMMARY... 4 1. INTRODUCTION... 5 2. THE NUMBER AND DEVELOPMENT OF HELSINKI S FOREIGNER POPULATION...
The Quarterly Review of Economic News & Insight. Economic Currents. Economic Indices for Massachusetts. Population Change, Housing, and Local Finance
 The Quarterly Review of Economic News & Insight summer 2003 Volume six Issue 2 Economic Currents Economic Indices for Massachusetts Population Change, Housing, and Local Finance The Biotech Industry: A
Regional development and labour market dynamics in Finland 1
 Nordia Geographical Publications 34: 4, 13 27 Elli Heikkilä Regional development and labour market dynamics in Finland 1 Elli Heikkilä, Institute of Migration Introduction A common feature of most countries
The proportion of the UK population aged under 16 dropped below the proportion over state pension age for the first time in (Table 1.
 Population In 2007, there were 6.0 million people resident in the UK, an increase of almost 400,000 (0.6 per cent) on 2006, equivalent to an average increase of around,000 people a day. (Table.) Chapter
% of Total Population
 12 2. SOCIO-ECONOMIC ANALYSIS 2.1 POPULATION The Water Services Development Plan: Demographic Report (October December 2000, WSDP) provides a detailed breakdown of population per settlement area for the
The occupational structure and mobility of migrants in the Greek rural labour markets
 Working Group 17. Demographic issues of Rural Subpopulation: Fertility, Migration and Mortality The occupational structure and mobility of migrants in the Greek rural labour markets Introduction As Europe
Migration and Demography
 Migration and Demography Section 2.2 Topics: Demographic Trends and Realities Progressively Ageing Populations Four Case Studies Demography and Migration Policy Challenges Essentials of Migration Management
birth control birth control brain drain birth rate coastal plain commuting Consciously preventing unwanted pregnancies.
 birth control birth control Consciously preventing unwanted pregnancies. Consciously preventing unwanted pregnancies. birth rate brain drain Scientists from Britain to America The number of live births
HUMAN LIFE COURSE IMPACT ON MIGRATION PATTERNS: THE CASE OF JELGAVA CITY, LATVIA
 Proceedings of the 207 International Conference ECONOMIC SCIENCE FOR RURAL DEVELOPMENT No 46 Jelgava, LLU ESAF, 27-28 April 207, pp. 62-67 HUMAN LIFE COURSE IMPACT ON MIGRATION PATTERNS: THE CASE OF JELGAVA
Population density is a measure of how crowded a population is. It looks at land area as well as population.
 Population Population density is a measure of how crowded a population is. It looks at land area as well as population. Population Density = population per unit area (unit area is usually measured in Km
NATIONAL POPULATION PLAN FOR REGIONAL AUSTRALIA
 NATIONAL POPULATION PLAN FOR REGIONAL AUSTRALIA February 2019 KNOWLEDGE POLICY PRACTICE KEY POINTS People vote with their feet and many are showing strong preferences for living in regions. Enhancing liveability
Chapter 5. Conclusion and Recommendation
 Chapter 5 Conclusion and Recommendation By A Gollini and Mohammed Said 5.1 Conclusion 5.1.1 Ethiopia, Homogeneity and Variability on an Internal Scale The analysis of the characteristics of the population
STRENGTHENING RURAL CANADA: Fewer & Older: The Coming Demographic Crisis in Rural Ontario
 STRENGTHENING RURAL CANADA: Fewer & Older: The Coming Demographic Crisis in Rural Ontario An Executive Summary 1 This paper has been prepared for the Strengthening Rural Canada initiative by: Dr. Bakhtiar
PROJECTING THE LABOUR SUPPLY TO 2024
 PROJECTING THE LABOUR SUPPLY TO 2024 Charles Simkins Helen Suzman Professor of Political Economy School of Economic and Business Sciences University of the Witwatersrand May 2008 centre for poverty employment
Population Projection Alberta
 Population Projection Alberta 215 241 Solid long term growth expected Alberta s population is expected to expand by about 2.1 million people by the end of the projection period, reaching just over 6.2
Statistics Update For County Cavan
 Social Inclusion Unit November 2013 Key Figures for Cavan Population 73,183 Population change 14.3% Statistics Update For County Cavan Census 2011 Shows How Cavan is Changing Population living in 70% rural
11. Demographic Transition in Rural China:
 11. Demographic Transition in Rural China: A field survey of five provinces Funing Zhong and Jing Xiang Introduction Rural urban migration and labour mobility are major drivers of China s recent economic
STRENGTHENING RURAL CANADA: Fewer & Older: Population and Demographic Challenges Across Rural Canada A Pan-Canadian Report
 STRENGTHENING RURAL CANADA: Fewer & Older: Population and Demographic Challenges Across Rural Canada A Pan-Canadian Report This paper has been prepared for the Strengthening Rural Canada initiative by:
POPULATION STUDIES RESEARCH BRIEF ISSUE Number
 POPULATION STUDIES RESEARCH BRIEF ISSUE Number 2008021 School for Social and Policy Research 2008 Population Studies Group School for Social and Policy Research Charles Darwin University Northern Territory
European Integration Consortium. IAB, CMR, frdb, GEP, WIFO, wiiw. Labour mobility within the EU in the context of enlargement and the functioning
 European Integration Consortium IAB, CMR, frdb, GEP, WIFO, wiiw Labour mobility within the EU in the context of enlargement and the functioning of the transitional arrangements VC/2007/0293 Deliverable
Chapter 12. The study of population numbers, distribution, trends, and issues.
 Chapter 12 Population Challenges Demography: The study of population numbers, distribution, trends, and issues. Population Statistics for October, 2004, Land Area (Square Km.) And Population Density Canada
Human Population Growth Through Time
 Human Population Growth Through Time Current world population: 7.35 Billion (Nov. 2016) http://www.worldometers.info/world-population/ 2012 7 billion 1999 13 years 12 years 1974 1927 1804 13 years 14 years
how neighbourhoods are changing A Neighbourhood Change Typology for Eight Canadian Metropolitan Areas,
 how neighbourhoods are changing A Neighbourhood Change Typology for Eight Canadian Metropolitan Areas, 1981 2006 BY Robert Murdie, Richard Maaranen, And Jennifer Logan THE NEIGHBOURHOOD CHANGE RESEARCH
Appendix A: Economic Development and Culture Trends in Toronto Data Analysis
 Appendix A: Economic Development and Culture Trends in Toronto Data Analysis Introduction The proposed lenses presented in the EDC Divisional Strategy Conversation Guide are based in part on a data review.
Selected trends in Mexico-United States migration
 Selected trends in Mexico-United States migration Since the early 1970s, the traditional Mexico- United States migration pattern has been transformed in magnitude, intensity, modalities, and characteristics,
INTERNATIONAL MIGRATION AND THE UNITED KINGDOM REPORT OF THE UNITED KINGDOM SOPEMI CORRESPONDENT TO THE OECD, 2018
 INTERNATIONAL MIGRATION AND THE UNITED KINGDOM REPORT OF THE UNITED KINGDOM SOPEMI CORRESPONDENT TO THE OECD, 2018 Prof. John Salt Migration Research Unit Department of Geography University College London
A population with a rising average age, with a growing proportion of people aged over 65yrs. Ageing population
 Ageing population Age structure Agricultural change A population with a rising average age, with a growing proportion of people aged over 65yrs Percentage of the population (or number of people of each
Assessment of Demographic & Community Data Updates & Revisions
 Assessment of Demographic & Community Data Updates & Revisions Scott Langen, Director of Operations McNair Business Development Inc. P: 306-790-1894 F: 306-789-7630 E: slangen@mcnair.ca October 30, 2013