Allison Plyer Greater New Orleans Community Data Center
|
|
|
- Regina Hall
- 6 years ago
- Views:
Transcription
1 Allison Plyer Greater New Orleans Community Data Center


2 The Brookings Institution Metropolitan Policy Program November 28, 2006 Lessons from the Katrina Index for Tracking Post-Disaster Recovery
3 Katrina Index: What Is It? Monitors the social and economic recovery of the city and region of New Orleans Relies on 38 indicators Uses parish-level data where possible Has been released monthly since December 2005 (with weekly, monthly or quarterly trend updates)
4 Katrina Index: Why Did We Start It? To keep regular public and political attention on the recovery effort To better understand the areas of greatest need in the short- and long-term recovery To leverage our position as trend analysts and urban policy experts; serve as go-to-resource for the post-disaster recovery response
5 Katrina Index: How Did We Start It? Conceived in September/October 2005; mirrored after the successful Iraq Index at Brookings Launched in December 2005 Created list of indicators we wanted Spent two months identifying sources: finding reliable contact at sources was difficult in some places; local data sources harder Started with approximately 20 indicators and expanded over time (now 38)
6 Katrina Index: Sample Indicators and Sources Category Indicator Source Housing Average home sale price Number of residential building permits New Orleans Metropolitan Association of Realtors New Orleans Department of Safety and Permits Services and Infrastructure Workforce and Economy Emergency Response Proportion of operational buses and streetcars Proportion of open hospitals Unemployment rate Proportion of open retail food establishments Number of households receiving FEMA housing assistance Labor force size for displaced evacuees New Orleans Regional Transportation Authority Louisiana Hospital Association Bureau of Labor Statistics Louisiana Restaurant Association FEMA Bureau of Labor Statistics
7 Katrina Index: Demand Is High Over 370 media citations since August 2005 Over 47,000 visits to the Katrina Index website between December 2005 and November 2006 The Katrina listserv is made up of a total of 1,400 members from the business, educational, government (federal, state & local) and nonprofit fields
8 Katrina Index: Inquiries Come from all Quarters Media (international, national, local) print, editorials, TV, radio Local, state and federal policymakers (e.g., Hill, Powell's office, GAO, LRA, NOLA agencies) Other non profits and interest groups (housing advocates, environmental, etc.) Private companies (e.g., McKinsey, ICF International, Entergy, law firms, planning and design firms, consulting groups) Scholars/ Researchers/Students
9 Katrina Index: Has Helped Set the Policy Agenda Helped establish where the outstanding needs are and thus policy priorities (affordable housing, geographic unevenness in recovery, infrastructure) Confirmed what was widely known but only anecdotally Framed media discussions
10 Challenges and Limitations of the Katrina Index A lack of organized, publicly accessible data at the metro- and lower levels of geography e.g., hotel and restaurant openings, status of libraries, schools, and public transportation services The lag, irregularity, and termination of data reporting, e.g.: A number of local agencies do not have a set reporting schedule; Local economic data from BLS typically released at least one month later; BLS no longer reporting employment situation for hurricane evacuees after October 2006 Very time intensive given lack of standardization (or high level of customization), particularly given the high reliance on local data
11 Challenges and Limitations of the Katrina Index - Does not include quality data that is in high demand 1. Current population size 2. Demographic characteristics of returning population 3. Federal spending 4. Number and well-being of evacuees
12 Overall Lessons from Katrina Index Overall, there is enormous value and demand for data and analysis There is enormous demand for a one-stop shop of data so that reporters, researchers, and decisionmakers don t have to go retail/hunting Local data is the most difficult to get, but sometimes the most relevant or up-to-date Federal data: lag in reporting, point of contacts (esp. in FEMA) changed often which created occasional errors
13 Overall Lessons from Katrina Index Wish list: better partnership with local reporting agencies better federal data, esp. of federal beneficiaries better current population and demographic estimates
14 Analysis
15 Jan 06 The number of open bus routes and the amount of airport traffic in the area increased, but most of the key indicators moved in the wrong direction or not at all. The bottom line: it continues to be a very risky decision for many of the displaced households to return to the area, since all of the key necessities are in scarce supply, With New Orleans still facing massive economic and infrastructural challenges, it is likely that many of the displaced households will need federal assistance for many months to come.
16 Jan 06 The number of open bus routes and the amount of airport traffic in the area increased, but most of the key indicators moved in the wrong direction or not at all. The bottom line: it continues to be a very risky decision for many of the displaced households to return to the area, since all of the key necessities are in scarce supply, With New Orleans still facing massive economic and infrastructural challenges, it is likely that many of the displaced households will need federal assistance for many months to come. July 06 "On June 15, the president signed an emergency supplemental bill that included $19.8 billion in CDBG funding for families and communities in the Gulf Coast. Meanwhile, this month s index finds continued churning in the overall housing market, while all other aspects of recovery remain at a virtual holding pattern. The rise in home sales, permits, and demolitions seems to have been accelerated by the April release of the FEMA housing elevation maps.
17 Jan 07 The city continues to struggle with the pains of rebuilding, made that much more difficult by the increased threat of violent crime. Still, progress continues, and has even picked-up pace in some areas of the recovery. Further progress in 2007 will require a strong and sustained response to the crime trend, and clear evidence of improvements in the criminal justice system, along with investments in the city s vital infrastructure.
18 Jan 07 The city continues to struggle with the pains of rebuilding, made that much more difficult by the increased threat of violent crime. Still, progress continues, and has even picked-up pace in some areas of the recovery. Further progress in 2007 will require a strong and sustained response to the crime trend, and clear evidence of improvements in the criminal justice system, along with investments in the city s vital infrastructure. Mar 07 "Eighteen months after Hurricane Katrina, housing indicators are mixed, and economic indicators may be showing the first signs of increasing employment, but infrastructure indicators remain basically stalled. With hurricane season less than three months away, officials must take quick action to eliminate excessive red tape to ensure the flow of stalled federal recovery dollars to the Gulf Coast.
19 Local penetration
20

21
22 E-newsletter 1500

23 E-newsletter
24 Figure 3: Cumulative Number of Residential Permits in Orleans Parish 60,000 50,000 Number of residential building permits 53,994 46,306 48,080 49,433 50,739 51,859 52,948 40,000 30,000 20,000 12,170 18,516 36,488 39,415 33,150 30,149 26,489 10,000 0 Oct Nov-05 1,821 Dec-05 4,642 Jan-06 Feb-06 Mar-06 Apr-06 May-06 Jun-06 Sources: City of New Orleans Department of Safety and Permits. Note: In December 2006, the City of New Orleans informed us that they would be providing this data in raw format rather than as frequencies. Running frequencies on the raw data supplied by the City resulted in different statistics than previously published. We have updated all of the numbers in this table to reflect this change. Residential permits include accessory structure, addition (over 50%), addition (under 50%), change of use, demolition, emergency permit, homeowner accessory structure, homeowner repair, new, renovation (non-structural), renovation (structural), repair, and swimming pool. Jul-06 Aug-06 Sep-06 Oct-06 Nov-06 Dec-06 Jan-07 Feb-07
25 Figure 4: Number of New Residential Housing Permits, Total Units Jan-07 Dec Orleans Parish New Orleans MSA Jun-05 Jul-05 Aug-05 Sep-05 Oct-05 Nov-05 Dec-05 Jan-06 Feb-06 Mar-06 Apr-06 May-06 Jun-06 Jul-06 Aug-06 Sep-06 Oct-06 Nov-06 Source: U.S. Census Bureau.
26 Figure 5: Status of Louisiana Road Home Applications 140,000 Total applications 120,000 Closings held 107, , ,000 98,812 80,000 60,000 40,000 20, /15/2007 2/12/2007 3/12/2007 2,921 Source: The Road Home Program.
27 Figure 7: Operational Buses & Open Public Transportation Routes in New Orleans 100% 100% 90% Routes 80% Buses 70% 60% 50% 44% 45% 45% 47% 47% 44% 40% 30% 20% 10% 0% 8% 3% 19% 15% 8% 9% 21% 23% 27% 9% 26% 10% 29% 12% 10% 34% 34% 37% 15% 15%17% 17% 12% Pre-Katrina 10/9/ /23/ /6/ /20/ /4/ /18/2005 1/1/2006 3/5/2006 5/7/2006 7/2/2006 9/3/ /5/2006 1/7/2007 1/21/2007 2/4/2007 2/18/2007 Source: New Orleans Regional Transit Authority.
28 Figure 8: Proportion of Open Public Schools in Select Louisiana Parishes 90% 80% 70% Orleans St. Bernard 60% 50% 40% 41% 41% 41% 42% 43% 44% 44% 30% 20% 14% 16% 17% 20% 20% 13% 20% 20% 20% 20% 20% 10% 0% 0% 0% 7% 7% 7% 7% 7% 7% 7% 0% 5% 7% Sep-05 Oct-05 Nov-05 Dec-05 Jan-06 Feb-06 Mar-06 Apr-06 May-06 Jun-06 Jul-06 Aug-06 Sep-06 Oct-06 Nov-06 Dec-06 Jan-07 Feb-07 Sources: Louisiana Department of Education, Orleans Parish Schools, Plaquemines Parish Schools, New Orleans Times-Picayune. Note: The Orleans Parish numbers were revised as of January 2007.
29 Figure 9: Proportion of State-licensed Hospitals in Operation, by Parish 100% 100% 90% 80% 70% 79% 93% 93% 93% 93% 93% 93% 93% 93% 93% 93% 93% 93% 93% 93% 93% 93% 60% 50% 40% 30% 20% 10% 0% Pre-Katrina Oct-05 9% 26% 30% 30% 39% 39% 39% 39% 39% 39% 39% 43% 48% 52% 52% 52% 52% 0% 0% 0% 0% 0% 0% 0% 0% 0% 0% 0% 0% 0% 0% 0% 0% 0% Nov-05 Dec-05 Jan-06 Feb-06 Mar-06 Apr-06 May-06 Jun-06 Jul-06 Aug-06 Sep-06 Oct-06 Nov-06 Orleans Jefferson St. Bernard Dec-06 Jan-07 Feb-07 Source: Louisiana Hospital Association, individual hospitals in Orleans, Jefferson, and St. Bernard parishes. Notes: The state-licensed hospitals number includes not only hospitals providing acute care, but also psychiatric, long-term disability, and rehabilitation facilities. Numbers were revised to monthly counts in January 2007.
30 Figure 10: Proportion of Operational Child Care Centers in Select Louisiana Parishes 100% 100% 90% 80% 70% 60% 50% 40% 30% 20% 10% 0% Pre-Katrina Feb-06 26% 81% 79% 83% 84% 83% 73% 74% 77% 77% 75% 72% 73% 71% 71% 71% 71% 71% 64% 64% 64% 64% 64% 57% 57% 57% 57% Orleans Jefferson Plaquemines St. Bernard 17% 18% 20% 21% 22% 23% 27% 30% 30% 30% 31% 32% 14% 7% 7% 8% 8% 8% 8% 8% 4% 4% 4% 4% 0% 0% 0% Mar-06 Apr-06 May-06 Jun-06 Jul-06 Aug-06 Sep-06 Oct-06 Nov-06 Dec-06 Jan-07 Feb-07 Mar-07 Source: Agenda for Children, Louisiana Department of Social Services Bureau of Licensing.
31 Figure 12: Unemployment Rates in Orleans Parish, New Orleans MSA, & U.S Orleans Parish 16.0 New Orleans MSA US Jun-05 Jul-05 Aug-05 Sep-05 Oct-05 Nov-05 Dec-05 Jan-06 Feb-06 Mar-06 Source: Lousiana Department of Labor, Bureau of Labor Statistics. Note: Between September 2005 and July 2006, numbers for Orleans Parish were unavailable because of problems with the sample size. In August 2006, the Louisiana Department of Labor (LDOL) again started releasing current and historical labor force data for New Orleans. However, these estimates are not approved by the Bureau of Labor Statistics and LDOL makes the following caveat in their release: Caution should be used when making comparisons with 2005 data for areas affected by Hurricane Katrina since controlling data used in the estimation process cannot fully reflect the known shifts in the population (for more information, please refer to page 13 of Apr-06 May-06 Jun-06 Jul-06 Aug-06 Sep-06 Oct-06 Nov-06 Dec-06 Jan-07 Feb-07
32 Figure 13: Number of Open Hotels in New Orleans Area 100% 90% 80% 82% 82% 82% 82% 82% 84% 79% 77% 70% 62% 66% 69% 60% 50% 50% 40% 30% 20% 21% 10% 0% 89% 90% 90% 91% 87% 88% % Reopened Nov-06 Dec-06 Jan-07 Feb-07 Mar-07 Sep-05 Oct-05 Nov-05 Dec-05 Jan-06 Feb-06 Mar-06 Apr-06 May-06 Jun-06 Jul-06 Aug-06 Sep-06 Oct-06 Source: Major area hotels.

33 Does not include quality data that is in high demand
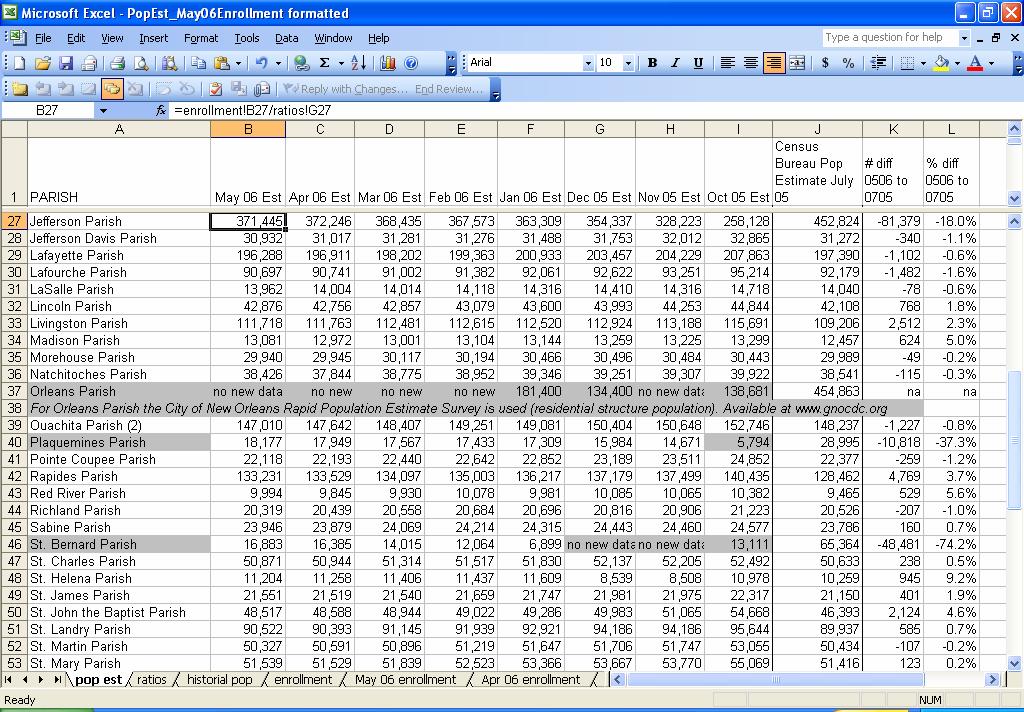
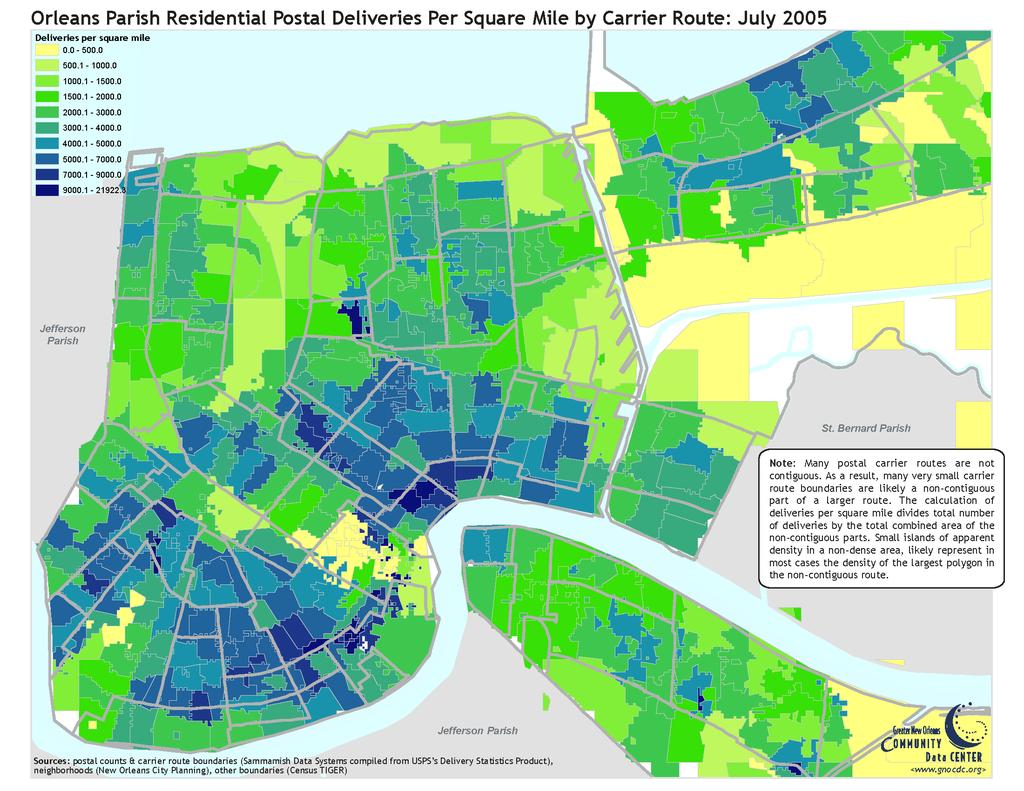
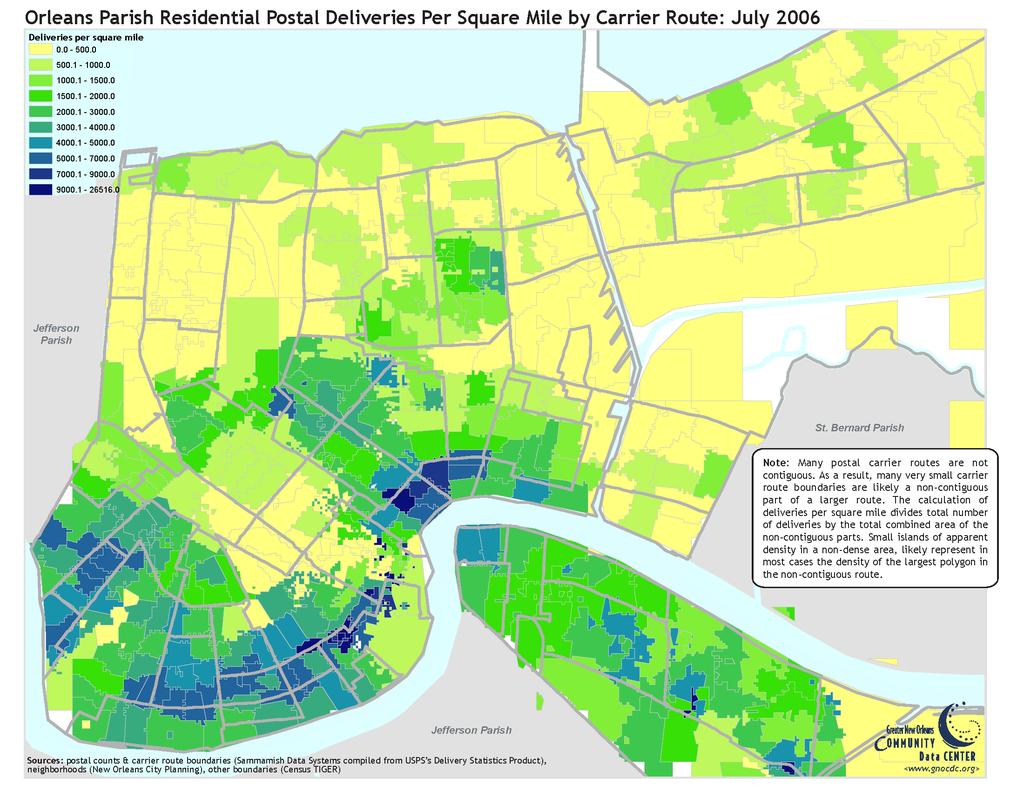
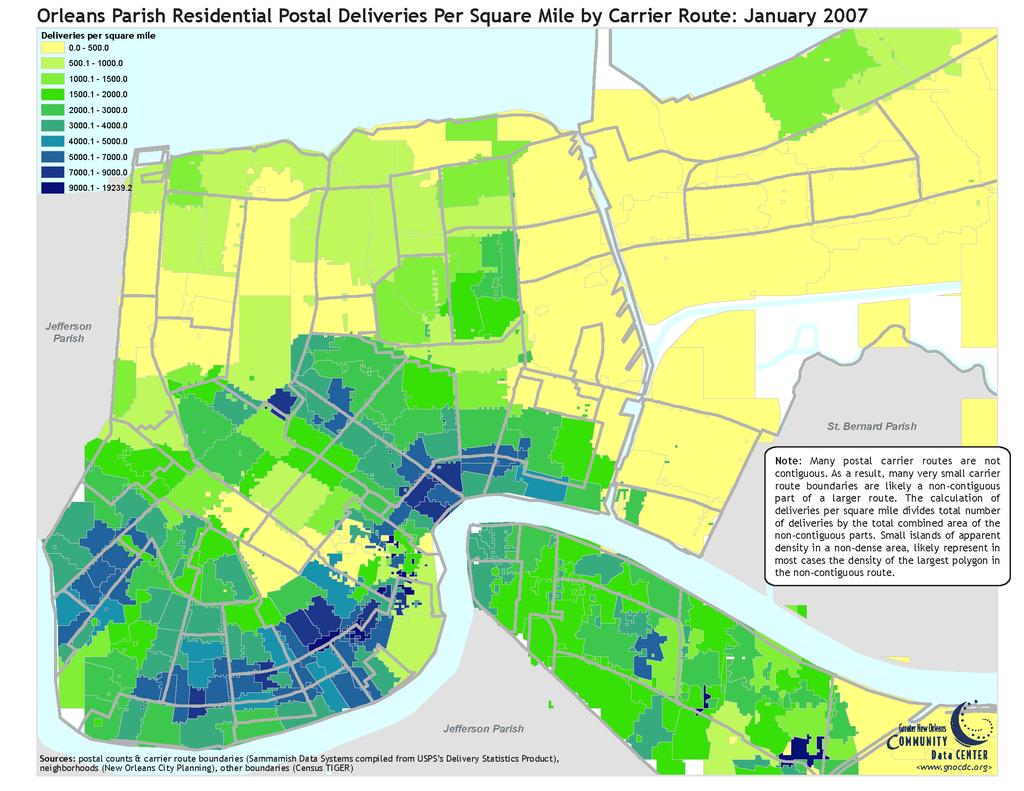
34 Household Population Orleans Parish
35 Public school enrollment in Orleans Parish 70,000 66,372 60,000 50,000 40,000 30,000 20,000 10,000 6,242 9, ,222 10,816 12,103 25,651 Oct-06 Apr-06 Jun-06 Aug-06 Orleans Oct-04 Dec-04 Feb-05 Apr-05 Jun-05 Aug-05 Oct-05 Dec-05 Feb-06
36 Public school enrollment in Orleans Parish 70,000 66,372 60,000 50,000 40,000 30,000 20,000 10,000 6,242 9, ,222 10,816 12,103 25,651 Oct-06 Apr-06 Jun-06 Aug-06 Orleans Oct-04 Dec-04 Feb-05 Apr-05 Jun-05 Aug-05 Oct-05 Dec-05 Feb-06
37
38 Do you know if the monthly population estimates for the Louisiana parishes provided by the Dept. of Health & Hospitals are for a specific day of the month? We would like to compare the monthly parish estimates with the Census Bureau's July 1, 2005 estimates. By knowing the time of the month the DHH estimates are for, we will be able to track better monthly growth rates. We are in the midst of preparing new, accelerated estimates of personal income for metropolitan areas for Obviously, the effects of Katrina on New Orleans will have a major impact on our estimates. Therefore, we are trying to gather as much information as possible to assist us in the development of our estimates. - Bureau of Economic Analysis, US Dept. of Commerce
39 As the statistician for Louisiana OPH HIV/AIDS Program, I am interested in obtaining the latest population estimates available as well as any demographic information that might be available. In order to create program-wide plans for community outreach, surveillance and behavioral survey efforts geographic or neighborhood breakdowns at any level would be immensely useful. In the face of our recovery, these data are of key importance. - Louisiana Office of Public Health
40 We want to know the number of people living in the southeast and southwest parts of the state that speak a language other than English. We are printing evacuation guides, and we are looking at doing versions in Spanish, Vietnamese or French. To do this we need to know how many people fall into that category so we can print enough maps and make a case for funding. - LA Homeland Security and Emergency Preparedness
41 What are the demographics nowadays in New Orleans? Without that information, we can't determine whether a jury is representative of the population." -Orleans Parish Public Defender
42 We need daytime population figures for New Orleans to make informed decisions about the future of television measurement in the market. - Nielsen Media Research
43
44 Do you know what source the USDA used to determine what food allocation we would get? - Second Harvest Food Bank of New Orleans

45 Do you know what source the USDA used to determine what food allocation we would get? - Second Harvest Food Bank of New Orleans I am desperately trying to find that out as well. It comes from the Bureau of Labor Statistics. The basic formula includes both people living below poverty and unemployment numbers. The USDA is bound by law to use these measuring sticks but I am (and have been) questioning where they are getting their raw data to create the percentages. - LA Dept of Agriculture & Forestry

46
47
48
49
50
51
52 Enormous value and demand for data and analysis Enormous demand for a one-stop shop of data Local data is the most difficult to get, but sometimes the most relevant or up-to-date Federal data: lag in reporting, point of contacts changed which created occasional errors Wish list: better partnership with local reporting agencies, better federal data, esp. of federal beneficiaries, better current population and demographic estimates
Using Resettlement Patterns in GIS for New Orleans Recovery. April 10, 2008
 Using Resettlement Patterns in GIS for New Orleans Recovery April 10, 2008 Flood Depth 8/31/05 Repopulation by Flood Depth The degree to which areas have repopulated is almost directly related to the amount
Historical unit prices - Super - Australian Shares
 09 May 2012 $1.0024 $1.0000 16 May 2012 $0.9830 $0.9806 23 May 2012 $0.9414 $0.9392 30 May 2012 $0.9392 $0.9370 06 Jun 2012 $0.9465 $0.9443 14 Jun 2012 $0.9448 $0.9426 20 Jun 2012 $0.9433 $0.9411 27 Jun
Tariff 9900: OHD Percentage Based Fuel Cost Adjustment Historical Schedule ( )
") Tariff 9900: OHD Percentage Based Fuel Cost Adjustment Historical Schedule (2009-2011) Notice: As a consequence of the weather related closure of the EIA, the March 1-15, 2010 applied FCA uses the average
Tariff 9900: OHD Percentage Based Fuel Cost Adjustment Historical Schedule (2009-2011) Notice: As a consequence of the weather related closure of the EIA, the March 1-15, 2010 applied FCA uses the average
BADAN PUSAT STATISTIK KEPALA BADAN PUSAT STATISTIK 1
 www.bps.go.id BADAN PUSAT STATISTIK KEPALA BADAN PUSAT STATISTIK 1 INDONESIA DURING THE GLOBAL ECONOMIC CRISIS: 2008 2009 HOW DEEP THE IMPACT? ISTANBUL, TURKEY MARCH 2010 BPS Statistics Indonesia 2 BPS
Cairns Airport financial year passenger totals.
 Cairns Airport financial year passenger totals. FY2005 Jul 2004 389,426 39,425 36,587 76,012 135,133 137,283 272,416 40,998 Aug 2004 387,617 37,727 43,392 81,119 132,192 135,417 267,609 38,889 Sep 2004
2. Do you approve or disapprove of the job Congress is doing? Dec 07 25% Democrats 62% Nov 07 26% Republicans 19% 74 8
 19 February 2009 Polling was conducted by telephone February 17-18, 2009, in the evenings. The total sample is 900 registered voters nationwide with a margin of error of ±3 percentage points. Results are
WISCONSIN ECONOMIC SCORECARD
 RESEARCH BRIEF Q4 2013 Joseph Cera, PhD CUIR Survey Center University of Wisconsin Milwaukee WISCONSIN ECONOMIC SCORECARD The Wisconsin Economic Scorecard is a quarterly poll of Wisconsin residents conducted
(READ AND RANDOMIZE LIST)
") 10 December 2009 Polling was conducted by telephone December 8-9, 2009, in the evenings. The total sample is 900 registered voters nationwide with a margin of error of ±3 percentage points. Results are
10 December 2009 Polling was conducted by telephone December 8-9, 2009, in the evenings. The total sample is 900 registered voters nationwide with a margin of error of ±3 percentage points. Results are
FOR RELEASE DECEMBER 14, 2017
 FOR RELEASE DECEMBER 14, 2017 FOR MEDIA OR OTHER INQUIRIES: Carroll Doherty, Director of Political Research Jocelyn Kiley, Associate Director, Research Olivia O Hea, Communications Assistant 202.419.4372
Broward by the Numbers 1
 Broward County experiences a net loss of during the daytime, because many residents commute to neighboring counties. Within the County, Fort Lauderdale, Pompano Beach, Deerfield Beach and Pembroke Park
2. Do you approve or disapprove of the job Congress is doing?
 30 September 2010 Polling was conducted by telephone September 28-29, 2010, in the evenings. The total sample is 900 registered voters nationwide with a margin of sampling error of 3 percentage points.
United States Government Accountability Office GAO. Report to Congressional Committees. September 2006 DISASTER RELIEF
 GAO United States Government Accountability Office Report to Congressional Committees September 2006 DISASTER RELIEF Governmentwide Framework Needed to Collect and Consolidate Information to Report on
FOX News/Opinion Dynamics Poll 2 March 06
 FOX News/Opinion Dynamics Poll 2 March 06 Polling was conducted by telephone February 28-March 1, 2006, in the evenings. The total sample is 900 registered voters nationwide with a margin of error of ±3
FISCAL POLICY INSTITUTE
 FISCAL POLICY INSTITUTE Learning from the 90s How poor public choices contributed to income erosion in New York City, and what we can do to chart an effective course out of the current downturn Labor Day,
WISCONSIN ECONOMIC SCORECARD
 RESEARCH BRIEF Q1 2014 Joseph Cera, PhD CUIR Survey Center University of Wisconsin Milwaukee WISCONSIN ECONOMIC SCORECARD The Wisconsin Economic Scorecard is a quarterly poll of Wisconsin residents conducted
Georgia. South Georgia
 1 South Georgia Business Outlook South Georgia Business Outlook Center for Business and Economic Research Langdale College of Business Valdosta State University Volume 6, Number 1 First Quarter 2010 The
2. Do you approve or disapprove of the job Congress is doing? Sep 08 17% 73 9 Democrats 28% Sep 08 23% 68 8 Republicans 10% 87 3
 18 March 2010 Polling was conducted by telephone March 16-17, 2010, in the evenings. The total sample is 900 registered voters nationwide with a margin of error of 3 percentage points. Results are of registered
6. 9. How frustrated and upset are you with [ITEM] these days? (RANDOMIZE)
![6. 9. How frustrated and upset are you with [ITEM] these days? (RANDOMIZE)](/thumbs/82/85635278.jpg "6. 9. How frustrated and upset are you with [ITEM] these days? (RANDOMIZE)") 22 April 2010 Polling was conducted by telephone April 20-21, 2010, in the evenings. The total sample is 900 registered voters nationwide with a margin of error of 3 percentage points. Results are of registered
22 April 2010 Polling was conducted by telephone April 20-21, 2010, in the evenings. The total sample is 900 registered voters nationwide with a margin of error of 3 percentage points. Results are of registered
Contents. Employment Rate & Labor Market Workforce Size Data 1 Page 3. Industry Growth by County Page 3-4. Occupational Predictions Region-wide Page 4
 2 Contents Rate & Labor Market Workforce Size Data 1 Page 3 Industry Growth by County Page 3-4 Occupational Predictions Region-wide Page 4 Skills of Seekers versus Available Jobs Page 5 Job Seeker Demographics
THE GEORGE WASHINGTON BATTLEGROUND POLL
 THE GEORGE WASHINGTON BATTLEGROUND POLL A national survey of 1,000 Registered Likely Voters Do you feel things in the country are going in the right direction, or do you feel things have gotten off on
1Business Bulletin. 2Bfor the Free State of Saxony. June/Julyi 2010
 1Business Bulletin 2Bfor the Free State of Saxony June/Julyi 4BContents: Page 5BEconomic Trend 3 Business Registry 6 7BPrice Trend 6 Guarantees and Investments 6 8BConstruction Industry 6 9BIndustry 8
2017 Nonresident Visitation, Expenditures & Economic Impact Estimates
 University of Montana ScholarWorks at University of Montana Institute for Tourism and Recreation Research Publications Institute for Tourism and Recreation Research 3-2018 2017 Nonresident Visitation,
Biggest Stories of 2008: Economy Tops Campaign INTERNET OVERTAKES NEWSPAPERS AS NEWS OUTLET
 NEWS Release. 1615 L Street, N.W., Suite 700 Washington, D.C. 20036 Tel (202) 419-4350 Fax (202) 419-4399 FOR IMMEDIATE RELEASE: Tuesday, December 23, 2008 FOR FURTHER INFORMATION: Andrew Kohut, Director
WISCONSIN ECONOMIC SCORECARD
 RESEARCH BRIEF Q2 2013 Joseph Cera Manager CUIR Survey Center University of Wisconsin Ben Gilbertson Project Assistant CUIR Survey Center University of Wisconsin WISCONSIN ECONOMIC SCORECARD The Wisconsin
WISCONSIN ECONOMIC SCORECARD
 RESEARCH BRIEF Q3 2013 Joseph Cera, PhD Manager CUIR Survey Center University of Wisconsin Milwaukee WISCONSIN ECONOMIC SCORECARD The Wisconsin Economic Scorecard is a quarterly poll of Wisconsin residents
13 May Questions 1-14 released separately
 13 May 2010 Polling was conducted by telephone May 4-5, 2010, in the evenings. The total sample is 900 registered voters nationwide with a margin of sampling error of 3 percentage points. Results are of
7 May Questions 1-16 released separately
 7 May 2010 Polling was conducted by telephone May 4-5, 2010, in the evenings. The total sample is 900 registered voters nationwide with a margin of sampling error of 3 percentage points. Results are of
ASYLUM STATISTICS 2016
 ASYLUM STATISTICS 216 GENERAL OVERVIEW ASYLUM APPLICATIONS 2,16 Number of persons who introduced a first application * 14,67 Number of persons who introduced a subsequent asylum application 4,4 Total 18,71
Economic Research Institute of Erie Black School of Business
 Economic Research Institute of Erie Black School of Business Dr. Kenneth Louie Director, ERIE 13 th ERIE Conference July 27, 2016 www.eriedata.org Thank you to our Sponsors! Gold Sponsors Silver Sponsors
CRS Report for Congress
 Order Code RS22239 Updated August 22, 2006 CRS Report for Congress Received through the CRS Web Emergency Supplemental Appropriations for Hurricane Katrina Relief Keith Bea Specialist in American National
2. Do you approve or disapprove of the job Barack Obama is doing on the economy? Approve Disapprove (Don t know) Sep 10 40% 56 Democrats 75%
 Sep 10 40% 56 Democrats 75%") 17 September 2010 Polling was conducted by telephone September 14-16, 2010, in the evenings. The total sample is 900 registered voters nationwide with a margin of sampling error of 3 percentage points.
17 September 2010 Polling was conducted by telephone September 14-16, 2010, in the evenings. The total sample is 900 registered voters nationwide with a margin of sampling error of 3 percentage points.
CHARLOTTE: FACING THE CHALLENGES OF ECONOMIC OPPORTUNITY AND MOBILITY
 CHARLOTTE: FACING THE CHALLENGES OF ECONOMIC OPPORTUNITY AND MOBILITY Owen Furuseth, PhD, Associate Provost, Metropolitan Studies and Extended Academic Programs, UNC Charlotte Presentation to Integrated
FOR RELEASE NOVEMBER 07, 2017
 FOR RELEASE NOVEMBER 07, 2017 FOR MEDIA OR OTHER INQUIRIES: Carroll Doherty, Director of Political Research Jocelyn Kiley, Associate Director, Research Bridget Johnson, Communications Associate 202.419.4372
Logical Framework Planning Matrix: Armenian Red Cross Disaster Management Programme/Population Movement Project
 Logical Framework Planning Matrix: Armenian Red Cross Disaster Management Programme/Population Movement Project Indicators Sources of verification Assumption/risks Overall Goal Vulnerability of population
Third Quarter. July September 2016
 Third Quarter July September 2016 Highlights Third quarter showed positive momentum for design industry. September s ASID Interior Design Billings Index (IDBI) value slipped to a score 54.0 from June s
Jail Population Trend Report April - June 2016
 Jail Population Trend Report April - June 206 Prepared by Mecklenburg County Criminal Justice Services Planning This report identifies and tracks emerging trends that may influence the operation of the
Counting for Dollars: The Role of the Decennial Census in the Geographic Distribution of Federal Funds
 THE GEORGE WASHINGTON INSTITUTE OF PUBLIC POLICY Counting for Dollars: The Role of the Decennial Census in the Geographic Distribution of Federal Funds Initial Analysis: 16 Largest Census-guided Programs
Political Environment and Congressional Breakdown Charts. November 7, 2017
 Political Environment and Congressional Breakdown Charts November 7, 217 Presidential Job Approval: Gallup Polling Gallup Weekly Presidential Job Approval Ratings: YTD Do you approve or disapprove of the
OVERNIGHT SENSATION GUERGIS EFFECT DISAPPEARS
 www.ekospolitics.ca OVERNIGHT SENSATION GUERGIS EFFECT DISAPPEARS [Ottawa April 22, 2010] - If the Liberals were briefly vaulted into a virtual tie with the Conservatives on the strength of public outrage
AsianBondsOnline WEEKLY DEBT HIGHLIGHTS
 AsianBondsOnline WEEKLY November 6 Key Developments in Asian Local Currency Markets Japan s real gross domestic product (GDP) growth accelerated to.% quarter-on-quarter in the third quarter (Q) of 6 from.%
EUROPE REFUGEES & MIGRANTS EMERGENCY RESPONSE NATIONALITY OF ARRIVALS TO GREECE, ITALY AND SPAIN
 EUROPE REFUGEES & MIGRANTS EMERGENCY RESPONSE NATIONALITY OF ARRIVALS TO GREECE, ITALY AND SPAIN January 2015 March 2016 Based on Government data from January 2015 to March 2016 Total Arrivals in 2015
Contents About this Report August 2017 Border Summary Housing
 Contents About this Report... 2 August 2017 Border Summary... 3 Gross Metropolitan Product... 7 Business Cycle Index... 7 Total Construction Values... 8 Residential Construction Values... 8 Nonresidential
Government Gets High Marks for Response to Fires CALIFORNIA WILDFIRES DRAW LARGE AUDIENCE
 NEWS Release. 1615 L Street, N.W., Suite 700 Washington, D.C. 20036 Tel (202) 419-4350 Fax (202) 419-4399 FOR IMMEDIATE RELEASE: Thursday, November 1, 2007 FOR FURTHER INFORMATION: Andrew Kohut, Director
FOR RELEASE: TUESDAY, FEBRUARY 17 AT 12:30 PM
 Interviews with 1,023 adult Americans, including 954 registered voters, conducted by telephone by Opinion Research Corporation on February 12-15, 2010. The margin of sampling error for results based on
COOLIDGE POLICE DEPARTMENT. Monthly Activity Report
 COOLIDGE POLICE DEPARTMENT Monthly Activity Report April 214 Count Coolidge Police Department 214 Uniform Crime Report & Traffic Data 213 January February March April May June July August September October
RECOMMENDED CITATION: Pew Research Center, May, 2015, Negative Views of New Congress Cross Party Lines
 NUMBERS, FACTS AND TRENDS SHAPING THE WORLD FOR RELEASE MAY 21, 2015 FOR FURTHER INFORMATION ON THIS REPORT: Carroll Doherty, Director of Political Research Jocelyn Kiley, Associate Director, Research
Report on the Implementation of the Public Information Interim Policy (November 2017 to September 2018)
") Report on the Implementation of the Public Information Interim Policy (November 2017 to September 2018) 1. Introduction As a 21st century multilateral development bank (MDB), the Asian Infrastructure Investment
Report on the Implementation of the Public Information Interim Policy (November 2017 to September 2018) 1. Introduction As a 21st century multilateral development bank (MDB), the Asian Infrastructure Investment
Record Number Favors Removing U.S. Troops from Afghanistan
 TUESDAY, JUNE 21, 2011 Record Number Favors Removing U.S. Troops from Afghanistan FOR FURTHER INFORMATION CONTACT: Andrew Kohut President, Pew Research Center Carroll Doherty and Michael Dimock Associate
FOX News/Opinion Dynamics Poll 28 September 06
 FOX News/Opinion Dynamics Poll 28 September 06 Polling was conducted by telephone September 26-27, 2006, in the evenings. The total sample is 900 likely voters (LV) nationwide, with a margin of error of
Racial Inequities in Montgomery County
 W A S H I N G T O N A R E A R E S E A R C H I N I T I A T I V E Racial Inequities in Montgomery County Leah Hendey and Lily Posey December 2017 Montgomery County, Maryland, faces a challenge in overcoming
Hired Labor Use in the Texas Fresh Fruit and Vegetable Industry
 Hired Labor Use in the Texas Fresh Fruit and Vegetable Industry Parr Rosson, Flynn Adcock, Marco Palma and Luis Ribera 1 CNAS 2008-01 April 2008 1 Rosson is Professor and Director, Center for North American
MONTHLY MIGRATION TRENDS
 MONTHLY MIGRATION TRENDS MARCH 2010 DOL11131.10 MAR 10 MIGRATION TRENDS KEY INDICATORS REPORT: MARCH 2010 Purpose This report provides a brief summary of migration trends for the 2009/10 financial year
July 10, First Street NE, Suite 510 Washington, DC Tel: Fax:
 820 First Street NE, Suite 510 Washington, DC 20002 Tel: 202-408-1080 Fax: 202-408-1056 center@cbpp.org www.cbpp.org July 10, 2007 MEDICAID DOCUMENTATION REQUIREMENT DISPROPORTIONATELY HARMS NON-HISPANICS,
Canadian Citizenship
 Canadian Citizenship From Harder to get and easier to lose to a new balance Andrew Griffith Metropolis Toronto March 2016 Agenda Policy context Statistics 2010 Changes and impact 2014 Changes and expected
Political Environment and Congressional Breakdown Charts. December 12, 2017
 Political Environment and Congressional Breakdown Charts December 12, 217 Presidential Job Approval: Gallup Polling Gallup Weekly Presidential Job Approval Ratings: YTD Do you approve or disapprove of
RECOMMENDED CITATION: Pew Research Center, February, 2015, Growing Support for Campaign Against ISIS - and Possible Use of U.S.
 NUMBERS, FACTS AND TRENDS SHAPING THE WORLD FOR RELEASE FEBRUARY 24, 2015 FOR FURTHER INFORMATION ON THIS REPORT: Carroll Doherty, Director of Political Research Rachel Weisel, Communications Associate
RECOMMENDED CITATION: Pew Research Center, October, 2015, On Immigration Policy, Wider Partisan Divide Over Border Fence Than Path to Legal Status
 NUMBERS, FACTS AND TRENDS SHAPING THE WORLD FOR RELEASE OCTOBER 8, 2015 FOR FURTHER INFORMATION ON THIS REPORT: Carroll Doherty, Director of Political Research Rob Suls, Research Associate Bridget Jameson,
Evaluating Methods for Estimating Foreign-Born Immigration Using the American Community Survey
 Evaluating Methods for Estimating Foreign-Born Immigration Using the American Community Survey By C. Peter Borsella Eric B. Jensen Population Division U.S. Census Bureau Paper to be presented at the annual
FOR RELEASE: THURSDAY, JULY 22 AT NOON
 Interviews with 1,018 adult Americans conducted by telephone by Opinion Research Corporation on July 16-21, 2010. The margin of sampling error for results based on the total sample is plus or minus 3 percentage
ECONOMY MICROCLIMATES IN THE PORTLAND-VANCOUVER REGIONAL ECONOMY
 MICROCLIMATES IN THE PORTLAND-VANCOUVER REGIONAL by Sheila Martin, Director of the Institute of Portland Metropolitan Studies, Portland State University 1 Introduction The Regional Labor Market Portland-Vancouver
FOX News/Opinion Dynamics Poll 10 November 05
 FOX News/Opinion Dynamics Poll 10 November 05 Polling was conducted by telephone November 8-9, 2005 in the evenings. The total sample is 900 registered voters nationwide with a margin of error of ±3 percentage
Visi n. Imperative 6: A Prosperous Economy
 Imperative 6: A Prosperous Economy North Carolina 20/20: Report of the North Carolina Progress Board 6.1 2 2 Visi n North Carolina s growing, diversified economy is competitive in the global marketplace.
FOR RELEASE: WEDNESDAY, SEPTEMBER 2 AT 2 PM
 Interviews with 1,010 adult Americans, conducted by telephone by Opinion Research Corporation on August 28-31,. The margin of sampling error for results based on the total sample is plus or minus 3 percentage
RECOMMENDED CITATION: Pew Research Center, February, 2017, In Trump Era, What Partisans Want From Their Congressional Leaders
 NUMBERS, FACTS AND TRENDS SHAPING THE WORLD FOR RELEASE FEBRUARY 22, 2017 FOR MEDIA OR OTHER INQUIRIES: Carroll Doherty, Director of Political Research Jocelyn Kiley, Associate Director, Research Bridget
Characteristics of the Ethnographic Sample of First- and Second-Generation Latin American Immigrants in the New York to Philadelphia Urban Corridor
 Table 2.1 Characteristics of the Ethnographic Sample of First- and Second-Generation Latin American Immigrants in the New York to Philadelphia Urban Corridor Characteristic Females Males Total Region of
U.S. Emerging Markets: The Rise of America s Sunbelt Cities and the Implications for Real Estate
 PUB LI C SECUR I T I E S G R O UP i 3Q 2018 R E AL E S TAT E U.S. Emerging Markets: The Rise of America s Sunbelt Cities and the Implications for Real Estate EXECUTIVE SUMMARY Recent high-profile corporate
Washington Area Economy: Performance and Outlook
 Washington Area Economy: Performance and Outlook Presentation to: Arlington Economic Development Commission Mark C. White, Ph.D. Deputy Director Center for Regional Analysis Schar School of Policy and
High Marks for Obama s Speech AFTER BUSY WEEK, VIEWS OF BOTH CANDIDATES IMPROVE
 NEWS Release. 1615 L Street, N.W., Suite 700 Washington, D.C. 20036 Tel (202) 419-4350 Fax (202) 419-4399 FOR IMMEDIATE RELEASE: Wednesday, September 3, 2008 FOR FURTHER INFORMATION: Andrew Kohut, Director
The William C. Davis Collection. Records, (Predominantly, ) 6.5 linear feet
 6.5 linear feet") The William C. Davis Collection Records, 1931-1972 (Predominantly, 1964-1972) 6.5 linear feet Accession No: 547 L.C. Number MS The Davis C. W i l l i a m Collection was placed in the Archives of Labor
The William C. Davis Collection Records, 1931-1972 (Predominantly, 1964-1972) 6.5 linear feet Accession No: 547 L.C. Number MS The Davis C. W i l l i a m Collection was placed in the Archives of Labor
National Security and the 2008 Election
 Click to edit Master title style April 3, 2008 National Security and the 2008 Election Democracy Corps Fourth and level Greenberg Quinlan Rosner March 25-27, 2008 1000 likely voters nationwide Click to
Congressional Official Mail Costs
 Matthew Eric Glassman Analyst on the Congress August 16, 2010 Congressional Research Service CRS Report for Congress Prepared for Members and Committees of Congress 7-5700 www.crs.gov RL34188 Summary The
Political Environment and Congressional Breakdown Charts. August 23, 2017
 Political Environment and Congressional Breakdown Charts August 23, 217 Presidential Job Approval: Gallup Polling Gallup Weekly Presidential Job Approval Ratings: YTD Do you approve or disapprove of the
Growing Number Sees U.S. Divided Between Haves and Have-Nots KATRINA RELIEF EFFORT RAISES CONCERN OVER EXCESSIVE SPENDING, WASTE
 NEWS RELEASE 1615 L Street, N.W., Suite 700 Washington, D.C. 20036 Tel (202) 419-4350 Fax (202) 419-4399 For Immediate Release: October 19, 2005 FOR FURTHER INFORMATION Andrew Kohut, Director Growing Number
RESEARCH BRIEF: The State of Black Workers before the Great Recession By Sylvia Allegretto and Steven Pitts 1
 July 23, 2010 Introduction RESEARCH BRIEF: The State of Black Workers before the Great Recession By Sylvia Allegretto and Steven Pitts 1 When first inaugurated, President Barack Obama worked to end the
Public Opinion on Health Care Issues
 Public Opinion on Health Care Issues EARLY REACTION TO SUPREME COURT DECISION ON THE ACA MAJORITY OF AMERICANS REPORT BEING AWARE OF SUPREME COURT DECISION; THEIR REACTION? DIVIDED It can take a lot to
Public Opinion on Health Care Issues October 2012
 Public Opinion on Health Care Issues October 2012 One week before the 2012 presidential election, health policy issues including Medicare and the Affordable Care Act (ACA) remain a factor in voters views
TREND: Do you approve or disapprove of the way Charles Schumer is handling his job as United States Senator? (* High also 69%)
") TREND: Do you approve or disapprove of the way Andrew Cuomo is handling his job as governor? Mar 20, 2019 50 41 9 Jan 23, 2019 48 40 12 Jul 18, 2018 49 43 8 May 02, 2018 54 39 7 Feb 14, 2018 47 37 17 Jul
TREND: Do you approve or disapprove of the way Andrew Cuomo is handling his job as governor? Mar 20, 2019 50 41 9 Jan 23, 2019 48 40 12 Jul 18, 2018 49 43 8 May 02, 2018 54 39 7 Feb 14, 2018 47 37 17 Jul
Apr 13 Partisan Dem Dem Ind Ind Gop Gop
 EPIC MRA STATEWIDE POLL OF ACTIVE VOTERS [FREQUENCY REPORT OF SURVEY RESPONSES 600 SAMPLE ERROR ±4.0%] LIVE INTERVIEWS 20% CELL PHONES Polling Dates: April 13th, 2013 through April 16th, 2013 Direction
Political Environment and Congressional Breakdown Charts. October 17, 2017
 Political Environment and Congressional Breakdown Charts October 17, 217 Presidential Job Approval: Gallup Polling Gallup Weekly Presidential Job Approval Ratings: YTD Do you approve or disapprove of the
RECOMMENDED CITATION: Pew Research Center, May, 2015, Republicans Early Views of GOP Field More Positive than in 2012, 2008 Campaigns
 NUMBERS, FACTS AND TRENDS SHAPING THE WORLD FOR RELEASE MAY 19, 2015 FOR FURTHER INFORMATION ON THIS REPORT: Carroll Doherty, Director of Political Research Jocelyn Kiley, Associate Director, Research
RECOMMENDED CITATION: Pew Research Center, March, 2015, More Approve Than Disapprove of Iran Talks, But Most Think Iranians Are Not Serious
 NUMBERS, FACTS AND TRENDS SHAPING THE WORLD FOR RELEASE MARCH 30, 2015 FOR FURTHER INFORMATION ON THIS REPORT: Carroll Doherty, Director of Political Research Alec Tyson, Senior Researcher Seth Motel,
DEFINITIONS USED Incoming individuals observed: This refers to individuals who arrive at a flow
 POPULATION MONITORING NIGER - OVERVIEW IOM is working with national and local authorities in order to gain better understanding of population movements throughout West and Central Africa. Flow Monitoring
THE STATE OF WORKING FLORIDA
 1 THE STATE OF WORKING FLORIDA 2 LABOR DAY SEPTEMBER 3, 2012 THE STATE OF WORKING FLORIDA 2012 by BERNARDO OSEGUERA ACKNOWLEDGEMENTS Special thanks to Emily Eisenhauer and Alayne Unterberger who reviewed
Public Wants More Coverage of U.S. Troops IRAQ NEWS: LESS DOMINANT, STILL IMPORTANT
 NEWS Release. 1615 L Street, N.W., Suite 700 Washington, D.C. 20036 Tel (202) 419-4350 Fax (202) 419-4399 FOR IMMEDIATE RELEASE: Friday, November 9, 2007 FOR FURTHER INFORMATION: Andrew Kohut, Director
FOR RELEASE: TUESDAY FEBRUARY 17 at 6:00 a.m. ET
 Interviews with 1,027 adult Americans conducted by telephone by ORC International on February 12-15, 2015. The margin of sampling error for results based on the total sample is plus or minus 3 percentage
The State of Rural Minnesota, 2019
 P.O. Box 3185 Mankato, MN 56002-3185 (507)934-7700 www.ruralmn.org The State of Rural Minnesota, 2019 January 2019 By Kelly Asche, Research Associate Each year, the Center for Rural Policy and Development
Reference services are provided through in-person visits, by telephone, via , through chat and by regular mail correspondence.
 Summary The provides reference assistance to the Judiciary (judges, law clerks, administrative staff), the bar, and the public. The public includes self-represented litigants (SRLs), students, legal researchers,
RECOMMENDED CITATION: Pew Research Center, March, 2017, Large Majorities See Checks and Balances, Right to Protest as Essential for Democracy
 NUMBERS, FACTS AND TRENDS SHAPING THE WORLD FOR RELEASE MARCH 2, 2017 FOR MEDIA OR OTHER INQUIRIES: Carroll Doherty, Director of Political Research Jocelyn Kiley, Associate Director, Research Bridget Johnson,
Most Say Immigration Policy Needs Big Changes
 MAY 9, 2013 But Little Agreement on Specific Approaches Most Say Immigration Policy Needs Big Changes FOR FURTHER INFORMATION CONTACT THE PEW RESEARCH CENTER FOR THE PEOPLE & THE PRESS Michael Dimock Director
US MOBILE NEWS SEEKING TRENDS. Based on October September 2015 data. Excerpted from a full findings report delivered November 2015.
 US MOBILE NEWS SEEKING TRENDS Based on October 2013- September 2015 data. Excerpted from a full findings report delivered November 2015. BACKGROUND Knight Foundation commissioned Nielsen to delve into
RECOMMENDED CITATION: Pew Research Center, July, 2014, Most Think the U.S. Has No Responsibility to Act in Iraq
 NUMBERS, FACTS AND TRENDS SHAPING THE WORLD FOR RELEASE JULY 18, 2014 FOR FURTHER INFORMATION ON THIS REPORT: Carroll Doherty, Director of Political Research Danielle Gewurz, Research Analyst Seth Motel,
Herald-Tribune. Sarasota/Bradenton/Venice Market
 Herald-Tribune Sarasota/Bradenton/Venice Market Sarasota/Bradenton/Venice Market Sarasota/Bradenton/Venice is the fifth largest market in the state of Florida. Top 10 Florida Markets Population Miami/Ft
Contents About this Report September 2017 Border Summary Housing
 Contents About this Report... 2 September 2017 Border Summary... 3 Business Cycle Index... 7 Total Construction Values... 7 Residential Construction Values... 8 Nonresidential Construction Values... 8
Rep Dem Party Party DK/NA
 TREND: If the election were today, would you want to see the Republican Party or the Democratic Party win control of the United States House of Representatives? Rep Dem Party Party DK/NA Feb 20, 2018 38
Most are skeptical Trump will act to block future Russian meddling
 FOR RELEASE MARCH 15, 2018 Public Confidence in Mueller s Investigation Remains Steady Most are skeptical Trump will act to block future Russian meddling FOR MEDIA OR OTHER INQUIRIES: Carroll Doherty,
Marijuana: FACT SHEET December 2018
 December 1 New York State Law: Marijuana: In New York State, it is illegal to smoke or possess marijuana. 1 Smoking or possessing a small amount of marijuana in public is a class B misdemeanor, which is
Gone to Texas: Migration Vital to Growth in the Lone Star State. Pia Orrenius Federal Reserve Bank of Dallas June 27, 2018
 Gone to Texas: Migration Vital to Growth in the Lone Star State Pia Orrenius Federal Reserve Bank of Dallas June 27, 2018 Roadmap History/Trends in migration to Texas Role in economic growth Domestic migration
Sara/Mana. Sarasota/Bradenton/Venice Market
 Sara/Mana Sarasota/Bradenton/Venice Market Sara/Mana Zone Population fluctuates from 430,000 in the summer to 640,000 in winter. 601 639 626 Average Population by Month (000) 561 488 442 431 433 448 486
Home Office Statistical Bulletin
 Home Office Statistical Bulletin The Research, Development and Statistics Directorate exists to improve policy making, decision taking and practice in support of the Home Office purpose and aims, to provide
Content: Arrivals to Europe Overview, Relocations, Migrants Presence, Transit Countries, Overview Maps, Fatalities in the Mediterranean and Aegean
 Cover: IOM Bulgaria integration program. Nikolay Doychinov/IOM 2017 TOTAL ARRIVALS 186,768 Developments MIGRATION FLOWS TO EUROPE TOTAL ARRIVALS TO EUROPE172,362 14,406 TO EUROPE BY SEA 2017 OVERVIEW Content: