2012 Presidential Elections
|
|
|
- Lionel Phelps
- 6 years ago
- Views:
Transcription


1 Weaknesses and strengths of France in the euro zone The challenge of reconvergence March 2012
2 This report was prepared by the team of economists at Coe-Rexecode under the direction of Gilles Koléda. Composition and Graphics The maps were created with the help of the software Cartes & Données de chez Articque by Aurelie Heuzé s statistical team, and the graphics were done by Dominique Dalle-Molle. The composition is the work of Martine Grangé, Françoise Saint-Louis and the Regards Conseil Agency


3 SUMMARY Editorial The challenge of the reconvergence The euro zone Problems in its divergences France in the euro zone Weaknesses and delays in adaptation 21 Reconverging Absolute priority for the euro zone 25 Opportunities and strengths for France 33 Some information on these comparisons 34 Annexes All the figures used in the tables and the maps of this report are given in the Annex starting on page 33, which cites the statistical sources used. This entire report is available on the Internet at 1
4 Présidentielles 2012 Faits et chiffres 2 Éditorial The challenge of reconvergence The future of the euro zone and France s economic policies are at the center of debates and Presidential platforms. To allow everyone to evaluate France s situation in its European environment, Coe-Rexecode has put under the scanner the 17 countries which make up the euro zone and produced 13 maps and 9 particularly representative graphics and tables. These precise x-rays, complete and previously unpublished, show the weaknesses of France, but also the strengths on which France can rely to once again make economic progress. The future of the euro zone and France s economic policies are at the center of debates and Presidential platforms. To allow everyone to evaluate France s situation in its European environment, Coe- Rexecode has put under the scanner the 17 countries which make up the euro zone and produced 13 maps and 9 particularly representative graphics and tables. These precise x-rays, complete and previously unpublished, show the weaknesses of France, but also the strengths on which France can rely to once again make economic progress. France played a determining role in the foundation and the evolution of the European Union and the euro zone. European construction has not always advanced but neither has it ever regressed. It should be noted that this union of States is governed by the community principle: everything, in principle, is decided together, except for certain decisions of the qualified majority and certain areas, such as foreign tariffs, which have been delegated to the Union. On the other hand, that which has not been explicitly delegated falls within the competence of the States. Public spending, taxation, and social laws always fall within this category. This explains why policies conducted individually by the countries of the euro-zone in these fundamental areas have given rise, over time, to profound divergences which today threaten the growth, and even beyond that, the cohesion of the Monetary Union. While the initial objective of the establishment of the euro was to integrate and to bring together the European countries, it turns out that the euro has given rise to long-lasting divergences, long ignored when they were believed to be without concrete consequences. The euro has even nourished the faulty illusion that budgetary constraints and foreign constraints had disappeared. The shock of the world crisis has exploded these pipe dreams. It has brutally exposed the dangers that these public finance and competitiveness differences pose within the same monetary zone. Even France, though being a founding country of the euro, only realized belatedly the obligations implied by 2
5 Présidentielles 2012 Faits et chiffres having a sole currency. France did not take advantage of the favorable world economic conditions at the beginning of the years 2000 to restore the balance of its public accounts. It engaged in a restrictive policy of work and productive supply, at a time when, instead, the euro needed to strengthen its competitiveness. It favored supporting demand at a time when the constraint of the industrial supply limited the capacity of the country s growth. The maps and the data put into perspective in this report clearly show the fracture lines which are opening up between the national territories. The similarities of the maps of competitiveness, costs, deficits, debt, deindustrialization and unemployment are particularly striking. France is far from finding itself in the perilous situation of some of the peripheral States. It often occupies an intermediary position, between a group of Northern European countries (including Germany) and certain Southern European countries (including Italy and Spain). France s drifts in direction can, however, cause fear that it is dangerously approaching this second group of countries. It is a known fact that France has shown weaknesses and delays in structural adaptation. But it also possesses some powerful strengths: a dynamic demography, a weak employment rate and work week which offer a high potential for growth and purchasing power, and a State whose financial credibility remains very strong. Some of the past weaknesses can become real opportunities, on the condition, of course, that necessary reforms are taken, amplified and brought to term. Our conviction is that new headway into European integration, around the historic heart of Europe, constitutes the most desirable path for the economic future of the euro zone. This new headway can only take place in a climate of mutual trust. The object of the new Treaty is to re-establish this trust by setting up strict rules. Its effective implementation is the first condition for a return to sustained growth for all. France and Germany are the first guarantors of the euro zone. The reconvergence of the French and German economies is not a mode but a vital stake in Europe and the only possible path out of this crisis. Any hesitation or divergence from this path would only relaunch the European crisis and prolong economic stagnation. It is up to these two pillars of the euro countries to work together towards this reconvergence. It is their responsibility. For France, this consists, first of all, of the necessity of restoring its financial balance and strengthening its competitiveness. Michel DIDIER 3
6

7 The euro zone Problems in its divergences The euro zone, globally, does not present a major imbalance in relation to other large world regions 6 A geographic fragmentation which largely coincides with economic variances 7 The differences between the rates of return of State bonds continue to widen 8 Foreign trade balances, symptoms of competitiveness gaps 9 Levels of public deficit very disparate between the States of the euro zone 10 A risk of an explosion in public debt (as a percentage of GDP) if the levels of current deficits remain unchanged 11 5
8 The euro zone, globally, does not present a major imbalance in relation to other large world regions Public deficit, current account balance, average annual growth rate of GDP by inhabitant, unemployment rate in the euro zone, the United States, Japan and China (as %) Euro zone U.S. Japan China Public deficit, as % of GDP Current account balance, as % of GDP Average annual growth rate of GDP by inhabitant +0,6 +0,6 +0,7 +10 Unemployment rate 9 6,8 4,5 nc The public deficit is that of The current account balance is that of The average annual growth rate of GDP per inhabitant is from the period The unemployment rate is the average unemployment rate for the period of nc: non comparable We have compared four large world economic zones: the euro zone, the United States, Japan, and China. Three principal conclusions stand out. A difference in the area of growth is very pronounced between an emerging China (10% per year) and the three developed regions. This is not surprising. Less well known is the observation that the average growth rate of the GDP by inhabitant during the decade was almost identical (about 0.6% per year) for the euro zone, the United States and Japan. In terms of growth, the euro zone is, therefore, not lagging in relation to the United States. The euro zone is globally the most balanced from a financial standpoint. It has an almost balanced foreign trade, whereas the United States has a strong deficit and Japan and China have a large foreign surplus (in spite of very divergent exchange movements between the euro, the dollar and the yen). In regards to the global public deficit in the euro zone, it is half as elevated as that of the United States and Japan, and it tends to be reduced more quickly than that of the United States. The principal European anomaly concerns unemployment. For the same underlying growth rate by inhabitant, the euro zone has, on the average, twice as many unemployed as does Japan and 30% more than the U.S., even though the working-age population is increasing in the U.S. almost 3 times faster than the euro zone. The efficiency of the labor market in Europe is far from being optimal, and, thus, questions should be clearly raised as to why. 6

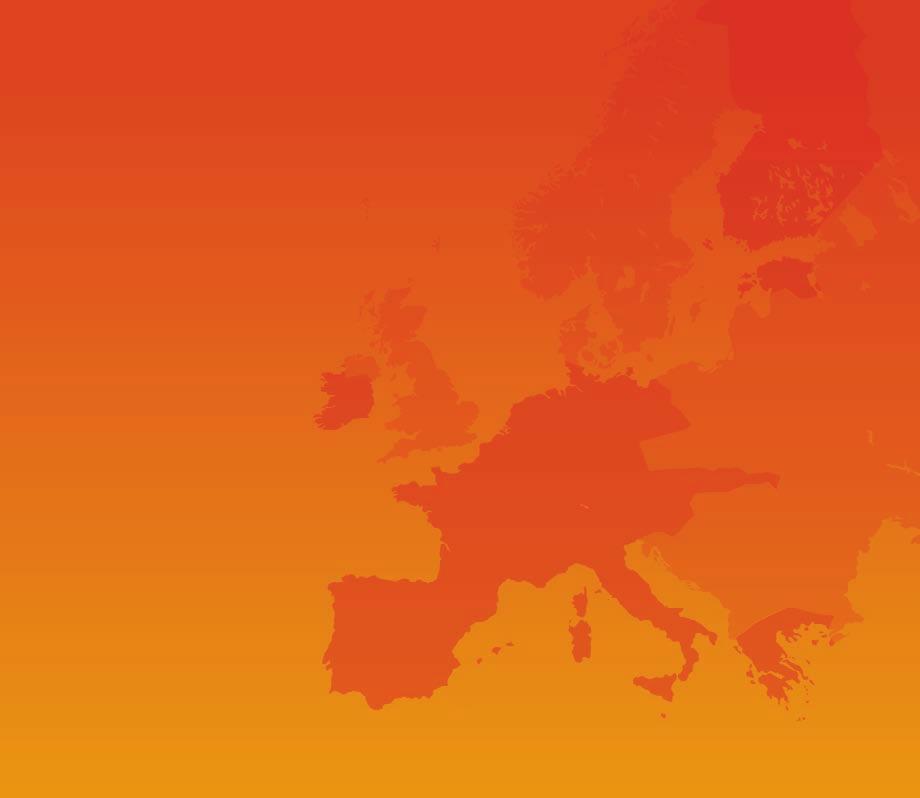
9 A geographic fragmentation which largely coincides with economic variances Member countries of the euro zone (on January 1, 2012) The European Union now comprises 27 countries for a total population of 455 million inhabitants. Its total GDP was 12,300 billion euro in It is the world s leading economic power. France represents 14.6% of the European Union population and 13.8% of its surface area. Lithuania, Latvia and Sweden signed the Maastricht Treaty and plan to enter the euro zone one day. The United Kingdom and Denmark, on the other hand, have obtained an opt-out clause to the Maastricht Treaty concerning their membership in the euro zone. The euro zone (Economic and Monetary Union) now totals 17 countries with 330 million inhabitants, which is two-thirds of the population of the European Union (less than 5% of the world population). The GDP of the euro zone reached 9,200 billion euro in 2010, which represents 75% of the European Union GDP and 19% of worldwide GDP. The euro zone is an incomplete structure. Romania, Bulgaria, Hungary, the Czech Republic, Poland, Just a glance at the geography of the euro zone is enough to note the geographic fragmentation between the countries that it is composed of. The six founding countries of the European Union form the heart of the euro zone. The other members are geographically more peripheral and sometimes disjointed geographically. The geographic positions of the euro zone countries coincide, generally, rather well with their current economic and financial differences. 7
10 The differences between the rates of return of State bonds continue to widen. Rates of return of 10-year State bonds ( ) 28 As % 24 Greecee Portugal Ireland Italy Spain Belgium France Germany We have not drawn the curve for Netherlands which is almost the same as that of Germany. In the beginning of 2009, the rates of return for 10-year State bonds in the countries of the euro zone were very close to one another. Those rates have since moved apart. To understand the significance of these differences, let s take the point of view of the saver who has placed his savings in State bonds. If he buys 10-year German state bonds, with the present rate of return of 1.9%, in ten years his placement will have become 120. If he buys, for example, Italian bonds, his placement would become 170. However, a lot of investors today prefer to buy German bonds. The explanation is that they fear, either rightly or wrongly, that the Italian state will not reimburse the totality of its debt or that the Italian euro will one day lose its value in comparison to the euro mark. This means that they do not ignore the possibility of a return to national currencies. These differences in the rates of return are representative of that which is called the credibility of the States (or the sovereign debts). The Greek, Portuguese and Irish cases illustrate extreme situations where the State no longer finds takers for its bond markets. To avoid a default in payment which would force them to halt all spending, they must ask for aid from other States. This is what has happened in these three countries. This assistance demands plans for balanced budgets because the financial aid asked for is only given in exchange for these plans. France is far from finding itself in these extreme situations, but savers have separated it a bit from Germany (the same placement in French bonds would yield 134 in 10 years). For the viability of the euro zone, for which France and Germany are, together, the principal guarantors, it is now crucial to get rid of the France-Germany gap. 8
11 Foreign trade balances, symptoms of competitiveness gaps Foreign trade balances of goods and services as percentage of GDP for the countries of the euro zone ( ) 12 As % of GDP Netherlands Germany Austria Belgium Spain Italy France Portugal Greece The foreign trade balances of goods and services reflect the insertion of territory in worldwide exchanges. The countries with the highest deficits, like Greece, Portugal and Spain, are also those who are today experiencing financial difficulties. We should not be too deluded by the reduction in deficits of some of these countries recently (Greece and Portugal since 2008, Spain since 2011). It is mostly a result of the economic recession. The countries with the highest surpluses are Netherlands, Germany, Austria, and Belgium. Finland, for whom we have not drawn the curve for reasons of readability, has experienced a continued downward tendency of its foreign trade balance over the last decade but it was still balanced in France presented a commercial surplus at the beginning of the decade This surplus disappeared starting in 2005 and it has now given way to a growing deficit which is higher (in % of GDP) than that of Spain and Italy, and is even approaching that of Portugal. The gap between the French foreign trade balance of goods and services and that of surplus countries (notably Germany and Netherlands) has, thus, widened during the last decade.this growing gap between foreign trade balances is one of the signs of our loss of competitiveness. 9
12 Levels of public deficit very disparate between the States of the euro zone Levels of public deficit as % of GDP in 2011 In the thirteen member countries of the euro zone, the public deficits last year went over 3 points of the GDP, the maximum acceptable threshold according to the Stability and Growth Pact. Among these 13 countries, three even have a public deficit (expressed by percentage of GDP) two times higher than the Maastricht threshold: Greece (-8.9%), Spain (-8.5%), and Ireland (-10.3%). On the other hand, Germany (-1.3%), Finland (-1.0%), and Luxembourg (-0.6%) have a deficit lower than 3% of the GDP while Estonia even has a budgetary surplus (+0.8%). With a public deficit which reached 5.4% of the GDP in 2011, France is in a worrisome budgetary situation, to a degree that could be considered as intermediary between the two groups of the preceding countries. It should also be highlighted that the public deficit of all the public administrations (State, local authorities and social security systems) is, in France, excessive, while the rate of tax and social security deductions (taxes and mandatory contributions related to domestic products) is already one of the highest in Europe (see page 18). This contrast can be explained by the weight of public administration spending on the GDP, by far the highest in Europe. Reducing, first and foremost, our public spending would allow France to be brought back to the average in the euro zone in terms of deficits. 10
13 A risk of an explosion in public debt (as a percentage of GDP) if the levels of current deficits remain unchanged Public debt (as % of GDP) 140 As % Italy Spain France 80 Germany Simulation of unchanged deficits The graph above traces the evolution of the public debt (as % of GDP) between 2000 and 2011, and then anticipates the dynamic of these ratios if the levels of public debt reached in 2012 persist over the upcoming years. This should not in any way be interpreted as a forecast, but as a simulation aimed at illustrating the threats that current trends pose. We have only used the four principal countries of the euro zone as an example. Up until 2011, the weights of French and German public debt in the GDP were very close. Italy, on the other hand, for more than twenty years, has been over the German and French levels and has maintained that gap at a fairly constant rate because of the weight of their former debt (but they have a budget surplus). Spain, which is appreciably under that of France and Germany, is rapidly moving closer. The dotted line shows the level the sovereign debts would reach if the current deficits continue on a long-term basis (meaning in the theoretical hypothesis where the level of deficit as a percentage of GDP in 2012 remained constant until 2017). In that case, the large countries of the euro zone would find themselves pulled into a dynamic of increasing differences in their debts, which would be an uncontrollable situation and probably incompatible with the preservation of a single currency. We understand the seriousness of these threats to the stability of the euro zone and the necessity of strongly changing the direction of these trends. We can see that the difference in rates of return on debts, illustrated on page 8, which reflect the value of these debts on markets, can be explained less by the current level of debts than by the threats of differences that the deficits weigh on the States for the future. This is why it is imperative that these deficits be rapidly reduced. 11


14 France in the euro zone Weaknesses and delays in adaptation The largest drop in export market shares in the euro zone 14 French unit wage costs are trending towards those of countries in difficulty 15 The weight of French public spending is the heaviest in the euro zone 16 Deindustrialization has hit France strongly 17 The share of the French manufacturing industry added value is among the weakest in the euro zone 18 The unemployment rate is at an intermediary level among the countries of the euro zone 19 Purchasing power of the GDP per French inhabitant falls within the average of the euro zone 20 13

15 The largest drop in export market shares in the euro zone Evolution in the share of exports of goods and services in value in the total exports of the euro zone The market share, which means the share of exports of a country in the total of world exports or in the total of exports of countries in the same economic zone, is a significant indicator of competitiveness. The evolution in the share of the French market is compared, on the map above, with that of other countries in the euro zone. Between 2000 and 2010, the market shares of Portugal, Greece, Belgium and Finland in the euro zone slightly diminished. Those of Spain and Austria slightly increased. The share of German exports of goods and services in value in the total exports of the euro zone increased by 3.6 points. The market share of Italy diminished by 1.8 points. In the world, France s market share has diminished like that of most developed countries. This drop is a result of the increase in power of emerging countries in world commerce and is not, in itself, disturbing. More worrisome is the decrease in France s market share within the euro zone. Between 2000 and 2010, France s market share diminished by 3.5 points. It is the largest drop among countries in the euro zone. Now, each point (1% of the total of exports of the euro zone) represents about 38 billion euro. The gap between France and Germany has, thus, widened by about 250 billion euro in ten years, or 13% of our GDP. 14
16 French unit wage costs are trending towards those of countries in difficulty Unit wage costs in the non-agricultural trade sector for several countries in the euro zone =100 Italy Portugal Spain France Finland Belgi um Netherlands Austria Germany Unit wage costs are on a macroeconomic scale what wage cost price is to a company. These costs are calculated by relating the change in the mean labor costs per hour to that of labor productivity (output per hour). If unit wage costs increase more quickly in a country than those in their competitor countries, either the increase in cost is reflected in prices and the country loses in price competitiveness or the cost is not reflected in prices and the country risks losing its competitiveness not because of price but because they no longer have the means to invest. The countries in the south of the euro zone experienced, between 2000 and 2010, a very strong increase in their unit wage costs (Italy: +37% and Greece: +36%). On the other hand, Germany, and to a lesser extent, Austria, experienced only very slight progressions. Germany, which instituted a rigorous policy of competitiveness, experienced almost none at all. France registered an increase of 19% in its unit wage costs. This increase is noticeably higher than that of Germany. It can be noted that, for countries in difficulty, the recession has resulted in stagnation or a drop in their labor costs. France has been relatively spared but it is approaching countries who are today in financial difficulty. We have also observed for the last ten years that countries whose unit wage costs have increased the fastest are also often those whose share of the export market in the euro zone has dropped. Today, some countries are finding themselves forced to lower salaries, with all the social consequences that this implies. This is not the case in France. 15
17 The weight of French public spending is the heaviest in the euro zone Public spending as percentage of GDP ( average) A high level of public spending is often considered a handicap for competitiveness. Public deductions weigh on costs and reduce disposable income for consumption, investment and exporting. to avoid giving too important a weight to just one year. The weight of public spending (as percentage of GDP) in France is the highest of all the countries in the euro zone: 54.3% for the average of This judgment must certainly be qualified according to the use which is made of the public spending. We can, indeed, imagine that an insufficient production of collective goods or a too weak redistribution would turn out to be harmful to productive efficiency. However, for comparable countries, it is difficult to explain the gaps in public spending. We have used here the average over five years ( ) in order France is followed by Belgium and Finland (between 50 and 51% of GDP). In Germany, the weight of public spending was 46% of GDP, or 8 points of GDP less than the weight of public spending in France. The France- Germany gap related to our economy represents more than 150 billion euro, or one and a half times our total public deficit. 16

18 Deindustrialization has hit France strongly Evolution in the share of the French industrial added value in the GDP between 2000 and 2010 We have measured here deindustrialization over the period by the evolution of the share of the manufacturing industry added value in the GDP. The map illustrates how fast the countries have deindustrialized. Overall, between 2000 and 2010 in the euro zone, the weight of the manufacturing industry added value in the GDP has gone from 19.2% to 15.5% (meaning a drop of 3.7 points in the GDP). In France, the share of the industrial added value in the GDP lost 5.2 points (which represents more than 100 billion euro). This drop is not a result of exceptional growth in non-industrial sectors but is due to the fact that from 2000 to 2010, the industrial share of the GDP dropped about one third. It is an historically unprecedented evolution which constitutes a handicap for the entire economy. The weight of the industrial added value in the GDP diminished in all of the countries in the euro zone but at a much less pronounced rate. Deindustrialization poses a threat to future growth. About 85% of private research efforts are, in fact, done by industry. The more the industrial base is reduced, the less the country has in assets to support applied research, generate technical progress and contribute to the expansion of other economic sectors. The loss of competitiveness and deindustrialization feed off of each other in a vicious circle. 17
19 The share of the French manufacturing industry added value is among the weakest in the euro zone Share of the manufacturing industry added value in the GDP in 2010 The map represents the share of the manufacturing industry added value in the GDP of countries in the euro zone in It is the current outcome of years of deindustrialization. It concerns, like in the preceding map, the added value produced by industrial enterprises established on the territory (whatever the nationality of the parent company) to the GDP. The weight of the manufacturing industry is weak in Spain and Portugal (weight of the value of the manufacturing industry in the GDP respectively of 12.1% and 11.8%), as well as Belgium and Netherlands (13.1% and 11.9%), but it remains higher in those countries than in France. The manufacturing industry has, on the other hand, kept a relatively high share in Italy (the added value of the manufacturing industry there represents 15% of GDP). Germany is, among the largest countries in the euro zone by size and by population, the country which has kept the highest share of its manufacturing industry in the GDP (the weight of industry is 18.7% of GDP). In euro, the added value of German industry (464 billion euro in 2010) is more than two and a half times the added value of French industry. As of now, France is the country in the euro zone whose share of the added value of the manufacturing industry in the GDP is the weakest (9.3% in 2010). 18
20 The unemployment rate is at an intermediary level among the countries of the euro zone Unemployment rate harmonized end of 2011 The unemployment rate measures the share of the working population that is jobless, but is looking for work, in the population present on the labor market (this represents in France 71% of the total population between the ages of 15 to 64 years old). The French unemployment rate increased, like in most of the other countries, after the recession. The unemployment rate in France at the end of 2011 was 9.9%, a slightly lower level than that of the average in the euro zone (10.4% in December 2011). Some European countries have posted much higher increases. They are, in addition, the countries whose deficits, public debts and interest rates have strongly diverged from the rest of the euro zone. In the autumn of 2011, the unemployment rate reached 19% in Greece, 23% in Spain, 13% in Portugal and 15% in Ireland. On the other hand, in other countries, principally those who have maintained or strengthened their competitiveness and mastered their deficits, the unemployment rate is much lower (5.5% in Germany, 4% in Austria, and 4.9% in Netherlands), or about two times lower than in France. A reduction in the unemployment rate is possible in France. To accomplish that, the labor market must become more efficient. 19
21 Purchasing power of the GDP per French inhabitant falls within the average of the euro zone GDP per inhabitant in purchasing power parity in 2011 A classic indicator of the level of creation of wealth in countries is the average GDP per inhabitant, meaning the GDP divided by the total population. It measures the value created by countries related to the number of inhabitants, and, consequently, the shareable value. Two populations which have the same GDP will, however, have different purchasing powers if the average price of products is higher in one of the two countries. This is why international organizations calculate purchasing power parity indexes which represent the scale of average price levels between countries (see table in Annex). Here, we divide the GDP by inhabitant by average price index to obtain the average purchasing power per inhabitant (or GDP by purchasing power ratio). In 2010, the member countries of the euro zone showed marked differences in relation to GDP per inhabitant calculated by purchasing power ratio, which meant correcting the gaps in price levels. Portugal, Estonia and the Slovak Republic had a GDP per inhabitant lower than 20,000 euro purchasing power ratio in 2010 (the Slovak Republic and Estonia joined the European Union and the euro zone rather late). Germany, Belgium, Finland, Austria and Ireland had a GDP per inhabitant of between 28,000 and 32,000 euro purchasing power ratio in Netherlands and Luxembourg had a GDP per inhabitant higher than 32,000 euro. France, like Italy and Spain, had a GDP per inhabitant lower than 28,000 euro. France is, thus, situated at an intermediary level in terms of purchasing power of GDP per inhabitant. 20
22 Reconverging Absolute priority for the euro zone Putting an end to excessive deficits is possible 22 Restoring the credibility of the States quickly 23 21
23 Putting an end to excessive deficits is possible. Public deficit as % of GDP (for the period ) 5 As % Creation of the euro World recession 0 Germany Italy France Portugal Spain Greecee The graph presents the evolution of public deficits as percentage of GDP from 1970 to 2011 for France, Germany and three countries which, today, are encountering refinancing difficulties: Italy, Portugal and Greece. We can observe that the deficits began to diverge when the euro was created. The shock of the world crisis brutally accelerated this deterioration. It should be recalled that most of the European countries had already encountered high deficits at the end of the 1980s, after the oil crises and the two recessions. All the countries at that time made big efforts (helped by the decrease in interest rates back then) to reduce their deficits between 1995 and 1997, in order to respect the criteria for entry into the euro in This austerity did not prevent a general economic recovery in Europe at the time. France, like other countries, made a marked recovery. However, in 2000, it did not take advantage of the good general economic situation to suffi ciently reduce its deficit maintained at a high level at the height of the economic cycle. France wasn t very far from Germany (who was still feeling the weight of the reunification), but they didn t commit to the same structural reforms or they only did so later. The policies of favoring consumption, in addition, weighed on the deficit. France, therefore, moved away from Germany who had brought their deficit to zero in 2007 (and will be once again close to that in 2012). The only solution is to commit to an effort of reducing deficits at least as important as that done in the second half of the 1990s. Experience proves that this effort is possible. 22
24 Restoring the credibility of the States quickly Rates of return of 10-year State bonds 28 As % 24 Creation of the euro World recession Greecee Portugal Ireland Italy Spain Belgium France Netherlands Germany The evolution of the gaps in rates of return on 10-year State bonds reveals the differences between the three periods which have marked the euro zone since its creation. The first period was the steps towards the euro. After the Maastricht Treaty (1992), the European countries successfully undertook policies of convergence to respect the rules of access to the euro (convergence of public deficits, inflation and interest rate gaps). At the beginning of the years 2000, the interest rates for State bonds had even completely converged. The second period was that of the happy euro. Starting with the creation of the euro, investors considered that holding a German debt or a Spanish debt was equivalent, or any other State in the euro zone. All the States had achieved the same credibility, at least in appearance. The rate of return of public bonds was, thus, the same for all. The last period was marked by the return of divergences. The shock of the recession from 2008 to 2009 once again dispersed public deficits. The accumulation of debts of certain States increased and the rates of return of public bonds deviated. The gaps in rates of return have even gone back to their pre-euro level! Reconverging is still possible. We have already been able to do it once before. But, at the time, the adjustment was partly accomplished thanks to monetary devaluations (Italy and Spain notably). Devaluations of exchange rates no longer being possible, the States must observe a stricter convergence, not only of public finances but also of their internal economic systems. An additional increase in the gap between France and Germany would be the worst of threats for the euro because it would undermine the foundations of systems of stability. 23


25 Opportunities and Strengths for France The strength of a dynamic demography 26 The share of the working-age population as a part of the total population is particularly low 27 High productivity, weak working time, high prices. In all, an average purchasing power of GDP per inhabitant 28 A weaker working time in France makes increased growth and purchasing power possible 29 The weakness of the French employment rate constitutes an opportunity for growth 30 A strength to conserve A low level of CO 2 per inhabita 31 The French signature is and remains one of the most credible in the world 32 25
26 The Strength of a dynamic demography Evolution of the population between 2000 and 2011 France has a particularly dynamic demography. The French population (home country and overseas territories) went from 60.5 million in 2000 to 65.1 million in 2011, meaning an increase in population of +7.5% in a little more than a decade. Only two countries in Europe have a stronger expanding population: Spain (+15.2% in ten years, 46.2 million inhabitants in 2011) and Ireland (+18.6%, 4.5 million inhabitants in 2011). The demography of the United Kingdom is also growing, but at a weaker rate than France: its population increased by 6.2% during the period (62.4 million in 2011). In a large part of European countries located in Central and Eastern Europe, the population has diminished. This is notably the case in Germany (where the population has diminished by 0.5% since 2000 (81.8 million inhabitants) and even more so in several former Communist countries like Poland, Romania, and Bulgaria. The map of the rate of population growth between 2000 and 2011 shows the gap between the Western part of the European Union, which is in strong expansion, and the Eastern part which is in demographic decline. An expanding French population is an asset for growth. But it is also a constraint as it implies that the economy must adapt rather quickly to create jobs in sufficient number and a purchasing power necessary to a larger population. 26
27 The share of the working-age population as a part of the total population is particularly low Share of the working-age population in total population A first consequence of a dynamic demography in France is that the share of the working age population (population between 15 and 64 years old) as a part of the total population is the lowest of all the countries in the euro zone. In France, there are, in effect, relatively more young people less than 15 years old in the total population (18.6% in France compared to 15.4% on average in the euro zone). On the other hand, the share of people from 15 to 64 years old in the total population (65.1% in France) is lower than the average in the euro zone. So, other things being equal, a lower working age population leads to lower production and, thus, a lower revenue per inhabitant, with fewer workers having to support more people. A possible compensation is work hour productivity (GDP related to the total number of working hours in the country), while another could be the average number of hours worked per working age person. It turns out that work hour productivity is rather elevated in France but that the average volume of work hours per working age person is rather low (see following page). A second consequence of demographic dynamism is that, to maintain the same employment rate, a growing number of job creations is necessary each year. On the same note, to maintain the same level of production per inhabitant (the same standard of living), there would have to be a higher growth rate than elsewhere. Demographic dynamism is undeniably an asset. It is also a challenge which would involve a higher growth rate and more capacity for adaptation, innovation and dynamism. 27
28 High productivity, weak working time, high prices In all, an average purchasing power of GDP per inhabitant Productivity Quantity of work Purchasing Power Slovak Republic 14.7 Italy 665 Slovak Republic 18.0 Portugal 20.1 Ireland 666 Portugal 19.5 Greece 26.0 France 679 Greece 22.8 Spain 33.5 Belgium 686 Spain 24.6 Germany 38.4 Spain 686 Italy 24.8 Italy 38.9 Netherlands 711 France 27.7 Austria 42.2 Finland 728 Finland 28.2 Finland 46.2 Germany 798 Belgium 29.0 France 46.4 Greece 804 Germany 29.1 Belgium 47.5 Portugal 809 Ireland 31.1 Netherlands 50.6 Austria 820 Austria 31.3 Ireland 52.3 Slovak Republic 825 Netherlands GDP in added value to total number of hours worked (in euro per hour) Volume of total hours worked related to the total population (in hours per inhabitant) GDP in value per inhabitant (in thousands of euro in purchasing power ratio 2010) The productivity per hour of work (1,932 billion euro in 2010 divided by 42 billion hours worked) is rather high in France. Other things being equal, we would expect the French standard of living to be among the highest. This is not the case as productivity is not strong enough to compensate for the insufficient average amount of work per inhabitant, and a relatively high general level of prices in France. The apparent work productivity (first column) is higher in France than in Germany (46.4 euro in France per hour compared to 38.4 euro in 2010). To go from hourly productivity to average purchasing power per inhabitant, we must first take into account the average volume of hours worked per inhabitant (second column). By multiplying the average quantity of work per inhabitant by the average productivity of the work hour, we obtain the GDP per inhabitant in today s euro. To compare purchasing powers, we must again take into account the gaps in the average price levels in European countries. These levels are calculated by Eurostat. The average price level turns out to be rather high in France, 113 on the index compared to 105 in Germany (see Annex). In all, the average purchasing power of the GDP per inhabitant was 27,700 euro in France. It is situated, as already shown on the map on page 20, in the average of the euro zone, below Germany and Netherlands but above Southern countries (Italy and Spain). 28
29 A weak working time in France makes increased growth and purchasing power possible Average annual working time for full-time salaried employees in 2010 The map illustrates the differences between the average annual working time for full-time salaried employees in the euro zone. According to the Labor Force Survey, the annual working time of non-salaried workers, which represents 11.3% of employment, is rather high in France (2,290 hours in 2010). The average working time of part-time salaried employees (which represents 16.3% of salaried employment, a weak proportion in relation to other countries) is relatively high (978 hours on average in 2010). This translates to a rather high part-time average quota (which is to say the proportion in relation to full time) in France. The French exception concerns full-time salaried employees for whom the notion of working time is the most significant (for these questions, we can refer you to the document La durée du travail en France et en Europe, Document de travail, No. 29, Coe- Rexecode, 2012). The actual annual working time of full-time salaried employees (which represents 72.4% of salaried employment in France) is, with Finland, the weakest of all the countries of the euro zone (1,679 hours in 2010 compared to 1,904 hours in Germany and 1,813 hours in Italy). This is not surprising inasmuch as the principal objective at the beginning of the years 2000 was to lower working time. A weak working time can be considered a limitation but also an opportunity as long as there exists a reserve capacity for additional production in France subject to a more efficient labor market. 29
. In 2010, in France, 63.8% of the working-age population had, in fact, a job. The others, which was 36.2% of the working-age population (14.")
30 The weakness of the French employment rate constitutes an opportunity for growth Employment rate in 2010 (15 to 64 years old) The employment rate is the proportion of people who have a job in the working-age population (population from 15 to 64 years old). In 2010, in France, 63.8% of the working-age population had, in fact, a job. The others, which was 36.2% of the working-age population (14.5 million people from 15 to 64 years old), did not wish to work or found themselves unemployed. Within the euro zone, Italy and Spain had weaker employment rates (56.9% and 58.6% respectively). Germany, Austria and Netherlands had higher employment rates (71.1%, 71.7% and 74.7% respectively). The gap in employment rates between France and Germany, meaning a little more than 7% of the working-age population, can be explained partly by the difference in the unemployment rate (much lower in Germany). These situations reflect the differences in the efficiency of the labor markets in France and in Germany. France, thus, has an important potential for a rise in employment and production, subject to whether the activity rate increases and the unemployment rate decreases. To illustrate the point, an increase in the French employment rate to the average level of Germany, Austria and Netherlands would allow, other things being equal, the GDP to grow to 200 billion euro, meaning an annual gain of 8,000 euro on average per French household. 30
31 A strength to conserve The low level of CO 2 per inhabitant CO 2 emissions per inhabitant in 2009 The European Union emitted in 2009 a little less than 3.8 metric gigatonnes of CO 2 (4.1 in 2008, the drop in 2009 being explained partly by the fall in industrial production). European emissions represent about 12% of world emissions. On average, the annual CO 2 emissions of the European Union are a little less than 8 metric tons per inhabitant, quite a bit less than the United States (18 metric tons per inhabitant), and slightly more than China (5.3 metric tons per inhabitant). As the map above shows, the CO 2 emissions per inhabitant differ strongly within the European Union. France is characterized by a very low emissions level per inhabitant (5.9 metric tons per French person and per year), close to certain Eastern European countries whose GDP per inhabitant is much weaker. Germany (9.6 metric tons per inhabitant) emits two times more emissions than France although its population is only higher by 30%. The low level of CO 2 emissions in France can be explained notably by the low emissions associated with the production of electricity. The group of French nuclear power plants, which emits no, or very little, carbon dioxide, provides about 75% of the production of electricity. As there will be a charge for CO 2 emissions quotas in Europe starting in 2013, the low level of emissions in France is a strength to conserve. 31
32 The French signature is and remains one of the most credible in the world Average of ratings of the agencies Fitch, Standard & Poor s and Moody s (February 13, 2012) At the beginning of 2011, a rating agency downgraded by one or two notches in its scale of ratings the scores of eight States in the euro zone (Austria, Cyprus, France, Italy, Malta, the Slovak Republic, Slovenia and Spain). Then, a second agency lowered by one or two notches the ratings of Italy, Spain, Belgium, Cyprus and Slovenia. At the beginning of February, a third agency lowered its ratings of six countries in the zone (Italy, Malta, Portugal, the Slovak Republic, Slovenia, and Spain). The markets acknowledged these rating changes with serenity. The ranking scales of these agencies include 20 levels. We have determined an overall rating by calculating the average of ratings of the sovereign debts of countries of the euro zone attributed by the three agencies. The countries whose ratings of their sovereign debt are the lowest are located on the periphery of the euro zone. These are also the countries in which their competitiveness has gone down, their unemployment rates are the highest and their level of GDP per inhabitant is relatively the weakest. France is not today a part of these countries in difficulty. With a ranking of 19.7, it is one of the most credible countries in the euro zone, very close to Germany. However, it is certain that a growing divergence with Germany would pose a problem with the stability plans that have been implemented. It would revive the financial crisis and could even threaten the very existence of the euro zone. 32
33 Some Information on these comparisons The crisis in the euro zone should not be considered as an overall crisis, but rather the result of economic and financial divergences which became more pronounced between national territories adopting the same currency. - Finally, on our public finances: The weight of public spending in the GDP is, in France, the heaviest among the countries of the euro zone. The gap with Germany represents more than 150 billion euro, or one and a half times our public deficit. These divergences have brought about growing gaps between the national interest rates, a dramatic increase in public deficits and they have led some States to no longer be able to self finance. They are manifest also in the evolution of market shares, foreign trade balances and unemployment rates in the countries of the euro zone. These divergences and their impact are particularly felt today on our territory. - First of all, on our international market shares: France has posted, for the last ten years, the strongest drop in foreign trade market shares. The gap with Germany, which was negligible ten years ago, has widened to 250 billion euro, or 13 points of our GDP. - Next, on our labor costs: Over the same period of time, the unit wage cost increased in a proportion intermediary between Germany and the Southern European countries, who are currently in difficulty. The gap in the evolution over ten years of the unit wage cost between France and Germany was about 20%.Deindustrialization was particularly rapid in France. However, France has a major strength which has been too little emphasized, and that is its dynamic demography. Work hour productivity is high in France but this advantage is counterbalanced by a weak average quantity of work per inhabitant and by a relatively high general level of prices and costs. The weak levels of working time and the employment rate can become opportunities for growth as long as the labor market becomes more efficient. It is crucial to, firstly, get rid of the gaps in the public interest rates between France and Germany, countries which are the principal guarantors of the euro, and to conserve the very strong credibility of both countries. The divergences within the countries of the euro zone are not inevitable. During the 1990s, the European States, in a similar situation, were able to end their excessive deficits to converge and create the euro together, in Today, a new convergence is necessary to insure the stability and the viability of the euro zone and to restore growth. This is even the object of the new European treaty on stability, coordination and governance in Europe. France has the advantage of a dynamic demography. A larger population requires that our economy show a larger capacity for adaption and mobilize all its resources. 33


34 Annexes 34
35 Summary Maps and Graphics You will find here the summary of data which we used to create the maps and graphics maps & graphics Data Member countries of the euro zone (as of January 1, 2012) page 7 Rate of return of 10-year State bonds, as % page 8 page 37 Balance of foreign trade of goods and services in points of GDP for the countries of the euro zone ( ) page 9 page 38 Public deficit as % of GDP in 2011 page 10 page 38 Public debt in points of GDP page 11 page 39 Share of exports of goods and services of each country in value of total exports of the euro zone page 14 page 39 Unit wage costs in the non-agricultural trade sector for several countries in the euro zone page 15 page 40 Public spending as % of GDP page 16 page 40 Evolution in the share of the industrial added value in the GDP between 2001 and 2010 page 17 page 41 Share of the manufacturing industry added value in the GDP in 2010 page 18 page 41 Unemployment rate harmonized end of 2011 page 19 page 42 GDP per inhabitant by purchasing power ratio in 2011 page 20 page 42 Public deficit as % of GDP (for the period ) page 22 Rates of return of 10-year State bonds page 23 Population in 2000 and changes from 2010 to 2011 page 26 page 43 Share of the working-age population page 27 page 44 Purchasing power ratio in the countries of the euro zone page 28 page 44 Average annual working time for full-time salaried employees in 2010 page 29 page 45 Employment rate in 2010 (15 to 64 years old) page 30 page 45 CO 2 emissions per inhabitant in 2009 page 31 page 46 Average of ratings of agencies Fitch, Standard & Poor s Moody s (February 13, 2012) page 32 page 47 35
36 Graphic page 8 Rates of Return of 10-year State bonds, as % Germany Netherlands France Belgium Spain Italy Ireland Portugal Greece Jan -10 3,3 3,5 3,5 3,6 4,0 4,0 4,8 4,2 6,0 Feb -10 3,2 3,4 3,4 3,7 4,0 4,0 4,7 4,5 6,5 Mar -10 3,1 3,4 3,4 3,6 3,9 3,9 4,5 4,3 6,2 Apr -10 3,1 3,3 3,4 3,6 3,9 3,9 4,7 4,8 7,8 May -10 2,8 3,0 3,1 3,3 4,1 4,0 5,0 5,0 8,0 Jun -10 2,6 2,9 3,1 3,5 4,6 4,1 5,4 5,5 9,1 Jul -10 2,6 2,9 3,0 3,3 4,4 4,0 5,4 5,4 10,3 Aug -10 2,4 2,6 2,7 3,0 4,1 3,8 5,3 5,2 10,7 Sept -10 2,3 2,5 2,7 3,1 4,2 3,8 6,2 6,0 11,3 Oct -10 2,4 2,6 2,7 3,2 4,1 3,7 6,5 6,0 9,6 Nov -10 2,5 2,8 3,0 3,5 4,7 4,1 8,4 6,8 11,5 Dec -10 2,9 3,2 3,3 4,0 5,4 4,6 8,7 6,5 12,0 Jan -11 3,1 3,2 3,4 4,1 5,4 4,7 8,9 6,9 11,7 Feb -11 3,2 3,4 3,6 4,1 5,3 4,7 9,1 7,3 11,4 Mar -11 3,2 3,3 3,6 4,2 5,3 4,8 9,7 7,7 12,4 Apr -11 3,3 3,6 3,7 4,3 5,4 4,7 9,9 9,1 13,9 May -11 3,1 3,4 3,5 4,2 5,3 4,7 10,7 9,5 15,9 Jun -11 3,0 3,3 3,4 4,1 5,5 4,8 11,4 10,7 16,7 Jul -11 2,8 3,2 3,4 4,3 5,9 5,4 13,1 12,4 16,2 Aug -11 2,3 2,7 3,0 4,1 5,3 5,2 10,1 10,9 15,9 Sept -11 1,9 2,3 2,6 3,9 5,2 5,5 8,6 11,3 17,8 Oct -11 2,0 2,5 3,0 4,2 5,3 5,7 8,1 11,7 18,0 Nov -11 1,9 2,4 3,4 4,9 6,2 6,7 8,5 11,9 17,9 Dec -11 2,0 2,4 3,2 4,4 5,4 6,7 8,7 13,1 17,9 Jan -12 1,9 2,2 3,2 4,2 5,2 6,5 7,8 14,0 25,9 Source: Global Insight 37
37 Graphic page 9 Foreign Trade balances of goods and services as points of GDP for the countries of the Euro zone ( ) Netherlands 5,5 5,8 6,5 6,3 7,4 8,5 7,7 8,2 8,3 6,8 7,5 7,6 Germany 0,3 2,0 4,5 3,9 5,0 5,2 5,6 7,0 6,2 5,0 5,5 5,2 Austria 1,7 2,2 4,8 3,5 3,8 4,0 5,1 5,7 5,8 4,8 4,3 3,7 Belgium 2,9 3,6 5,7 5,4 4,9 3,9 3,8 3,8 0,9 2,7 2,7 2,0 Finland 9,1 9,4 9,2 6,8 6,5 4,1 4,7 5,1 3,8 1,6 0,9-0,2 Spain -3,1-2,5-2,1-2,4-4,0-5,3-6,4-6,7-5,8-1,9-2,1-1,2 Italy 1,0 1,4 0,9 0,5 0,7-0,1-0,8-0,3-0,8-0,5-1,9-2,1 France 1,0 1,1 1,5 0,9 0,4-0,6-1,0-1,5-2,1-1,8-2,3-3,4 Portugal -11,0-10,2-8,3-6,8-8,3-9,4-8,7-8,0-10,1-7,4-7,2-4,2 Greece -13,5-13,2-13,5-12,3-10,1-9,3-10,8-13,5-14,4-11,4-8,9-6,7 Source: National accounts Map page 10 Public deficit (as % of GDP in 2011) Ireland -10,3 Greece -8,9 Spain -8,5 Cyprus -6,7 Slovakia -5,8 Portugal -5,8 Slovenia -5,7 France -5,4 Netherlands -4,3 Italy -3,8 Belgium -3,7 Austria -3,4 Malta -3,0 Finland -1,2 Germany -1,0 Luxembourg -0,6 Estonia 0,8 Source: Ameco or more recent evaluations for certain countries 38
38 Graphic page 11 Public debt as a point of GDP (under the theoretical hypothesis where the 2012 deficits are maintained until 2017) Germany 60,2 59,1 60,7 64,4 66,3 68,6 68,1 65,2 66,7 74,4 83,2 Spain 59,4 55,6 52,6 48,8 46,3 43,1 39,6 36,2 40,1 53,8 61,0 France 57,3 56,9 58,8 62,9 64,9 66,4 63,7 64,2 68,2 79,0 82,3 Italy 108,5 108,2 105,1 103,9 103,4 105,4 106,1 103,1 105,8 115,5 118,4 Source : Eurostat, National Accounts Germany 81,5 81,6 81,1 80,5 80,0 79,5 78,9 Spain 70,1 78,1 85,1 91,0 97,0 103,3 109,7 France 87,0 90,7 94,3 97,4 100,7 103,9 107,2 Italy 121,4 125,3 128,9 129,9 130,9 131,9 133,0 Source : Coe-Rexecode simulation starting with 2013 based on IMF data Map page 14 Share of exports of goods and services of each country In value in the total exports of the euro zone Changes from 2000 to 2010 on the market share Belgium 7,9 7,6-0,3 Germany 27,4 30,9 3,6 Estonia 0,2 0,3 0,1 Ireland 4,1 4,2 0,1 Greece 1,4 1,3-0,1 Spain 7,3 7,6 0,2 France 16,6 13,1-3,5 Italy 12,9 11,1-1,8 Cyprus 0,2 0,2 0,0 Luxembourg 1,3 1,8 0,5 Malta 0,2 0,2 0,0 Netherlands 11,7 12,3 0,5 Austria 3,9 4,1 0,3 Portugal 1,5 1,4 0,0 Slovenia 0,5 0,6 0,2 Slovakia 0,6 1,4 0,8 Finland 2,3 1,9-0,4 Source : National Accounts 100,0 100,0 0,0 39
39 Graphic page 15 Slovakia Unit wage costs in the non-agricultural trade sector for several countries in the euro zone Base 100 Average for the year 2000 Estonia Italy Cyprus Espagne France Slovenia Portugal Finland Belgium Netherlan Austria Ireland Germany , ,5 104,9 103,2 102,2 103,8 103,3 102,8 100,8 103,5 104,1 104,6 100,3 103,2 99, ,8 109,1 107,8 108,8 108,7 106,8 105,8 101,7 103,8 105,6 108,9 100,3 100,6 99, ,7 113,3 111,9 111,2 113,5 110,5 107,2 100,2 104,3 105,2 110,6 101,3 103,4 99, ,9 118,1 114,5 116,4 115,3 113,1 108,6 102,3 103,0 104,9 110,0 100,4 106,0 98, ,0 123,7 117,9 120,5 120,8 117,1 110,1 103,8 105,3 105,1 108,4 100,7 114,6 96, ,6 137,1 120,3 123,0 122,3 121,3 111,8 104,1 104,9 107,1 109,0 101,2 119,4 94, ,7 160,0 123,9 122,6 122,9 126,4 113,4 107,0 104,5 109,6 110,7 102,3 122,7 93, ,9 181,8 131,0 124,9 126,5 132,1 117,5 113,6 111,3 113,3 114,2 106,4 126,9 96, ,5 184,2 137,3 127,8 130,5 131,6 120,2 123,1 120,2 117,0 119,3 111,4 112,9 101, ,7 170,9 135,7 129,8 131,3 127,4 120,7 121,3 116,8 116,4 116,6 110,5 103,5 100, ,4 171,4 137,7 131,2 131,1 126,2 122,9 120,5 120,0 118,6 116,8 110,9 107,2 101,0 Source : Quarterly national accounts Table page 16 Public spending as percentage of GDP Average Slovakia 38 36,5 34,2 34,9 41, ,5 Estonia 33,6 33, ,5 45,2 40,6 37,8 Luxembourg 41,5 38,6 36,3 37, ,5 39,8 Spain 38,4 38,4 39,2 41,5 46,3 45,6 41,6 Malta 44,6 44,4 42, ,3 42,9 43,7 Ireland 33,8 34,3 36,6 42,8 48,9 66,8 43,9 Germany 46,9 45,3 43, ,1 47,9 46,0 Slovenia 45,3 44,6 42,5 44,2 49,3 50,1 46,0 Portugal 45,6 44,4 44,4 44,8 49,9 51,3 46,7 Netherlands 44,8 45,5 45,3 46,2 51,5 51,2 47,4 Greece 44,6 45,2 47,6 50,6 53,8 50,2 48,7 Italy 47,9 48,5 47,6 48,6 51,6 50,3 49,1 Austria 50 49,1 48,6 49,3 52,9 52,5 50,4 Belgium 52,1 48,6 48,3 49,9 53,8 52,9 50,9 Finland 50,4 49,2 47,4 49,3 55,9 55,3 51,3 France 53, ,6 53,3 56,7 56,6 54,3 Source : National Accounts 40
40 Maps pages 17 et 18 Share of the manufacturing industry added value in the GDP in 2000 and Change Greece 9,8 9,6-0,2 Estonia 15,8 14,9-0,9 Austria 18,4 17,3-1,1 Netherlands 13,9 11,9-2,0 Germany 20,8 18,7-2,1 Slovakia 22,0 18,8-3,2 Cyprus 9,3 6,0-3,3 Portugal 15,4 11,8-3,6 Italy 18,6 15,0-3,7 Slovenia 22,4 18,3-4,1 Belgium 17,1 13,1-4,1 Luxembourg 10,1 5,5-4,6 Spain 16,8 12,2-4,7 France 14,4 9,3-5,1 Finland 23,0 16,4-6,7 Ireland 28,9 21,8-7,1 Malta 19,5 11,8-7,7 Source : Eurostat, Annual National Accounts by sector 41
41 Map page 19 Unemployment rate harmonized in 2011 Jan-11 Feb-11 Mar-11 Apr-11 May-11 Jun-11 Jul-11 Aug-11 Sept-11 Oct-11 Nov-11 Dec-11 Austria 4,4 4,5 4,3 4,1 4,2 3,9 3,7 3,7 3,9 4,1 4,1 4,1 Netherlands 4,3 4,3 4,2 4,2 4,2 4,1 4,3 4,4 4,5 4,8 4,9 4,9 Luxembourg 4,7 4,7 4,7 4,7 4,8 4,8 4,9 4,9 5 4,9 4,9 5,2 Germany 6,4 6,3 6,2 6,1 6 5,9 5,9 5,8 5,8 5,7 5,6 5,5 Malta 6,5 6,5 6,4 6,6 6,6 6,5 6,5 6,4 6,4 6,4 6,5 6,5 Belgium 7,3 7, ,1 7,2 7,3 7,4 7,4 7,3 7,2 7,2 Finland ,9 7,8 7,8 7,8 7,7 7,7 7,6 7,6 7,6 Slovenia 8,1 8,1 8,1 8 7,9 8 8,1 8 8,2 8,2 8,2 8,2 Italy 8,2 8,1 8,2 8,2 8,3 8,2 8,3 8,3 8,6 8,5 8,8 8,9 Cyprus 6,5 6,7 6,9 7 7,3 7,4 7,7 8 8,4 8,7 9 9,3 France 9,6 9,6 9,6 9,6 9,6 9,6 9,7 9,6 9,7 9,7 9,8 9,9 Portugal 12,4 12,4 12,4 12,5 12,6 12,5 12,6 12,6 12, ,2 13,6 Slovakia 13,6 13,4 13,3 13,3 13,3 13,3 13,4 13,4 13,4 13,5 13,5 13,4 Ireland 14,4 14,3 14,2 14,2 14,2 14,4 14,6 14,6 14,4 14,4 14,4 14,5 Greece 14, ,7 16,1 16,9 17,2 17,9 18,4 18,8 19,2 Spain 20,5 20,7 20,8 20, ,3 21,7 22,1 22,4 22,7 22,9 22,9 Estonia 13,6 13,6 13,6 12,7 12,7 12,7 11,3 11,3 11,3 Zone euro (17 pays) , ,1 10,2 10,3 10,3 10,4 10,4 Source : Eurostat Map page 20 GDP per inhabitant for 2010 (purchasing power ratio in euro 2010) GDP per inhabitant in value Purchasing Power Ratio Index GDP per inhabitant in standard of purchasing power Estonia Slovakia Portugal Malta Slovenia Greece Cyprus Spain Italy France Finland Germany Belgium Austria Ireland Netherlands Source : National Accounts, Eurostat 42
42 Graphic page 22 Note: In 1995, the German public deficit reached 9.7 points of the GDP of which 7.5 points of the GDP came from the taking over by the Amortization Funds of debts inherited from commitments of the Treuhand Agency which managed nationalized companies of the former East Germany. For better readability of this graph, we have only used the level of public debt which would have occurred in 1995 without this debt takeover. Map page 26 Population in 2011 and change from 2000 to 2011 Population in 2011 (in millions) Rate of population change between 2000 and 2011 (by %) Lithuania 3,2-7,9 Bulgaria 7,4-7,0 Latvia 2,2-6,0 Romania 21,1-4,7 Hungary 10,0-2,6 Estonia 1,3-2,3 Poland 38,0-1,1 Germany 81,8-0,5 Slovakia 5,4 0,7 Czech Republic 10,5 2,2 Slovenia 2,0 2,3 Greece 11,2 2,4 Denmark 5,5 2,9 Finland 5,4 3,7 Netherlands 16,7 5,0 Austria 8,4 5,1 Portugal 10,8 5,2 Sweden 9,3 5,4 Belgium 10,7 5,5 Italy 60,3 5,6 Malta 0,4 5,7 UK 62,6 6,3 France 65,2 7,4 Cyprus 0,9 13,0 Source : FMI 43
43 Map page 27 Structure by population age in 2010 (by % of total) Less than 15 yrs old 15 to 64 yrs old 65 yrs old or older France 18,6 65,1 16,3 Italy 14,1 65,9 20,0 Belgium 16,9 65,9 17,2 Finland 16,6 66,2 17,2 Germany 13,2 66,3 20,5 Greece 14,5 66,5 19,1 Zone euro 15,4 66,5 18,1 Portugal 15,2 66,9 17,9 Ireland 21,5 67,1 11,4 Netherlands 17,7 67,4 14,9 Estonia 15,2 67,7 17,1 Austria 15,0 67,9 17,1 Spain 15,1 68,2 16,7 Luxembourg 18,1 68,6 13,3 Cyprus 17,8 69,3 12,9 Slovenia 14,1 69,4 16,5 Malta 15,4 69,5 15,1 Slovakia 15,4 72,4 12,2 Source : Eurostat, Forces de Travail surveys Table page 28 Purchasing Power Ratio in the countries of the Euro area Slovakia 68 Estonia 68 Malta 73 Portugal 83 Slovenia 83 Cyprus 89 Greece 92 Spain 93 Italy 105 Germany 105 Netherlands 109 Austria 111 Ireland 112 Belgium 112 France 113 Finland 119 Luxembourg 120 Source : Eurostat Note : The GDP per French inhabitant would be 26.2 and not 27.7 if we used the total population and not the population numbers used by the Forces de Travail survey which did not take into account the population outside of the mainland.the GDP per work hour would be 44.1 instead of
44 Map page 29 Average annual working time in 2010 Full-time salaried employees Part-time salaried employees Full-time non-salaried workers Malta Greece Estonia Slovakia Cyprus Germany Portugal Austria Italy Slovenia Ireland Spain Luxembourg Netherlands Belgium France Finland Source : Eurostat, Forces de Travail survey Map page 30 Employment rate in 2010 and changes in the employment rate between 2005 and 2010 (15 64 year olds) 2010 Change Germany 71,1 5,1 Austria 71,7 3,1 Belgium 62 0,9 Cyprus 69,7 1,2 Spain 58,6-4,7 Estonia 61-3,4 Finland 68,1-0,3 France 63,8 0,1 Greece 59,6-0,5 Ireland 60-7,6 Italy 56,9-0,7 Luxembourg 65,2 1,6 Malta 56,1 2,2 Netherlands 74,7 1,5 Portugal 65,6-1,9 Slovakia 58,8 1,1 Slovenia 66,2 0,2 Source : Eurostat, Forces de Travail survey. The national accounts differ a bit from these figures. 45
45 Map page 31 CO 2 emissions (in millions of metric tons and in metric tons per inhabitant) MtCO 2 tco 2 /inhab MtCO 2 tco 2 /inhab Latvia 7 3,1 8,2 3,6 Lithuania 13 3,9 15 4,5 Romania 85, ,7 4,9 Hungary 50,4 5 56,1 5,6 Sweden 46, ,5 Portugal 56,1 5,3 59,4 5,6 France 377,8 5,9 394,9 6,2 Bulgaria 45,8 6 49,9 5,4 Malta 2,5 6,1 2,7 6,4 Spain 296,9 6, Slovakia 35,1 6,5 39,1 7,2 Italy 417,2 6, ,8 UK 480,6 7,8 531,8 8,7 Slovenia 16 7,9 17,9 8,9 Poland 310,4 8,1 334,7 7,3 Austria 67,5 8,1 73,9 8,9 Norway 42,8 8,9 45,3 5,9 Denmark 49,5 9 54,3 7,1 Greece 104,3 9,2 110,1 9,8 Ireland 42,4 9,5 44,4 9,3 Germany 788,8 9, ,3 Belgium 108, ,1 11,1 Netherlands 169,8 10,3 175,3 10,7 Finland 55,4 10,4 58,2 11 Estonia 14,3 10,7 17,2 12,8 Czech Republic 113,4 10,8 120,4 11,6 Luxembourg 10,7 21,5 11,3 23,1 Citation : Climate Analysis Indicators Tool (CAIT UNFCCC), Version
46 Map page 32 Ratings of agencies on the sovereign debts of the member countries of the euro zone and the average of the ratings FitchRatings Standard & Poor s Moody s Agency Rating On Sovereign Debt Rating on a scale of 20 Agency Rating On Sovereign Debt Rating on a scale of 20 Agency Rating On Sovereign Debt Rating on a scale of 20 Average Rating of 3 Agencies Finland AAA 20 AAA 20 Aaa 20 20,0 Germany AAA 20 AAA 20 Aaa 20 20,0 Luxembourg AAA 20 AAA 20 Aaa 20 20,0 Netherlands AAA 20 AAA 20 Aaa 20 20,0 Austria AAA 20 AA+ 19 Aaa 20 19,7 France AAA 20 AA+ 19 Aaa 20 19,7 Belgium AA 18 AA 18 Aa ,7 Estonia A+ 16 AA- 17 A ,3 Slovenia A 15 A+ 16 A ,3 Slovakia A+ 16 A 15 A ,3 Spain A 15 A 15 A ,7 Malta A+ 16 A- 14 A ,7 Italy A- 14 BBB+ 13 A ,7 Ireland BBB+ 13 BBB+ 13 Ba ,0 Cyprus BBB- 11 BB+ 10 Baa ,7 Portugal BB+ 10 BB 9 Ba3 8 9,0 Greece CCC 4 CC 2 Ca 1 2,3 Average euro zone balanced by the weights of the GDP Average euro zone balanced by the weights of debts 17,6 17,1 17,2 17,3 17,0 16,4 16,6 16,7 Explanation: The ratings of agencies are letters. We have transposed them to grades out of 20 because the different scales of rating include 20 levels. We have thus computed the average of the three agency ratings. 47


47 COMPETITIVENESS FRANCE - GERMANY THE WIDE GAP Never has the industrial competitiveness gap between France and Germany been so wide for ten years. This situation is threatening employment in France and, eventually, the cohesion of the euro zone. France has lost, over the course of recent years, their only comparative advantage, that of less elevated prices. The explanation is simple. When the euro was being created, Germany and France adopted opposing policies: deep reforms in the labor market to free up competitiveness for Germany, rigid and costly labor restrictions for France. Before the euro, France periodically rebuilt its competitiveness by devaluing the franc in relation to the mark. Today, things have changed. We must now count on ourselves. Ending the industrial divergence between France and Germany is within our reach. For that, we must accept a Competitiveness Pact. This book, which analyzes without concession our strengths and our weaknesses, offers solutions. It is aimed at political decision makers and economic and social partners as well as professors and all those who feel concerned about our industrial future and employment in our country. 12,00 euros - Editions Economica, Paris, Coe-Rexecode - Conception : Regards Conseil Observation Center for Economic Research and Expansion of the Economy and Enterprise Development 29, avenue Hoche, Paris Téléphone : +33 (0) Fax : +33 (0) Association régie par la loi du 1er juillet 1901 APE 9412 Z - SIRET TVA FR
European Parliament Eurobarometer (EB79.5) ONE YEAR TO GO UNTIL THE 2014 EUROPEAN ELECTIONS Institutional Part ANALYTICAL OVERVIEW
 ONE YEAR TO GO UNTIL THE 2014 EUROPEAN ELECTIONS Institutional Part ANALYTICAL OVERVIEW") Directorate-General for Communication Public Opinion Monitoring Unit Brussels, 21 August 2013. European Parliament Eurobarometer (EB79.5) ONE YEAR TO GO UNTIL THE 2014 EUROPEAN ELECTIONS Institutional
Directorate-General for Communication Public Opinion Monitoring Unit Brussels, 21 August 2013. European Parliament Eurobarometer (EB79.5) ONE YEAR TO GO UNTIL THE 2014 EUROPEAN ELECTIONS Institutional
European Parliament Eurobarometer (EB79.5) ONE YEAR TO GO TO THE 2014 EUROPEAN ELECTIONS Economic and social part DETAILED ANALYSIS
 ONE YEAR TO GO TO THE 2014 EUROPEAN ELECTIONS Economic and social part DETAILED ANALYSIS") Directorate-General for Communication Public Opinion Monitoring Unit Brussels, 18 October 2013 European Parliament Eurobarometer (EB79.5) ONE YEAR TO GO TO THE 2014 EUROPEAN ELECTIONS Economic and social
Directorate-General for Communication Public Opinion Monitoring Unit Brussels, 18 October 2013 European Parliament Eurobarometer (EB79.5) ONE YEAR TO GO TO THE 2014 EUROPEAN ELECTIONS Economic and social
GERMANY, JAPAN AND INTERNATIONAL PAYMENT IMBALANCES
 Articles Articles Articles Articles Articles CENTRAL EUROPEAN REVIEW OF ECONOMICS & FINANCE Vol. 2, No. 1 (2012) pp. 5-18 Slawomir I. Bukowski* GERMANY, JAPAN AND INTERNATIONAL PAYMENT IMBALANCES Abstract
STATISTICAL REFLECTIONS
 World Population Day, 11 July 217 STATISTICAL REFLECTIONS 18 July 217 Contents Introduction...1 World population trends...1 Rearrangement among continents...2 Change in the age structure, ageing world
Economic Effects in Slovenia within Integration in European Union
 Journal of Empirical Research in Accounting & Auditing ISSN (2384-4787) J. Emp. Res. Acc. Aud. 2, No. 2 (Oct. -2015) Economic Effects in Slovenia within Integration in European Union Amir Imeri AMA International
Europe in Figures - Eurostat Yearbook 2008 The diversity of the EU through statistics
 STAT/08/75 2 June 2008 Europe in Figures - Eurostat Yearbook 2008 The diversity of the EU through statistics What was the population growth in the EU27 over the last 10 years? In which Member State is
A2 Economics. Enlargement Countries and the Euro. tutor2u Supporting Teachers: Inspiring Students. Economics Revision Focus: 2004
 Supporting Teachers: Inspiring Students Economics Revision Focus: 2004 A2 Economics tutor2u (www.tutor2u.net) is the leading free online resource for Economics, Business Studies, ICT and Politics. Don
Eurostat Yearbook 2006/07 A goldmine of statistical information
 25/2007-20 February 2007 Eurostat Yearbook 2006/07 A goldmine of statistical information What percentage of the population is overweight or obese? How many foreign languages are learnt by pupils in the
Context Indicator 17: Population density
 3.2. Socio-economic situation of rural areas 3.2.1. Predominantly rural regions are more densely populated in the EU-N12 than in the EU-15 Context Indicator 17: Population density In 2011, predominantly
THE NOWADAYS CRISIS IMPACT ON THE ECONOMIC PERFORMANCES OF EU COUNTRIES
 THE NOWADAYS CRISIS IMPACT ON THE ECONOMIC PERFORMANCES OF EU COUNTRIES Laura Diaconu Maxim Abstract The crisis underlines a significant disequilibrium in the economic balance between production and consumption,
A comparative analysis of poverty and social inclusion indicators at European level
 A comparative analysis of poverty and social inclusion indicators at European level CRISTINA STE, EVA MILARU, IA COJANU, ISADORA LAZAR, CODRUTA DRAGOIU, ELIZA-OLIVIA NGU Social Indicators and Standard
Labour market of the new Central and Eastern European member states of the EU in the first decade of membership 125
 Labour market of the new Central and Eastern European member states of the EU in the first decade of membership 125 Annamária Artner Introduction The Central and Eastern European countries that accessed
Migration and the European Job Market Rapporto Europa 2016
 Migration and the European Job Market Rapporto Europa 2016 1 Table of content Table of Content Output 11 Employment 11 Europena migration and the job market 63 Box 1. Estimates of VAR system for Labor
LANDMARKS ON THE EVOLUTION OF E-COMMERCE IN THE EUROPEAN UNION
 Studies and Scientific Researches. Economics Edition, No 21, 215 http://sceco.ub.ro LANDMARKS ON THE EVOLUTION OF E-COMMERCE IN THE EUROPEAN UNION Laura Cătălina Ţimiraş Vasile Alecsandri University of
EUROBAROMETER The European Union today and tomorrow. Fieldwork: October - November 2008 Publication: June 2010
 EUROBAROMETER 66 Standard Eurobarometer Report European Commission EUROBAROMETER 70 3. The European Union today and tomorrow Fieldwork: October - November 2008 Publication: June 2010 Standard Eurobarometer
Size and Development of the Shadow Economy of 31 European and 5 other OECD Countries from 2003 to 2013: A Further Decline
 January 31, 2013 ShadEcEurope31_Jan2013.doc Size and Development of the Shadow Economy of 31 European and 5 other OECD Countries from 2003 to 2013: A Further Decline by Friedrich Schneider *) In the Tables
For example, some EU countries would cooperate in the areas of:
 ECONOMICS ECONOMIC RESEARCH June 23, 216 No. 632 Towards a European Union "à la carte"? The debate in the United Kingdom on a Brexit and the debates in different European countries on the respective role
INTERNAL SECURITY. Publication: November 2011
 Special Eurobarometer 371 European Commission INTERNAL SECURITY REPORT Special Eurobarometer 371 / Wave TNS opinion & social Fieldwork: June 2011 Publication: November 2011 This survey has been requested
The evolution of turnout in European elections from 1979 to 2009
 The evolution of turnout in European elections from 1979 to 2009 Nicola Maggini 7 April 2014 1 The European elections to be held between 22 and 25 May 2014 (depending on the country) may acquire, according
HIGHLIGHTS. There is a clear trend in the OECD area towards. which is reflected in the economic and innovative performance of certain OECD countries.
 HIGHLIGHTS The ability to create, distribute and exploit knowledge is increasingly central to competitive advantage, wealth creation and better standards of living. The STI Scoreboard 2001 presents the
EUROBAROMETER 72 PUBLIC OPINION IN THE EUROPEAN UNION
 Standard Eurobarometer European Commission EUROBAROMETER 72 PUBLIC OPINION IN THE EUROPEAN UNION AUTUMN 2009 COUNTRY REPORT SUMMARY Standard Eurobarometer 72 / Autumn 2009 TNS Opinion & Social 09 TNS Opinion
Curing Europe s Growing Pains: Which Reforms?
 Curing Europe s Growing Pains: Which Reforms? Luc Everaert Assistant Director European Department International Monetary Fund Brussels, 21 November Copyright rests with the author. All rights reserved.
Is this the worst crisis in European public opinion?
 EFFECTS OF THE ECONOMIC AND FINANCIAL CRISIS ON EUROPEAN PUBLIC OPINION Is this the worst crisis in European public opinion? Since 1973, Europeans have held consistently positive views about their country
BUSINESS CYCLES AND ECONOMIC RECOVERY IN EUROPEAN UNION. A SURVEY
 BUSINESS CYCLES AND ECONOMIC RECOVERY IN EUROPEAN UNION. A SURVEY MĂRGINEAN Silvia Abstract: This paper explores the evolution of the European Union economy during the last contraction, between and. Assuming
Letter prices in Europe. Up-to-date international letter price survey. March th edition
 Letter prices in Europe Up-to-date international letter price survey. March 2014 13th edition 1 Summary This is the thirteenth time Deutsche Post has carried out a study, drawing a comparison between letter
The regional and urban dimension of Europe 2020
 ESPON Workshop The regional and urban dimension of Europe 2020 News on the implementation of the EUROPE 2020 Strategy Philippe Monfort DG for Regional Policy European Commission 1 Introduction June 2010
FOREIGN TRADE AND FDI AS MAIN FACTORS OF GROWTH IN THE EU 1
 1. FOREIGN TRADE AND FDI AS MAIN FACTORS OF GROWTH IN THE EU 1 Lucian-Liviu ALBU 2 Abstract In the last decade, a number of empirical studies tried to highlight a strong correlation among foreign trade,
THE DEVELOPMENT OF ECONOMIES OF THE EUROPEAN UNION MEMBER STATES IN THE PERIOD OF
 THE DEVELOPMENT OF ECONOMIES OF THE EUROPEAN UNION MEMBER STATES IN THE PERIOD OF 2003-2014. Mariusz Rogalski Maria Curie-Sklodowska University, Poland mariusz.rogalski@poczta.umcs.lublin.pl Abstract:
OECD ECONOMIC SURVEY OF LITHUANIA 2018 Promoting inclusive growth
 OECD ECONOMIC SURVEY OF LITHUANIA 218 Promoting inclusive growth Vilnius, 5 July 218 http://www.oecd.org/eco/surveys/economic-survey-lithuania.htm @OECDeconomy @OECD 2 21 22 23 24 25 26 27 28 29 21 211
Asylum Trends. Appendix: Eurostat data
 Asylum Trends Appendix: Eurostat data Contents Colophon 2 First asylum applications in Europe (EU, Norway and Switzerland) Monthly asylum applications in the EU, Norway and Switzerland 3 First asylum applications
Asylum Trends. Appendix: Eurostat data
 Asylum Trends Appendix: Eurostat data Contents Colophon 2 First asylum applications in Europe (EU, Norway and Switzerland) Monthly asylum applications in the EU, Norway and Switzerland 3 First asylum applications
Asylum Trends. Appendix: Eurostat data
 Asylum Trends Appendix: Eurostat data Contents Colophon 2 First asylum applications in Europe (EU, Norway and Switzerland) Monthly asylum applications in the EU, Norway and Switzerland 3 First asylum applications
Asylum Trends. Appendix: Eurostat data
 Asylum Trends Appendix: Eurostat data Contents Colophon 2 First asylum applications in Europe (EU, Norway and Switzerland) Monthly asylum applications in the EU, Norway and Switzerland 3 First asylum applications
Comparative Economic Geography
 Comparative Economic Geography 1 WORLD POPULATION gross world product (GWP) The GWP Global GDP In 2012: GWP totalled approximately US $83.12 trillion in terms of PPP while the per capita GWP was approx.
The European Union Economy, Brexit and the Resurgence of Economic Nationalism
 The European Union Economy, Brexit and the Resurgence of Economic Nationalism George Alogoskoufis is the Constantine G. Karamanlis Chair of Hellenic and European Studies, The Fletcher School of Law and
Special Eurobarometer 467. Report. Future of Europe. Social issues
 Future of Europe Social issues Fieldwork Publication November 2017 Survey requested by the European Commission, Directorate-General for Communication and co-ordinated by the Directorate- General for Communication
Study. Importance of the German Economy for Europe. A vbw study, prepared by Prognos AG Last update: February 2018
 Study Importance of the German Economy for Europe A vbw study, prepared by Prognos AG Last update: February 2018 www.vbw-bayern.de vbw Study February 2018 Preface A strong German economy creates added
Asylum Trends. Appendix: Eurostat data
 Asylum Trends Appendix: Eurostat data Contents Colophon 2 First asylum applications in Europe (, Norway and Switzerland) Monthly asylum applications in the, Norway and Switzerland 3 First asylum applications
Special Eurobarometer 440. Report. Europeans, Agriculture and the CAP
 Survey requested by the European Commission, Directorate-General for Agriculture and Rural Development and co-ordinated by the Directorate-General for Communication This document does not represent the
Asylum Trends. Appendix: Eurostat data
 Asylum Trends Appendix: Eurostat data Contents Colophon 2 First asylum applications in Europe (, Norway and Switzerland) Monthly asylum applications in the, Norway and Switzerland 3 First asylum applications
Asylum Trends. Appendix: Eurostat data
 Asylum Trends Appendix: Eurostat data Contents Colophon 2 First asylum applications in Europe (, Norway and Switzerland) Monthly asylum applications in the, Norway and Switzerland 3 First asylum applications
Eastern Europe: Economic Developments and Outlook. Miroslav Singer
 Eastern Europe: Economic Developments and Outlook Miroslav Singer Governor, Czech National Bank Distinguished Speakers Seminar European Economics & Financial Centre London, 22 July 2014 Miroslav Význam
EUROPEAN UNION CITIZENSHIP
 Flash Eurobarometer EUROPEAN UNION CITIZENSHIP REPORT Fieldwork: November 2012 Publication: February 2013 This survey has been requested by the European Commission, Directorate-General Justice and co-ordinated
Evolution of the European Union, the euro and the Eurozone Sovereign Debt Crisis
 Evolution of the European Union, the euro and the Eurozone Sovereign Debt Crisis Brexit? Dr. Julian Gaspar, Executive Director Center for International Business Studies & Clinical Professor of International
Economic Growth, Foreign Investments and Economic Freedom: A Case of Transition Economy Kaja Lutsoja
 Economic Growth, Foreign Investments and Economic Freedom: A Case of Transition Economy Kaja Lutsoja Tallinn School of Economics and Business Administration of Tallinn University of Technology The main
Belgium s foreign trade
 Belgium s FIRST 9 months Belgium s BELGIAN FOREIGN TRADE AFTER THE FIRST 9 MONTHS OF Analysis of the figures for (first 9 months) (Source: eurostat - community concept*) After the first nine months of,
From Europe to the Euro
 From Europe to the Euro 2012 Euro Challenge Student Orientation Florida International University December 6 th, 2011 Kasper Zeuthen Delegation of the European Union Washington, DC www.euro-challenge.org
Identification of the respondent: Fields marked with * are mandatory.
 Towards implementing European Public Sector Accounting Standards (EPSAS) for EU Member States - Public consultation on future EPSAS governance principles and structures Fields marked with are mandatory.
The new demographic and social challenges in Spain: the aging process and the immigration
 International Geographical Union Commission GLOBAL CHANGE AND HUMAN MOBILITY The 4th International Conference on Population Geographies The Chinese University of Hong Kong (10-13 July 2007) The new demographic
What can we learn from productivity dynamics over the crisis episode in the EU?
 What can we learn from productivity dynamics over the crisis episode in the EU? By Klaus S. Friesenbichler and Christian Glocker Vienna, 02 May 2018 ISSN 2305-2635 Policy Recommendations 1. Macroeconomic
WILL CHINA S SLOWDOWN BRING HEADWINDS OR OPPORTUNITIES FOR EUROPE AND CENTRAL ASIA?
 ECA Economic Update April 216 WILL CHINA S SLOWDOWN BRING HEADWINDS OR OPPORTUNITIES FOR EUROPE AND CENTRAL ASIA? Maurizio Bussolo Chief Economist Office and Asia Region April 29, 216 Bruegel, Brussels,
Gender pay gap in public services: an initial report
 Introduction This report 1 examines the gender pay gap, the difference between what men and women earn, in public services. Drawing on figures from both Eurostat, the statistical office of the European
From Europe to the Euro
 From Europe to the Euro Presentation ti by Eva Horelová Deputy Spokesperson, Deputy Head of Press and Public Diplomacy Delegation of the European Union to the United States Florida Student Orientation,
EUROPEANS ATTITUDES TOWARDS SECURITY
 Special Eurobarometer 432 EUROPEANS ATTITUDES TOWARDS SECURITY REPORT Fieldwork: March 2015 Publication: April 2015 This survey has been requested by the European Commission, Directorate-General for Migration
Fertility rate and employment rate: how do they interact to each other?
 Fertility rate and employment rate: how do they interact to each other? Presentation by Gyula Pulay, general director of the Research Institute of SAO Changing trends From the middle of the last century
Convergence: a narrative for Europe. 12 June 2018
 Convergence: a narrative for Europe 12 June 218 1.Our economies 2 Luxembourg Ireland Denmark Sweden Netherlands Austria Finland Germany Belgium United Kingdom France Italy Spain Malta Cyprus Slovenia Portugal
EUROPEAN ECONOMY VS THE TRAP OF THE EUROPE 2020 STRATEGY
 EUROPEAN ECONOMY VS THE TRAP OF THE EUROPE 2020 STRATEGY Romeo-Victor IONESCU * Abstract: The paper deals to the analysis of Europe 2020 Strategy goals viability under the new global socio-economic context.
Objective Indicator 27: Farmers with other gainful activity
 3.5. Diversification and quality of life in rural areas 3.5.1. Roughly one out of three farmers is engaged in gainful activities other than farm work on the holding For most of these farmers, other gainful
Special Eurobarometer 461. Report. Designing Europe s future:
 Designing Europe s future: Trust in institutions Globalisation Support for the euro, opinions about free trade and solidarity Fieldwork Survey requested by the European Commission, Directorate-General
Quantitative evidence of post-crisis structural macroeconomic changes
 Quantitative evidence of post-crisis structural macroeconomic changes Roberto Camagni, Roberta Capello, Andrea Caragliu, Barbara Chizzolini Politecnico di Milano To be discussed at the Advisory Board Forum,
NEGOTIATIONS ON ACCESSION BY BULGARIA AND ROMANIA TO THE EUROPEAN UNION
 NEGOTIATIONS ON ACCESSION BY BULGARIA AND ROMANIA TO THE EUROPEAN UNION Brussels, 31 March 2005 AA 1/2/05 REV 2 TREATY OF ACCESSION: TABLE OF CONTENTS DRAFT LEGISLATIVE ACTS AND OTHER INSTRUMENTS Delegations
ANNEX. to the. Proposal for a Council Decision
 EUROPEAN COMMISSION Brussels, 18.2.2016 COM(2016) 70 final ANNEX 1 ANNEX to the Proposal for a Council Decision on the signing, on behalf of the European Union and its Member States, of the Protocol to
GDP - AN INDICATOR OF PROSPERITY OR A MISLEADING ONE? CRIVEANU MARIA MAGDALENA, PHD STUDENT, UNIVERSITATEA DIN CRAIOVA, ROMANIA
 GDP - AN INDICATOR OF PROSPERITY OR A MISLEADING ONE? CRIVEANU MARIA MAGDALENA, PHD STUDENT, UNIVERSITATEA DIN CRAIOVA, ROMANIA mag_da64 @yahoo.com Abstract The paper presents a comparative analysis of
From Europe to the Euro Student Orientations 2014 Euro Challenge
 From Europe to the Euro Student Orientations 2014 Euro Challenge www.euro-challenge.org 1 What is the European Union? A unique institution Member States voluntarily cede national sovereignty in many areas
EUROPE DIRECT Contact Centre
 EUROPE DIRECT Contact Centre Quarterly report for January - March 2014 CONTENTS page Enquiries by country and channel 2 Enquiries by language and channel 3 Enquiries by economic category 4 Enquiries by
Real Convergence of Central and Eastern Europe Economic and Monetary Union
 Bulletin UASVM Horticulture, 68(2)/2011 Print ISSN 1843-5254; Electronic ISSN 1843-5394 Real Convergence of Central and Eastern Europe Economic and Monetary Union Roxana PIRVU, Mihai BUDURNOIU University
Central and Eastern European Countries : their progress toward accession to the European Union
 www.asmp.fr - Académie des Sciences morales et politiques Discours de M. Jacques de Larosière en date du 15 octobre 2002 Central and Eastern European Countries : their progress toward accession to the
Proposal for a COUNCIL DECISION
 EUROPEAN COMMISSION Brussels, 2.8.2013 COM(2013) 568 final 2013/0273 (NLE) Proposal for a COUNCIL DECISION on the conclusion, on behalf of the European Union and its Member States, of the Protocol to the
Euro area unemployment rate at 9.9% EU27 at 9.4%
 STAT/11/76 April 2011 Euro area unemployment rate at 9.9% EU27 at 9.4% The euro area 1 (EA17) seasonally-adjusted 2 unemployment rate 3 was 9.9% in April 2011, unchanged compared with March 4. It was.2%
SPANISH NATIONAL YOUTH GUARANTEE IMPLEMENTATION PLAN ANNEX. CONTEXT
 2013 SPANISH NATIONAL YOUTH 2013 GUARANTEE IMPLEMENTATION PLAN ANNEX. CONTEXT 2 Annex. Context Contents I. Introduction 3 II. The labour context for young people 4 III. Main causes of the labour situation
An introduction to inequality in Europe
 An introduction to inequality in Europe Tackling inequalities in Europe: the role of social investment Disclaimer The findings, interpretations and conclusions expressed here are those of the authors and
REPORT FROM THE COMMISSION TO THE EUROPEAN PARLIAMENT AND THE COUNCIL
 EUROPEAN COMMISSION Brussels, 6.3.2017 COM(2017) 112 final REPORT FROM THE COMMISSION TO THE EUROPEAN PARLIAMENT AND THE COUNCIL ON THE APPLICATION BY THE MEMBER STATES OF COUNCIL DIRECTIVE 95/50/EC ON
Ilze JUREVIČA Ministry of Environmental Protection and Regional Development Regional Policy Department
 Role of small and medium sized urban areas in territorial development: Latvian experience and plans for the upcoming Latvian presidency of the Council of the EU Ilze JUREVIČA Ministry of Environmental
Mark Allen. The Financial Crisis and Emerging Europe: What Happened and What s Next? Senior IMF Resident Representative for Central and Eastern Europe
 The Financial Crisis and Emerging Europe: What Happened and What s Next? Seminar with Romanian Trade Unions Bucharest, November 2, 21 Mark Allen Senior IMF Resident Representative for Central and Eastern
5-Year Evaluation of the Korea-EU FTA Implementation
 5-Year Evaluation of the Korea-EU FTA Implementation From Korea s perspective EU-Korea Business Forum "The EU-Korea FTA after five years: What s been achieved and what s next?" September 22 nd 2016, Seoul
Russian Federation. OECD average. Portugal. United States. Estonia. New Zealand. Slovak Republic. Latvia. Poland
 INDICATOR TRANSITION FROM EDUCATION TO WORK: WHERE ARE TODAY S YOUTH? On average across OECD countries, 6 of -19 year-olds are neither employed nor in education or training (NEET), and this percentage
Settling In 2018 Main Indicators of Immigrant Integration
 Settling In 2018 Main Indicators of Immigrant Integration Settling In 2018 Main Indicators of Immigrant Integration Notes on Cyprus 1. Note by Turkey: The information in this document with reference to
European Union Expansion and the Euro: Croatia, Iceland and Turkey
 International Journal of Business and Social Science Vol. 5, No. 13; December 2014 European Union Expansion and the Euro: Croatia, Iceland and Turkey Cynthia Royal Tori, PhD Valdosta State University Langdale
PATIENTS RIGHTS IN CROSS-BORDER HEALTHCARE IN THE EUROPEAN UNION
 Special Eurobarometer 425 PATIENTS RIGHTS IN CROSS-BORDER HEALTHCARE IN THE EUROPEAN UNION SUMMARY Fieldwork: October 2014 Publication: May 2015 This survey has been requested by the European Commission,
Standard Eurobarometer 89 Spring Report. European citizenship
 European citizenship Fieldwork March 2018 Survey requested and co-ordinated by the European Commission, Directorate-General for Communication This document does not represent the point of view of the European
3.1. Importance of rural areas
 3.1. Importance of rural areas 3.1.1. CONTEXT 1 - DESIGNATION OF RURAL AREAS A consistent typology of 'predominantly rural', 'intermediate' or 'predominantly urban' regions for EC statistics and reports
GDP per capita in purchasing power standards
 GDP per capita in purchasing power standards GDP per capita varied by one to six across the Member States in 2011, while Actual Individual Consumption (AIC) per capita in the Member States ranged from
Standard Eurobarometer 85. Public opinion in the European Union
 Public opinion in the European Union Fieldwork: May 2016 Survey conducted by TNS opinion & social at the request of the European Commission, Directorate-General for Communication Survey coordinated by
Options for Romanian and Bulgarian migrants in 2014
 Briefing Paper 4.27 www.migrationwatchuk.com Summary 1. The UK, Germany, France and the Netherlands are the four major countries opening their labour markets in January 2014. All four are likely to be
EUROBAROMETER 62 PUBLIC OPINION IN THE EUROPEAN UNION
 Standard Eurobarometer European Commission EUROBAROMETER 6 PUBLIC OPINION IN THE EUROPEAN UNION AUTUMN 004 Standard Eurobarometer 6 / Autumn 004 TNS Opinion & Social NATIONAL REPORT EXECUTIVE SUMMARY ROMANIA
BUILDING RESILIENT REGIONS FOR STRONGER ECONOMIES OECD
 o: o BUILDING RESILIENT REGIONS FOR STRONGER ECONOMIES OECD Table of Contents Acronyms and Abbreviations 11 List of TL2 Regions 13 Preface 16 Executive Summary 17 Parti Key Regional Trends and Policies
Public consultation on a European Labour Authority and a European Social Security Number
 Public consultation on a European Labour Authority and a European Social Security Number 1. About you You are replying: As an individual In your professional capacity (including self-employed) or on behalf
PUBLIC CLIMA60 ENV492 ENER207 ONU74 FORETS56 TRANS293 IND175 FISC /14ADD1 BE/FC/kp DGE1 LIMITE EN. Councilofthe EuropeanUnion
 ConseilUE Councilofthe EuropeanUnion InterinstitutionalFile: 2013/0376(NLE) PUBLIC Brussels,11November2014 (OR.en) 10400/14 ADD1 LIMITE CLIMA60 ENV492 ENER207 ONU74 FORETS56 TRANS293 IND175 FISC90 LEGISLATIVEACTSANDOTHERINSTRUMENTS
Regional inequality and the impact of EU integration processes. Martin Heidenreich
 Regional inequality and the impact of EU integration processes Martin Heidenreich Table of Contents 1. Income inequality in the EU between and within nations 2. Patterns of regional inequality and its
From Europe to the Euro. Delegation of the European Union to the United States
 From Europe to the Euro Delegation of the European Union to the United States www.euro-challenge.org What is the European Union? A unique institution Member States voluntarily cede national sovereignty
EUROPEANS, THE EUROPEAN UNION AND THE CRISIS
 Standard Eurobarometer 80 Autumn 2013 EUROPEANS, THE EUROPEAN UNION AND THE CRISIS REPORT Fieldwork: November 2013 This survey has been requested and co-ordinated by the European Commission, Directorate-General
International investment resumes retreat
 FDI IN FIGURES October 213 International investment resumes retreat 213 FDI flows fall back to crisis levels Preliminary data for 213 show that global FDI activity declined by 28% (to USD 256 billion)
From Europe to the Euro Student Orientations 2013 Euro Challenge
 From Europe to the Euro Student Orientations 2013 Euro Challenge www.euro-challenge.org 1 What is the European Union? A unique institution Member States voluntarily cede national sovereignty in many areas
International Summer Program
 University of Ulm International Summer Program European Integration European Union An Overview Prof. Dr. Werner Smolny, Tuesday, June 21, 2005 University of Ulm, International Summer Program 2005, June
European Union Passport
 European Union Passport European Union Passport How the EU works The EU is a unique economic and political partnership between 28 European countries that together cover much of the continent. The EU was
House price-to-income ratio (standardised), Distribution of poor households by tenure status,
, Distribution of poor households by tenure status,") he aim of this Index is to provide a statistical overview of housing and housing exclusion today in European Member States. This is done using data made available by Eurostat through EUSILC (EU Statistics
he aim of this Index is to provide a statistical overview of housing and housing exclusion today in European Member States. This is done using data made available by Eurostat through EUSILC (EU Statistics
Data Protection in the European Union. Data controllers perceptions. Analytical Report
 Gallup Flash Eurobarometer N o 189a EU communication and the citizens Flash Eurobarometer European Commission Data Protection in the European Union Data controllers perceptions Analytical Report Fieldwork:
what are the challenges, stakes and prospects of the EU accession negotiation?
 17/10/00 CENTRAL AND EASTERN EUROPE EUROPE : ECONOMIC ACHIEVEMENTS, EUROPEAN INTEGRATION PROSPECTS Roadshow EMEA Strategy Product London, October 17, and New York, October 25, 2000 The European Counsel
Work and income SLFS 2016 in brief. The Swiss Labour Force Survey. Neuchâtel 2017
 03 Work and income 363-1600 SLFS 2016 in brief The Swiss Labour Force Survey Neuchâtel 2017 Published by: Information: Editors: Series: Topic : Original text: Translation: Layout: Graphics: Front page:
A2 Economics. Standard of Living and Economic Progress. tutor2u Supporting Teachers: Inspiring Students. Economics Revision Focus: 2004
 Supporting Teachers: Inspiring Students Economics Revision Focus: 2004 A2 Economics Standard of Living and Economic Progress tutor2u (www.tutor2u.net) is the leading free online resource for Economics,