< this page intentionally left blank >
|
|
|
- Roderick Barker
- 6 years ago
- Views:
Transcription
1
2 < this page intentionally left blank >

3 ST/ESA/SER.A/75 Department of Economic and Social Affairs International Migration Report 015 Highlights United Nations New York, 016
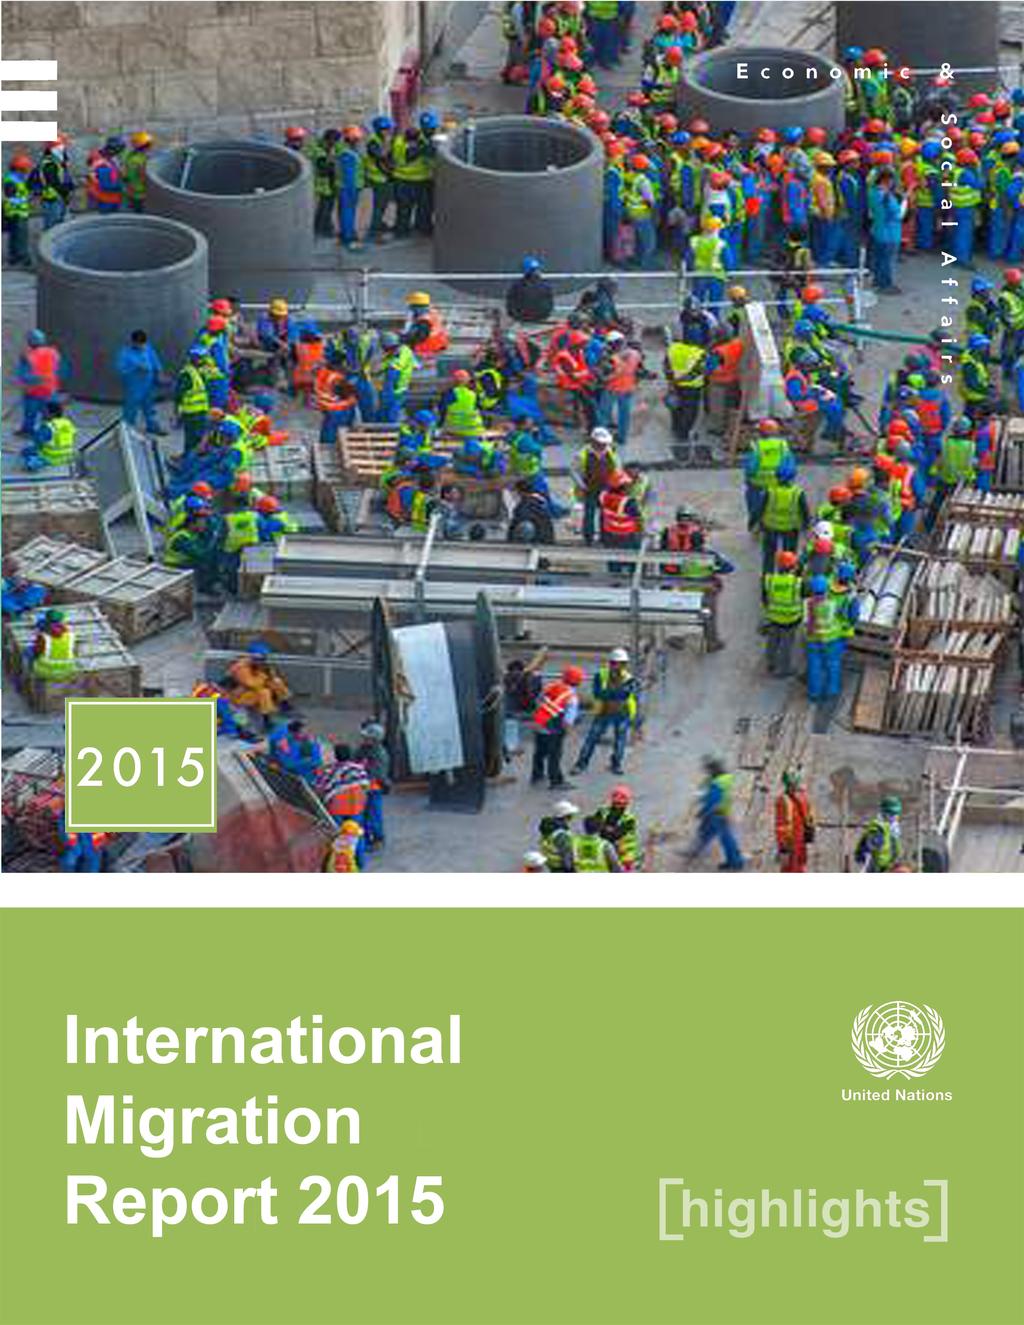
4 The Department of Economic and Social Affairs of the United Nations Secretariat is a vital interface between global policies in the economic, social and environmental spheres and national action. The Department works in three main interlinked areas: (i) it compiles, generates and analyses a wide range of economic, social and environmental data and information on which States Members of the United Nations draw to review common problems and take stock of policy options; (ii) it facilitates the negotiations of Member States in many intergovernmental bodies on joint courses of action to address ongoing or emerging global challenges; and (iii) it advises interested Governments on the ways and means of translating policy frameworks developed in United Nations conferences and summits into programmes at the country level and, through technical assistance, helps build national capacities. The Population Division of the Department of Economic and Social Affairs provides the international community with timely and accessible population data and analysis of population trends and development outcomes for all countries and areas of the world. To this end, the Division undertakes regular studies of population size and characteristics and of all three components of population change (fertility, mortality and migration). Founded in 196, the Population Division provides substantive support on population and development issues to the United Nations General Assembly, the Economic and Social Council and the Commission on Population and Development. It also leads or participates in various interagency coordination mechanisms of the United Nations system. The work of the Division also contributes to strengthening the capacity of Member States to monitor population trends and to address current and emerging population issues. This report was prepared by Clare Menozzi, under the supervision of Bela Hovy. Notes The designations employed in this report and the material presented in it do not imply the expression of any opinions whatsoever on the part of the Secretariat of the United Nations concerning the legal status of any country, territory, city or area or of its authorities, or concerning the delimitation of its frontiers or boundaries. This report is available in electronic format on the Division s website at For further information about this report, please contact the Office of the Director, Population Division, Department of Economic and Social Affairs, United Nations, New York, 10017, USA, by fax: or by at population@un.org. Suggested citation: United Nations, Department of Economic and Social Affairs, Population Division (016). International Migration Report 015: Highlights (ST/ESA/SER.A/75). Official symbols of United Nations documents are composed of capital letters combined with numbers, as illustrated in the above citation. Cover photo: Workers gathering on construction site in Qatar by Alexey Sergeev Used under CC BY.0, cropped from original. Published by the United Nations Copyright United Nations, 016 All rights reserved
5 International Migration Report 015: Highlights Key Facts The number of international migrants worldwide has continued to grow rapidly over the past fifteen years reaching million in 015, up from million in 010 and 17 million in 000. Nearly two thirds of all international migrants live in Europe (76 million) or Asia (75 million). Northern America hosted the third largest number of international migrants (5 million), followed by Africa (1 million), Latin America and the Caribbean (9 million) and Oceania (8 million). In 015, two thirds (67 per cent) of all international migrants were living in just twenty countries. The largest number of international migrants (7 million) resided in the United States of America, equal to about a fifth (19 per cent) of the world s total. Germany and the Russian Federation hosted the second and third largest numbers of migrants worldwide (1 million each), followed by Saudi Arabia (10 million). In 01, the total number of refugees in the world was estimated at 19.5 million. Turkey became the largest refugee-hosting country worldwide, with 1.6 million refugees, followed by Pakistan (1.5 million), Lebanon (1. million), and the Islamic Republic of Iran (1.0 million). More than half (5 per cent) of all refugees worldwide came from just three countries: the Syrian Arab Republic (.9 million), Afghanistan (.6 million), and Somalia (1.1 million). Women comprise slightly less than half of all international migrants. The share of female migrants fell from 9 per cent in 000 to 8 per cent in 015. Female migrants outnumber male migrants in Europe and Northern America, while in Africa and Asia, particularly Western Asia, migrants are predominantly men. The median age of international migrants worldwide was 9 years in 015, a slight increase from 8 years in 000. Yet in some major areas, the migrant stock is becoming younger. Between 000 and 015, the median age of international migrants declined in Asia, Latin America and the Caribbean, and Oceania. Most migrants worldwide originate from middle-income countries (157 million in 015). Between 000 and 015, the number of migrants originating from middle-income countries increased more rapidly than those from countries in any other income group. The majority of migrants from middle-income countries were living in a highincome country. In 015, of the million international migrants worldwide, 10 million ( per cent), were born in Asia. Europe was the birthplace of the second largest number (6 million or 5 per cent), followed by Latin America and the Caribbean (7 million or 15 per cent) and Africa ( million or 1 per cent). In 015, India had the largest diaspora in the world (16 million), followed by Mexico (1 million). Other countries with large diasporas included the Russian Federation (11 million), China (10 million), Bangladesh (7 million), and Pakistan and Ukraine (6 million, each). Between 000 and 015, positive net migration contributed to per cent of the population growth in Northern America and per cent in Oceania. In Europe the size of the population would have fallen between 000 and 015 in the absence of positive net migration. The ratification of United Nations legal instruments related to international migrants and migration remains uneven. As of October 015, 6 Member States had ratified all five of the United Nations legal instruments related to international migration, while 1 Member States had ratified none of the relevant instruments. Since the 199 International Conference on Population and Development (ICPD), the issue of international migration and its relation to development has risen steadily on the agenda of the international community. The 00 Agenda for Sustainable Development not only includes several migration-related targets, but also encourages countries to disaggregate targets by, inter alia, migratory status.
6 International Migration Report 015: Highlights Introduction In today s increasingly interconnected world, international migration has become a reality that touches nearly all corners of the globe, often making distinctions between countries of origin, transit and destination obsolete. Modern transportation has made it easier, cheaper and faster for people to move. At the same time conflict, poverty, inequality and lack of decent jobs are among the reasons that compel people to leave their homes in search of better futures for themselves and their families. When supported by appropriate policies, migration can contribute to inclusive and sustainable economic growth and development in both home and host communities. In 01, migrants from developing countries sent home an estimated US $6 billion in remittances; a. percent increase over the 01 level (World Bank 015), far exceeding official development assistance and, excluding China, foreign direct investment. These funds are often used to improve the livelihoods of families and communities through investments in education, health, sanitation, housing and infrastructure. Countries of destination can also benefit from migration. In countries of destination, migrants often fill critical labour shortages, create jobs as entrepreneurs, and contribute in terms of taxes and social security contributions. Migrants, as some of the most dynamic members of society, can also forge new paths in science, medicine and technology and enrich their host communities by promoting cultural diversity. In spite of the many benefits of migration, migrants themselves remain among the most vulnerable members of society. They are often the first to lose their job in the event of an economic downturn, often working for less pay, for longer hours, and in worse conditions than national workers. While for many migration is an empowering experience, others endure human rights violations, abuse and discrimination. Migrants, particularly women and children, are too often victims of human trafficking and the heinous forms of exploitation that human trafficking entails. Further, in many parts of the world, migration remains one of the few options for people, particularly young people, to find decent work, and escape poverty, persecution and violence. The 00 Agenda for Sustainable Development recognises the positive contribution of migrants for inclusive growth and sustainable development. It further recognises that international migration is a multi-dimensional reality of major relevance for the development of countries of origin, transit and destination, which requires coherent and comprehensive responses. International cooperation is critical to ensure safe, orderly and regular migration involving full respect for human rights and the humane treatment of migrants and refugees.

7 Accurate, consistent and timely data on international migration are essential for assessing current and future needs and for setting policy priorities to promote inclusive and equitable development for all. In order to track systematically levels and trends in international migration around the world, the Population Division of the Department of Economic and Social Affairs of the United Nations issues estimates of the number of international migrant stocks disaggregated by age, sex and place of origin for all countries and areas of the world. This report presents the highlights of the International Migration Report 015, which contains the latest quinquennial estimates of international migrant stock for countries or areas from 000 to 015. The annex in these Highlights provides data for 000 and 015 on the estimated number of international migrants, the percentage of migrants in the total population, the percentage of female migrants, and the median age of migrants for countries or areas of the world.
8 International Migration Report 015: Highlights International migrant stock by age, sex and origin: Definitions and data availability The estimates of international migrant stocks disaggregated by age, sex and place of origin presented in International Migration Report 015 are based on national statistics. Most of the statistics used to estimate the international migrant stock were obtained from population censuses. Additionally, population registers and nationally representative surveys provided information on the number and composition of international migrants. By definition, an international migrant is a person who is living in a country other than his or her country of birth. For estimating the international migrant stock, data on place of birth are generally given precedence, when they are available. Of the countries and areas included in this analysis, data on the foreign-born were available for 188, or 81 per cent, of them. Where data on the foreign-born were not available, data on foreign citizens were used for countries (or 19 per cent of countries or areas). Among the countries or areas included in this publication, 1, representing 9 per cent of the total, had at least one data source on the total migrant stock since the 000 census round (which began in 1995), while 75 per cent of countries or areas had at least one recent data source on the age of international migrants and 81 per cent on their origin. The availability of data on total migrant stock, as well as on the age and origin of international migrants differs significantly between major areas (table 1). In Africa, 19 per cent of countries did not have a recent data source on total migrant stock, while per cent and 6 per cent of countries did not have recent data on the age or origin of international migrants, respectively. Asia also had a relatively large number of countries or areas with no recent data on international migrants or their basic demographic characteristics. In Asia, 10 per cent of the countries did not have a recent data source on total migrant stock, while 0 per cent were lacking recent data on the age of international migrants, and 6 per cent on the origin of international migrants. Table 1 Availability of empirical data on international migrant stock, overall and with classification by age and country of origin, 1995 to 015 Countries or areas with at least one data source Total Number Percentage number of countries Total By age By origin Total By age By origin or areas World Africa Asia Europe Latin America and the Caribbean Northern America Oceania
9 5 Levels and trends in international migration The number of international migrants worldwide has continued to grow rapidly over the past fifteen years reaching million in 015, up from million in 010, 191 million in 005 and 17 million in 000. Between 000 and 005, the international migrant stock grew by an average of per cent per year. During the period , the annual growth rate accelerated, reaching per cent. Since then, however, it has slowed, falling to around 1.9 per cent per year during the period High-income countries host more than two thirds of all international migrants. As of 015, 71 per cent of all international migrants worldwide----equal to 17 million international migrants----lived in high-income countries (figure 1). Of these, 1 million migrants were hosted in high-income OECD countries, while 9 million migrants were living in other high-income non-oecd countries. Only 9 per cent----or 71 million----of the world s migrants lived in middle- or low-income countries. Of these, 61 million resided in middle-income countries and 9 million in the low-income countries. The majority of the world s migrants live in high-income countries Figure 1 Number of international migrants by income group of country or area of destination, 000 to Low income Number of migrants (millions) Middle income High income: non-oecd High income: OECD Note: The classification of countries and areas by income level is based on 01 gross national income (GNI) per capita, in U.S. dollars, calculated by the World Bank.
10 6 International Migration Report 015: Highlights High-income countries have absorbed most of the recent growth in the global population of international migrants. High-income countries gained 57 million, or 81 per cent, of the 71 million migrants added worldwide between 000 and 015. Of these, 0 million migrants were added in the high-income OECD countries and 17 million in the high-income non-oecd countries. While high-income OECD countries gained the largest number of migrants worldwide, the pace of growth during the period was slower for such countries (.6 per cent per year) than for non-oecd high-income countries (.9 per cent per year). In the middle-income countries (1.5 per cent per year) and the low-income countries (1. per cent per year), the pace of growth was considerably slower during this period. Asia and Europe host the largest numbers of migrants worldwide Nearly two thirds of all international migrants worldwide live in Europe or Asia. In 015, 76 million international migrants were residing in Europe, compared to 75 million in Asia. Northern America hosted the third largest number of international migrants (5 million), followed by Africa (1 million), Latin America and the Caribbean (9 million), and Oceania (8 million) (figure ). Figure Number of international migrants by major area of destination, 000 and 015 Europe Asia 9 75 Northern America 0 5 Africa 15 1 Latin America and the Caribbean Oceania Number of migrants (millions) Between 000 and 015, Asia added more international migrants than any other major area. Asia gained some 6 million international migrants during this period, or 1.7 million additional migrants per annum. Europe added the second largest number of international migrants between 000 and 015 (0 million, or 1. million per year), followed by Northern America (1 million, or 0.9 million per year) and Africa (6 million, or 0. million per year). Latin America and the Caribbean and Oceania added comparatively smaller numbers of migrants during this period ( million, or 0. million per year each). Despite this continued growth, international migrants accounted for less
11 7 than per cent of the population of Africa, Asia, and Latin America and the Caribbean. By contrast, in Europe, Northern America and Oceania international migrants comprised at least 10 per cent of the population. Figure Twenty countries or areas hosting the largest numbers of international migrants, 000 and United States 7United States 1 Russian Federation 1 Germany 9 Germany 1 Russian Federation 6 India 10 Saudi Arabia 6 France 9 United Kingdom 6 Ukraine 8 United Arab Emirates 6 Canada 8 Canada 5 Saudi Arabia 8 France 5 United Kingdom 7 Australia Australia 6 Spain Pakistan Kazakhstan 6 5 Italy India Iran 5 Ukraine China, Hong Kong SAR Thailand United Arab Emirates Pakistan Italy Kazakhstan Côte d Ivoire South Africa Jordan Jordan Israel Japan Turkey Kuwait Number of migrants (millions) Number of migrants (millions) Africa Asia Europe LAC Northern America Oceania Notes: China, Hong Kong SAR stands for China, Hong Kong Special Administrative Region, Iran for the Islamic Republic of Iran, United Kingdom for the United Kingdom of Great Britain and Northern Ireland and United States for United States of America. LAC stands for Latin America and the Caribbean. Connecting lines indicate that the ranking of a country or area changed by five positions or more.

12 8 International Migration Report 015: Highlights The pace of growth in the migrant stock varies across major areas. Asia and Oceania experienced the fastest average annual growth rate in the migrant stock. Between 000 and 015, the number of international migrants in Asia and Oceania grew by an average of.8 per cent per year. Latin America and the Caribbean recorded the third fastest average annual growth rate in the international migrant stock during this period (. per cent), followed by Africa (. per cent). Europe and Northern America, where the size of the migrant stock was already large, experienced a slightly slower pace of change, with an average annual growth rate of per cent for each. Most of the world s migrants live in a handful of countries. In 015, 67 per cent of all international migrants in the world were living in just twenty countries. The largest number of international migrants resided in the United States of America: 7 million, equal to 19 per cent of the world s total (figure ). Germany and the Russian Federation hosted the second and third largest numbers of migrants worldwide (around 1 million each), followed by Saudi Arabia (10 million), the United Kingdom of Great Britain and Northern Ireland (nearly 9 million), and the United Arab Emirates (8 million). Of the top twenty destinations of international migrants worldwide, nine were in Asia, seven in Europe, two in Northern America, and one each in Africa and Oceania. Map 1 Average annual rate of change in the number of international migrants by country or area of destination, 000 to 015 Average annual rate of change (per cent) 6 per cent or over to 6 per cent to per cent 0 to per cent - to 0 per cent - to - per cent Less than - per cent No data Notes: The boundaries and names shown and the designations used on this map do not imply official endorsement or acceptance by the United Nations. Dotted line represents approximately the Line of Control in Jammu and Kashmir agreed upon by India and Pakistan. The final status of Jammu and Kashmir has not yet been agreed upon by the parties. Final boundary between the Republic of Sudan and the Republic of South Sudan has not yet been determined. Final status of the Abyei area is not yet determined.
.")
13 9 Trends in the stock of international migrants differ widely by country. Between 000 and 015, the number of migrants grew in 167 countries or areas worldwide. In 6 of these, including France, Germany and the United States of America, the international migrant stock grew by less than per cent per annum (map 1). In 10 countries or areas, however, the pace of growth during the period was considerably faster, with 19 countries or areas recording an average annual growth rate of 6 per cent or more. Among the countries or areas with the most pronounced growth during this period were Italy, Spain, Thailand and the United Arab Emirates. In contrast, in 61 countries or areas, the stock of international migrants declined during the period In 9 countries or areas, including India, the Islamic Republic of Iran, the Russian Federation and Ukraine, the pace of decline was less than per cent per annum. In countries or areas, however, the international migrant stock shrunk more rapidly, with 10 countries or areas recording an average decline of more than per cent per annum. The number of refugees worldwide has reached the highest level since World War II. In 01, the total number of refugees in the world was estimated at 19.5 million, representing about 8 per cent of all international migrants (United Nations High Commissioner for Refugees 015). Developing regions hosted 86 per cent of the world s refugees (1. million persons), the highest value in more than two decades. The least developed countries provided asylum to.6 million refugees, or 5 per cent of the global total. In 01, Turkey became the largest refugee-hosting country worldwide, with 1.6 million refugees. Turkey was followed by Pakistan (1.5 million), Lebanon (1. million), the Islamic Republic of Iran (1.0 million), Ethiopia and Jordan (0.7 million each). More than half (5 per cent) of refugees under UNHCR s mandate come from just three countries: the Syrian Arab Republic (.9 million), Afghanistan (.6 million) and Somalia (1.1 million).
14 10 International Migration Report 015: Highlights Demographic characteristics of international migrants Women comprise slightly less than half of all international migrants worldwide. Globally, the proportion of women among all migrants fell from 9 per cent in 000 to 8 per cent in 015. Much of this decline is due to the growing share of male migrants in high-income non-oecd countries. Between 000 and 015, the proportion of female migrants in such countries fell from 5 to 0 per cent (figure ). The share of female migrants also declined in middle-income countries. In the high-income OECD countries, however, the share of female migrants increased slightly during the same period: from 51 to 5 per cent. Figure Percentage female among international migrants worldwide and by income group of the country or area of destination, 000 and 015 World 8 9 High income: OECD 5 51 Low income Middle income High income: non-oecd Percentage female Note: See note to figure 1. There are considerable differences across major areas in the proportion of women among all international migrants. Since 000, the proportion of female migrants increased in all major areas with the exception of Africa and Asia. In Europe, the female share of migrants rose from 51.6 per cent in 000 to 5. per cent in 015. Likewise, in Northern America, the percentage of women among all international migrants rose from 50.5 to 51. per cent during this period. The larger proportion of female migrants in those major areas was mainly the outcome of the aging in place of migrants who had arrived
15 11 decades earlier and the fact that females, including female migrants, tend to have longer life expectancies compared to males. By contrast, in Asia the percentage of female migrants fell from 5.6 per cent in 000 to per cent in 015. The reason for this decline rests primarily with the high concentration of males among recent migrant inflows. In Asia, the number of male migrants grew significantly more than the number of female migrants. The stock of male migrants in Asia grew by 6 per cent, from 7 million in 000 to million in 015 (figure 5). This increase was fuelled in part by the strong demand for male migrant workers in the oil-producing countries of Western Asia. The stock of female migrants in Asia increased by 0 per cent from million in 000 to million in 015. Africa also experienced a more pronounced growth in male migrants ( per cent) during the period compared to female migrants (7 per cent). By contrast, in Europe, Latin America and the Caribbean, Northern America and Oceania, the stock of female migrants grew more rapidly than the stock of male migrants. Figure 5 Number of international migrants by sex and major area of destination, 000 to Males Females Number of migrants (millions) Africa Europe Northern America Asia Latin America and the Caribbean Oceania Worldwide, the median age of migrants has been increasing. The median age of all international migrants in 015 was 9 years, compared with 8 years in 000. The median age of migrants was highest in the high-income OECD countries ( years). Migrants in high-income non-oecd (7 years), in middle-income countries (6 years), and in lowincome countries (5 years) had considerably lower median ages. International migrants living in Africa were the youngest, with a median age of 9 in 015, followed by Asia (5 years) and Latin America and the Caribbean (6 years). In contrast, migrants were older in Europe, Northern America and Oceania, where the median age was, and years, respectively (see figure 6).
16 1 International Migration Report 015: Highlights Several major areas are experiencing a rejuvenation of their migrant stock Yet in some major areas the migrant stock is becoming younger. Between 000 and 015, the median age of international migrants declined in Asia, Latin America and the Caribbean, and Oceania. Latin America and the Caribbean recorded the most substantial rejuvenation of its migrant stock during this period (around years), owing both to the inflow of new, younger migrants 1 as well as the death or return of older migrants, many of whom had arrived from Europe decades earlier. Conversely, in Africa, Europe and Northern America, the median age of international migrants increased between 000 and 015. Northern America experienced the most pronounced increase (around years). Figure 6 Median age among international migrants worldwide and by major area of destination, 000 and 015 World 9 8 Oceania Europe 5 1 Northern America 8 Latin America and the Caribbean 6 0 Asia Africa Median age (years) Most migrants worldwide are of working age. In 015, 7 per cent of all international migrants were aged 0 to 6 years, compared to 58 per cent of the total population (figure 7). Younger persons, below age 0, tend to be underrepresented amongst international migrants. Globally, 15 per cent of all migrants were under 0 years of age, compared to per cent of the total population. Thirteen per cent of migrants worldwide were at least 65 years old, nearly twice as high as the percentage of persons aged 65 or over globally. This difference is due to a combination of factors, including the fact that, upon arrival, the majority of international migrants are of working age. The return of migrants at older ages and the fact that children born to migrants in the country of 1 Because international migrant stocks include not only newly arrived immigrants but also migrants who have lived in a country for many years, the median age of immigrants when they arrive is, on average, considerably lower than that of the migrant stock.

17 1 destination are considered native- rather than foreign-born also help to shape the overall age distribution of the migrant population. Figure 7 Age distributions of the total population and international migrants worldwide, 015 Per cent of total population Total population 58% Working ages Percent of international migrants International migrants 7% Working ages
18 1 International Migration Report 015: Highlights Where do international migrants come from? Most migrants originate from middle-income countries Although the majority of international migrants worldwide live in high-income countries, most migrants originate from middle-income countries. In 015, there were 157 million international migrants who had been born in a middle-income country, equal to nearly 65 per cent of all migrants. Relatively fewer migrants originated from highincome OECD countries ( million, or 17 per cent), high-income non-oecd countries (0 million, or 8 per cent) and from low-income countries (5 million, or 10 per cent). Between 000 and 015, the number of migrants originating from middle-income countries increased more rapidly than for any other income group (figure 8). Figure 8 Number of international migrants by income group of country or area of origin, 000 to 015 Number of migrants (millions) Low income Middle income High income: non-oecd High income: OECD Note: Unknown residuals were redistributed proportionally to the size of groups for which data on international migrants were available by origin. The majority of migrants originating from middle-income countries live in a high-income country. Of the 157 million international migrants born in a middle-income country, nearly 9 per cent were residing in a high-income OECD country, 8 per cent in a high-income non-oecd country, 0 per cent in another middle-income country and
19 15 per cent in a low-income country. Migrants from high-income OECD countries were primarily residing in other high-income OECD countries (8 per cent), while migrants from high-income non-oecd countries were almost evenly split between high-income OECD countries (6 per cent) and middle-income countries (9 per cent). Over half of all migrants originating from low-income countries were living in a middle-income country (57 per cent), compared to 19 per cent in high-income OECD countries, 5 per cent in high-income non-oecd countries and 19 per cent in other low-income countries. Nearly half of all international migrants worldwide were born in Asia. In 015, of the million international migrants worldwide, 10 million, or per cent, were born in Asia (figure 9). Europe was the birthplace of the second largest number of international migrants (6 million, or 5 per cent), followed by Latin America and the Caribbean (7 million, or 15 per cent) and Africa ( million, or 1 per cent). Relatively few migrants worldwide were born in Northern America ( million, or per cent) or Oceania ( million, or 1 per cent). Between 000 and 015, the size of the migrant stock from Asia grew faster than from all other major areas. During that period the stock of migrants from Asia grew by.8 per cent per year, compared to 1. per cent for the Europe. Other major areas that also experienced a rapid growth in their diasporas were Africa (.7 per cent per annum), Latin America and the Caribbean (.5 per cent per annum), Oceania (. per cent per annum), and Northern America (.1 per cent per annum). Figure 9 Number of international migrants by major area of origin, 000 and 015 Asia Europe 5 6 Latin America and the Caribbean Africa 6 7 Northern America Oceania Number of migrants (millions) Note: See note to figure 8.


, Europe (66 per cent, or 0 million),")
 live in another country of their major area of origin")

 reside in a country outside their")


20 16 In many parts of the world, migration occurs primarily within major areas International Migration Report 015: Highlights In many parts of the globe, migration occurs primarily between countries that are located within the same major area of the world. The majority of the international migrants originating from Asia (60 per cent, or 6 million persons), Europe (66 per cent, or 0 million), Oceania (59 per cent, or 1 million) and Africa (5 per cent, or 18 million) live in another country of their major area of origin (figure 10). In contrast, the majority of international migrants born in Latin America and the Caribbean (8 per cent, or million) and Northern America (7 per cent, or million) reside in a country outside their major area of birth. Figure 10 Number of international migrants by major areas of origin cross-classified by major area of destination, 015 Africa Africa 18 million Asia Asia 6 million LAC NA 6 million Africa Asia Europe LAC Northern America Oceania Notes: See note to figure 8. LAC stands for Latin America and the Caribbean and NA for Northern America. Migration between countries that are located within the same major area is increasing. Between 000 and 015, the share of international migrants who remained
21 17 within their own major area of birth increased in Asia, Europe, Latin America and the Caribbean, and Oceania (figure 11). Conversely, for migrants born in Africa and Northern America, the proportion of those living in a country outside of their major area of birth increased. For Africa this has been accompanied by an increase in the share of African foreign-born persons living in Asia, Europe, Northern America and Oceania, while for Northern America it resulted in an increase in the share of persons living in Asia, Latin America and the Caribbean, and Oceania. Figure 11 Percentage distribution of international migrants by major area of destination, for major areas of origin, 000 and 015 Origin Africa Per cent of migrants by major area of destination 5% 1% 58% 10% 7% 5% 7% % 015 5% 1% 000 Asia 1% 1% 60% 57% 0% % 16% 16% % 015 % 000 Europe % 1% % 15% 66% 6% % 1% % 1% 5% 5% LAC 1% 1% % 7% 15% 16% 70% 76% NA % 1% % 1% % % 5% 1% 7% % 5% % Oceania 6% 5% 19% 0% 15% 17% 59% 56% Africa Asia Europe LAC Northern America Oceania Note: See note to figure 10. Asia is the origin with the largest number of persons who are living outside their major area of birth. In 015, there were million international migrants born in Asia but living elsewhere. Of these, the majority were living in Europe (0 million), followed by Northern America (17 million) and Oceania ( million). Migrants born in Latin America and the Caribbean represented the second largest diaspora group with million persons living outside their major area of birth. The majority of these migrants were living in
22 18 International Migration Report 015: Highlights Northern America (6 million) and Europe (5 million). Europe had the third largest number of persons living outside their major area of birth ( million). These migrants were primarily residing in Asia and Northern America (8 million each) and Oceania ( million). Figure 1 Twenty countries or areas of origin with the largest diaspora populations, 000 and Russian Federation 16 India 9 Mexico 1 Mexico 8 India 11 Russian Federation 6 China 10 China 6 Ukraine 7 Bangladesh 5 Bangladesh 6 Pakistan 5 Afghanistan 6 Ukraine United Kingdom 5 Philippines Kazakhstan 5 Syrian Arab Republic Pakistan 5 United Kingdom Germany 5 Afghanistan Italy Poland Philippines Kazakhstan Turkey Germany State of Palestine Indonesia Indonesia State of Palestine Portugal Romania Poland Egypt United States Turkey Morocco United States Number of migrants (millions) Number of migrants (millions) Africa Asia Europe LAC Northern America Oceania Notes: United Kingdom stands for United Kingdom of Great Britain and Northern Ireland and United States for United States of America. LAC stands for Latin America and the Caribbean. Connecting lines indicate that the ranking of a country or area changed by five positions or more.
23 19 Between 000 and 015, some regional corridors grew very rapidly. Asia was one of the fastest growing destinations for migrants from Africa, with an annual average growth rate of. per cent, equal to an absolute increase of nearly million migrants during this period. For foreign-born persons from Asia, the fastest growing corridors outside of Asia were from Asia to Oceania (.8 per cent increase per annum, yielding million more migrants during the period ) and from Asia to Northern America (.7 per cent per annum, yielding 6 million more). One of the fastest-growing destinations for migrants originating from Latin America and the Caribbean was Europe (6. per cent per annum, or million more). For foreign-born persons coming from Europe, one of the fastest-growing destinations was Africa (. per cent per annum, or 0.5 million more), whereas for foreignborn originating from Northern America, it was Latin America and the Caribbean (. per cent per annum, or 0.5 million more). India now has the largest diaspora in the world, followed by Mexico, the Russian Federation and China. In 015, 16 million persons from India were living outside of their country of birth compared to 1 million from Mexico (figure 1). Other countries with large diasporas included the Russian Federation (11 million), China (10 million), Bangladesh (7 million), and Pakistan and Ukraine (6 million each). Of the top twenty countries or areas of origin of international migrants, 11 were in Asia, 6 in Europe, and 1 each in Africa, Latin America and the Caribbean, and Northern America. Between 000 and 015, some countries have experienced a rapid growth in the size of their diaspora populations. Among the countries and areas with the fastest average annual growth rate during this period were the Syrian Arab Republic (1.1 per cent per annum), Romania (7. per cent per annum), Poland (5.1 per cent per annum) and India (.5 per cent per annum). In Syria much of this increase was due to the large outflow of refugees and asylum seekers following the conflict in the area. Diasporas from some countries of origin tend to concentrate in particular countries of destination. Mexico s diaspora is concentrated in just one country: the United States of America. In 015, the United States of America hosted some 1 million persons born in Mexico (figure 1), equal to nearly 98 per cent of all Mexicans living abroad. Other examples of countries with diaspora populations settled predominantly in one country include Algeria (in France), Burkina Faso (in Côte d'ivoire), Cuba and El Salvador (in the United States of America), and New Zealand (in Australia). In contrast, India s diaspora is more evenly spread out between a number of destination countries, including the United Arab Emirates ( million), and Pakistan and the United States of America ( million each). Several countries of the former Soviet Union, including the Russian Federation and Ukraine, also have more evenly distributed diaspora populations.
24 0 International Migration Report 015: Highlights Figure 1 Fifteen largest populations of migrants from a single country or area of origin living in a single country or area of destination, 000 and 015 Mexico United States India United Arab Emirates Russia Ukraine Ukraine Russia Bangladesh India Kazakhstan Russia Russia Kazakhstan Afghanistan Iran China China, Hong Kong SAR State of PalesDne Jordan China United States India Pakistan Myanmar Thailand India United States Poland Germany Number of migrants (millions) Note: China, Hong Kong SAR stands for China, Hong Kong Special Administrative Region, Iran for the Islamic Republic of Iran, Russia for Russian Federation and United States for United States of America.
25 1 The contribution of international migration to population dynamics The number of international migrants worldwide has grown faster than the world s population. As a result of this faster growth rate, the share of migrants in the total population reached. per cent in 015, up from.8 in 000. There were, however considerable differences between major areas. In Europe, Northern America and Oceania, international migrants accounted for at least 10 per cent of the population. By contrast, in Africa, Asia, and Latin America and the Caribbean, less than per cent of the population consisted of international migrants. International migration contributes significantly to population growth in many parts of the world, and reverses negative growth in some countries or areas. Between 000 and 015, positive net migration contributed to per cent of the population growth in Northern America and per cent in Oceania. In Europe, the size of the population would have declined during the period in the absence of positive net migration, whereas in Africa, Asia, and Latin America and the Caribbean, negative net migration contributed marginally to slowing the pace of population growth. The impact of negative net migration is generally modest for countries with large populations. During the period , for instance, negative net migration had a relatively small impact on population change in countries or areas with large populations, including Bangladesh, China, India and Mexico. However, for smaller countries or areas, including the Small Island Developing States (SIDS), the impact can be more substantial. In the Federated States of Micronesia and the Marshall Islands, for example, whereas the size of the population declined during the period owing to negative net migration, it would have increased under a scenario of zero-net migration. Net migration is projected to have a significant impact on the future size of populations in a number of major areas. In Europe, while current trends in migration will not be enough to compensate for the surplus of deaths over births (figure 1), this decline would have been even more pronounced, and started earlier, under a zero-netmigration scenario. Likewise, in Northern America the size of the population would start Net international migration refers to the difference between the number of immigrants and the number of emigrants. If more people immigrate to a country than emigrate from it, the latter gains population from positive net migration. When more people emigrate than immigrate, the country loses population through negative net migration.
26 International Migration Report 015: Highlights to decline in 00 under a zero-net-migration scenario, while in Oceania the decline in total population would be two times larger by 050. Figure 1 Actual and projected change in total population over five-year time periods by major area, from 000 to 050, with and without international migration starting in 015 (millions) Africa Asia Europe Latin America and the Caribbean Northern America Oceania Zero-net migration Medium variant Source: United Nations, Department of Economic and Social Affairs, Population Division (015b). Migration can contribute to reducing slowing the long-term trend towards population ageing. Because international migrants tend to comprise larger proportions of working-age persons compared to the overall population, positive net migration can
27 contribute to reducing old-age dependency ratios. In many parts of the world, the old-age dependency ratio would be even higher in the absence of net migration. Assuming zeronet migration, the old-age dependency ratio of Europe in 050 would rise to 51 persons age 65 or over per 100 persons of working age, compared to 8 per 100 assuming a continuation of current migration patterns. For Northern America and Oceania, the oldage dependency ratio would rise to and per 100, respectively, with zero-net migration, compared to 8 and 0 per 100 if current levels of migration continue. While international migration can play a role in modifying dependency ratios, it cannot reverse the trend of population ageing. Even assuming a continuation of current migration patterns, all major areas of the world are projected to have significantly higher old-age dependency ratios in 050. In Asia, for every 100 persons of working age, there will be 8 dependent older persons in 050 compared to 11 dependent older persons in 015. Likewise, during the period , old-age dependency ratios are projected to increase from 6 to 8 per 100 in Europe, from to 8 per 100 in Northern America, from 11 to 1 per 100 in Latin America and the Caribbean, and from 18 to 0 per 100 in Oceania. Only Africa is projected to have an old-age dependency ratio below 10 persons aged 65 or over per 100 persons of working age in 050. The old-age dependency ratio is a commonly used measure of the potential need for social and economic support in a population. It is calculated by dividing the population aged 65 years or older by the working-age population, aged 15 to 6 years old. In general, a higher value of this ratio indicates that each potential worker needs to support a larger number of potentially dependent persons aged 65 years or older.
 the 1951 Convention relating to the Status of Refugees, (b) the 1967 Protocol Relating to the Status of Refugees, (c) the 1990 International Convention on the Protection of the Rights")
28 International Migration Report 015: Highlights Ratification of legal instruments related to international migration The United Nations has five legal instruments related to international migration. These are: (a) the 1951 Convention relating to the Status of Refugees, (b) the 1967 Protocol Relating to the Status of Refugees, (c) the 1990 International Convention on the Protection of the Rights of All Migrants and Members of Their Families, (d) the 000 Protocol to Prevent, Suppress and Punish Trafficking in Persons, Especially Women and Children, and (e) the 000 Protocol against the Smuggling of Migrants by Land, Sea and Air. Together with the instruments on the rights of migrant workers adopted by the International Labour Organization (ILO), these form the basis of the international normative and legal framework on international migration. The ratification of the United Nations legal instruments related to international migrants and migration remains uneven. The 1951 Refugee Convention and its 1967 Protocol have been ratified by 15 and 16 United Nations Member States, respectively. Likewise, two thirds of countries have ratified the two protocols seeking to stem irregular migration in the form of human trafficking and migrant smuggling. However, only one quarter of countries have ratified the 1990 International Convention on the Protection of the Rights of All Migrants and Members of Their Families. As of October 015, 6 Member States had ratified all five of the United Nations legal instruments related to international migration, while 1 Member States had ratified none of the relevant instruments (map ). Map Number of ratifications of the five United Nations legal instruments related to international migration by country, as of October 015 Number of ratifications Five Four Three One or two None No data Source: United Nations Treaty Collection; see (as of 6 October 015). Notes: See notes for map 1.
29 5 International migration at the United Nations Migration has steadily risen on the agenda of the international community. Since the adoption of the Programme of Action at the 199 International Conference on Population and Development (ICPD), which contains one of the most comprehensive negotiated texts on international migration to date, the issue of international migration and its relation to development has risen steadily on the agenda of the international community. While subsequent United Nations conferences and summits in the social and economic field affirmed the contribution of international migration to development, this was not reflected in the Millennium Development Goals (MDGs). After years of deliberating the question of convening an international migration conference, the General Assembly decided to hold a High-level Dialogue on International Migration and Development in September 006. This marked the first high-level event of the General Assembly dedicated exclusively to this topic. Although the formal outcome of the event was limited to a Chair s summary, the proposal of the Secretary-General to create a voluntary and state-led forum on international migration and development received widespread support. Since 007, the Global Forum on Migration and Development (GFMD) has fostered informal dialogue and cooperation between Governments with a view to enhancing the benefits of international migration for development and to minimising its negative impacts. In response to the 005 report of the Global Commission on International Migration, the Secretary-General established the Global Migration Group (GMG), an inter-agency group responsible for promoting the application of international instruments and norms in the area of international migration, for increasing system-wide coherence, and for strengthening the response of the United Nations system and the international community to the opportunities and challenges presented by international migration. Currently, the Group consists of 17 entities of the United Nations system and the International Organization for Migration (IOM). At the second High-level Dialogue on International Migration and Development, held in October 01, the General Assembly adopted a landmark declaration. The agreement not only acknowledged the contribution of migration in realising the MDGs, but also recognised that human mobility was a key factor for sustainable development, which would need to be adequately considered in the elaboration of the development agenda that would follow the MDGs.
Levels and trends in international migration
 Levels and trends in international migration The number of international migrants worldwide has continued to grow rapidly over the past fifteen years reaching million in 1, up from million in 1, 191 million
International Migration Report. United Nations. [highlights]
![International Migration Report. United Nations. [highlights]](/thumbs/74/70760635.jpg "International Migration Report. United Nations. [highlights]") 2017 International Migration Report United Nations [highlights] < this page intentionally left blank > ST/ESA/SER.A/404 Department of Economic and Social Affairs International Migration Report 2017 Highlights
2017 International Migration Report United Nations [highlights] < this page intentionally left blank > ST/ESA/SER.A/404 Department of Economic and Social Affairs International Migration Report 2017 Highlights
I. LEVELS AND TRENDS IN INTERNATIONAL MIGRANT STOCK
 I. LEVELS AND TRENDS IN INTERNATIONAL MIGRANT STOCK A. INTERNATIONAL MIGRANT STOCK BY DEVELOPMENT GROUP The Population Division estimates that, worldwide, there were 214.2 million international migrants
Levels and Trends of International Migration in Asia and the Pacific
 Expert Group Meeting on International Migration and Development in Asia and the Pacific Bangkok, Thailand, 20-21 September 2008 Levels and Trends of International Migration in Asia and the Pacific Sabine
International Migration: Facts and Figures
 International Migration: Facts and Figures John Wilmoth Director, Population Division United Nations Department of Economic and Social Affairs (UN DESA) 16 th Coordination Meeting on International Migration
RISING GLOBAL MIGRANT POPULATION
 RISING GLOBAL MIGRANT POPULATION 26 INTERNATIONAL MIGRANTS HAVE INCREASED BY ABOUT 60 MILLION IN THE LAST 13 YEARS and now total more than 230 million equivalent to the 5th most populous country in the
Compendium of agreed language on international migration
 E c o n o m i c & S o c i a l A f f a i r s Compendium of agreed language on international migration DOCUMENTATION United Nations This page intentionally left blank POP/DB/MIG/Compendium/2017 December
Regional Consultation on International Migration in the Arab Region
 Distr. LIMITED RC/Migration/2017/Brief.1 4 September 2017 Advance copy Regional Consultation on International Migration in the Arab Region In preparation for the Global Compact for Safe, Orderly and Regular
Concept note. The workshop will take place at United Nations Conference Centre in Bangkok, Thailand, from 31 January to 3 February 2017.
 Regional workshop on strengthening the collection and use of international migration data in the context of the 2030 Agenda for Sustainable Development Introduction Concept note The United Nations Department
Advanced Copy. Not for Immediate Release. Embargoed until: 21 June 2017, 11 am EDT
 Advanced Copy. Not for Immediate Release. Embargoed until: 21 June 2017, 11 am EDT ESA/P/WP/248 Department of Economic and Social Affairs Population Division World Population Prospects The 2017 Revision
Briefing on the Work Programme of the Population Division: International Migration and Development
 Briefing on the Work Programme of the Population Division: International Migration and Development Bela Hovy, Chief Migration Section, Population Division Department of Economic and Social Affairs (DESA),
International migration and development: Past, present, future
 International migration and development: Past, present, future Bela Hovy Chief, Migration Section Population Division, Department of Economic and Social Affairs (UN DESA) Regional Consultation on International
The Future of Migration: Building Capacities for Change
 The Future of Migration: Building Capacities for Change World Migration Report 2010 International Organization for Migration (IOM) 1 Key Messages The WMR 2010 seeks to help States, regional and international
Trademarks FIGURE 8 FIGURE 9. Highlights. Figure 8 Trademark applications worldwide. Figure 9 Trademark application class counts worldwide
 Trademarks Highlights Applications grew by 16.4% in 2016 An estimated 7 million trademark applications were filed worldwide in 2016, 16.4% more than in 2015 (figure 8). This marks the seventh consecutive
TRENDS IN INTERNATIONAL MIGRANT STOCK: MIGRANTS BY AGE AND SEX
 E c o n o m i c & S o c i a l A f f a i r s TRENDS IN INTERNATIONAL MIGRANT STOCK: MIGRANTS BY AGE AND SEX CD-ROM DOCUMENTATION United Nations POP/DB/MIG/Stock/Rev.2010 September 2011 Department of Economic
INTERNATIONAL MIGRATION AND DEVELOPMENT IN THE ARAB STATES
 Distr. LIMITED E/ESCWA/SDD/2007/Brochure.1 5 February 2007 ENGLISH ORIGINAL: ARABIC ECONOMIC AND SOCIAL COMMISSION FOR WESTERN ASIA (ESCWA) INTERNATIONAL MIGRATION AND DEVELOPMENT IN THE ARAB STATES United
V. MIGRATION V.1. SPATIAL DISTRIBUTION AND INTERNAL MIGRATION
 V. MIGRATION Migration has occurred throughout human history, but it has been increasing over the past decades, with changes in its size, direction and complexity both within and between countries. When
Summary of the Results
 Summary of the Results CHAPTER I: SIZE AND GEOGRAPHICAL DISTRIBUTION OF THE POPULATION 1. Trends in the Population of Japan The population of Japan is 127.77 million. It increased by 0.7% over the five-year
International migration and development in the LLDCs: An overview
 International migration and development in the LLDCs: An overview Achieving the future sustainable development goals: The role of labour migration Second United Nations Conference on Landlocked Developing
People. Population size and growth. Components of population change
 The social report monitors outcomes for the New Zealand population. This section contains background information on the size and characteristics of the population to provide a context for the indicators
STATISTICAL REFLECTIONS
 World Population Day, 11 July 217 STATISTICAL REFLECTIONS 18 July 217 Contents Introduction...1 World population trends...1 Rearrangement among continents...2 Change in the age structure, ageing world
CHAPTER I: SIZE AND GEOGRAPHICAL DISTRIBUTION OF THE POPULATION
 CHAPTER I: SIZE AND GEOGRAPHICAL DISTRIBUTION OF THE POPULATION 1. Trends in the Population of Japan The population of Japan is 127.77 million. It increased by 0.7% over the five-year period, the lowest
TRENDS IN INTERNATIONAL MIGRANT STOCK: THE 2017 REVISION
 E c o n o m i c & S o c i a l A f f a i r s TRENDS IN INTERNATIONAL MIGRANT STOCK: THE 2017 REVISION DOCUMENTATION United Nations This page intentionally left blank POP/DB/MIG/Stock/Rev.2017 December 2017
World Economic and Social Survey
 World Economic and Social Survey Annual flagship report of the UN Department for Economic and Social Affairs Trends and policies in the world economy Selected issues on the development agenda 2004 Survey
IV. URBANIZATION PATTERNS AND RURAL POPULATION GROWTH AT THE COUNTRY LEVEL
 IV. URBANIZATION PATTERNS AND RURAL POPULATION GROWTH AT THE COUNTRY LEVEL Urbanization patterns at the country level are much more varied than at the regional level. Furthermore, for most countries, the
Bangladesh. Development Indicators. aged years, (per 1 000) Per capita GDP, 2009 (at current prices in US Dollars)
 Per capita GDP, 2009 (at current prices in US Dollars)") Bangladesh 1 Development Indicators Population, 2010 (in 1 000) Population growth rate, 2010 Growth rate of population aged 15 39 years, 2005 2010 148 692 1.1 1.7 Total fertility rate, 2009 Percentage
Bangladesh 1 Development Indicators Population, 2010 (in 1 000) Population growth rate, 2010 Growth rate of population aged 15 39 years, 2005 2010 148 692 1.1 1.7 Total fertility rate, 2009 Percentage
Sustainable cities, human mobility and international migration
 Sustainable cities, human mobility and international migration Report of the Secretary-General for the 51 st session of the Commission on Population and Development (E/CN.9/2018/2) Briefing for Member
A Rights- based approach to Labour Migration
 A Rights- based approach to Labour Migration www.itcilo.org International Training Centre of the ILO 1 Question 1 What is the definition of Labour Migration : A = Defined as the movement of people from
VIII. INTERNATIONAL MIGRATION
 VIII. INTERNATIONAL MIGRATION International migration is closely tied to global development and generally viewed as a net positive for both sending and receiving countries. In the sending countries, emigration
Economic Activity in London
 CIS2013-10 Economic Activity in London September 2013 copyright Greater London Authority September 2013 Published by Greater London Authority City Hall The Queens Walk London SE1 2AA www.london.gov.uk
DURABLE SOLUTIONS AND NEW DISPLACEMENT
 CHAPTER III DURABLE SOLUTIONS AND NEW DISPLACEMENT INTRODUCTION One key aspect of UNHCR s work is to provide assistance to refugees and other populations of concern in finding durable solutions, i.e. the
Towards the 5x5 Objective: Setting Priorities for Action
 Towards the 5x5 Objective: Setting Priorities for Action Global Remittances Working Group Meeting April 23, Washington DC Massimo Cirasino Head, Payment Systems Development Group The 5x5 Objective In many
MIGRATORY OUTLOOK. International migration: global trends and dimensions of the phenomenon in Mexico MO01
 MIGRATORY OUTLOOK International migration: global trends and dimensions of the phenomenon in Mexico MO01 February 2018 D.R. Centro de Estudios Migratorios/Unidad de Política Migratoria/ Subsecretaría de
Conference of the Parties to the United Nations Convention against Transnational Organized Crime
 United Nations CTOC/COP/WG.4/2015/6 Conference of the Parties to the United Nations Convention against Transnational Organized Crime Distr.: General 26 November 2015 Original: English Report on the meeting
Permanent and temporary immigration to Canada from 2012 to 2014
 Catalogue no. 91-209-X ISSN 1718-7788 Permanent and temporary immigration to Canada from 2012 to 2014 by Laurent Martel and Carol D Aoust Release date: July 5, 2016 How to obtain more information For information
AUSTRALIA S REFUGEE RESPONSE NOT THE MOST GENEROUS BUT IN TOP 25
 19 July 2013 AUSTRALIA S REFUGEE RESPONSE NOT THE MOST GENEROUS BUT IN TOP 25 Australia is not the world s most generous country in its response to refugees but is just inside the top 25, according to
North-South Migration To Developing Countries
 North-South Migration To Developing Countries Frank Laczko Head, Migration Research Division, European Migration Network Conference, Dublin, June 14, 2013 Policy Dialogue on Migration and Development 2013
Turkey. Development Indicators. aged years, (per 1 000) Per capita GDP, 2010 (at current prices in US Dollars)
 Per capita GDP, 2010 (at current prices in US Dollars)") Turkey 1 Development Indicators Population, 2010 (in 1 000) Population growth rate, 2010 Growth rate of population aged 15 39 years, 2005 2010 72 752 1.3 0.9 Total fertility rate, 2009 Percentage urban,
Turkey 1 Development Indicators Population, 2010 (in 1 000) Population growth rate, 2010 Growth rate of population aged 15 39 years, 2005 2010 72 752 1.3 0.9 Total fertility rate, 2009 Percentage urban,
A Note on International Migrants Savings and Incomes
 September 24, 2014 A Note on International Migrants Savings and Incomes Supriyo De, Dilip Ratha, and Seyed Reza Yousefi 1 Annual savings of international migrants from developing countries are estimated
IMMIGRATION. Gallup International Association opinion poll in 69 countries across the globe. November-December 2015
 IMMIGRATION Gallup International Association opinion poll in 69 countries across the globe November-December 2015 Disclaimer: Gallup International Association or its members are not related to Gallup Inc.,
24. INTERNATIONAL STATISTICS IRAN STATISTICAL YEARBOOK 1394
 IRAN STATISTICAL YEARBOOK 1394 24. INTERNATIONAL STATISTICS Introduction his chapter is to provide proper round for a statistical comparison between Iran and other countries. Sources of the presented statistics
Migration and Demography
 Migration and Demography Section 2.2 Topics: Demographic Trends and Realities Progressively Ageing Populations Four Case Studies Demography and Migration Policy Challenges Essentials of Migration Management
International migration and development: Regional dimensions and implementation
 International migration and development: Regional dimensions and implementation Bela Hovy Population Division Department of Economic and Social Affairs (UN DESA) wwww.unmigration.org Parliamentary meeting
SLOW PACE OF RESETTLEMENT LEAVES WORLD S REFUGEES WITHOUT ANSWERS
 21 June 2016 SLOW PACE OF RESETTLEMENT LEAVES WORLD S REFUGEES WITHOUT ANSWERS Australia and the world s wealthiest nations have failed to deliver on promises to increase resettlement for the world s neediest
SYMPOSIUM ON MIGRATION AND THE FUTURE OF EMERGING MARKETS
 SYMPOSIUM ON MIGRATION AND THE FUTURE OF EMERGING MARKETS EGROVE PARK, OXFORD, 12-14 JANUARY 218 ANALYTICAL FRAMEWORK Cover photo credit: A Katz / Shutterstock.com 217 Migration and Emerging Markets: an
0% 10% 20% 30% 40% 50% 10% 60% 20% 70% 30% 80% 40% 90% 100% 50% 60% 70% 80%
 0% 10% 20% 30% 40% 50% 10% 0% 60% 20% 30% 70% 80% 40% 100% 90% 50% 60% 70% 80% 90% 100% Note: See table II.2 and II.3 for numbers. * Refers to Palestinian refugees under the UNHCR mandate. Table of Contents
Definition of Key Terms
 Forum: The General Assembly 2 Issue: Student Officer: Position: The issue of remittance economies and protecting foreign worker rights Lyndsey Kong Assistant President Definition of Key Terms Remittance
THE DEMOGRAPHIC PROFILE OF THE ARAB COUNTRIES
 Distr. LIMITED E/ESCWA/SDD/2013/Technical paper.14 24 December 2013 ORIGINAL: ENGLISH ECONOMIC AND SOCIAL COMMISSION FOR WESTERN ASIA (ESCWA) THE DEMOGRAPHIC PROFILE OF THE ARAB COUNTRIES New York, 2013
Pakistan 2.5 Europe 11.5 Bangladesh 2.0 Japan 1.8 Philippines 1.3 Viet Nam 1.2 Thailand 1.0
 173 People Snapshots Asia and the Pacific accounts for nearly 55% of global population and 6 of the world s 10 most populous economies. The region s population is forecast to grow by almost 1 billion by
The National Police Immigration Service (NPIS) forcibly returned 412 persons in December 2017, and 166 of these were convicted offenders.
 forcibly returned 412 persons in December 2017, and 166 of these were convicted offenders.") Monthly statistics December 2017: Forced returns from Norway The National Police Immigration Service (NPIS) forcibly returned 412 persons in December 2017, and 166 of these were convicted offenders. The
Monthly statistics December 2017: Forced returns from Norway The National Police Immigration Service (NPIS) forcibly returned 412 persons in December 2017, and 166 of these were convicted offenders. The
People. Population size and growth
 The social report monitors outcomes for the New Zealand population. This section provides background information on who those people are, and provides a context for the indicators that follow. People Population
Conference of the Parties to the United Nations Convention against Transnational Organized Crime
 United Nations CTOC/COP/WG.7/2013/5 Conference of the Parties to the United Nations Convention against Transnational Organized Crime Distr.: General 19 November 2013 Original: English Working Group on
KINGDOM OF CAMBODIA NATION RELIGION KING 3 TOURISM STATISTICS REPORT. September 2010
 KINGDOM OF CAMBODIA NATION RELIGION KING 3 TOURISM STATISTICS REPORT September 2010 MINISTRY OF TOURISM Statistics and Tourism Information Department No. A3, Street 169, Sangkat Veal Vong, Khan 7 Makara,
MEETING THE NEED FOR PERSONAL MOBILITY. A. World and regional population growth and distribution
 30 II. MEETING THE NEED FOR PERSONAL MOBILITY A. World and regional population growth and distribution The world population grew at an annual rate of 1.4 per cent between 1990 and 2000. This is slightly
Business Data For Engaging in International Real Estate Transactions in California. National Association of REALTORS Research Division
 Business Data For Engaging in International Real Estate Transactions in National Association of REALTORS Research Division November 2016 Table of Contents Introduction 1 Table 1. Population by Place of
KINGDOM OF CAMBODIA NATION RELIGION KING 3 TOURISM STATISTICS REPORT. March 2010
 KINGDOM OF CAMBODIA NATION RELIGION KING 3 TOURISM STATISTICS REPORT March 2010 MINISTRY OF TOURISM Statistics and Tourism Information Department No. A3, Street 169, Sangkat Veal Vong, Khan 7 Makara, Phnom
Konrad Raiser Berlin, February 2011
 Konrad Raiser Berlin, February 2011 Background notes for discussion on migration and integration Meeting of Triglav Circle Europe in Berlin, June 2011 1. Migration has been a feature of human history since
IMMIGRATION IN THE EU
 IMMIGRATION IN THE EU Source: Eurostat 10/6/2015, unless otherwise indicated Data refers to non-eu nationals who have established their usual residence in the territory of an EU State for a period of at
World Map Title Name. Russia. United States. Japan. Mexico. Philippines Nigeria. Brazil. Indonesia. Germany United Kingdom. Canada
 214 P Gersmehl Teachers may copy for use in their classrooms. Contact pgersmehl@gmail.com regarding permission for any other use. World Map Title Name Canada United States Mexico Colombia Ecuador Haiti
SCALE OF ASSESSMENT OF MEMBERS' CONTRIBUTIONS FOR 1994
 International Atomic Energy Agency GENERAL CONFERENCE Thirtyseventh regular session Item 13 of the provisional agenda [GC(XXXVII)/1052] GC(XXXVII)/1070 13 August 1993 GENERAL Distr. Original: ENGLISH SCALE
Trends in international higher education
 Trends in international higher education 1 Schedule Student decision-making Drivers of international higher education mobility Demographics Economics Domestic tertiary enrolments International postgraduate
Bela Hovy Chief, Migration Section Population Division, Department of Economic and Social Affairs (UN DESA)
") New York Declaration for Refugees and Migrants and the Global Compact for Safe, Orderly and Regular Migration: Implications for migration data collection Bela Hovy Chief, Migration Section Population Division,
New York Declaration for Refugees and Migrants and the Global Compact for Safe, Orderly and Regular Migration: Implications for migration data collection Bela Hovy Chief, Migration Section Population Division,
I N T R O D U C T I O N
 REFUGEES by numbers 2002 I N T R O D U C T I O N At the start of 2002 the number of people of concern to UNHCR was 19.8 million roughly one out of every 300 persons on Earth compared with 21.8 million
Population Growth and California s Future. Hans Johnson
 Population Growth and California s Future Hans Johnson Outline California s rapid growth Population diversity Implications for policy 2 California Has a Large and Growing Population 40,000 Population (in
A GLOBAL PERSPECTIVE ON RESEARCH AND DEVELOPMENT
 UNESCO Institute for Statistics A GLOBAL PERSPECTIVE ON RESEARCH AND DEVELOPMENT The UNESCO Institute for Statistics (UIS) works with governments and diverse organizations to provide global statistics
Translation from Norwegian
 Statistics for May 2018 Forced returns from Norway The National Police Immigration Service (NPIS) forcibly returned 402 persons in May 2018, and 156 of these were convicted offenders. The NPIS is responsible
Migration Governance in the Arab Region and Beyond
 Migration Governance in the Arab Region and Beyond Economic and Social Commission for Western Asia Vito Manzari from Martina Franca (TA), Italy - Immigrati Lampedusa I. Introduction International migration
Notes to Editors. Detailed Findings
 Notes to Editors Detailed Findings Public opinion in Russia relative to public opinion in Europe and the US seems to be polarizing. Americans and Europeans have both grown more negative toward Russia,
INTERNATIONAL MIGRATION FLOWS TO AND FROM SELECTED COUNTRIES: THE 2015 REVISION
 E c o n o m i c & S o c i a l A f f a i r s INTERNATIONAL MIGRATION FLOWS TO AND FROM SELECTED COUNTRIES: THE 2015 REVISION CD-ROM DOCUMENTATION United Nations This page intentionally left blank POP/DB/MIG/Flow/Rev.2015
The Inside Track. Concise information and political insight on the upcoming session of the Human Rights Council
 The Inside Track Concise information and political insight on the upcoming session of the Human Rights Council The Inside Track HRC5: the 5 th regular session of the Human Rights Council Tuesday 6 th June
Tourism Highlights International Tourist Arrivals, Average Length of Stay, Hotels Occupancy & Tourism Receipts Years
 KINGDOM OF CAMBODIAA NATION RELIGION KING 3 TOURISM STATISTICS REPORT Oct tober 2013 MINISTRY OF TOURISM Statisticss and Tourism Information Department No. A3, Street 169, Sangkat Veal Vong, Khann 7 Makara,
Asylum Levels and Trends in Industrialized Countries. First Quarter, 2005
 Asylum Levels and Trends in Industrialized Countries First Quarter, 2005 Comparative Overview of Asylum Applications Lodged in 31 European and 5 Non-European Countries May 2005 Statistics PGDS/DOS UNHCR
Has Globalization Helped or Hindered Economic Development? (EA)
") Has Globalization Helped or Hindered Economic Development? (EA) Most economists believe that globalization contributes to economic development by increasing trade and investment across borders. Economic
Has Globalization Helped or Hindered Economic Development? (EA) Most economists believe that globalization contributes to economic development by increasing trade and investment across borders. Economic
HUMAN RESOURCES IN R&D
 HUMAN RESOURCES IN R&D This fact sheet presents the latest UIS S&T data available as of July 2011. Regional density of researchers and their field of employment UIS Fact Sheet, August 2011, No. 13 In the
Financing of the United Nations peacekeeping forces in the Middle East: United Nations Interim Force in Lebanon
 United Nations General Assembly Distr.: General 5 June 2001 Original: English A/55/681/Add.1 Fifty-fifth session Agenda item 138 (b) Financing of the United Nations peacekeeping forces in the Middle East:
United Nations Economic and Social Commission for Asia and the Pacific (ESCAP) A. INTRODUCTION
 A. INTRODUCTION") FOLLOW-UP ACTIVITIES RELATING TO THE 2006 HIGH-LEVEL DIALOGUE ON INTERNATIONAL MIGRATION AND DEVELOPMENT United Nations Economic and Social Commission for Asia and the Pacific (ESCAP) A. INTRODUCTION As
FOLLOW-UP ACTIVITIES RELATING TO THE 2006 HIGH-LEVEL DIALOGUE ON INTERNATIONAL MIGRATION AND DEVELOPMENT United Nations Economic and Social Commission for Asia and the Pacific (ESCAP) A. INTRODUCTION As
C OVER STORY OVERPOPULATION: MYTHS AND REALITY. Text: Olga Irisova
 C OVER STORY OVERPOPULATION: MYTHS AND REALITY Text: Olga Irisova 1/11 W OR LD EC ONOMIC JOURNAL #11 2013 OVER THE PAST 54 YEARS, THE EARTH S POPULATION HAS MORE THAN DOUBLED, AND ACCORDING TO A RECENT
Table of Contents GLOBAL ANALISIS. Main Findings 6 Introduction 10. Better data for better aid by Norman Green 19
 Table of Contents Main Findings 6 Introduction 10 GLOBAL ANALISIS Chapter I: Sources, Methods, And Data Quality 14 Better data for better aid by Norman Green 19 Chapter II: Population Levels And Trends
Migration in the Long Term: The Outlook for the Next Generations
 4 Migration in the Long Term: The Outlook for the Next Generations Can migration help mitigate demographic gaps, population aging, and global labor market imbalances? The first half of this century will
Return of convicted offenders
 Monthly statistics December : Forced returns from Norway The National Police Immigration Service (NPIS) forcibly returned 869 persons in December, and 173 of these were convicted offenders. The NPIS forcibly
International migration and development
 United Nations A/71/296 General Assembly Distr.: General 4 August 2016 Original: English Seventy-first session Item 21 (b) of the provisional agenda* Globalization and interdependence International migration
Migratory pressures in the long run: international migration projections to 2050
 ECONOMIC BULLETIN 4/2017 ANALYTICAL ARTICLES Migratory pressures in the long run: international migration projections to 2050 Rodolfo Campos 5 December 2017 This article presents bilateral international
The National Police Immigration Service (NPIS) returned 444 persons in August 2018, and 154 of these were convicted offenders.
 returned 444 persons in August 2018, and 154 of these were convicted offenders.") Monthly statistics August 2018 Forced returns from Norway The National Police Immigration Service (NPIS) returned 444 persons in August 2018, and 154 of these were convicted offenders. The NPIS is responsible
Monthly statistics August 2018 Forced returns from Norway The National Police Immigration Service (NPIS) returned 444 persons in August 2018, and 154 of these were convicted offenders. The NPIS is responsible
Bilateral Migration Model and Data Base. Terrie L. Walmsley
 Bilateral Migration Model and Data Base Terrie L. Walmsley Aims of Research Numerous problems with current data on numbers of migrants: Opaque data collection, Regional focus, Non-separation of alternative
Conference of the Parties to the United Nations Convention against Transnational Organized Crime
 United Nations CTOC/COP/WG.2/2013/5 Conference of the Parties to the United Nations Convention against Transnational Organized Crime Distr.: General 19 November 2013 Original: English Report on the meeting
Human resources for health
 SEVENTY-SECOND WORLD HEALTH ASSEMBLY A7/3 Provisional agenda item.3 8 April 09 Human resources for health WHO Global Code of Practice on the International Recruitment of Health Personnel: third round of
WHY SHOULD I STUDY ENGLISH?
 WHY SHOULD I STUDY ENGLISH? WAIFS recommend that all students seriously consider taking an certificate course before entering their principal course of study at WAIFS. Many students simply consider this
Human Resources in R&D
 NORTH AMERICA AND WESTERN EUROPE EAST ASIA AND THE PACIFIC CENTRAL AND EASTERN EUROPE SOUTH AND WEST ASIA LATIN AMERICA AND THE CARIBBEAN ARAB STATES SUB-SAHARAN AFRICA CENTRAL ASIA 1.8% 1.9% 1. 1. 0.6%
Introduction: The State of Europe s Population, 2003
 Introduction: The State of Europe s Population, 2003 Changes in the size, growth and composition of the population are of key importance to policy-makers in practically all domains of life. To provide
World Migration in Figures
 World Migration in Figures Strengthening Evidence - Improving Policy Bela Hovy Chief, Migration Section, Population Division Department of Economic and Social Affairs (DESA) United Nations, New York Side
The Complexity of International Migration Reviewed. Hania Zlotnik Population Division Department of Economic and Social Affairs United Nations
 The Complexity of International Migration Reviewed Hania Zlotnik Population Division Department of Economic and Social Affairs United Nations 1 SOME CAUSES OF MIGRATION S COMPLEXITY Who is a migrant? Move
How many students study abroad and where do they go?
 1. EDUCATION LEVELS AND STUDENT NUMBERS How many students study abroad and where do they go? More than 4.1 million tertiary-level students were enrolled outside their country of citizenship in 2010. Australia,
How Extensive Is the Brain Drain?
 How Extensive Is the Brain Drain? By William J. Carrington and Enrica Detragiache How extensive is the "brain drain," and which countries and regions are most strongly affected by it? This article estimates
geography Bingo Instructions
 Bingo Instructions Host Instructions: Decide when to start and select your goal(s) Designate a judge to announce events Cross off events from the list below when announced Goals: First to get any line
UNHCR PRESENTATION. The Challenges of Mixed Migration Flows: An Overview of Protracted Situations within the Context of the Bali Process
 Bali Process on People Smuggling, Trafficking in Persons and Related Transnational Crime Senior Officials Meeting 24-25 February 2009, Brisbane, Australia UNHCR PRESENTATION The Challenges of Mixed Migration
The Demographic Profile of Qatar
 UNITED NATIONS The Demographic Profile of Qatar Population Trends - Mortality - Fertility - Age Structure - Urbanization - International Migration - Education and Youth Unemployment Population Trends Population
UNITED NATIONS EXPERT GROUP MEETING ON SOCIAL AND ECONOMIC IMPLICATIONS OF CHANGING POPULATION AGE STRUCTURES
 E c o n o m i c & S o c i a l A f f a i r s UNITED NATIONS EXPERT GROUP MEETING ON SOCIAL AND ECONOMIC IMPLICATIONS OF CHANGING POPULATION AGE STRUCTURES Mexico City, 31 August 2 September 2005 United
United Nations Demographic Yearbook review
 United Nations, Department of Economic and Social Affairs Statistics Division, Demographic and Social Statistics Branch United Nations Demographic Yearbook review National reporting of international migration
Rethinking Australian Migration
 Rethinking Australian Migration Stephen Castles University of Sydney Department of Sociology and Social Policy Challenges to Australian migration model 1. Changes in global and regional migration 2. From
Cambridge International Examinations Cambridge International Advanced Subsidiary and Advanced Level
 Cambridge International Examinations Cambridge International Advanced Subsidiary and Advanced Level *4898249870-I* GEOGRAPHY 9696/31 Paper 3 Advanced Human Options October/November 2015 INSERT 1 hour 30