Demographic Trends in Nonmetropolitan America: Implications for Land Use Development and Conservation.
|
|
|
- Roland Pierce
- 6 years ago
- Views:
Transcription

1 University of New Hampshire University of New Hampshire Scholars' Repository Sociology Scholarship Sociology 2013 Demographic Trends in Nonmetropolitan America: Implications for Land Use Development and Conservation. Kenneth M. Johnson University of New Hampshire - Main Campus Follow this and additional works at: Part of the Rural Sociology Commons Recommended Citation Johnson, Kenneth M., "Demographic Trends in Nonmetropolitan America: Implications for Land Use Development and Conservation." (2013). Vermont Journal of Environmental Law This Article is brought to you for free and open access by the Sociology at University of New Hampshire Scholars' Repository. It has been accepted for inclusion in Sociology Scholarship by an authorized administrator of University of New Hampshire Scholars' Repository. For more information, please contact nicole.hentz@unh.edu.
2 Demographic Trends in Nonmetropolitan America: Implications for Land Use Development and Conservation. This article is available at University of New Hampshire Scholars' Repository:
3 DEMOGRAPHIC TRENDS IN NONMETROPOLITAN AMERICA: IMPLICATIONS FOR LAND USE DEVELOPMENT AND CONSERVATION By Kenneth M. Johnson * Demographic Trends in Nonmetropolitan America: Implications for Land Use Development and Conservation Data and Methods Analysis Historical Demographic Trends in Rural America Recent Demographic Change in Rural Areas Natural Increase and Net Migration Produce the Rural Demographic Change. 38 The Great Recession has Influenced Rural Demographic Trends Demographic Trends in New England and Vermont Demographic Change Varies Across Rural America The Rural Population is Aging The Growing Minority Population is Contributing to Rural Demographic Change Conclusions and Implications DEMOGRAPHIC TRENDS IN NONMETROPOLITAN AMERICA: IMPLICATIONS FOR LAND USE DEVELOPMENT AND CONSERVATION This research contributes new information delineating the rapidity and geographic scale at which demographic change is occurring in * Department of Sociology and Carsey Institute University of New Hampshire Huddleston Hall, 73 Main Street University of New Hampshire Durham, NH Ken.Johnson@unh.edu VTLaw13.Journal.v This research has been supported by grants from the New Hampshire Agricultural Research Station, Annie E. Casey Foundation, and W.K. Kellogg Foundation and by an anonymous donor. Research support provided by Luke Rogers and Barb Cook of the Carsey Institute.
4 32 VERMONT JOURNAL OF ENVIRONMENTAL LAW [Vol. 15 nonmetropolitan America. Rural areas are being buffeted by economic, social, and governmental transformations from far beyond their borders. These structural transformations are reflected in the demographic trends playing out across the vast rural landscape in the first decade of the twentyfirst century. The patterns of demographic change in rural America are complex and subtle, but their impact is not. Population change has significant implications for the people, places, and institutions of rural America; for the natural environment that is a fundamental part of what rural America was, is, and will become; and for the laws and policies that seek to balance the rights of individuals with the needs of the larger society. This article examines the influence of demographic forces on nonmetropolitan population redistribution trends in the U.S. in the first decade of the twenty-first century. Rural America is a deceptively simple term for a remarkably diverse collection of places. Popular images of rural America are often based on outdated stereotypes that equate rural areas with farming. Though farming remains important in hundreds of counties, rural America is now very diverse. Geographically, it encompasses the vast agricultural heartland of the Great Plains sprawling from the Canadian border deep into Texas; the arid range of the Southwest; the dense, mountainous forests of the Pacific Northwest; the hardscrabble towns and hollows of the Appalachians; the rocky shorelines and working forests of New England; and the flat and humid coastal plain of the Southeast. Economically, it includes auto supplier plants strung like pearls on a string along the expressways of the auto corridor; manufacturing, food processing, and warehouse distribution centers clustered around major interstate interchanges; farm towns, grain elevators, and ethanol plants scattered through the corn and wheat belts; as well as sprawling recreational areas proximate to mountains, inland lakes, and the Atlantic, Pacific, and Great Lakes coastlines. There is also considerable variation in the demographic trends in rural America. Far more people lived in some rural counties a century ago than do today, and in hundreds of these declining counties more people are dying than being born. Other rural areas have experienced substantial population gains because of an influx of migrants and high fertility. Racial and ethnic diversity is growing as well. Though much of rural America remains overwhelmingly white, there are substantial African-American concentrations in the Southeast; Hispanic areas of long-standing in the Southwest, as well as new Hispanic destinations in the Southeast and Midwest; and clusters of native Americans in the Great Plains and upper Great Lakes. Rural America contains seventy-five percent of the land area of the United States and nearly 51 million residents. The demographic changes
5 2013] Demographic Trends in Nonmetropolitan America 33 underway in this vast area are as diverse as the people, places, and institutions that populate it. These demographic changes are important because they have implications for the natural environment, landscape change, and rural policy. Analysis of the longitudinal demographic change in rural America illustrates the complex interplay between migration, natural increase, aging, and diversity that produced the population redistribution trends evident today. 1 DATA AND METHODS There is more than one way to define what rural America is. In fact, the federal government uses some fifteen rural definitions. 2 Here, I delineate rural areas using counties as the unit of analysis. Counties have historically stable boundaries and are a basic unit for reporting fertility, mortality, and census data. Counties are designated as metropolitan or nonmetropolitan using criteria developed by the U.S. Office of Management and Budget (county-equivalents are used for New England). A constant 2004 metropolitan/nonmetropolitan classification is used here because it removes the effect of reclassification from the calculation of longitudinal population change. Metropolitan areas include counties containing an urban core of 50,000 or more population (or central city), along with adjacent counties that are highly integrated with the core county as measured by commuting patterns. There are 1,090 metropolitan counties. The remaining 2,051 counties are nonmetropolitan (Figure 1). Nonmetropolitan counties are further subdivided into those that are contiguous to urban areas (adjacent) and those that are not near urban areas (non-adjacent). The terms rural and nonmetropolitan are used interchangeably here, as are the terms metropolitan and urban. Counties are also classified using a typology developed by the Economic Research Service of the U.S. Department of Agriculture, which classifies nonmetropolitan counties along economic and policy dimensions. 3 The county classification developed by Johnson and Beale 4 is 1. Kenneth M. Johnson & John B. Cromartie, The Rural Rebound and its Aftermath: Changing Demographic Dynamics and Regional Contrasts, in POPULATION CHANGE AND RURAL SOC Y 25, 28 (W. Kandel & D.L. Brown eds. 2006). 2. David A. Fahrenthold, What Does Rural Mean? Uncle Sam Has More Than a Dozen Answers, WASH. POST (Jun. 8, 2013) available at 08/politics/ _1_definition-lenoir-rural-communities. 3. See generally 2004 County Typology Codes, USDA ERS, (last visited Aug. 8, 2013) (showing typology developed by the U.S. Dept. of Agriculture) [hereafter Typology Codes]. 4. Kenneth M. Johnson & Calvin L. Beale, Nonmetro Recreation Counties: Their Identification and Rapid Growth, 17 RURAL AM. 12, (2002).
6 34 VERMONT JOURNAL OF ENVIRONMENTAL LAW [Vol. 15 also used to identify nonmetropolitan counties where recreation is a major factor in the local economy. County population data come from the decennial Census of Population for 1990, 2000, and They are supplemented with data from the Federal-State Cooperative Population Estimates program (FSCPE) births and deaths in each county for April 1990 to July Births and deaths from July 2009 to the Census in April 2010 were estimated at seventy-five percent of the amount from July 2008 to July The estimates of net migration used here were derived by the residual method whereby net migration is what is left when natural increase (births minus deaths) is subtracted from total population change. Data for racial and Hispanic origin of the population are from the 2000 and 2010 Censuses and include five racial/hispanic origin groups: (1) Hispanics of any race; (2) non-hispanic whites; (3) non-hispanic blacks; (4) non-hispanic Asians; and (5) all other non-hispanics, including those who reported two or more races. To examine the uneven spatial distribution of different racial and ethnic populations, counties were also classified as having minority concentrations if more than ten percent of the population was from a specific minority group. Black, Hispanic, Asian, and Native American peoples were the four minority groups that reached the ten percent threshold in at least one county. Counties that had two or more minority groups that reached the ten percent threshold were classified as multi-ethnic. Age-specific net migration is computed as a numerical residual between the census count in 2010 and an expected population for that year. The expected population is generated by taking the census count at the beginning of the decade from Census 2000, adjusting this count for undercount/overcount and misallocations, and aging the population forward to 2010, taking into account births and deaths during the decade. The procedure yields age-specific estimates of net migration for every U.S. county U.S. CENSUS BUREAU, ANNUAL ESTIMATES OF THE RESIDENT POPULATION FOR COUNTIES: APRIL 1, 2000 TO JULY 1, 2009 (2011) available at (last visited Sept. 12, 2013). 6. Kenneth M. Johnson et al., Age and Lifecycle Patterns Driving U.S. Migration Shifts, 62 CARSEY INST. 1, 1 (2013); PAUL R. VOSS ET AL., COUNTY-SPECIFIC NET MIGRATION BY FIVE-YEAR AGE GROUPS, HISPANIC ORIGIN, RACE AND SEX , 2 3 (Univ. of Wis.-Madison, Ctr. for Demography & Ecology, Working Paper No , 2004); Richelle L. Winkler et al., County- Specific Net Migration by Five-Year Age Groups, Hispanic Origin, Race and Sex , 1 2 (Univ. of Wis.-Madison, Ctr. for Demography & Ecology, Working Paper No , 2013).
7 2013] Demographic Trends in Nonmetropolitan America 35 ANALYSIS Historical Demographic Trends in Rural America The United States has experienced a selective deconcentration of its population over the past several decades. 7 This produced a spatially uneven pattern of population redistribution in rural America that favored some areas at the expense of others. Rural America is a big place encompassing nearly seventy-five percent of the nation s land area and 51 million people. Population redistribution trends in this vast area are far from monolithic. Some rural regions have experienced decades of sustained growth, while large segments of the agricultural heartland continued to lose people and institutions. Findings from other developed nations indicate deconcentration (often labeled counterurbanization ) is underway there as well. 8 Population growth in rural America has always reflected a balance between natural increase (i.e., births minus deaths) and net migration (inmigration minus out-migration). Early in the nation s history, net inmigration fueled most rural growth as vast new frontiers of the country were opened to homesteading and commercial development (e.g., forestry and mining). 9 Soon after settlement, natural increase began to contribute heavily to population growth due to high rural fertility and low mortality rates among a growing young rural population of reproductive age. By the 1920s, however, people were leaving rural America; they were attracted by the economic and social opportunities in the nation s booming big cities, 7. William H. Frey & Kenneth M. Johnson, Concentration Immigration, Restructuring and the Selective Deconcentration of the U.S. Population, PSC RESEARCH REPORT SERIES Nov. 1996, at 7 8; Johnson & Cromartie, supra note 1, at 25; See generally Larry Long & Alfred Nucci, Accounting for Two Population Turnarounds in Nonmetrolpolitan America, 7 RESEARCH IN RURAL SOC. AND DEV. 47, (1998) (demonstrating the deconcentration of the American population); See Daniel R. Vining, Jr. & Anne Strauss, A Demonstration That Current De-Concentration Trends Are a Clean Break With Past Trends, 90 REG L SCI. RESEARCH INST. 4, (1976) (describing patterns of population redistribution between 1900 and the mid 1970s). 8. See generally PAUL BOYLE & KEITH HALFACREE, MIGRATION INTO RURAL AREAS: THEORIES AND ISSUES (1998) (illustrating the relationships between migration, counterurbanisation, social class, immigration, and the cultural competence in rural lifestyles); See generally Tony Champion, Studying Counterurbanisation and the Rural Population Turnaround, in MIGRATION INTO RURAL AREAS: THEORIES AND ISSUES, (Paul Boyle & Keith Halfacree eds., 1998) (showing further deconcentration occurrences from developed nations); See also Tony Champion & John Shepherd, Demographic Change in Rural England, in THE AGEING COUNTRYSIDE 29, 31 (P. Lowe & L. Speakman eds., 2006) (explaining how counter-urbanisation is occurring in England). 9. See generally Claude S. Fischer & Michael Hout, Preface to CENTURY OF DIFFERENCE: HOW AMERICA CHANGED IN THE LAST ONE HUNDRED YEARS (2006) (examining how migration patterns contributed to changes in diversity in the 20 th century): See GLENN V. FUGUITT ET AL., RURAL AND SMALL TOWN AM. 1, 14, 263 (1989) (examining factors contributing to the changing percentage of American rural population over history, pointing to the transformation in American industrial economics as one of the factors).
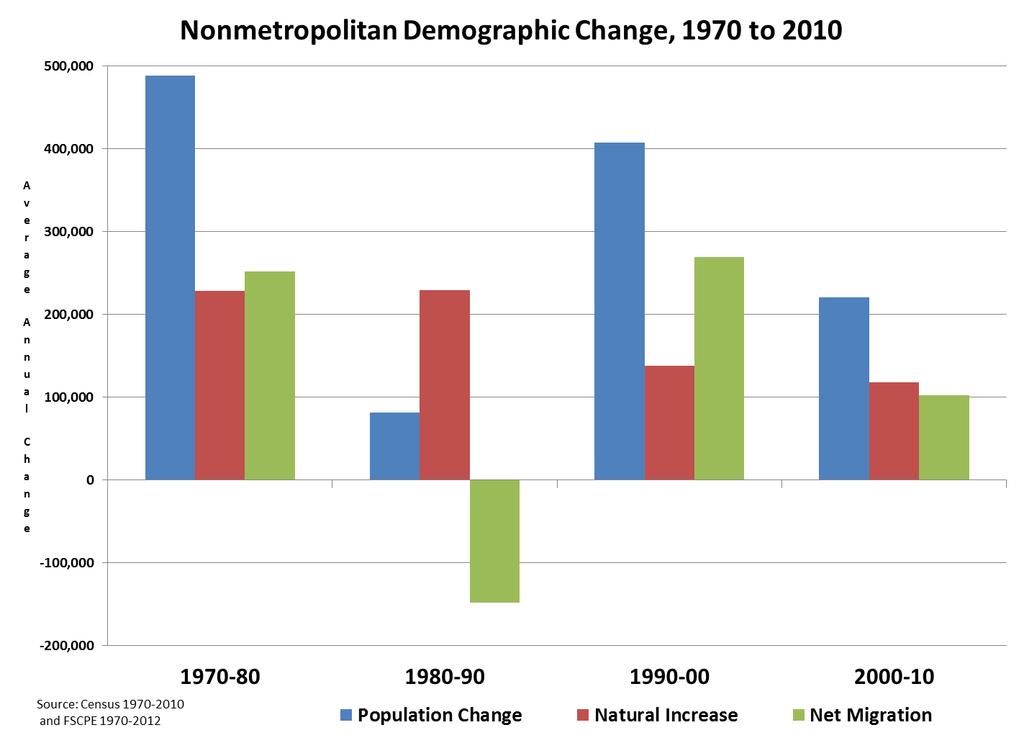
8 36 VERMONT JOURNAL OF ENVIRONMENTAL LAW [Vol. 15 and pushed from rural areas by the mechanization and consolidation of agricultural production. 10 The magnitude of rural net out-migration varied from decade to decade and from place to place, but the general pattern was unchanging: more people left rural areas than came. Of course, there were exceptions to this trend in some industrializing regions, such as the Northeast, and at the urban fringe. Still, more than half of the nation s rural counties lost population between 1920 and By the mid-20th century, rural net out-migration losses were so great that the modest rural population gains were fueled entirely by natural increase. 12 High rural fertility helped along by the post-wwii Baby Boom brought a surplus of births over deaths, which offset the substantial migration losses to urban areas. With the waning of the Baby Boom in the late 1960s, this large surplus of births over deaths that sustained modest nonmetropolitan population growth diminished. The relentless outmigration of young adults, along with aging in place, contributed heavily to the aging of the rural population, resulting in fewer births and increased deaths. 13 The diminishing population gains that characterized rural America for the first two-thirds of the century ended abruptly with the onset of the remarkable rural demographic turnaround of the 1970s. For the first time in at least 150 years, population gains in nonmetropolitan areas exceeded those in metropolitan areas; indeed, nonmetropolitan areas grew at the expense of metropolitan areas, as more people left urban areas than arrived in them. 14 Widespread net migration gains in rural counties were fueled by rural restructuring job growth associated with rural retirement migration, natural resources (e.g., coal and gas), and recreational development as 10. See generally Michael J. Greenwood, Research on Internal Migration in the United States: A Survey, 13 J. ECON. LITERATURE 397, 401 (1975) (explaining that some researchers have found that moving off farms has been profitable for migrants); Richard A. Easterlin, Population Change and Farm Settlement in the Northern United States, 36 J. OF ECON. HISTORY 45, 46, 70 (1976). 11. KENNETH M. JOHNSON, THE IMPACT OF POPULATION CHANGE ON BUSINESS ACTIVITY IN RURAL AMERICA, (1985); Kenneth M. Johnson, Demographic Trends in Rural and Small Town America, 1 REPORTS ON AM. 1, 8 (2006). 12. See Johnson, supra note 11, at 8 (identifying natural increase was sufficient to offset migration losses). 13. Kenneth M. Johnson, The Continuing Incidence of Natural Decrease in American Counties, 76 RURAL SOC (2011); Kenneth M. Johnson et al., Temporal and Spatial Variation in Age-Specific Net Migration in the United States, 42 DEMOGRAPHY 791, 791, 797 (Nov. 2005); Daniel T. Lichter et al., Components of Change in the Residential Concentration of the Elderly Population: , 36 J. GERONTOLOGY 480, 481 (1981). 14. Glenn V. Fugitt, The Nonmetropolitan Population Turnaround, 11 ANN. REV. OF SOC., 259, 259 (1985).
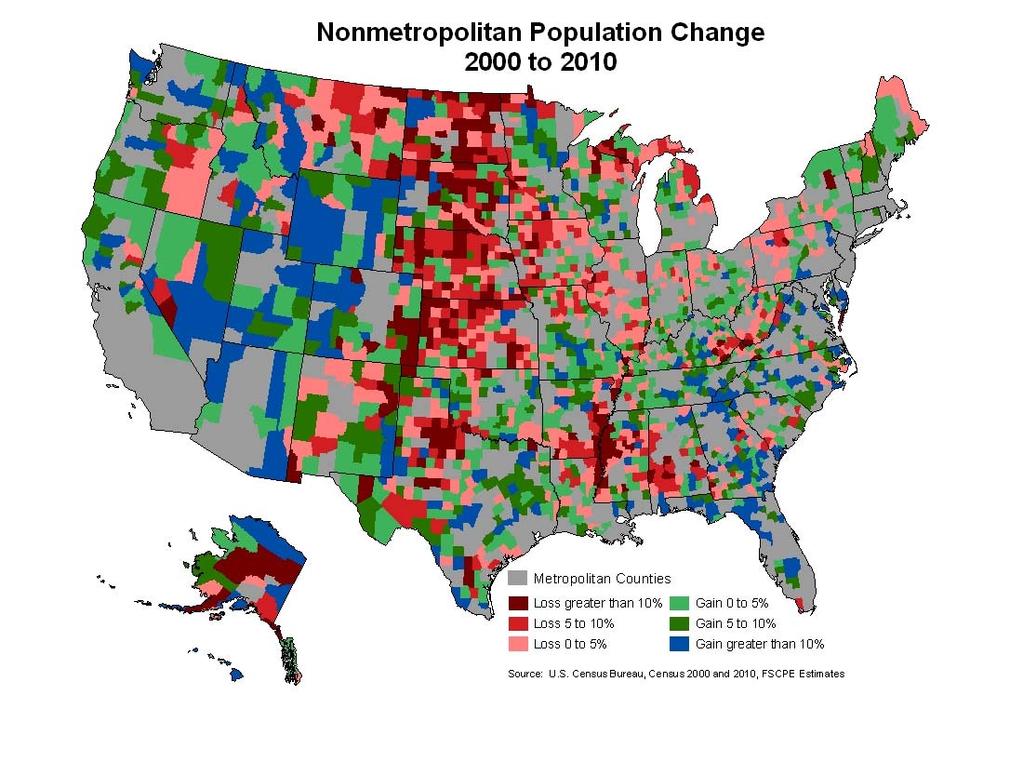
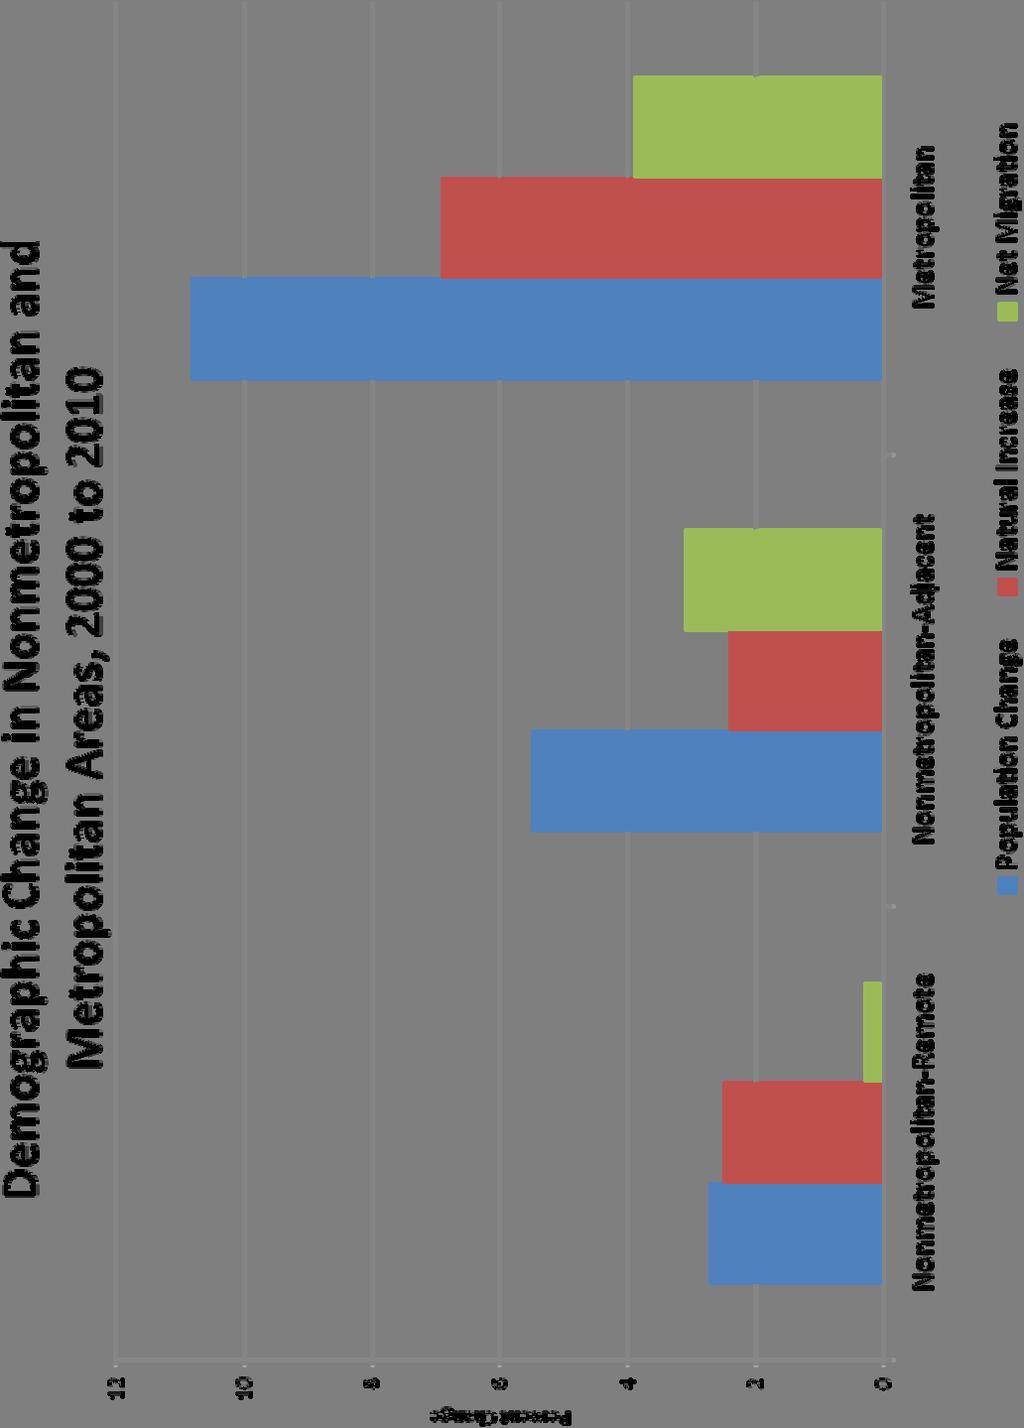
9 2013] Demographic Trends in Nonmetropolitan America 37 well as by urban sprawl and changing residential preferences. 15 The ruralurban turnaround was short-lived. Rural population growth slowed in the 1980s with the return of widespread net out-migration from rural areas (Figure 2). But just as unexpectedly, rural population growth rebounded in the 1990s as migration to rural areas accelerated. 16 However, as the 1990s came to an end, there was evidence that nonmetropolitan population gains were slowing. 17 Thus, at the dawn of the twenty-first century, the demographic implications of natural increase and net migration for the future of rural America were once again in question. Recent Demographic Change in Rural Areas Nonmetropolitan population growth slowed precipitously after Between 2000 and 2010, rural counties gained 2.2 million residents (4.5%) to reach a population of 51 million in April of This growth rate was roughly half that during the 1990s, when the rural population grew by 4.1 million. Rural population gains between 2000 and 2010 were greatest in the West and Southeast, as well as on the periphery of large urban areas in the Midwest and Northeast (Figure 3). Scattered population gains also were evident in recreational areas of the upper Great Lakes, the Ozarks, and Northern New England. Population losses were common in the Great Plains and Corn Belt; in the Mississippi Delta; in parts of the Northern Appalachians; and in the industrial and mining belts of New York and Pennsylvania. This slowdown was evident in rural counties both proximate to and remote from urban areas. Gains were greater in nonmetropolitan counties adjacent to metropolitan areas, just as they were from 1990 to In these adjacent counties the population gain was 5.5% between 2000 and 2010; only 57% of what it had been during the 1990s (Figure 4). In all, 63.4% of the adjacent counties gained population between 2000 and Among more remote nonmetropolitan counties, the gain was considerably smaller (2.7%). This was significantly less than the 6.4% gain such counties experienced during the 1990s. Only 44% of the non-adjacent counties 15. David L. Brown & John M. Wardwell, Population Redistribution in the United States during the 1970s, in NEW DIRECTIONS IN URBAN RURAL MIGRATION: POPULATION TURNAROUND IN RURAL AM. 1, 12, 14 (David L. Brown & John M. Wardwell eds., 1981); Fugitt, supra note 14, at Kenneth M. Johnson & Calvin L. Beale, The Recent Revival of Widespread Population Growth in Nonmetropolitan Areas of the United States, 59 RURAL SOC. 655, (1994). 17. Calvin L. Beale, Nonmetro Population Growth Rate Recedes in a Time of Unprecedented National Prosperity, 11 RURAL CONDITIONS & TRENDS 27, 27 (2000); JOHN B. CROMARTIE, RURAL AMERICA: NONMETRO OUTMIGRATION EXCEEDS IMMIGRATION FOR THE FIRST TIME IN A DECADE 16, (2001); Johnson & Cromartie, supra note 1, at 35.
10 38 VERMONT JOURNAL OF ENVIRONMENTAL LAW [Vol. 15 gained population between 2000 and Metropolitan population gains also diminished (from 14.0% to 10.8%), but the reduction was much more modest. A key question is: how did the demographic components of change combine to produce the smaller nonmetropolitan population gains during the post-2000 period? Natural Increase and Net Migration Produce the Rural Demographic Change During the 1990s, migration accounted for nearly two-thirds of the nonmetropolitan population gain of 4.1 million, but after 2000, less than half (46%) of the smaller population gain of 2.2 million came from migration. Nonmetropolitan counties gained 2.7 million residents from migration during the 1990s, but only about one million between 2000 and Migration gains also occurred in fewer rural counties during the last decade. Only 46% of the rural counties experienced a net migration gain between 2000 and 2010 compared to 65% between 1990 and Because natural increase in rural areas remained relatively stable over those two decades, the reduced migration gains after 2000 were the primary cause of the sharply diminished rural population growth. In rural counties remote from metropolitan areas, there was a minimal net migration gain estimated at 46,000 (0.3%) between 2000 and Just 35% of these non-adjacent counties gained migrants. In contrast, such counties had a migration increase of 544,000 during the 1990s. Migration gains were greater (980,000) in counties that were adjacent to metropolitan areas. This represents a 3% gain from migration. Overall, 53% of the adjacent counties gained migrants between 2000 and Nonetheless, this recent migration gain was considerably smaller than that during the 1990s, when adjacent counties gained 2.4 million migrants (7.4%). With migration gains diminishing, natural increase produced most of the nonmetropolitan population growth between 2000 and 2010; accounting for 1.2 million of the gain of 2.2 million rural residents (54%). In fact, in nonadjacent nonmetropolitan counties, the natural increase of 418,000 (2.5%) accounted for 90% of the population gain. In adjacent nonmetropolitan counties, natural increase was 760,000 (2.4%). Here the contributions of natural increase and net migration were more balanced with natural 18. Immigration contributed more to rural migration gains between 2000 and 2010 than it did during the 1990s. No definitive immigration data are currently available for the period, but estimates from 2000 to 2009 suggest a substantial inflow of immigrants to both adjacent and nonadjacent counties. However, even with immigration on the rise, overall migration gains were significantly smaller in rural areas during the first decade of the twenty-first century.
11 2013] Demographic Trends in Nonmetropolitan America 39 increase, accounting for 44% of the population increase of 1.7 million. Though natural increase provided the majority of the rural population gain between 2000 and 2010, the absolute gain from natural increase in nonmetropolitan counties was smaller than during the 1990s. Rural natural increase was already slowing in the 1990s, when it supplied 1.4 million new residents. By the first decade of the new century, it produced just 1.2 million new residents. Further evidence of the diminishing excess of births over deaths in nonmetropolitan areas is reflected in a sharp increase in the incidence of natural decrease there. Natural decrease occurs when more people die than are born in an area. It has been unusual in the American experience. However, recent Census Bureau estimates of births and deaths suggest that natural decrease is now at the highest level in U.S. history with deaths exceeding births in 1,135 (36%) of all U.S. counties. 19 More than 90% of U.S. counties with episodes of natural decrease are nonmetropolitan; in parts of rural America deaths have exceeded births for decades. 20 Between 2000 and 2009, nearly 750 nonmetropolitan counties (36%) experienced an overall natural decrease. This is up from approximately 29% in the 1990s and is the highest level of sustained natural decrease in U.S. history. Within rural areas, the incidence of natural decrease is influenced by proximity to metropolitan areas. Nearly 43% of non-adjacent counties had natural decrease between 2000 and 2010 compared to 30% of the adjacent counties. Natural decrease is not a fleeting concern. Once natural decrease occurs in a rural county, the probability that it will reoccur is extremely high. 21 The Great Recession Has Influenced Rural Demographic Trends The recent Great Recession has been compared to the Great Depression of the 1930s because during each of these economically troubled periods migration rates were at extremely low ebb. 22 The Great Recession s impact 19. Kenneth M. Johnson, Deaths Exceeded by Births in Record Number of U.S. Counties, THE CARSEY INST. AT THE SCHOLARS REPOSITORY Paper 191 at 1 (2013). 20. Kenneth M. Johnson, The Continuing Incidence of Natural Decrease in American Counties, 76 RURAL SOC (2011). 21. Id. 22. WILLIAM H. FREY, BROOKINGS INST., THE GREAT AMERICAN MIGRATION SLOWDOWN: REGIONAL AND METROPOLITAN DIMENSIONS (Dec. 9, 2009) available at JOHNSON, supra note 11, at 17; Leah Platt Boustan et al., The Effect of Internal Migration on Local Labor Markets: American Cities during the Great Depression, 28 J. LABOR ECON. 719, 725 (2010); See Joshua L. Rosenbloom & William A. Sundstrom, The Decline and Rise of Interstate Migration in the United States: Evidence from the IPUMS, , (Nat l Bureau of Econ. Research, Working Paper No. 9857, 2003), available at (discussing the decreased migration rate at the time of the Great Depression).
12 40 VERMONT JOURNAL OF ENVIRONMENTAL LAW [Vol. 15 on migration has reverberated through the entire nonmetropolitan hierarchy. The overall nonmetropolitan population gain between 2010 and 2012 was just 24,000 because rural areas suffered a net migration loss. To examine how the recession influenced rural migration between 2000 and 2012, the period is divided into four segments: the pre-boom (April 2000 to July 2004); the boom (July 2004 to July 2007); the recession (July 2007 to July 2010), the post-recessionary period (July 2010 to July 2012). In rural America as a whole, population growth slowed in the recessionary and post-recessionary periods. The annual population gain between 2004 and 2007 was 304,000, but this slowed to 178,000 between 2007 and 2010, and to just 11,000 between 2010 and 2012 (Figure 5). Natural increase also slowed recently because of the recession. However, the population slowdown was primarily due to the sharp reduction in net migration during recessionary and post-recessionary years. Recent research demonstrates that the impact of the recession on 23 migration was spatially uneven. It was greater in adjacent nonmetropolitan areas, where the booming economy fueled peripheral growth and spatial sprawl from nearby urban areas during the peak years. In adjacent counties, the downturn reduced net migration gains because the number of people moving to these urban proximate counties sharply diminished. Paradoxically, in remote rural areas, which have historically experienced slow growth or population decline, the impact of the recession on migration has not been as great. Remote rural counties suffered migration losses early in the decade and gained migrants during the middecade boom, and then migration gain diminished during the recession. However, the reduction in net migration during the recession was far more modest in these remote rural counties. 24 Data from the Pew Hispanic Center shows that the net flow of new immigrants into the United States also slowed during the recessionary period. 25 Immigrants are an important source of new growth in nonmetropolitan areas, so any recessionary slowdown in immigration is likely to influence rural areas. 26 In addition, new data from the National Center for Health Statistics show a fertility decline of nearly 7.3% in the 23. Kenneth M. Johnson, Rural Demographic Change in the New Century: Slower Growth, Increased Diversity, 44 CARSEY INST. 3, 4 (2012). 24. Id. 25. Jeffrey S. Passel, Pew Hispanic Cent., Comings & Goings: Unauthorized Immigrants & the Great Recession, Cornell Population Program Seminar Series (Mar. 4, 2011). 26. See Daniel T. Lichter & Kenneth M. Johnson, Emerging Rural Settlement Patterns and the Geographic Redistribution of America s New Immigrants, 71 RURAL SOC. 109, 110, 128 (2006) (discussing rural settlement trends among twenty-first century immigrants).
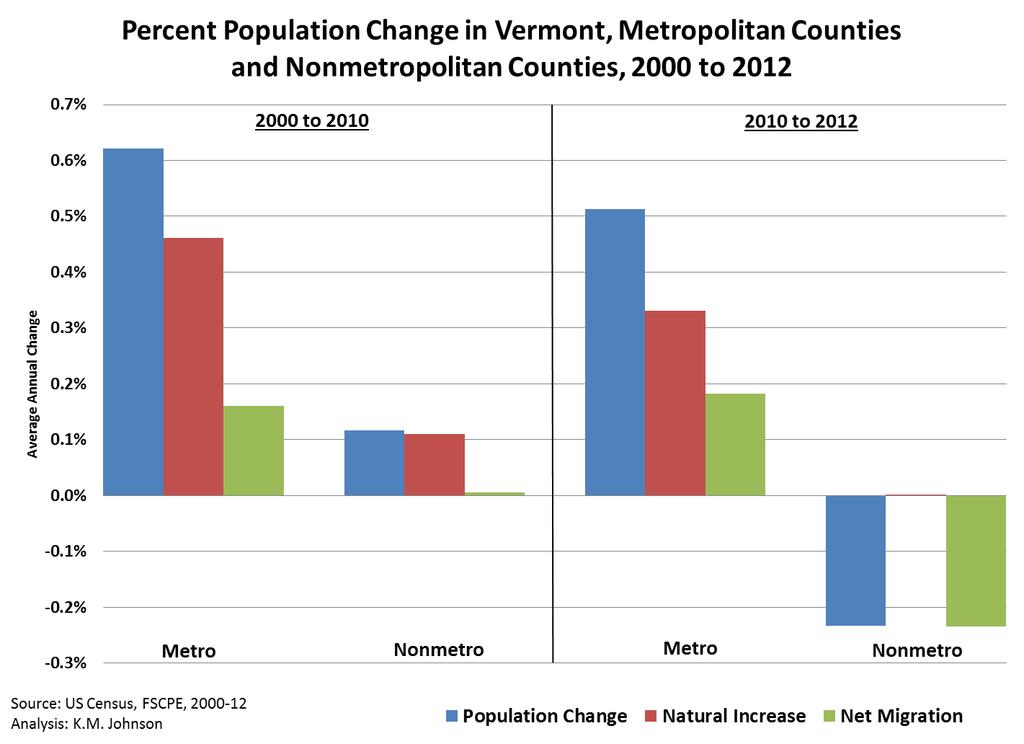
13 2013] Demographic Trends in Nonmetropolitan America 41 last three years. 27 Given the importance of natural increase and immigration to nonmetropolitan growth, fertility declines and reduced immigration have significant implications for future rural demographic trends. Demographic Trends in New England and Vermont How do demographic trends in New England compare to those for America as a whole? With 14.4 million residents, New England is home to just five percent of the U.S. Yet the region reflects many of the diverse strands that together comprise the country s demographic fabric: densely settled urban cores, expanding suburbs, struggling industrial towns, fastgrowing recreational and retirement areas, and isolated rural villages. Overall, New England s population gain between 2000 and 2010 was modest, but there are distinct regional differences in the demographic trends in New England. In northern New England (Maine, New Hampshire, and Vermont), population gains have generally been larger, with migration fueling much of the growth (Figure 6). This trend is more pronounced in New Hampshire and Maine than in Vermont, but migration made a positive contribution to each state s population growth. Natural increase also contributed to population growth in northern New England. In southern New England (Massachusetts, Connecticut, and Rhode Island), the situation was quite different. Here, natural increase produced the bulk of the population gain, even offsetting migration losses in Massachusetts and Rhode Island. Prior research suggests that the migration gains in northern New England were primarily due to a net influx of migrants from elsewhere in the U.S. (including southern New England), whereas the southern tier is losing substantial numbers of domestic migrants, but gaining immigrants. 28 Rural residents represent just 12.5% of New England s population. Since 2000, nonmetropolitan New England has grown by 4% (70,000), reaching a population of 1.8 million by In contrast, the region s metropolitan population grew by 3.7% to 12.6 million. Migration fueled most growth in rural New England (84%). In contrast, 98% of the population gain in metropolitan New England came from natural increase. Vermont has the second largest proportion of rural inhabitants of any state (66%), so demographic change in rural Vermont is important to the 27. Compare Brady E. Hamilton et al., Births: Preliminary Data for 2010, 60 NAT L VITAL STAT. REPORTS 1, 2 3 (2011), with Joyce A. Martin et al., Births: Final Data for 2008, 59 NAT L VITAL STAT. REPORTS 1, 1 (2010), and Brady E. Hamilton et al., Births: Preliminary Data for 2012, 62 NAT L VITAL STAT. REPORTS 1, 3 (2013) (detailing the decline in fertility rates between ). 28. Kenneth M. Johnson, The Changing Faces of New England: Increasing Spatial and Racial Diversity, 1 REPORTS ON NEW ENGLAND, 20, (2008).
14 42 VERMONT JOURNAL OF ENVIRONMENTAL LAW [Vol. 15 state s future. Yet, Vermont s rural population grew by just 1% between 2000 and In contrast, the state's urban population grew by nearly 6% (Figure 7). The minimal rural population gain was due almost entirely to natural increase. Rural Vermont had little net migration. The recession s impact is also evident. Since 2010, rural Vermont has lost population because there was a net migration loss from rural areas and little natural increase to offset this net outflow of migrants. The migration loss to rural Vermont after 2010 was consistent with national rural trends; however, nationally, there was a sufficient excess of births over deaths to produce an overall population gain. This was not the case in Vermont. Demographic Change Varies Across Rural America Rural America is a simple term describing a large agglomeration of counties spread across a vast region. So, it is not surprising that there is significant variation in the patterns of demographic change across this region. Demographic processes at work in nonmetropolitan counties are reflected in the contrasting patterns of population change across the spectrum of counties that reflect the continuum from the most traditional to the most contemporary rural places. Farming and mining represent the most traditional elements of the rural economy. Though they no longer monopolize the overall rural economy, these industries remain important in nonmetropolitan America. Farming still dominates the local economy of some 403 rural counties. Mining (which includes oil and gas extraction) is a major force in another 113 counties. Between 2000 and 2010, the population of farming dependent counties grew by just 0.3% and only 29% of them gained population (Figure 8). This minimal population gain was due to a natural increase gain of 3%, which was large enough to offset a migration loss. In contrast, farm counties grew by 5% during the 1990s because of the contribution of natural increase and migration. Mining counties were also entirely dependent on natural increase for their modest population gain of 2.7%. In all, just 56% of mining counties gained population between 2000 and Manufacturing counties have traditionally been a bright spot of rural demographic change. In fact, rural development strategies traditionally focused on expanding the manufacturing base. Manufacturing is important to the rural economy because it employs a larger proportion of the rural labor force than it does in urban areas. 29 In all, there are 584 rural manufacturing counties (including those that specialize in meat and poultry 29. JOHNSON, supra note 11, at 1 2.
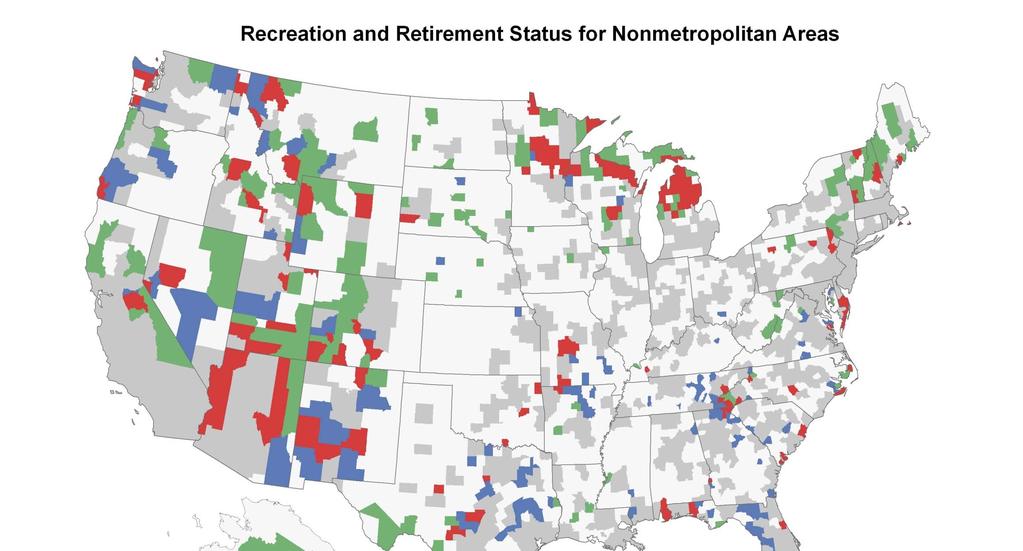
15 2013] Demographic Trends in Nonmetropolitan America 43 processing) whose population grew 8.1% during the 1990s, due mostly to migration. However, growth slowed dramatically to just 3.1% between 2000 and 2010, though most manufacturing counties (57%) did continue to grow. Natural increase accounted for 75% of this population gain. In contrast, migration contributed only modestly to the population gain with just 47% of the manufacturing counties gaining migrants. Globalization, coupled with the recent economic downturn, adversely impacted the rural manufacturing sector, which includes many low-technology, low-wage jobs that are increasingly shifting offshore or disappearing as technology replaces labor. 30 The demographic story was quite different in rural counties endowed with natural amenities, recreational opportunities, or quality of life advantages rather than dependant upon traditional rural extractive activities. Major concentrations of these counties exist in the mountain and coastal regions of the West, in the upper Great Lakes, in coastal and scenic areas of New England and upstate New York, in the foothills of the Appalachians and Ozarks, as well as in coastal regions from Virginia to Florida. 31 Such high amenity counties have consistently been the fastest growing in rural America. The 277 rural counties that are destinations for retirement migrants exemplify this trend (Figure 9). In each of the past several decades, they have grown faster than any other rural county type. For example, their population gain was 13.4% between 2000 and The 299 nonmetropolitan recreational counties were close behind at 10.7%. Overall, 84% of the retirement destination counties and 69% of the recreational counties gained population during the decade. Migration fueled almost all this growth, accounting for 89% of the population gain in retirement counties and 81% in recreational counties. These migration streams include both the amenity migrants themselves and other migrants attracted by the economic opportunities generated by such rapid growth. 32 However, recent population gains were considerably smaller than those during the 1990s, when retirement counties grew by 26% and recreational counties by 20%. The Rural Population is Aging 30. Johnson & Cromartie, supra note 1, at 44 45; JOHNSON, supra note 11, at See generally DAVID A. MCGRANAHAN, USDA ERS, NATURAL AMENITIES DRIVE POPULATION CHANGE (1999) (demonstrating various counties with such amenities); Johnson & Beale, supra note 4, at 12 19; See Typology Codes supra, note 3 (referring to the USDA s typology). 32. Johnson et al., supra note 6, at 2, 4.
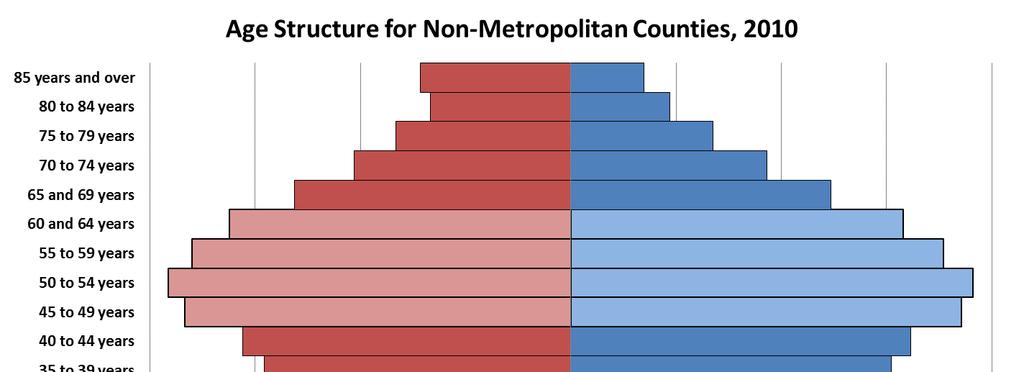
16 44 VERMONT JOURNAL OF ENVIRONMENTAL LAW [Vol. 15 Rural America is also aging; this is a trend likely to accelerate in the near future. The rural population is already considerably older than that of the U.S. as a whole. In 2010, the rural population had 18% more people ages 60 to 69 and 23% more over age 70 than the U.S. as a whole (Figure 10). In contrast, rural areas had proportionally fewer young adults and fewer children than the overall U.S. population. For example, there were 12% fewer people in their 20s and 30s in rural America. Rural America s proportion of seniors is increasing rapidly. Between 2000 and 2010, the rural population ages 60 to 69 increased by 36% and that of people ages 50 to 59 grew by 30%. The primary driver of this rapid increase in the older rural population is the aging in place of those residing in rural America. This is reflected in the 2010 age structure data (Figure 11). These cohorts, born between 1946 and 1964, represent the Baby Boom. They were ages 46 to 64 in The bulge representing these age groups is considerably larger than the cohorts older than or younger than it. Having a large population in late-middle-age has distinct advantages for rural areas right now. It means the working-age population is large compared to those either too old or too young to work. As such, it represents a large pool of social, economic, and intellectual human capital. However, as we look to the future, the rural age structure presents significant challenges. There are currently 4.5 million 65 to 74 year-olds in rural America. In contrast, there are 6.8 million 55 to 64 yearolds and 7.5 million 45 to 54 year-olds in the Baby Boom cohorts. Although mortality will modestly diminish these numbers, most will celebrate their 65th birthday in rural America. As this group ages in place, the number and proportion of seniors will grow. Age-specific net migration to rural America is also contributing to the aging of the rural population. Rural areas have lost young adults through net out-migration in each of the last three decades (Figure 12). Between 2000 and 2010, the rate of net migration loss among those in their late 20s was -171 per 1000, indicating that there were 17.1% fewer residents ages 25 to 29 than would have been expected had no migration occurred. Rural areas sustained similar migration losses in the 1980s and 1990s. Prior research suggests migration losses from this age group were even greater in the 1950s and 1960s. 33 In contrast, rural areas gained migrants in their 30s and 40s in the two most recent decades. Migration gains were even greater among those over the age of 50, with the gains generally accelerating in the 1990s and 2000s. Thus for decades, migration drained young adults from 33. JOHNSON, supra note 11, at 17 18, 24 29; Johnson et al., supra note 6, at 2 3; See Kenneth M. Johnson & Glenn V. Fuguitt, Continuity and Change in Rural Migration Patterns , 65 RURAL SOC. 27, (2000) (examining migration patterns between 1950 and 1995).
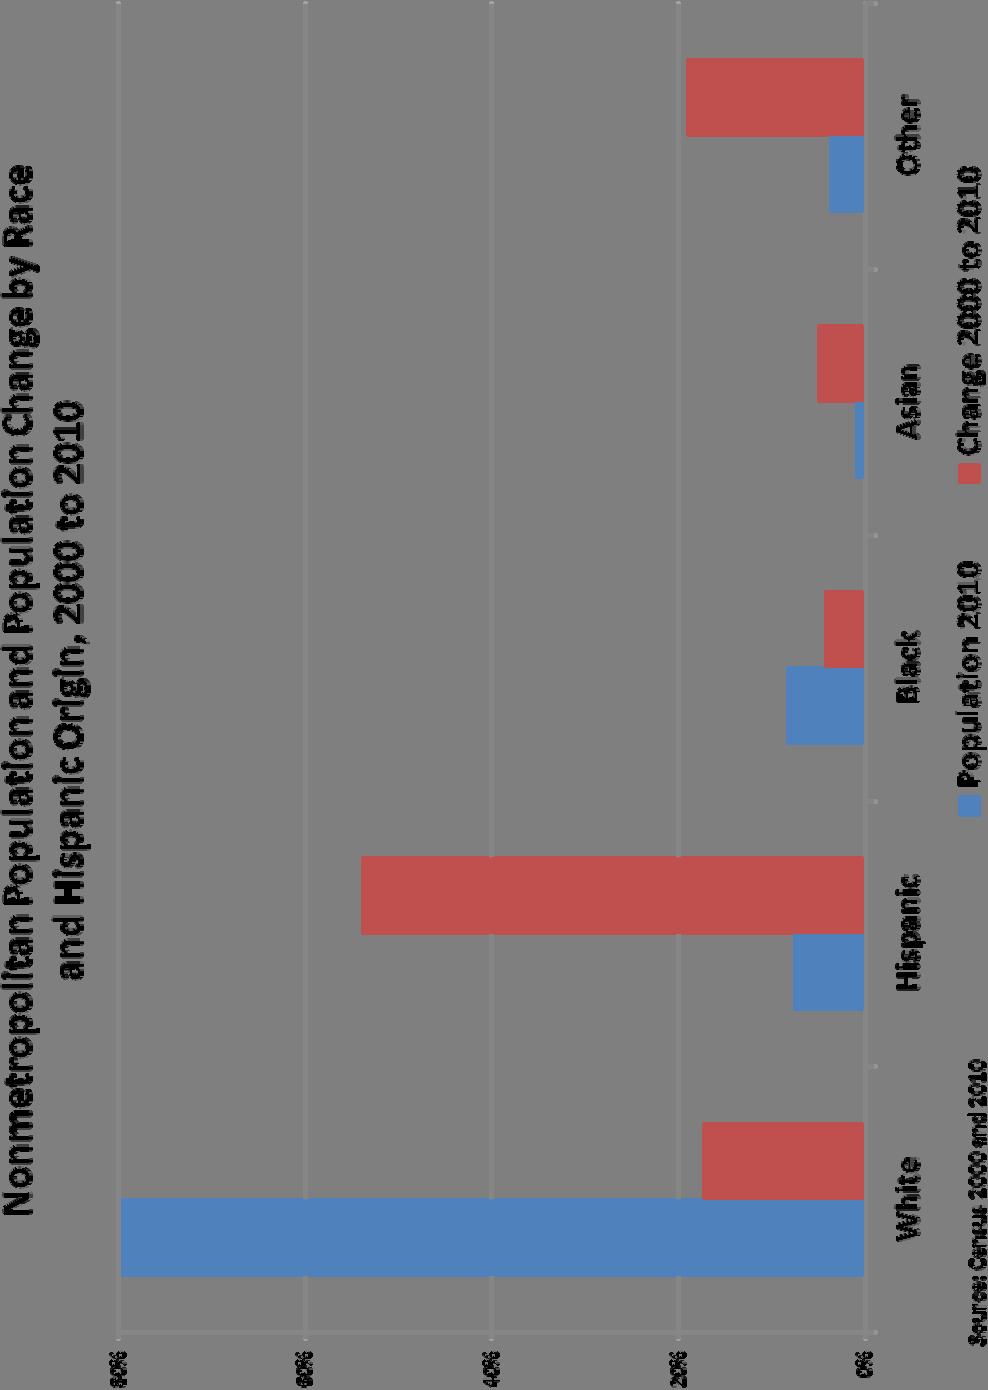
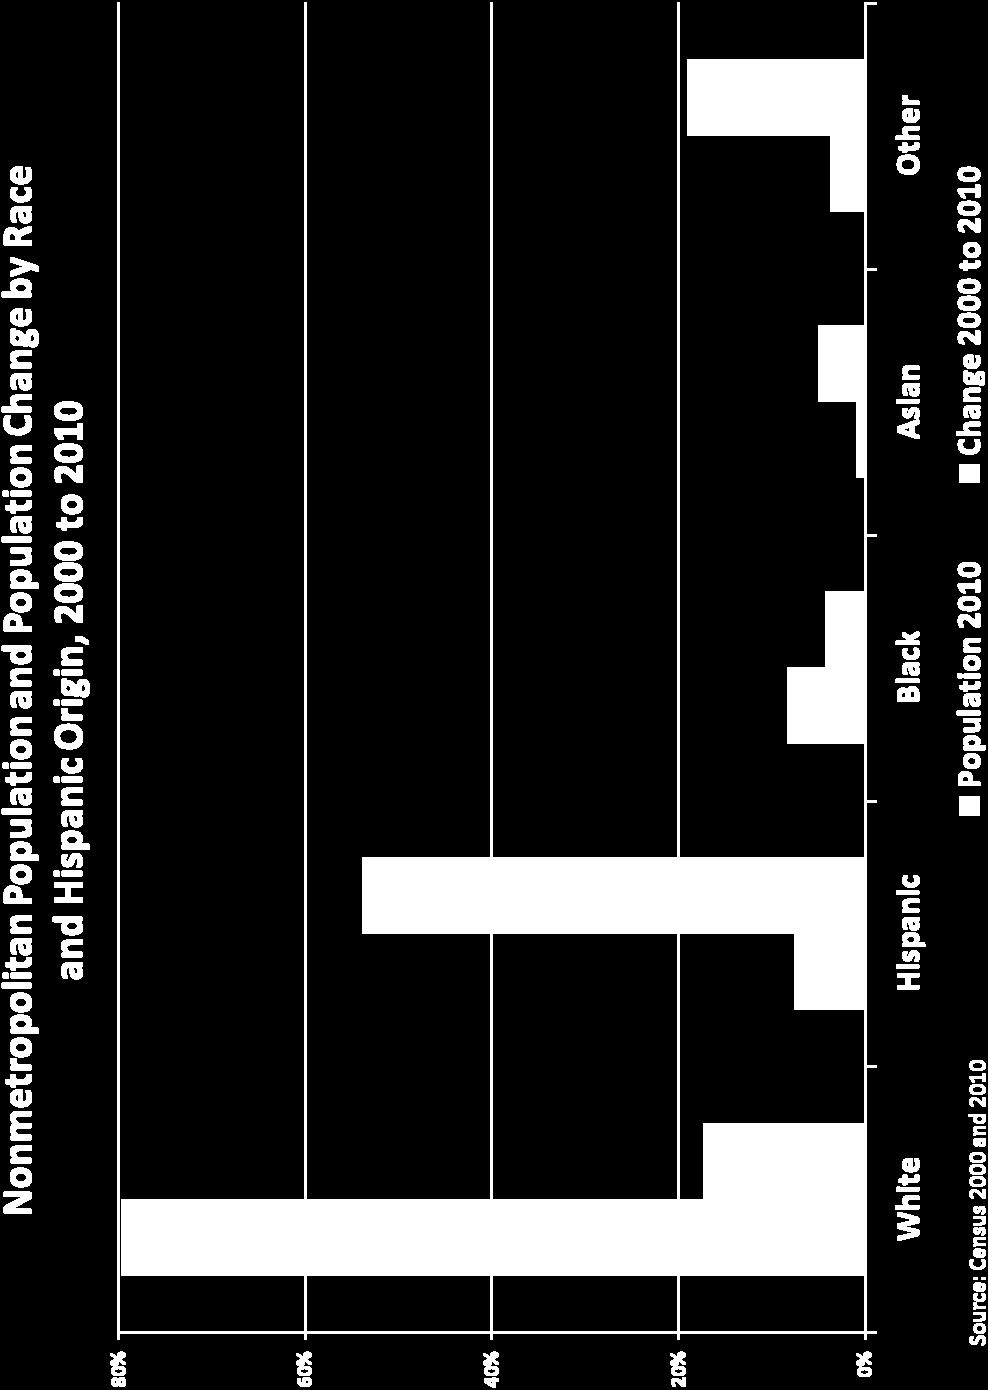
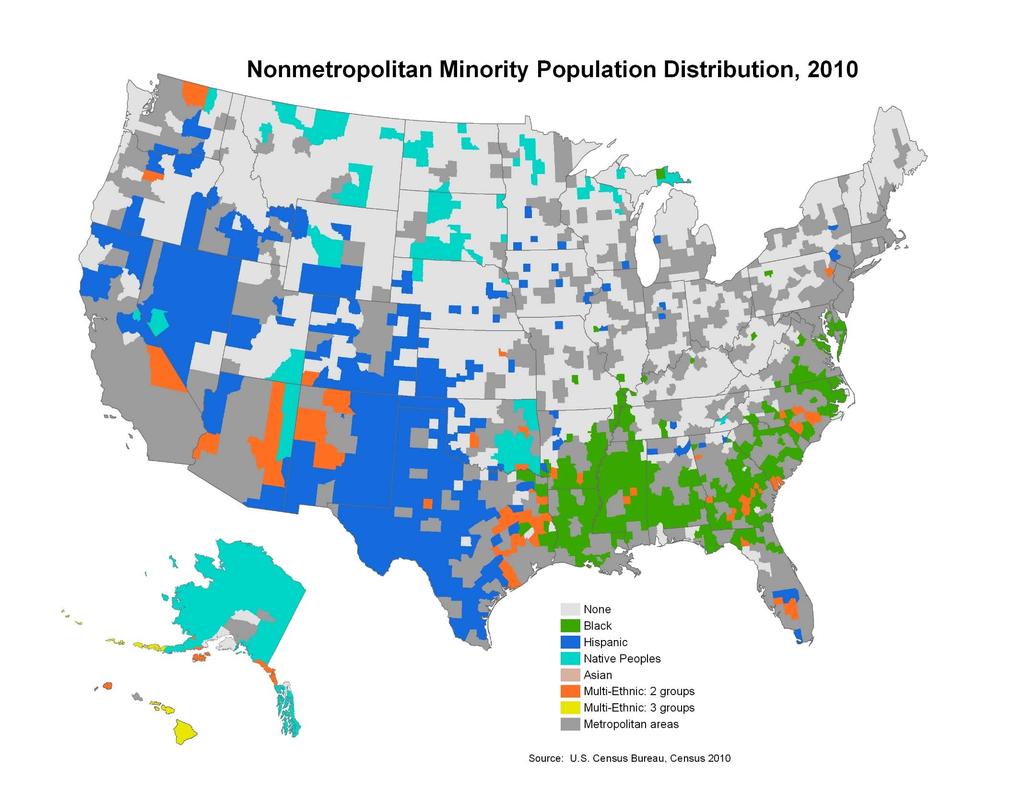
17 2013] Demographic Trends in Nonmetropolitan America 45 rural areas, while the older population aged in place and grew through migration. The combined effects of these migration trends accelerated the aging of the rural population. The demographic implications of the age structure shifts underway in the rural America are already evident in the steady decline in the number of rural births and the rising number of deaths. However, age structure shifts are not the only factor changing the rural demographic structure; the population is also becoming more racially diverse. The Growing Minority Population is Contributing to Rural Demographic Change Any analysis of recent demographic trends in rural America must also be cognizant of the growing impact that minority populations are having on rural population change. Between 2000 and 2010, minorities accounted for 83% of the nonmetropolitan population gain, though they represented just 21% of the rural population. Overall, the nonmetropolitan minority population grew by 1.8 million (21.3%) compared to a gain of just 382,000 (.95%) among the much larger non-hispanic white population (Figure 13). Thus, while nonmetropolitan America remains less diverse than urban America (which is 36% minority), minority growth now accounts for most rural population increase, just as it does in urban areas. There is considerable geographic variation in the levels of diversity in rural America (Figure 14). Large concentrations of African-Americans remain in the rural Southeast despite the migration of millions of blacks from the South during the first two-thirds of the 20th century. This outflow of blacks from the South has ended and the region is now seeing an influx of black migrants, though most are going to metropolitan areas. 34 Longstanding Hispanic population concentrations in the Southwest indicate that there have been Hispanic rural residents for centuries. Recent research also documents the spread of Hispanics from these historical areas into rural areas of the Southeast and Midwest. 35 Though small in overall numbers, native peoples are an important part of many rural communities in the Great Plains as well as in parts of the West. There are scattered areas in the Southwest where native peoples and Hispanics are found in the same counties, as well as growing areas where blacks and Hispanics reside in the 34. FREY, supra note 22, at WILLIAM KANDEL & JOHN CROMARTIE, USDA ERS, NEW PATTERNS OF HISPANIC SETTLEMENT IN RURAL AMERICA 1, 1 (2004); Kenneth M. Johnson & Daniel T. Lichter, Natural Increase: A New Source of Population Growth in Emerging Hispanic Destinations in the United States, 34 POPULATION & DEV. REV. 327, 342 (2008).
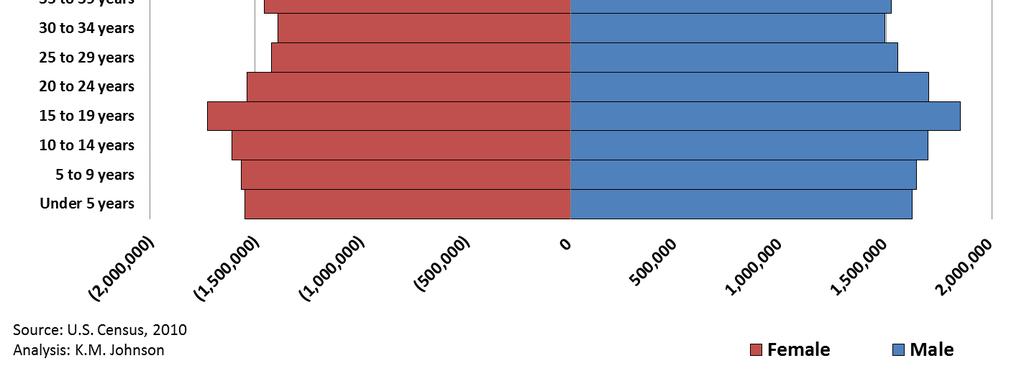
18 46 VERMONT JOURNAL OF ENVIRONMENTAL LAW [Vol. 15 same county in the Southeast and East Texas. But, in general, the growing diversity in rural America is on a modest scale with two or, at most, three racial groups residing in the same rural county. There are also large areas of nonmetropolitan America that remain overwhelmingly non-hispanic white. The driving force behind this substantial minority population gain in nonmetropolitan areas is the sustained growth of the Hispanic population. Hispanics remain spatially concentrated in urban areas. However, Hispanics both native and foreign-born are rapidly diffusing spatially, especially into smaller metropolitan cities 36 and small towns and rural areas in the South and Midwest. 37 Hispanics account for a rapidly accelerating share of rural population growth over the past two decades. During the 1990s, Hispanics accounted for 25% of the entire rural population gain, though they represented only 3.5% of the rural population in Between 2000 and 2010, Hispanics accounted for 54% of the rural gain, though they represented only 5.4% of the population in By 2010, the Hispanic population of rural America stood at 3.8 million, a gain of 45% from Children are in the vanguard of this growing diversity in rural America. Nearly 28% of the nonmetropolitan population under the age of 18 in 2010 was minority compared to 18% of the adult population (Figure 15). Hispanics represent the largest share of this minority nonmetropolitan youth population, which is more than 12% of all rural children. 38 The conventional wisdom is that growing child diversity is largely a big-city phenomenon. However, minority child gains were particularly important in rural areas, where the overall child population actually declined by nearly 900,000 (-10%) between 2000 and This decline occurred because there were 940,000 (-10%) fewer non-hispanic white children in rural areas, and the black child population also declined (-11.6 %). The overall loss of children was cushioned somewhat by a rural Hispanic child population gain of 434,000 (45.1%). The significant loss of white children coupled with a growing Hispanic child population accelerated the diversification of the rural child population AUDREY SINGER, BROOKINGS INST., THE RISE OF NEW IMMIGRANT GATEWAYS 1, 9 (2004). 37. See Daniel T. Lichter & Kenneth M. Johnson, supra note 26, at 121, 127 (examining geographic settlement trends among Hispanic immigrants). 38. See generally Kenneth M. Johnson & Daniel T. Lichter, Growing Diversity Among America s Children and Youth: Spatial and Temporal Dimensions, 36 POPULATION & DEV. REV. 151, 162 (2010) (explaining how the Hispanic youth population has grown). 39. Johnson & Lichter, supra note 35, at 335.
19 2013] Demographic Trends in Nonmetropolitan America 47 CONCLUSIONS AND IMPLICATIONS This research contributes new information delineating the rapidity and geographic scale at which demographic change is occurring in nonmetropolitan America. Rural areas are being buffeted by economic, social, and governmental transformations from far beyond their borders. These structural transformations are reflected in the demographic trends playing out across the vast rural landscape in the first decade of the twentyfirst century. Such demographic trends have important implications for land use and the environment, as well as for the legal and policy frameworks that govern rural areas. Demography may not be destiny, but rural scholars, practitioners, and policy-makers ignore it at their peril. In the first decade of the twenty-first century, rural population gains were considerably smaller than they had been during the rural rebound of the 1990s. Nonmetropolitan areas grew by just 2.2 million people between 2000 and 2010 a gain barely half as great as the 4.1 million person gain of the 1990s. Migration contributed far less to the growth of rural America in the first decade of the twenty-first century than it had in the last decade of the twentieth. It did continue to account for the majority of the population gain in rural counties adjacent to metropolitan areas as well as in fastgrowing recreational and retirement counties. But, even here, population gains were considerably smaller than they had been during the 1990s, because migration gains diminished. Natural increase accounted for more than half of the rural population gain between 2000 and 2010, far more than it did in the 1990s. It was especially important in remote rural areas, including those dependent on farming. In contrast, migration contributed little to the growth of these non-adjacent counties. In many rural areas, natural decrease (when deaths exceed births) is now on the rise. Natural decrease is the eventual demographic consequence of the protracted outmigration of generations of young adults from rural areas. The analysis also emphasizes the growing importance of minorities to the demographic future of rural America. The minority population represents just 21% of the rural population, but minorities produce nearly 83% of the rural population increase between 2000 and Hispanics, in particular, represent a new source of demographic vigor in many parts of rural America, accounting for more than half of the entire rural population gain between 2000 and Young people are in the vanguard of rural America s new diversity because the minority child population is growing and because there was an absolute decline in the non-hispanic white youth population. Rural America is also aging. It is already considerably older than urban America, and this aging will accelerate in the near future. The primary
20 48 VERMONT JOURNAL OF ENVIRONMENTAL LAW [Vol. 15 driver of it is aging in place among those currently residing in rural America. This is supplemented by differential age-specific migration, which has produced a sustained outflow of younger adults from rural America and a modest net inflow of older adults into it. The aging of the Baby Boom will further swell the ranks of older adults in rural America. These demographic changes have important policy implications. First, as rural America becomes more racially and ethnically diverse, rural institutions that serve young people such as education and health care will be the first to feel the impact. Such institutions are among the most expensive for local governments. Financial problems are not the only challenges rural communities face in dealing with diversity. Minorities are transforming the social fabric of many small towns, raising important policy questions (e.g., schooling, political participation, racial tensions, etc.) about their successful incorporation into American society. 40 Second, age structure changes have important implications for policy-makers as well as for rural business, service, and non-profit communities. Rural America s youngest and oldest residents are big consumers of government services such as education and health care. In contrast, the working age population provides the human capital and skilled labor force needed to fuel economic growth and provides much of the consumer base for goods and services. Thus, impending changes in the rural age structure will reverberate through the region s government, health care, and economic sectors. Policymakers must understand the varied patterns of demographic change in rural communities and design policies that are comprehensive enough to address the multi-faceted challenges these communities face. Population growth is slowing in rural America, but it is doing so at a highly differential rate. In remote rural agricultural areas, the population slowdown has been profound. In hundreds of these counties, more people are now dying than being born, and young adults continue to leave as they have for decades. Here, rural policy must ameliorate the adverse impacts of a diminishing population on the provision of critical services and support programs, as well as provide access to the resources (education, internet, capital, and expertise) needed to expand the local infrastructure and enhance future development opportunities. In fast growing rural counties, policies and expertise are needed to manage growth and development. Coping with a rapid influx of people and businesses is a serious challenge that many rural governments are not fully prepared to meet. A population surge accelerates the demand for new 40. Charles Hirschman & Douglas S. Massey, Places and Peoples: The New American Mosaic, in NEW FACES IN NEW PLACES: THE CHANGING GEOGRAPHY OF AMERICAN IMMIGRATION 1, 11 (Douglas S. Massey ed., 2008).
21 2013] Demographic Trends in Nonmetropolitan America 49 schools, roads, sewers, emergency services, and the myriad of other things required to support a growing population. Yet, the substantial upfront cost of improvements often exceeds the short-term revenue gains they provide, especially during a major recession that is stretching limited resources even thinner. When this is combined with declines in intergovernmental revenues due to devolution, many rural governments face serious risks of fiscal stress. 41 To plan for the future, local governments need the staff, training, legal framework, and resources to produce and enforce plans that simultaneously allow growth and protect the environment, public access, open space, and farmland. Yet, rural local governments, already stretched thin by the demands of a growing population and short of revenue and expertise, are hard-pressed to develop such multi-dimensional plans. Also, the need for rural governments to cooperate at a regional level is often at odds with the fierce local independence that characterizes many rural communities. 42 Selective population deconcentration has significant environmental implications as well. In agricultural areas near sprawling metropolitan centers, development can consume thousands of acres of prime farmland, quickly making farmers a dwindling minority despite their centrality to the economy, character, and appeal of the area. Development also fragments the remaining agricultural land, making it difficult for farmers to operate efficiently. In addition, development pushes up land prices, making it difficult for new farmers to get started and for older farmers to pass on their farm to the next generation. In some agricultural areas, family farms are being replaced by large-scale meat, poultry, and dairy processors who create jobs but generate enormous amounts of concentrated wastes, which produce serious environmental hazards. Rural recreational areas endowed with natural resources including lakes, rivers, forests, and scenic views are of concern as well because they contain many environmentally sensitive areas. Population growth puts additional pressure on riparian and environmentally sensitive areas. Growing population density along the forest edge also results in a greater inter-mix of forests and people, increasing the risk of forest fires, which complicates fire suppression and makes management of the increasingly fragmented forests more challenging Kenneth M. Johnson et al., Local Government Fiscal Burden in Nonmetropolitan America, 60 RURAL SOC. 381, 381 (1995). 42. E.g., Michele Dillon, Stretching Ties: Social Capital in the Rebranding of Coos County, New Hampshire, 27 CARSEY INST. 2, 3 (2011) (demonstrating such a struggle in Coos County, NH). 43. Miranda H. Mockrin et al., Spatial and Temporal Residential Density Patterns from 1940 to 2000 in and Around the Northern Forest of New England, 34 POPULATION AND ENV T 400, 402
22 50 VERMONT JOURNAL OF ENVIRONMENTAL LAW [Vol. 15 As is critical to any effort to address the policy needs of rural America deriving from the demographic change underway, there is a clear recognition that policy developed to address the needs of nonmetropolitan areas must be cognizant of the unique demographic, social, economic, geographic, and racial/ethnic diversity of the vast rural landscape. Policies appropriate to traditional agricultural communities may not work well in fast-growing recreational communities or those just beyond the urban edge. Though the Great Recession has dampened growth in such areas recently, it may well accelerate again as the recession wanes. In a similar vein, policies proposed to address the needs of America s 100 largest metropolitan areas may not produce similar results in rural areas where distances are greater, isolation is common, and agglomeration advantages are fewer and further between. Comprehensive policies fully cognizant of the special needs of rural communities and informed by input from local rural leaders may serve to mitigate the demographic, economic, and spatial challenges that face many rural communities. Improving the opportunities, accessibility, and viability of rural areas is critical both to their 51 million residents and to the larger nation that depends on the contributions rural America makes to the material, environmental, and social well-being of the nation. (2013); See also Volker C. Radeloff et al., Human Demographic Trends and Landscape Level Forest Management in the Northwest Wisconsin Pine Barrens, 47 FOREST SCI. 229, 238 (2001) (stating that housing density along the southern Pine Barrens may make forest management more challenging).

23 Nonmetropolitan and Metropolitan Counties Figure 1.
24 Figure 2.
25 Figure 3.
26 Figure 4.
27 350,000 Demographic Change in Nonmetropolitan Counties, 2000 to to to to to , , ,000 Average Annual Change 150, ,000 50, , ,000 Source: US Census Bureau, FSCPE Analysis: K.M. Johnson Population Change Natural Increase Net Migration Figure 5.
28 Demographic Change in New England, % 6.0% 4.0% 2.0% 0.0% 2.0% 4.0% Connecticut Rhode Island Massachusetts New Hampshire Maine Vermont Source: Census Bureau, FSCPE Population Change Natural Increase Net Migration Figure 6.
29 Figure 7.
30 Figure 8.
31 Figure 9.
32 Figure 10.
33 Figure 11.
34 Figure 12.
35 Figure 13.
36 Figure 14.


37 Nonmetropolitan Population by Race/Hispanic Origin, 2010 Children Adults Source: U.S. Census 2010 Figure 15.
Recent Demographic Trends in Nonmetropolitan America: First Evidence from the 2010 Census Executive Summary
 Recent Demographic Trends in Nonmetropolitan America: First Evidence from the 2010 Census Executive Summary Kenneth M. Johnson Department of Sociology and Carsey Institute University of New Hampshire This
Extended Abstract. The Demographic Components of Growth and Diversity in New Hispanic Destinations
 Extended Abstract The Demographic Components of Growth and Diversity in New Hispanic Destinations Daniel T. Lichter Departments of Policy Analysis & Management and Sociology Cornell University Kenneth
Center for Demography and Ecology
 Center for Demography and Ecology University of Wisconsin-Madison Recent Trends in Nonmetropolitan Migration: Toward a New Turnaround? Glenn V. Fuguitt and Calvin L. Beale CDE Working Paper No. 95-07 RECENT
The Changing Faces of New England. Increasing Spatial and Racial Diversity
 Reports on New England The Changing Faces of New England Increasing Spatial and Racial Diversity Kenneth M. Johnson Building Knowledge for Families and Communities Reports on NEW ENGLAND Volume 1, Number
Rural America At A Glance
 Rural America At A Glance 7 Edition Between July 5 and July 6, the population of nonmetro America grew.6 percent. Net domestic migration from metro areas accounted for nearly half of this growth. Gains
CARSEY INSTITUTE. Children are in the vanguard of America s. The Increasing Diversity of America s Youth. Children Lead the Way to a New Era
 CARSEY INSTITUTE Building Knowledge for Families and Communities National Issue Brief #71 Spring 2014 The Increasing Diversity of America s Youth Children Lead the Way to a New Era Kenneth M. Johnson,
The Changing Faces of New Hampshire. Recent Demographic Trends in the Granite State
 Reports on New England The Changing Faces of New Hampshire Recent Demographic Trends in the Granite State Kenneth M. Johnson Building Knowledge for Families and Communities Reports on NEW ENGLAND Volume
8AMBER WAVES VOLUME 2 ISSUE 3
 8AMBER WAVES VOLUME 2 ISSUE 3 F E A T U R E William Kandel, USDA/ERS ECONOMIC RESEARCH SERVICE/USDA Rural s Employment and Residential Trends William Kandel wkandel@ers.usda.gov Constance Newman cnewman@ers.usda.gov
Carsey. recent u.s. Census Bureau projections indicate that by. The Changing Faces of america s Children and youth
 Carsey Issue BrIef No. 15 Spring 2010 i n s t i t u t e The Changing Faces of america s Children and youth Kenneth M. Johnson and d aniel t. l i C hter recent u.s. Census Bureau projections indicate that
Baby Boom Migration Tilts Toward Rural America
 Baby Boom Migration Tilts Toward Rural America VOLUME 7 ISSUE 3 John Cromartie jbc@ers.usda.gov Peter Nelson Middlebury College 16 AMBER WAVES The size and direction of migration patterns vary considerably
PRESENT TRENDS IN POPULATION DISTRIBUTION
 PRESENT TRENDS IN POPULATION DISTRIBUTION Conrad Taeuber Associate Director, Bureau of the Census U.S. Department of Commerce Our population has recently crossed the 200 million mark, and we are currently
Center for Demography and Ecology
 Center for Demography and Ecology University of Wisconsin-Madison Recent Population Trends in Nonmetropolitan Cities and Villages: From the Turnaround, Through Reversal to the Rebound Glenn V. Fuguitt
Growth in the Foreign-Born Workforce and Employment of the Native Born
 Report August 10, 2006 Growth in the Foreign-Born Workforce and Employment of the Native Born Rakesh Kochhar Associate Director for Research, Pew Hispanic Center Rapid increases in the foreign-born population
Changing Times, Changing Enrollments: How Recent Demographic Trends are Affecting Enrollments in Portland Public Schools
 Portland State University PDXScholar School District Enrollment Forecast Reports Population Research Center 7-1-2000 Changing Times, Changing Enrollments: How Recent Demographic Trends are Affecting Enrollments
Hispanic Health Insurance Rates Differ between Established and New Hispanic Destinations
 Population Trends in Post-Recession Rural America A Publication Series of the W3001 Research Project Hispanic Health Insurance Rates Differ between and New Hispanic s Brief No. 02-16 August 2016 Shannon
Chapter 7. Migration
 Chapter 7 Migration Chapter 7 Migration Americans have traditionally been highly higher levels of educational attainment than Figure 7-1. mobile, with nearly 1 in 7 people changing residence each year.
New Hampshire is an increasingly mobile state, with
 NEW ENGLAND C A R S EISSUE Y I N SBRIEF T I T UNO. T E 9 1 FALL 2008 CARSEYI N S T I T U T E Many New Voters Make the Granite State One to Watch in November KENNETH M. JOHNSON, DANTE SCAL A, AND ANDREW
People. Population size and growth
 The social report monitors outcomes for the New Zealand population. This section provides background information on who those people are, and provides a context for the indicators that follow. People Population
Population Outlook for the Portland-Vancouver Metropolitan Region
 Portland State University PDXScholar Institute of Portland Metropolitan Studies Publications Institute of Portland Metropolitan Studies 2007 Population Outlook for the Portland-Vancouver Metropolitan Region
Planning for the Silver Tsunami:
 Planning for the Silver Tsunami: The Shifting Age Profile of the Commonwealth and Its Implications for Workforce Development H e n r y Renski A NEW DEMOGRAPHIC MODEL PROJECTS A CONTINUING, LONG-TERM SLOWING
National Population Growth Declines as Domestic Migration Flows Rise
 National Population Growth Declines as Domestic Migration Flows Rise By William H. Frey U.S. population trends are showing something of a dual personality when viewed from the perspective of the nation
Summary of the U.S. Census Bureau s 2015 State-Level Population Estimate for Massachusetts
 Summary of the U.S. Census Bureau s 2015 State-Level Population Estimate for Massachusetts Prepared by: Population Estimates Program For Release December 22, 2015 On December 22, 2015, the U.S. Census
The Contributions of Past Immigration Flows to Regional Aging in the United States
 The Contributions of Past Immigration Flows to Regional Aging in the United States James Raymer 1 Australian Demographic and Social Research Institute, Australian National University Andrei Rogers 2 Population
Baby Boom Migration and Its Impact on Rural America
 United States Department of Agriculture Economic Research Service Economic Research Report Number 79 August 2009 Baby Boom Migration and Its Impact on Rural America John Cromartie and Peter Nelson Visit
3Demographic Drivers. The State of the Nation s Housing 2007
 3Demographic Drivers The demographic underpinnings of long-run housing demand remain solid. Net household growth should climb from an average 1.26 million annual pace in 1995 25 to 1.46 million in 25 215.
CHOICES The magazine of food, farm and resource issues
 CHOICES The magazine of food, farm and resource issues 4th Quarter 2003 A publication of the American Agricultural Economics Association Rural Area Brain Drain: Is It a Reality? By Georgeanne Artz Brain
What's Driving the Decline in U.S. Population Growth?
 Population Reference Bureau Inform. Empower. Advance. What's Driving the Decline in U.S. Population Growth? Mark Mather (May 2012) Between 2010 and 2011, the U.S. population increased by 0.7 percent, after
Meanwhile, the foreign-born population accounted for the remaining 39 percent of the decline in household growth in
 3 Demographic Drivers Since the Great Recession, fewer young adults are forming new households and fewer immigrants are coming to the United States. As a result, the pace of household growth is unusually
STRENGTHENING RURAL CANADA: Fewer & Older: The Coming Population and Demographic Challenges in Rural Newfoundland & Labrador
 STRENGTHENING RURAL CANADA: Fewer & Older: The Coming Population and Demographic Challenges in Rural Newfoundland & Labrador An Executive Summary 1 This paper has been prepared for the Strengthening Rural
Summary of the U.S. Census Bureau s 2018 State-Level Population Estimate for Massachusetts
 Summary of the U.S. Census Bureau s 2018 State-Level Population Estimate for Massachusetts Prepared by: Population Estimates Program For Release December 19, 2018 On December 19, 2018, the U.S. Census
STRENGTHENING RURAL CANADA: Fewer & Older: Population and Demographic Crossroads in Rural Saskatchewan. An Executive Summary
 STRENGTHENING RURAL CANADA: Fewer & Older: Population and Demographic Crossroads in Rural Saskatchewan An Executive Summary This paper has been prepared for the Strengthening Rural Canada initiative by:
The movement of people into and out of a state can have important
 Migration in the Tenth District: Long-Term Trends and Current Developments By William R. Keeton and Geoffrey B. Newton The movement of people into and out of a state can have important implications for
The Graying of the Empire State: Parts of NY Grow Older Faster
 Research Bulletin No. 7.2 August 2012 EMPIRE The Graying of the Empire State: Parts of NY Grow Older Faster By E.J. McMahon and Robert Scardamalia CENTER FOR NEW YORK STATE POLICY A project of the Manhattan
Post-Migration Commuting Behavior Among Urban to Rural Migrants in England and Wales. Tony Champion, Mike Coombes, and David L. Brown INTRODUCTION
 Post-Migration Commuting Behavior Among Urban to Rural Migrants in England and Wales By Tony Champion, Mike Coombes, and David L. Brown INTRODUCTION England and Wales have experienced continuous counterurbanization
Chapter 4 North America
 Chapter 4 North America Identifying the Boundaries Figure 4.1 The geographic center of North America is located near Rugby, North Dakota. Notice the flags of Mexico, Canada, and the United States. Source:
AMBER WAVES VOLUME 2 ISSUE 5
 VOLUME 2 ISSUE 5 20 Eyewire Anatomy of Nonmetro High-Poverty Areas Common in Plight, Distinctive in Nature Calvin L. Beale cbeale@ers.usda.gov FEBRUARY 2004 21 The 1990s saw growing U.S. prosperity, ending
REPORTS ON RURAL AMERICA. Demographic Trends in Rural and Small Town America KENNETH JOHNSON
 REPORTS ON RURAL AMERICA Demographic Trends in Rural and Small Town America KENNETH JOHNSON Building Knowledge for Rural America s Families and Communities in the 21st Century REPORTS ON RURAL AMERICA
Post-Secondary Education, Training and Labour September Profile of the New Brunswick Labour Force
 Post-Secondary Education, Training and Labour September 2018 Profile of the New Brunswick Labour Force Contents Population Trends... 2 Key Labour Force Statistics... 5 New Brunswick Overview... 5 Sub-Regional
REGIONAL. San Joaquin County Population Projection
 Lodi 12 EBERHARDT SCHOOL OF BUSINESS Business Forecasting Center in partnership with San Joaquin Council of Governments 99 26 5 205 Tracy 4 Lathrop Stockton 120 Manteca Ripon Escalon REGIONAL analyst june
People. Population size and growth. Components of population change
 The social report monitors outcomes for the New Zealand population. This section contains background information on the size and characteristics of the population to provide a context for the indicators
Straddling the Great Divide: Migration and Population Change in the Great Plains and Rocky Mountains
 Online Journal of Rural Research & Policy Volume 3 Issue 3 Straddling the Great Divide: Migration and Population Change in the Great Plains and Rocky Mountains Article 1 2008 Straddling the Great Divide:
STRENGTHENING RURAL CANADA: Fewer & Older: The Coming Demographic Crisis in Rural Ontario
 STRENGTHENING RURAL CANADA: Fewer & Older: The Coming Demographic Crisis in Rural Ontario An Executive Summary 1 This paper has been prepared for the Strengthening Rural Canada initiative by: Dr. Bakhtiar
Understanding Chronically Poor Places: Encouraging More Voice and Commitment to Change
 Understanding Chronically Poor Places: Encouraging More Voice and Commitment to Change What I will do today Briefly review trends in rural America and present a typology of rural communities Look more
The Brookings Institution Metropolitan Policy Program Robert Puentes, Fellow
 The Brookings Institution Metropolitan Policy Program Robert Puentes, Fellow A Review of New Urban Demographics and Impacts on Housing National Multi Housing Council Research Forum March 26, 2007 St. Louis,
Shyam S. Bhatia and Kazimierz J. Zaniewski. Department of Geography. University of Wisconsin - Oshkosh
 POPULATION CHANGE IN WISCONSIN, 1980-1990 Shyam S. Bhatia and Kazimierz J. Zaniewski Department of Geography University of Wisconsin - Oshkosh During the 1980's Wisconsin experienced a slow growth in population.
Population Dynamics in the Greater Golden Horseshoe Millennials vs. Baby Boomers
 Population Dynamics in the Greater Golden Horseshoe Millennials vs. Baby Boomers November 19, 2015 Population Dynamics in the Greater Golden Horseshoe Millennials vs. Baby Boomers Campus Location The opinions
Dynamic Diversity: Projected Changes in U.S. Race and Ethnic Composition 1995 to December 1999
 Dynamic Diversity: Projected Changes in U.S. Race and Ethnic Composition 1995 to 2050 December 1999 DYNAMIC DIVERSITY: PROJECTED CHANGES IN U.S. RACE AND ETHNIC COMPOSITION 1995 TO 2050 The Minority Business
The Brookings Institution Metropolitan Policy Program Robert Puentes, Fellow
 The Brookings Institution Metropolitan Policy Program Robert Puentes, Fellow Caution: Challenges Ahead A Review of New Urban Demographics and Impacts on Transportation Eno Foundation Forum on the Future
OREGON OUTLOOK Sponsored by Population Research Center Portland Multnomah Progress Board Oregon Progress Board
 REGN TATE ERIE APRIL 003 PPULATIN REEARCH CENTER REGN s MAJR PPULATIN TREND This report reviews Population Growth Household Trends Household ize Families and Non-families Implications Future Reports Metropolitan
The State of Rural Minnesota, 2019
 P.O. Box 3185 Mankato, MN 56002-3185 (507)934-7700 www.ruralmn.org The State of Rural Minnesota, 2019 January 2019 By Kelly Asche, Research Associate Each year, the Center for Rural Policy and Development
destination Philadelphia Tracking the City's Migration Trends executive summary
 destination Philadelphia October 6, 2010 executive summary An analysis of migration data from the Internal Revenue Service shows that the number of people moving into the city of Philadelphia has increased
MIGRATION STATISTICS AND BRAIN DRAIN/GAIN
 MIGRATION STATISTICS AND BRAIN DRAIN/GAIN Nebraska State Data Center 25th Annual Data Users Conference 2:15 to 3:15 p.m., August 19, 2014 David Drozd Randy Cantrell UNO Center for Public Affairs Research
2010 CENSUS POPULATION REAPPORTIONMENT DATA
 Southern Tier East Census Monograph Series Report 11-1 January 2011 2010 CENSUS POPULATION REAPPORTIONMENT DATA The United States Constitution, Article 1, Section 2, requires a decennial census for the
Regional Trends in the Domestic Migration of Minnesota s Young People
 HOUSE RESEARCH & STATE DEMOGRAPHIC CENTER A Changing Minnesota Sean Williams, House Research Susan Brower, Minnesota State Demographic Center September 2018 Regional Trends in the Domestic Migration of
Components of Population Change by State
 IOWA POPULATION REPORTS Components of 2000-2009 Population Change by State April 2010 Liesl Eathington Department of Economics Iowa State University Iowa s Rate of Population Growth Ranks 43rd Among All
Methodology and Assumptions for the Mapping America s Futures Project
 UNDERSTANDING AND EXPLORING DEMOGRAPHIC CHANGE MAPPING AMERICA S FUTURES, BRIEF 5 Methodology and Assumptions for the Mapping America s Futures Project Kaitlin Franks Hildner, Austin Nichols, and Steven
CARSEY. The Great Recession has hurt the economic well-being of. Southeastern Kentuckians Remain Optimistic Through Great Recession
 CARSEY ISSUE BRIEF NO. 36 SUMMER 2011 I N S T I T U T E Southeastern Kentuckians Remain Optimistic Through Great Recession Growing Concerns about Sprawl, Housing, and Recreational Opportunities J E S S
Racial integration between black and white people is at highest level for a century, new U.S. census reveals
 Thursday, Dec 16 2010 Racial integration between black and white people is at highest level for a century, new U.S. census reveals By Daily Mail Reporter Last updated at 1:11 PM on 16th December 2010 But
1. A Regional Snapshot
 SMARTGROWTH WORKSHOP, 29 MAY 2002 Recent developments in population movement and growth in the Western Bay of Plenty Professor Richard Bedford Deputy Vice-Chancellor (Research) and Convenor, Migration
2001 Census: analysis series
 Catalogue no. 96F0030XIE2001006 2001 Census: analysis series Profile of the Canadian population by mobility status: Canada, a nation on the move This document provides detailed analysis of the 2001 Census
Hispanic Population Growth and Rural Income Inequality
 Hispanic Population and Rural Income Inequality Emilio Parrado, Department of Sociology, Duke University William Kandel, Economic Research Service, U.S. Department of Agriculture September 2006 Draft version:
Low-Skill Jobs A Shrinking Share of the Rural Economy
 Low-Skill Jobs A Shrinking Share of the Rural Economy 38 Robert Gibbs rgibbs@ers.usda.gov Lorin Kusmin lkusmin@ers.usda.gov John Cromartie jbc@ers.usda.gov A signature feature of the 20th-century U.S.
MIGRATION CHALLENGES
 MIGRATION CHALLENGES Trends in People s Movement to and from the Milwaukee Area and Wisconsin Illuminate Important Issues By John D. Johnson and Charles Franklin Marquette Law School launched the Lubar
Trends in the Racial Distribution of Wisconsin Poverty, This report is the second in a series of briefings on the results.
 Briefing 2 Trends in the Racial Distribution of Wisconsin Poverty, 1970-2000 Katherine J. Curtis, Heather O Connell This report is the second in a series of briefings on the results of recent research
Town of Niagara-on-the-Lake Official Plan Review Growth Analysis Technical Background Report
 Town of Niagara-on-the-Lake Official Plan Review Growth Analysis Technical Background Report In association with: October 16, 2015 Contents Page Executive Summary... (i) 1. Introduction... 1 2. Population,
The Demography of the Labor Force in Emerging Markets
 The Demography of the Labor Force in Emerging Markets David Lam I. Introduction This paper discusses how demographic changes are affecting the labor force in emerging markets. As will be shown below, the
Human Population Growth Through Time
 Human Population Growth Through Time Current world population: 7.35 Billion (Nov. 2016) http://www.worldometers.info/world-population/ 2012 7 billion 1999 13 years 12 years 1974 1927 1804 13 years 14 years
Abstract. Acknowledgments
 Racial/Ethnic Minorities in Rural Areas: Progress and Stagnation, 1980-90. By Linda L. Swanson (ed.), Rural Economy Division, Economic Research Service, U.S. Department of Agriculture. Agricultural Economic
Demographic Data. Comprehensive Plan
 Comprehensive Plan 2010-2030 4 Demographic Data Population and demographics have changed over the past several decades in the City of Elwood. It is important to incorporate these shifts into the planning
The Changing Face of Labor,
 The Changing Face of Labor, 1983-28 John Schmitt and Kris Warner November 29 Center for Economic and Policy Research 1611 Connecticut Avenue, NW, Suite 4 Washington, D.C. 29 22-293-538 www.cepr.net CEPR
For each of the 50 states, we ask a
 state of states 30 head Spatial Segregation The Stanford Center on Poverty and Inequality By Daniel T. Lichter, Domenico Parisi, and Michael C. Taquino Key findings There is extreme racial segregation
Demographics. Chapter 2 - Table of contents. Environmental Scan 2008
 Environmental Scan 2008 2 Ontario s population, and consequently its labour force, is aging rapidly. The province faces many challenges related to a falling birth rate, an aging population and a large
Headship Rates and Housing Demand
 Headship Rates and Housing Demand Michael Carliner The strength of housing demand in recent years is related to an increase in the rate of net household formations. From March 1990 to March 1996, the average
WORKFORCE ATTRACTION AS A DIMENSION OF REGIONAL COMPETITIVENESS
 RUR AL DE VELOPMENT INSTITUTE WORKFORCE ATTRACTION AS A DIMENSION OF REGIONAL COMPETITIVENESS An Analysis of Migration Across Labour Market Areas June 2017 WORKFORCE ATTRACTION AS A DIMENSION OF REGIONAL
Chapter 1: Objectives
 Chapter 1: Objectives Identify Texas political party activists and government officials to inform participation in the political affairs of the state and its counties, cities, and special districts. Understand
Population Projection Alberta
 Population Projection Alberta 215 241 Solid long term growth expected Alberta s population is expected to expand by about 2.1 million people by the end of the projection period, reaching just over 6.2
BY Rakesh Kochhar FOR RELEASE MARCH 07, 2019 FOR MEDIA OR OTHER INQUIRIES:
 FOR RELEASE MARCH 07, 2019 BY Rakesh Kochhar FOR MEDIA OR OTHER INQUIRIES: Rakesh Kochhar, Senior Researcher Jessica Pumphrey, Communications Associate 202.419.4372 RECOMMENDED CITATION Pew Research Center,
Levels and trends in international migration
 Levels and trends in international migration The number of international migrants worldwide has continued to grow rapidly over the past fifteen years reaching million in 1, up from million in 1, 191 million
Recent Trends in Rural-based Meat Processing
 Recent Trends in Rural-based Meat Processing William Kandel, Economic Research Service, U.S. Department of Agriculture Presented at Immigration Reform: Implications for Farmers, Farm Workers, and Communities
Population change in Louisiana,
 Louisiana State University LSU Digital Commons LSU Agricultural Experiment Station Reports LSU AgCenter 1977 Population change in Louisiana, 1970-1975 Lisandro Perez Follow this and additional works at:
Trends and Changes Affecting Upstate New York. David L. Brown & Robin Blakely-Armitage State of Upstate Conference June 8, 2011
 Trends and Changes Affecting Upstate New York David L. Brown & Robin Blakely-Armitage State of Upstate Conference June 8, 2011 Challenges & Opportunities Change, not stability, is the normal situation
Agricultural Outlook Forum Presented: March 1-2, 2007 U.S. Department of Agriculture
 Agricultural Outlook Forum Presented: March 1-2, 2007 U.S. Department of Agriculture IMMIGRATION REFORM AND AGRICULTURE William Kandel & Ashok Mishra Resource and Rural Economics Division Economic Research
11. Demographic Transition in Rural China:
 11. Demographic Transition in Rural China: A field survey of five provinces Funing Zhong and Jing Xiang Introduction Rural urban migration and labour mobility are major drivers of China s recent economic
In the 1960 Census of the United States, a
 AND CENSUS MIGRATION ESTIMATES 233 A COMPARISON OF THE ESTIMATES OF NET MIGRATION, 1950-60 AND THE CENSUS ESTIMATES, 1955-60 FOR THE UNITED STATES* K. E. VAIDYANATHAN University of Pennsylvania ABSTRACT
Rising immigration levels, coupled with a
 Immigration Drives U.S. Population Growth Part 8 Rising immigration levels, coupled with a declining rate of natural increase (births minus deaths), means that immigration accounts for a larger share of
Chapter One: people & demographics
 Chapter One: people & demographics The composition of Alberta s population is the foundation for its post-secondary enrolment growth. The population s demographic profile determines the pressure points
OUR REGION. Our People
 OUR REGION South Florida is comprised of complex and unique places, people, and opportunities. Sustaining these elements, while providing choices and access regarding employment, housing, and activity,
FUTURES NETWORK WEST MIDLANDS WORKING PAPER 1. Demographic Issues facing the West Midlands
 FUTURES NETWORK WEST MIDLANDS WORKING PAPER 1 Demographic Issues facing the West Midlands February, 2014 1 Preface This paper has been prepared by members of the Futures Network West Midlands a group comprising
Unemployment Rises Sharply Among Latino Immigrants in 2008
 Report February 12, 2009 Unemployment Rises Sharply Among Latino Immigrants in 2008 Rakesh Kochhar Associate Director for Research, Pew Hispanic Center The Pew Hispanic Center is a nonpartisan research
Migration Patterns in The Northern Great Plains
 Migration Patterns in The Northern Great Plains Eugene P. Lewis Economic conditions in this nation and throughout the world are imposing external pressures on the Northern Great Plains Region' through
Demographic and Socioeconomic Change in Appalachia EMERGING PATTERNS OF POPULATION REDISTRIBUTION AND MIGRATION IN APPALACHIA
 Demographic and Socioeconomic Change in Appalachia EMERGING PATTERNS OF POPULATION REDISTRIBUTION AND MIGRATION IN APPALACHIA by Daniel T. Lichter, Jillian Garratt, Mary L. Marshall, and Michael Cardella
Poverty Amid Renewed Affluence: The Poor of New England at Mid-Decade
 Volume 2 Issue 2 Article 3 6-21-1986 Poverty Amid Renewed Affluence: The Poor of New England at Mid-Decade Andrew M. Sum Northeastern University Paul E. Harrington Center for Labor Market Studies William
The Effects of Immigration on Age Structure and Fertility in the United States
 The Effects of Immigration on Age Structure and Fertility in the United States David Pieper Department of Geography University of California, Berkeley davidpieper@berkeley.edu 31 January 2010 I. Introduction
CARSEY INSTITUTE. Immigration is an important source of population. Immigration to Manchester, New Hampshire. History, Trends, and Implications
 CARSEY INSTITUTE Building Knowledge for Families and Communities Regional Issue Brief #39 Spring 2014 Immigration to Manchester, New Hampshire History, Trends, and Implications Sally K. Ward, Justin R.
What Lies Ahead: Population, Household and Employment Forecasts to 2040 April Metropolitan Council Forecasts to 2040
 The Metropolitan Council forecasts population, households and employment for the sevencounty Minneapolis-St. Paul region with a 30-year time horizon. The Council will allocate this regional forecast to
Latino Workers in the Ongoing Recession: 2007 to 2008
 Report December 15, 2008 Latino Workers in the Ongoing Recession: 2007 to 2008 Rakesh Kochhar Associate Director for Research, Pew Hispanic Center The Pew Hispanic Center is a nonpartisan research organization
The Quarterly Review of Economic News & Insight. Economic Currents. Economic Indices for Massachusetts. Population Change, Housing, and Local Finance
 The Quarterly Review of Economic News & Insight summer 2003 Volume six Issue 2 Economic Currents Economic Indices for Massachusetts Population Change, Housing, and Local Finance The Biotech Industry: A
Over the past three decades, the share of middle-skill jobs in the
 The Vanishing Middle: Job Polarization and Workers Response to the Decline in Middle-Skill Jobs By Didem Tüzemen and Jonathan Willis Over the past three decades, the share of middle-skill jobs in the United
Immigration Policy Brief August 2006
 Immigration Policy Brief August 2006 Last updated August 16, 2006 The Growth and Reach of Immigration New Census Bureau Data Underscore Importance of Immigrants in the U.S. Labor Force Introduction: by
PROJECTING DIVERSITY: THE METHODS, RESULTS, ASSUMPTIONS AND LIMITATIONS OF THE U.S. CENSUS BUREAU S POPULATION PROJECTIONS
 PROJECTING DIVERSITY: THE METHODS, RESULTS, ASSUMPTIONS AND LIMITATIONS OF THE U.S. CENSUS BUREAU S POPULATION PROJECTIONS Howard Hogan, U.S. Census Bureau Jennifer M. Ortman, U.S. Census Bureau Sandra