SHAPING THE WORLD. Latin ico. Remittances to
|
|
|
- Coleen Blankenship
- 5 years ago
- Views:
Transcription
1 NUMBERS, FACTS AND TRENDS SHAPING THE WORLD FOR RELEASE November 15, 213 Remittances to Latin America Recover but Not to Mexi ico FOR FURTHER INFORMATION ON THIS REPORT: D Vera Cohn, Senior Writer Ana Gonzalez-Barrera, Research Associate Danielle Cuddington, Intern Contact: Russ Oates RECOMMENDED CITATION: Cohn, D Vera, Ana Gonzalez-Barrera and Danielle Cuddington Remittances to Latin America Recover but Not to Mexico. Washington, D.C. Pew Research Center, November.
2 1 Remittances to Latin America Recover but Not to Mexico About This Report This report examines official flows of remittances, including overall trends from 2 to 213 as well as contributions from the U.S. in 25 and 212, with a particular focus on 17 Spanishspeaking nations in Latin America: Argentina, Bolivia, Chile, Colombia, Costa Rica, Dominican Republic, Ecuador, El Salvador, Guatemala, Honduras, Mexico, Nicaragua, Panama, Paraguay, Peru, Uruguay and Venezuela. Data also are included separately about Brazil. The data in this report, both for remittances and other economic indicators, are derived from the World Bank. Data on immigrant populations in the U.S. come from the U.S. Census Bureau s American Community Survey. This report was written by D Vera Cohn, Ana Gonzalez-Barrera and Danielle Cuddington. The authors thank Mark Hugo Lopez, Jon Cohen, Rakesh Kochhar, Jeffrey Passel and Paul Taylor for editorial guidance and data analysis and Dilip Ratha for supplying 25 data about U.S. remittances to Latin America. Anna Brown number-checked the report. Marcia Kramer was the copy editor. Find related reports from the Pew Research Center s Hispanic Trends Project online at pewresearch.org/hispanic. A Note on Terminology The terms Latino and Hispanic are used interchangeably in this report. Unless otherwise specified, references to Latin America comprise the following Spanish-speaking countries: Argentina, Bolivia, Chile, Colombia, Costa Rica, Dominican Republic, Ecuador, El Salvador, Guatemala, Honduras, Mexico, Nicaragua, Panama, Paraguay, Peru, Uruguay and Venezuela. Cuba is not included because of lack of available data. Totals for Brazil are included separately. Remittances include money sent via formal channels by migrants themselves, as well as compensation of employees working in other countries. Compensation generally accounts for a small fraction of the total. See text box on page 6 for more detail. Adults refer to those ages 18 and older.
3 2 About Pew Research Center Pew Research Center is a nonpartisan fact tank that informs the public about the issues, attitudes and trends shaping America and the world. It does not take policy positions. It conducts public opinion polling, demographic research, media content analysis and other empirical social science research. The center studies U.S. politics and policy views; media and journalism; internet and technology; religion and public life; Hispanic trends; global attitudes and U.S. social and demographic trends. All of the center s reports are available at. Pew Research Center is a subsidiary of The Pew Charitable Trusts. Alan Murray, President Jon Cohen, Vice President, Research Elizabeth Mueller Gross, Vice President Paul Taylor, Executive Vice President, Special Projects Andrew Kohut, Founding Director Pew Research Center 213
4 3 Remittances to Latin America Recover but Not to Mexico Table of Contents About This Report 1 A Note on Terminology 1 About Pew Research Center 2 Table of Contents 3 1. Overview 4 Mexico Falls, Latin America Overall Recovers 4 Remittance Patterns 6 Impact and Use of Remittances 7 Who Sends Remittances Home? 8 2. Remittance Trends 12 Countries Where Remittances Fell, but Recovered 13 Countries Where Remittances Continue to Rise 14 Countries Where Remittances Fell and Did Not Recover 15 Comparing 25 and 212 U.S. Remittances 16 Remittances and Other Economic Indicators Sources of Remittances to Latin America 19 Remittances to Latin America from Other Countries 2 References 22 Appendix: Individual Country Trends 24
5 4 1. Overview Remittances to Spanish-speaking Latin American countries overall have recovered from a decline during the recent recession, with the notable exception of Mexico, according to World Bank data analyzed by the Pew Research Center. FIGURE 1 Total Remittances Received in Latin America and Mexico, In millions, 213 U.S. dollars 4, 35, Other Latin America 3, 25, Migrants remittances to Mexico, an estimated $22 billion in 213, are 29% below their 26 peak. For all other Spanish-speaking nations overall, Latin American the 213 estimate of $31.8 billion slightly surpasses the 28 peak. 2, 15, 1, 5, Mexico Remittances from all sources to Spanish-speaking Latin American countries have more than doubledd since 2 but remain below their peak in 27, the year in which the U.S. Great Recession began. The 213 estimated total ($53.8 billion) is 13% below 27 s $61.66 billion (in 213 U.S. dollars). The United States is the most important source of money sent home by migrants to the 17 Latin American nations as a group (including Mexico) that are the focus of this report. U.S. remittances accounted for three-quarters of the total in 212 $41 billion out of $52.9 billion, according to World Bank data. Mexico Falls, Latin America Overall Recovers Notes: Shading indicates U.S. recession. 213 are World Bank estimates. Other Latin America comprises Argentina, Bolivia, Chile, Colombia, Costa Rica, Dominican Republic, Ecuador, El Salvador, Guatemala, Honduras, Nicaragua, Panama, Paraguay, Peru, Uruguay and Venezuela. Remittance flows for use a different methodology than 2-24; for more details seee text box. Source: World Bank Annual Remittances Data Inflows, Oct The decrease for Latin America overall was fueled by a falloff in remittances to Mexico, whichh receives more than 4% of all remittances to Latin America. If Mexico is excluded, remittance totals to Spanish-speaking Latin American countries as a whole have recovered after dropping
6 5 Remittances to Latin America Recover but Not to Mexico during the U.S. recession years of 27 to 29. They bounced back in most of the other individual Spanish-speaking Latin American nations with remittances of more than $5 million a year. Of the dozen other nations, seven are estimated to have higher remittances in 213 than during the U.S. recession years of 27 to 29. Remittances to Mexico peaked in 26, a year earlier than the recent high point for Spanishspeaking Latin American nations as a whole. Aside from a single-year increase in 211, they have fallen each year since then. Other countries in which 213 estimated remittance flows have not recovered from declines during the U.S. recession years of 27 to 29 are Argentina, Colombia, Costa Rica, Dominican FIGURE 2 Republic and Ecuador. However, in seven other Spanish-speaking Latin American countries, remittances either have rebounded from declines during the recession years of 27 to 29 or did not fall markedly during those years. In Bolivia, El Salvador, Guatemala and Honduras, remittances are estimated to be higher in 213 than at their peak before the recession. In Nicaragua, Paraguay and Peru, remittances did not decline and have continued to rise. The decline in remittances to Mexico nearly all of which come from the U.S. is linked to economic changes in the U.S., where one-in-ten Mexican-born people live (Passel, Cohn and Gonzalez-Barrera, 212). The U.S. housing market crash hurt Mexican immigrants for whom the construction industry is a major job source, although a World Bank analysis concludes that the housing market s link to remittance totals has weakened since 211 (World Bank, 213). Share of Latin America Remittances from Top Sending Countries, 212 % of total remittances Canada 1% Spain 8% Other 14% Another factor in the fall of remittances to Mexico could be the Source: World Bank 212 Bilateral Remittance Matrix decline in the Mexican immigrant population in the U.S. since the onset of the recession, due to decreased arrivals and increased departures, including deportations. A Pew Research Center analysis of government data found that recent migration from the U.S. to Mexico equals and possibly exceeds migration from Mexico to the U.S. through at least 212 (Passel, Cohn and Gonzalez-Barrera, 212). U.S. 78% Notes: Latin America comprises Argentina, Bolivia, Chile, Colombia, Costa Rica, Dominican Republic, Ecuador, El Salvador, Guatemala, Honduras, Mexico, Nicaragua, Panama, Paraguay, Peru, Uruguay and Venezuela. Parts may not sum to 1% due to rounding.
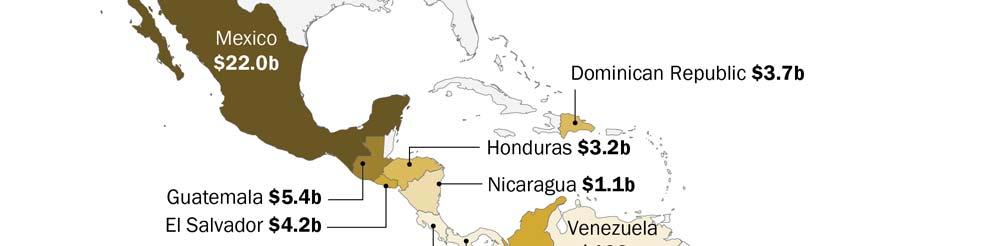
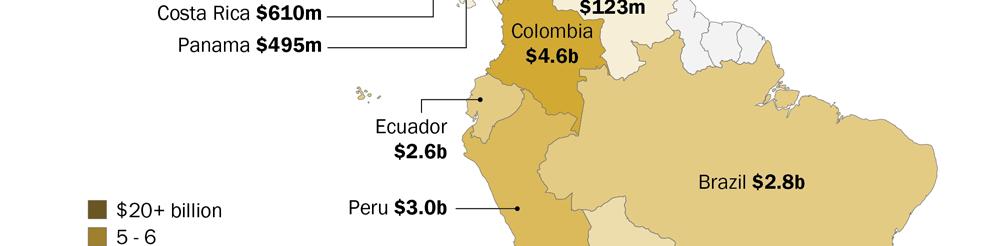
7 6 Remittance Patterns Remittances from the U.S. to Spanish-speaking Latin American countries are concentrated in countries closest to the U.S. border. Mexico alone receives more than half $23 billion in 212. The share rises to four-fifths when three adjacent countries are added in: Guatemala ($4.4 billion), El Salvador ($3.6 billion) and Honduras ($2.6 billion). U.S. residents are the source of nearly all remittance money received in Mexico (98% in 212) and of the majority of remittancee money received in six other Spanish- speaking Latin American nations: Costa Rica, Dominicann Republic, El Salvador, Guatemala, Honduras and Panama. Remittance amounts from the U.S. are higher than any other nation to three more countries, Colombia, Peru and Venezuela. Spain, the next-largest sending nation to Spanish-spe eaking Latin American countries, contributed 8% of 212 remittances, or $4 billion. Canada, which ranked third, sent 1% of remittances to these countries, or $74 million in 212. As is true of Latin America, the U..S. also is the largest source of remittances worldwide, sending a Remittances: A Definition Remittances are funds or other assets sent to their home countries by migrants, either themselves or in the form of compensation for border, short-term and seasonal employees (World Bank, 213). Most funds come directly from migrants; compensationn accounts for a single-digit share of remittances in most Latin American nations (World Bank, 211). This change hadd a particularlyy large impact on Brazil, reducing the total remittance amounts considerably. It had less impact on other Latin American nations (World Bank, 213). The 213 estimates and the trend data in this report employ the new definition. The 25 and 212 data on size of flows from one country to another have not been updated by the World Bank to reflect the new definition, so those may differ somewhat from trend data. When reporting trends over time in remittance flows, amounts for years before 213 are adjusted to 213 dollars, using the average U.S. inflation rate for every preceding year. For this reason, some numbers in this report differ from unadjusted data published by the World Bank. Data in this report are provided by the World Bank and follow World Bank definitions adopted from the International Monetary Fund nations (World Bank, 213). In some cases, trend analysis iss restricted to nations with more than $5 million in annual remittances, where year- to-year trends are less volatile. The World Bankk reports only remittances sent via formal channels, such as banks and other businesses that transfer money. If unofficial remittances were counted, the total could be as much as 5% higher or more, according to household surveys and other evidence cited by the World Bank (World Bank, 25). In 213, the World Bank revised its definition of remittances to delete a category of capital transfers between households. The World Bank also revised previously published numberss back to 25 to reflect the change.
8 7 Remittances to Latin America Recover but Not to Mexico total of $123.3 billion in 212, according to World Bank data. Saudi Arabia ($27.6 billion in 212) is next, followed by Canada ($23.9 billion). Among all countries, the largest recipient of remittances is India, with an estimated $71 billion in 213. China ranks second ($6.2 billion), followed by the Philippines ($26.1 billion). Mexico ranks fourth. Impact and Use of Remittances Remittances are a larger source of money to Latin America than official foreign aid. In 211, when foreign aid to Spanish-speaking Latin America nations totaled $6.2 billion, formal remittances were more than eight times that $53.1 billion. Foreign aid totals less than remittances in each Spanish-speaking Latin American nation except Chile and Peru. Money sent home by migrants represents a varying share of the gross domestic product throughout Spanish-speaking Latin America. The highest shares are in three Central American nations, according to the World Bank: El Salvador (16.5% in 212), Honduras (15.7%) and Guatemala (1.%). What is the impact of remittances? On the macro level, the World Bank has included remittance inflows in its measure of creditworthiness since 29, so nations with high levels of formal remittances may be allowed to borrow more money than they otherwise could. At the household level, as might be expected, those who receive remittances have higher incomes, spend more and are less likely to be extremely poor than those who do not receive remittances (Ratha, 213). TABLE 1 Remittances as a Share of GDP, 212 A significant part of remittances, often the majority, is spent on food, clothing and other day-to-day needs, according to research. Although there is variation by country, a significant, but smaller, share goes to saving and investment, especially among households that no longer include young children (Massey et al., 212). Households that receive remittances also are more likely than those that do not to spend money on health care and education (Ratha, 213). % Country Share El Salvador 16.5 Honduras 15.7 Guatemala 1. Nicaragua 9.7 Dominican Republic 6.1 Bolivia 4.1 Ecuador 2.9 Paraguay 2.5 Mexico 2. Peru 1.4 Costa Rica 1.2 Colombia 1.1 Panama 1.1 Uruguay.2 Argentina.1 Venezuela. Chile. Source: World Bank Annual Remittances Data Inflows, Oct
9 8 However, research is inconclusive about the impact of remittances on a receiving nation s economy. Some studies have found that labor force participation declines in households that receive remittances, which hurts economic growth (Chami et al., 23). Other studies focused on the impact of remittances in Mexico have found that at the state level remittances improve regional labor markets by raising employment levels (Orrenius et al., 212). The average cost of sending remittances to Latin America was 7.3% in late 213, according to the World Bank, a decline from past years (World Bank, 213a). The growing role of technology, especially mobile banking and online money transfers, has made it easier to send money home (Orozco, 212). It also has made it easier, along with improved measurement methods by banks, for governments and central banks to track remittances. Lower costs, improved technology and better tracking have played a role in increasing the sum of formal remittances, and some research suggests that these factors, not fundamental economic changes, likely account for most growth in formal remittances over the TABLE 2 U.S. Share of International Emigrants and Remittances % 2s (Orrenius et al., 212) % of Emigrants % of Remittances Country in the U.S., 21 from the U.S., 212 Who Sends Remittances Home? Mexico El Salvador 87 9 Guatemala Remittance totals are strongly linked to the size Honduras of a particular country s immigrant population Panama in the U.S. and the share of its emigrants who Dominican Republic 7 78 live in the U.S. For example, the four Latin American nations that get the highest share of their remittances from the U.S. Mexico, El Salvador, Guatemala and Honduras also are the top four in terms of the share of their emigrants who live in the U.S. The Latin American nations with the lowest share of remittances from the U.S. Uruguay, Bolivia and Paraguay also have the lowest share of emigrants living in the U.S. Costa Rica Ecuador Peru Nicaragua Venezuela Colombia Argentina Chile Bolivia Uruguay Paraguay 4 6 Most immigrants do send remittances home, and so do some people born in the U.S.; a Pew Research Center survey in 28 found that 54% of foreign-born Hispanics and 17% of U.S.-born Notes: Ranked by share of international emigrants living in the U.S. Source: Pew Research Center estimates of migrant population stocks, 21. World Bank 212 Bilateral Remittance Matrix
10 9 Remittances to Latin America Recover but Not to Mexico Hispanics say they send money to their home country (Lopez, Livingston and Kochhar, 29). Some research has found that foreign-born U.S. citizens and legal permanent residents are less likely to send remittances than unauthorized immigrants who may have less attachment to the U.S. and more to their home country (Massey et al., 212). This report is based mainly on data on remittances compiled by the World Bank, including overall trends for 2 to 213 as well as country-to-country flows for 212. To add context to the remittance findings, the report also uses World Bank data on foreign aid and GNP, as well as 212 estimates from the U.S. Census Bureau s American Community Survey on the immigrant population in the U.S. from selected Latin American nations. TABLE 3 Remittances Received, 213 estimates In millions, U.S. dollars Total Country Remittances Mexico 22, Guatemala 5,412 Colombia 4,642 El Salvador 4,217 Dominican Republic 3,76 Honduras 3,165 Peru 3,12 Ecuador 2,571 Bolivia 1,26 Nicaragua 1,18 Paraguay 76 Argentina 613 Costa Rica 61 Panama 495 Venezuela 123 Uruguay 18 Chile Source: World Bank Annual Remittances Data Inflows, Oct
11 1


12 11 Remittances to Latin America Recover but Not to Mexico
13 12 2. Remittance Trends Overall, remittances to Spanish-speaking Latin America countries have more than doubled since 2 in real dollars. Those Latin American nations received $22.9 billion in remittances in 2, a figure that rose to an estimated $53.8 billion in 213, according to World Bank data. Looking at trends since 2, the onset of the U.S. Great Recession interrupted what had been a steady upward trend from 2 to 27. Remittances to the 17 nations that are the focus of this report peaked at $61.66 billion in 27, and then fell in each of the following threee years, to $52.6 billion in 21. Remittances rose in 211 to $ 54.2 billion,, but decreased to $53.7 billion in 212 and held steady at an estimated $ 53.8 billion in 213. Thus, in 213, overall remittances to Latin America were 13% short of their 27 peak. A decline in remittances to Mexico was the main reason for the overall decrease after 211. Overall remittances to FIGURE 3 Remittances to Mex In millions, 213 U.S. dollars 35, 3, Mexico nearly all of which come from the U.S. are estimated to total $222 billion 25, 2, in 213, according to the World Bank, compared with $1.2 billion in 2. 15, 1, Remittances to Mexico peaked at $3.8 billion in 26, a year earlier than for Latin America as a whole. 5, Aside from a single-year increase in 211, remittances to Mexico have decreased each year since then. xico, Notes: Shading indicates U.S. recession. 213 is World Bank estimate. Source: World Bank Annual Remittances Data Inflows, Oct PEW RESEARCH CENTER The reduced remittances to Mexico were reflected in the findings of a 28 survey byy the Pew Research Center s Hispanic Trends Project. Among Hispanic immigrants who had sent remittances in the previous two years, 71% said they sent lesss in the past year than the year before (Lopez, Livingston and Kochhar, 29). In addition, immigration from Mexico has declined to the point that the number of
14 13 Remittances to Latin America Recover but Not to Mexico Mexicans arriving in the U.S. could be smaller than the number who are leaving (Passel, Cohn and Gonzalez-Barrera, 212). The next four sub-sections look at trends from 2 to 213 for 12 other Spanish-speaking nations in Latin America with annual remittances of at least $5 million. Bolivia, El Salvador, Guatemala and Honduras had remittance drops during the recessionn years, but have recovered. Nicaragua, Paraguay and Peru didd not have notable declines during the recession and totals have since risen. Argentina, Colombia, Costa Rica, Dominican Republic and Ecuador, like Mexico, have not recovered from remittance declines during the recession years. Data for the remaining nations (Chile, Panama, Uruguay and Venezuela), as well as for Brazil, and charts for each nation, can be found in Appendix A. Countries Wheree Remittances Fell, but Recovered Remittances to Bolivia have risen steeply since 2 the estimated total in 213 ($1.3 billion) is more than seven times higher than in 2 ($172 million). The growth (mainly before 27) was sharper than for Latin America as a whole, and Bolivian remittances also differed from the pattern for Latin America overall by recovering from their decline during the Great Recession. Remittances to Bolivia generally rose to a peak of $1.2 billion in 28, and then declined for two years before rising again. FIGURE 4 Trends, 2-213: : Nations Where Remittances Declined and Recovered In millions, 213 U.S. dollars 6, 5, 4, 3, 2, 1, 2 Guatemala El Salvador Honduras Bolivia Notes: Shading indicates U.S. recession. 213 aree World Bank estimates. Source: World Bank Annual Remittances Data Inflows, Oct PEW RESEARCH CENTER
15 14 Remittances to El Salvador, whichh totaled $2..4 billion in 2, rose to $4.2 billion in 27 before drifting down and then up again. In 213, El Salvador received an estimated $4.2 billion in remittances, about equal to its peak total. El Salvador remittances are mainly from the U.S., which was the source of 9% of that country s remittances in 212. Guatemala also receives most of its remittances 89% in 212 from the U.S. Guatemalan remittances overall grew from $81 million in 2 to $4.8 billion in 28, about a sixfold increase. After declining in 29, remittances to Guatemala have risen again since then, to total an estimated $5.4 billion in 213, higher than the previous peak. Honduras, which received 87% of its remittances from thee U.S. in 212, also has recovered from a decline in remittances during the Great Recession. Honduras received $657 million in remittances in 2, which rose to a peak of $3.1 billion in 28. Remittances declined for a year before rising again; in 213, they reached an estimated $3.2 billion. FIGURE 5 Trends, 2-213: Nations Where Remittances Have Risen In millions, 213 U.S. dollars Countries Wheree Remittances Continue to Rise Remittances to Nicaragua have risen steadily since 2, with only a slight dip during the Great Recession. In 2, $435 million in remittances were sent to Nicaragua, rising to $ 891 million in 28. After a relatively small decline in 29 (to $84 million), remittances began rising again. In 213, they totaled an estimated $1.1 billion. 6, 5, 4, 3, 2, 1, Peru Nicaragua Paraguay Remittances to Paraguay, $378 million in 2, grew to an estimated $76 million in 213, according to World Bank data. Notes: Shading indicates U.S. recession. Dashed line indicates a change in methodology that significantly affected the trend. 213 are World Bank estimates. Source: World Bank Annual Remittances Data Inflows, Oct
16 15 Remittances to Latin America Recover but Not to Mexico Remittances declined or stayed about the same from 21 to 25 (although a change in World Bank methodology could have affected the trend; see textt box on page 6). Remittances grew in 26 and leveled off or grew slowly through 21. Remittances grew rapidly after that; the estimated total of $76 million for 213 is 73% higher than it was in 21. In Peru, overall remittances grew from $975 million in 2 to an estimated $3 billion in 213. Remittances were relatively level from 2 to 22, grew to $2.7 billion in 28, and remained level or grew through 213. Countries Wheree Remittances Felll and Did Not Recover In millions, 213 U.S. dollars Over the period, remittances to Argentina peaked 6, in 28, at $758 million, after rising each year beforee that, 5, according to World Bank data. Colombia Since then, totals have been up and down. In 213, estimated 4, Dominican Republic remittances of $613 million were about a fifth lower than at their recent peak but more than five times what they had been in 2 ($117 million). 3, 2, 1, Ecuador Argentina Remittances to Colombia have followed a jagged pattern of rise Costa Rica and fall since 2, when they totaled $2.2 billion. They rose from 2 to 23 and leveled off for two years before rising to a peak of $5.3 billion in 28. Remittances to Colombia declinedd FIGURE 6 Trends, 2-213: Nations Where Remittances Fell and Have Not Recovered Notes: Shading indicates U.S. recession. 213 is World Bank estimate. Source: World Bank Annual Remittances Data Inflows, Oct or leveled off from 29 to 212 before rising again to an estimated $4.6 billion in 213. As explained in the next section, besides the U.S.., a notable share of remittances to Colombia come from Venezuela and Spain, two economies that are still struggling.
17 16 Remittances to Costa Rica, about two-thirds of which come from the U.S., rose sharply from 2 ($185 million) to 27 ($697 million). Remittance totals fell or leveled off after that until resuming their upward climb in 212. In 213, Bolivia received an estimated $61 million in remittances. In the Dominican Republic, which receives three-quarters of its remittances from the U.S., money sent home by migrants has grown by about half since 2, when it totaled $2.5 billion. Remittances peaked at $3.9 billion in 28, and have been up and down somewhat since then. In 213, the Dominican Republic received an estimated $3.7 billion in remittances. Remittances to Ecuador totaled $1.8 billion in 2, then rose to a peak of $3.8 billion in 27 before falling or leveling off. In 213, Ecuador received an estimated $2.6 billion in remittances, about a third lower than its peak total. Spain is the main contributor of remittances to Ecuador, followed by the U.S. Comparing 25 and 212 U.S. Remittances Although yearly data showing U.S. remittances to Latin American nations has not been published, the Pew Research Center analyzed an unpublished World Bank database of U.S. remittances in 25, two years before the start of the Great Recession. A comparison of 25 to 212 U.S. remittances shows that the total sent to Spanish-speaking Latin American nations rose 1% over the period in real terms, from $37.3 billion in 25 to $41 billion in 212. However, the change varied greatly among individual nations. U.S. remittances to Mexico the largest destination country declined slightly (3%) in real terms, from $23.6 billion in 25 to $22.8 billion in 212. Remittances to Colombia fell 18% in real dollars from 25 to 212. However, among other countries with total remittances of $5 million or more, all had doubledigit percentage increases in remittance growth from the U.S. since 25. In three countries, the amount more than doubled: Bolivia (135%), Paraguay (119%) and Honduras (115%). U.S. remittances to Panama, which received 72% of its remittances from the U.S. in 212, also grew sharply by 181% between 25 and 212. As a result of these differing trajectories, there were changes in rank among the top 1 recipients of U.S. remittances. Honduras received more remittances in 212 than Colombia, the reverse of their positions in 25. Similarly, Peru received somewhat more than Ecuador in 212 remittances, a reversal from 25.
18 17 Remittances to Latin America Recover but Not to Mexico Remittances and Other Economic Indicators Remittances are an important contributor to the economies of some Latin American nations. In 212, according to World Bank data, remittances accounted for about 1% or more of GDP in four nations: El Salvador (16.5%), Honduras (15.7%), Guatemala (1%) and Nicaragua (9.7%). However, for most Latin American nations, remittances make up a far smaller share of GDP. In 212, they amounted to less than 1% of GDP in Argentina, Chile, Uruguay and Venezuela. According to the World Bank (World Bank, 213), remittances worldwide amount to nearly three times the size of foreign aid, or official development assistance. In Spanishspeaking Latin America, according to World Bank data for 211 (the latest available), remittances ($53.1 billion) amount to more than eight times the total of foreign aid to the region ($6.2 billion). The size of the difference between remittances and foreign aid varies by nation. Remittances are about 34 times the amount of foreign aid in Nicaragua, and about 1 times or more foreign aid in Costa Rica, Dominican Republic, Ecuador and El Salvador. At the other end of the scale, remittances are less than twice foreign aid in Bolivia. In Chile and Peru, remittances are less than foreign aid. The total amount of remittances sent to each Latin American country from the U.S. is linked to the size of each country s foreign-born adult population in the U.S. Likewise, the share of remittances to each country that comes from the U.S. is closely linked to the share of that nation s emigrants who live in the U.S. TABLE 4 Total Remittances from the U.S. per Immigrant Adult Living in the U.S., 212 Adult Total immigrants remittances Remittances per capita (thousands) (millions) (dollars / adult immigrant) Guatemala 792 4,4 5,558 Honduras 493 2,579 5,231 Costa Rica ,923 Brazil 33 1,36 4,311 Panama ,353 Dominican Republic 888 2,732 3,76 El Salvador 1,21 3,555 2,939 Peru 41 1,91 2,721 Ecuador 42 1,47 2,67 Mexico 1,786 22,811 2,115 Colombia 635 1,33 2,94 Bolivia ,94 Nicaragua ,71 Argentina Uruguay Venezuela Chile Notes: Ranked by remittances per capita from the U.S. Adult immigrant population data not available for Paraguay. Source: Pew Research Center estimates based on U.S. Census Bureau 212 American Community Survey and World Bank 212 Bilateral Remittance Matrix
19 18 Mexico, with by far the largest adult population in the U.S. (1.8 million in 212) received the largest total remittances. 1 Guatemala, fourth-ranked in adult population, ranked second in total remittances. The Dominican Republic, third-ranked in adult population in the U.S., was the fourth-largest remittance recipient in 212. However, the per capita amount of remittance sent home has less to do with population size in the U.S. Although Mexicans send home the largest total of remittances, they ranked ninth among 16 Spanish-speaking Latin American nations in remittances per capita in 212. Similarly, Colombia ranked fifth in adult population size in 212 but 1th in per capita remittances. Meanwhile, Costa Rica ranked 15th in adult population size in 212 but third in per capita remittances. Guatemala, fourth-ranked in adult population size, sent home the highest per capita remittances in 212. Honduras, ranked sixth for adult population, sent home the second-highest per capita remittance. 1 For this analysis, the adult population ages 18 and older, rather than total population, is used in order to focus on the potential pool of remittance senders.
20 19 Remittances to Latin America Recover but Not to Mexico 3. Sources of Remittances to Latin America The United States is the single largest source of remittances to Spanish-speaking Latin America, accounting for $41 billion of the $52.9 billion in money sent home by migrants in 212. Funds transferred to Latin America account for a third (33%) of remittances from the U.S., according to World Bank data analyzed by the Pew Research Center. FIGURE 7 Percentage of Total Country Remittances from U.S., 212 % Mexico % from U.S. % Other 98 2 Although about three-quarters (78%) of all remittances to Spanish-speaking Latin El Salvador Guatemala American countries come from the U.S., the share varies widely from country to country. In Mexico, 98% of remittances are sent from the U.S.; in Paraguay, 6% are. Mexico also towers Honduras Dominican Republic Latin America over other Latin American countries in the amount of U.S. remittances it receives: $22.8 billion in 212, accounting for more than half of money transferred to the region from the Panama Costa Rica Nicaragua U.S. The nation with the next highest Ecuador amount Guatemala received $4.4 billion. Peru Of the 17 Spanish-speaking countries that are Venezuela the focus of this report, the U.S. is the main Colombia source of remittances to seven. In addition to Mexico, the U.S. is the source of the majority f remittance money received in El Salvador, Argentina Chile Guatemala, Honduras, Dominican Republic, Uruguay Panama and Costa Rica, in order of share from the U.S. It is the largest sending country of remittances to Peru, Colombia and Venezuela. Bolivia Paraguay Spain sends more than the U.S. in remittances to Argentina, Bolivia, Ecuador, Paraguay and Uruguay. Source: World Bank 212 Bilateral Remittance Matrix
21 2 Remittances to Latin America from Other Countries In terms of total remittances to Latin America, Spain, which sent $4 billion and supplied 8% of remittances, ranked second to the U.S. in 212. Canada, which sent $74 million and supplied 1% of remittances, ranked third. The countries with the highest shares of remittances from Spain are Ecuador (44%) and Bolivia (42%). Spain also supplies about a third of the remittances to Argentina (35%) and Venezuela (31%) and more than a quarter of remittances to Uruguay (29%). In terms of dollars, Spain also contributed more to Ecuador than to any other Latin American nation ($1.2 billion). The other top destination countries in 212 weree Colombia ($751 million), Peru ($472 million), Bolivia ($431 million) and Dominican Republic ($417 million). Remittances to Brazil Remittances to Brazil are estimated at $2.8 billion in 213, according to World Bank figures. This reflects a sharp reduction from $4.9 billion in 212, but the change is due mainly to a revised definition of remittances that removed a category of capital transfers between households (see text box on page 6). The World Bank has adjusted remittance totals to Brazil from 25 onward to reflect the new definition. Looking at trends from 25 to 213, remittances to Brazil peaked at $4 billion in 28. Remittances declined from 29 ($3.1 billion) to 212 ($2.6 billion). Remittances to Brazil in 213 are estimated at $2.8 billion. However, a number of Latin American nations Brazil receives about a quarter of its remittances from the U.S. (26% in receive a notable share of remittance funds from 212). countries other than the U.S. or Spain. Among the 14 Spanish-speaking Latin American nations with $5 Additional data about remittances to million or more in 212 remittances, six Argentina, Brazil can be found in Appendix A. Bolivia, Colombia, Nicaragua, Paraguay and Peru received more than 4% of those dollars from countries other than the U.S. or Spain. Other countries within Latin America are among the other major sources off remittances; for example Venezuela is the second-largest source of remittances to Colombia, after the U.S. Argentina, which received 47% of its $573 million in 2122 remittances from nations other than the U.S. or Spain, did not receive a notably large share from any nation other than those two. In 212, Bolivia received 45% of its $1 billion in remittances from nations other than the U.S. or Spain. Spain ($431 million) contributed the largest amount, followed by Argentina ($31 million) and the U.S. ($13 million).
22 21 Remittances to Latin America Recover but Not to Mexico The U.S. was the largest contributor ($1.3 billion) in 212 to Colombia s $4.1 billion in remittances, followed by Venezuela ($1.1 billion) and Spain ($751 million). Colombia received half (49%) of its remittances from nations other than the U.S. or Spain in 212. FIGURE 8 Percentage of Total Country Remittances from Spain, 212 % % from Spain % Other Nicaragua received $1 billion in remittances in 212, 56% of it from nations other than the U.S. or Spain. Costa Rica ($444 million) was Ecuador Bolivia the largest source of remittances to Nicaragua in 212, followed by the U.S. ($43 million) and Spain ($18 million). Argentina Venezuela Paraguay received $872 million in remittances in 212; 59% of that amount ($512 million) Uruguay Colombia came from Argentina. Paraguay Peru received 44% of its $2.8 billion in 212 Peru remittances from nations other than the U.S. or Spain. The U.S. ($1.1 billion) and Spain ($472 million) were the top source countries, Chile Dominican Republic followed by Italy ($236 million). Latin America 8 92 Honduras 4 96 Panama 3 97 Costa Rica 3 97 Nicaragua 2 98 Guatemala 1 99 El Salvador 1 99 Mexico 1 Source: World Bank 212 Bilateral Remittance Matrix
23 22 References Chami, Ralph, Connel Fullenkamp and Samir Jahjah. 23. Are Remittance Flows a Source of Capital for Development? International Monetary Fund Working Paper 3/189. Washington, DC: International Monetary Fund. Connor, Phillip Faith on the Move: The Religious Affiliation of International Migrants. Washington, DC: Pew Research Center s Religion & Public Life Project, March. International Monetary Fund Balance of Payments and International Investment Position Manual, Sixth edition. Washington, DC. Lopez, Mark Hugo, Gretchen Livingston and Rakesh Kochhar. 29. Hispanics and the Economic Downturn: Housing Woes and Remittance Cuts. Washington, DC: Pew Research Center s Hispanic Trends Project, January. Massey, Douglas S., Jorge Durand and Karen A. Pren Migradollars in Latin America: A Comparative Analysis. Chapter 12 in Migration and Remittances from Mexico: Trends, Impacts and New Challenges. Alfredo Cuecuecha and Carla Pederzini, eds. Lanham, MD: Lexington Books. Orozco, Manuel Future Trends in Remittances to Latin America and the Caribbean. Washington, DC: Inter-American Dialogue, May. Orrenius, Pia M., Madeline Zavodny, Jesus Canas and Roberto Coronado Remittances as an Economic Development Engine: Regional Evidence from Mexico. Chapter 1 in Migration and Remittances from Mexico: Trends, Impacts and New Challenges. Alfredo Cuecuecha and Carla Pederzini, eds. Lanham, MD: Lexington Books. Passel, Jeffrey, D Vera Cohn, and Ana Gonzalez-Barrera Net Migration from Mexico Falls to Zero and Perhaps Less. Washington, DC: Pew Research Center s Hispanic Trends Project, April.
24 23 Remittances to Latin America Recover but Not to Mexico Ratha, Dilip The Impact of Remittances on Economic Growth and Poverty Reduction. Washington, DC: Migration Policy Institute, September. World Bank Migration and Remittances Factbook 211. Washington, DC: World Bank. World Bank. 25. Global Economic Prospects 26: Economic Implications of Remittances and Migration. Washington, DC: World Bank. World Bank Migration and Remittance Flows: Recent Trends and Outlook: Washington, DC: World Bank, October. World Bank, 213a. Remittance Prices Worldwide. Washington, DC: World Bank, September.
25 24 Appendix: Individual Country Trends FIGURE A.1 Remittances Received by Argentina Selected Facts, 213 World rank Latin America rank Total Remittances Received, (in millions, 213 U.S. dollars) 6, 5, Selected Facts, 212 4, % of Argentina s GDP , Total from the U.S. (in millions) 15 2, % of total from the U.S. Remittances per capita from the U.S. (dollars / adult immigrant) , Notes: Shading indicates U.S. recession. 213 is World Bank estimate. 212 factss are based on 212 World Bank data that used a different remittance methodology than more recent data used for 213 facts and trend chart. Source: All remittance and GDP data from World Bank. Trends, 213 total, rankings and 212 share of GDP from 213 Annual Remittances Data Inflows, Oct. 213; 212 totals, U.S. totals and U.S. share from 212 Bilateral Remittance Matrix; adult immigrant population from Pew Research Center estimates based on 212 American Community Survey. /92X1CHHD
26 25 Remittances to Latin America Recover but Not to Mexico FIGURE A.2 Remittances Received by Bolivia Selected Facts, 213 World rank Latin America rank 1, Total Remittances Received, (in millions, 213 U.S. dollars) 6, 5, Selected Facts, 212 4, % of Bolivia s GDP 1, , Total from the U.S. (in millions) 13 2, % of total from the U.S. Remittances per capita from the U.S. (dollars / adult immigrant) 13 1,94 1, Notes: Shading indicates U.S. recession. 213 is World Bank estimate. 212 factss are based on 212 World Bank data that used a different remittance methodology than more recent data used for 213 facts and trend chart. Source: All remittance and GDP data from World Bank. Trends, 213 total, rankings and 212 share of GDP from 213 Annual Remittances Data Inflows, Oct. 213; 212 totals, U.S. totals and U.S. share from 212 Bilateral Remittance Matrix; adult immigrant population from Pew Research Center estimates based on 212 American Community Survey. /92X1CHHD
27 26 FIGURE A.3 Remittances Received by Chile Selected Facts, 213 World rank Latin America rank Total Remittances Received, (in millions, 213 U.S. dollars) 6, 5, Selected Facts, 212 4, % of Chile s GDP 3. 3, Total from the U.S. (in millions) 1 2, % of total from the U.S. Remittances per capita from the U.S. (dollars / adult immigrant) , Notes: Shading indicates U.S. recession. 213 is World Bank estimate. 212 factss are based on 212 World Bank data that used a different remittance methodology than more recent data used for 213 facts and trend chart. World Bank 213 estimate for Chile is zero; 212 estimate is $3 million. Source: All remittance and GDP data from World Bank. Trends, 213 total, rankings and 212 share of GDP from 213 Annual Remittances Data Inflows, Oct. 213; 212 totals, U.S. totals and U.S. share from 212 Bilateral Remittance Matrix; adult immigrant population from Pew Research Center estimates based on 212 American Community Survey. /92X1CHHD
28 27 Remittances to Latin America Recover but Not to Mexico FIGURE A.4 Remittances Received by Colombia Selected Facts, 213 World rank Latin America rank 4, Total Remittances Received, (in millions, 213 U.S. dollars) 6, 5, Selected Facts, 212 4, % of Colombia s GDP 4, , Total from the U.S. (in millions) 1,33 2, % of total from the U.S. Remittances per capita from the U.S. (dollars / adult immigrant) 32 2,94 1, Notes: Shading indicates U.S. recession. 213 is World Bank estimate. 212 factss are based on 212 World Bank data that used a different remittance methodology than more recent data used for 213 facts and trend chart. Source: All remittance and GDP data from World Bank. Trends, 213 total, rankings and 212 share of GDP from 213 Annual Remittances Data Inflows, Oct. 213; 212 totals, U.S. totals and U.S. share from 212 Bilateral Remittance Matrix; adult immigrant population from Pew Research Center estimates based on 212 American Community Survey. /92X1CHHD
29 28 FIGURE A.5 Remittances Received by Costa Rica Selected Facts, 213 World rank Latin America rank Total Remittances Received, (in millions, 213 U.S. dollars) 6 5 Selected Facts, % of Costa Rica s GDP Total from the U.S. (in millions) % of total from the U.S. Remittances per capita from the U.S. (dollars / adult immigrant) 69 4, Notes: Shading indicates U.S. recession. 213 is World Bank estimate. 212 factss are based on 212 World Bank data that used a different remittance methodology than more recent data used for 213 facts and trend chart. Source: All remittance and GDP data from World Bank. Trends, 213 total, rankings and 212 share of GDP from 213 Annual Remittances Data Inflows, Oct. 213; 212 totals, U.S. totals and U.S. share from 212 Bilateral Remittance Matrix; adult immigrant population from Pew Research Center estimates based on 212 American Community Survey. /92X1CHHD
30 29 Remittances to Latin America Recover but Not to Mexico FIGURE A.6 Remittances Received by Dominican Republic Selected Facts, 213 World rank Latin America rank 3, Total Remittances Received, (in millions, 213 U.S. dollars) 6, 5, Selected Facts, 212 4, 3,55 % of Dominican Republic s GDP Total from the U.S. (in millions) 6.1 2,732 3, 2, % of total from the U.S. Remittances per capita from the U.S. (dollars / adult immigrant) 78 3,76 1, Notes: Shading indicates U.S. recession. 213 is World Bank estimate. 212 factss are based on 212 World Bank data that used a different remittance methodology than more recent data used for 213 facts and trend chart. Source: All remittance and GDP data from World Bank. Trends, 213 total, rankings and 212 share of GDP from 213 Annual Remittances Data Inflows, Oct. 213; 212 totals, U.S. totals and U.S. share from 212 Bilateral Remittance Matrix; adult immigrant population from Pew Research Center estimates based on 212 American Community Survey. /92X1CHHD
31 3 FIGURE A.7 Remittances Received by Ecuador Selected Facts, 213 World rank Latin America rank 2, Total Remittances Received, (in millions, 213 U.S. dollars) 6, 5, Selected Facts, 212 4, % of Ecuador s GDP 2, , Total from the U.S. (in millions) 1,47 2, % of total from the U.S. Remittances per capita from the U.S. (dollars / adult immigrant) 39 2,67 1, Notes: Shading indicates U.S. recession. 213 is World Bank estimate. 212 factss are based on 212 World Bank data that used a different remittance methodology than more recent data used for 213 facts and trend chart. Source: All remittance and GDP data from World Bank. Trends, 213 total, rankings and 212 share of GDP from 213 Annual Remittances Data Inflows, Oct. 213; 212 totals, U.S. totals and U.S. share from 212 Bilateral Remittance Matrix; adult immigrant population from Pew Research Center estimates based on 212 American Community Survey. /92X1CHHD
32 31 Remittances to Latin America Recover but Not to Mexico FIGURE A.8 Remittances Received by El Salvador Selected Facts, 213 World rank Latin America rank 4, Total Remittances Received, (in millions, 213 U.S. dollars) 6, 5, Selected Facts, 212 4, % of El Salvador s GDP 3, , Total from the U.S. (in millions) 3,555 2, % of total from the U.S. Remittances per capita from the U.S. (dollars / adult immigrant) 9 2,939 1, Notes: Shading indicates U.S. recession. 213 is World Bank estimate. 212 factss are based on 212 World Bank data that used a different remittance methodology than more recent data used for 213 facts and trend chart. Source: All remittance and GDP data from World Bank. Trends, 213 total, rankings and 212 share of GDP from 213 Annual Remittances Data Inflows, Oct. 213; 212 totals, U.S. totals and U.S. share from 212 Bilateral Remittance Matrix; adult immigrant population from Pew Research Center estimates based on 212 American Community Survey. /92X1CHHD
33 32 FIGURE A.9 Remittances Received by Guatemala Selected Facts, 213 World rank Latin America rank 5, Total Remittances Received, (in millions, 213 U.S. dollars) 6, 5, Selected Facts, 212 4, % of Guatemala s GDP 4, , Total from the U.S. (in millions) 4,4 2, % of total from the U.S. Remittances per capita from the U.S. (dollars / adult immigrant) 89 5,558 1, Notes: Shading indicates U.S. recession. 213 is World Bank estimate. 212 factss are based on 212 World Bank data that used a different remittance methodology than more recent data used for 213 facts and trend chart. Source: All remittance and GDP data from World Bank. Trends, 213 total, rankings and 212 share of GDP from 213 Annual Remittances Data Inflows, Oct. 213; 212 totals, U.S. totals and U.S. share from 212 Bilateral Remittance Matrix; adult immigrant population from Pew Research Center estimates based on 212 American Community Survey. /92X1CHHD
34 33 Remittances to Latin America Recover but Not to Mexico FIGURE A.1 Remittances Received by Honduras Selected Facts, 213 World rank Latin America rank 3, Total Remittances Received, (in millions, 213 U.S. dollars) 6, 5, Selected Facts, 212 4, % of Honduras s GDP 2, , Total from the U.S. (in millions) 2,579 2, % of total from the U.S. Remittances per capita from the U.S. (dollars / adult immigrant) 87 5,231 1, Notes: Shading indicates U.S. recession. 213 is World Bank estimate. 212 factss are based on 212 World Bank data that used a different remittance methodology than more recent data used for 213 facts and trend chart. Source: All remittance and GDP data from World Bank. Trends, 213 total, rankings and 212 share of GDP from 213 Annual Remittances Data Inflows, Oct. 213; 212 totals, U.S. totals and U.S. share from 212 Bilateral Remittance Matrix; adult immigrant population from Pew Research Center estimates based on 212 American Community Survey. /92X1CHHD
Unemployment Rises Sharply Among Latino Immigrants in 2008
 Report February 12, 2009 Unemployment Rises Sharply Among Latino Immigrants in 2008 Rakesh Kochhar Associate Director for Research, Pew Hispanic Center The Pew Hispanic Center is a nonpartisan research
INTERNATIONAL MIGRATION IN THE AMERICAS
 INTERNATIONAL MIGRATION IN THE AMERICAS SICREMI 2012 EXECUTIVE SUMMARY Organization of American States Organization of American States INTERNATIONAL MIGRATION IN THE AMERICAS Second Report of the Continuous
Latino Workers in the Ongoing Recession: 2007 to 2008
 Report December 15, 2008 Latino Workers in the Ongoing Recession: 2007 to 2008 Rakesh Kochhar Associate Director for Research, Pew Hispanic Center The Pew Hispanic Center is a nonpartisan research organization
BY Rakesh Kochhar FOR RELEASE MARCH 07, 2019 FOR MEDIA OR OTHER INQUIRIES:
 FOR RELEASE MARCH 07, 2019 BY Rakesh Kochhar FOR MEDIA OR OTHER INQUIRIES: Rakesh Kochhar, Senior Researcher Jessica Pumphrey, Communications Associate 202.419.4372 RECOMMENDED CITATION Pew Research Center,
Did NAFTA Help Mexico? An Assessment After 20 Years February 2014
 Did NAFTA Help Mexico? An Assessment After 20 Years February 2014 Mark Weisbrot Center for Economic and Policy Research www.cepr.net Did NAFTA Help Mexico? Since NAFTA, Mexico ranks 18th of 20 Latin American
Growth and Migration to a Third Country: The Case of Korean Migrants in Latin America
 JOURNAL OF INTERNATIONAL AND AREA STUDIES Volume 23, Number 2, 2016, pp.77-87 77 Growth and Migration to a Third Country: The Case of Korean Migrants in Latin America Chong-Sup Kim and Eunsuk Lee* This
Remittances To Latin America and The Caribbean in 2010 STABILIZATION. after the crisis. Multilateral Investment Fund Member of the IDB Group
 Remittances To Latin America and The Caribbean in 2010 STABILIZATION after the crisis Multilateral Investment Fund Member of the IDB Group Total: US$ 58.9 billion 2010 REMITTANCES TO LATIN AMERICA AND
Inside the 2012 Latino Electorate
 June 3, 2013 Mark Hugo Lopez, Associate Director Ana Gonzalez-Barrera, Research Associate FOR FURTHER INFORMATION CONTACT: Pew Hispanic Center 1615 L St, N.W., Suite 700 Washington, D.C. 20036 Tel(202)
The repercussions of the crisis on the countries of Latin America and the Caribbean
 The repercussions of the crisis on the countries of Latin America and the Caribbean Second Meeting of Ministers of Finance of the Americas and the Caribbean Viña del Mar (Chile), 3 July 29 1 Alicia Bárcena
Remittances in times of financial instability
 Remittances in times of financial instability Impact of the financial crisis on remittances to Latin America and the Caribbean Introduction Worldwide remittances to Latin America and the Caribbean (LAC)
REMITTANCES TO LATIN AMERICA AND THE CARIBBEAN IN 2013: STILL BELOW PRE CRISIS LEVELS
 REMITTANCES TO LATIN AMERICA AND THE CARIBBEAN IN 2013: STILL BELOW PRE CRISIS LEVELS Multilateral Investment Fund Member of the IDB Group REMITTANCES TO LATIN AMERICA AND THE CARIBBEAN IN 2013: STILL
Immigrant Remittances: Trends and Impacts, Here and Abroad
 Immigrant Remittances: Trends and Impacts, Here and Abroad Presentation to Financial Access for Immigrants: Learning from Diverse Perspectives, The Federal Reserve Bank of Chicago by B. Lindsay Lowell
US Undocumented Population Drops Below 11 Million in 2014, with Continued Declines in the Mexican Undocumented Population
 Drops Below 11 Million in 2014, with Continued Declines in the Mexican Undocumented Population Robert Warren Center for Migration Studies Executive Summary Undocumented immigration has been a significant
The Latino Electorate in 2010: More Voters, More Non-Voters
 April 26, 2011 The Latino Electorate in 2010: More Voters, More Non-Voters Mark Hugo Lopez, Associate Director FOR FURTHER INFORMATION CONTACT: Pew Hispanic Center 1615 L St, N.W., Suite 700 Washington,
The Demographics of the Jobs Recovery Employment Gains by Race, Ethnicity, Gender and Nativity
 March 21, 2012 Employment Gains by Race, Ethnicity, Gender and Nativity Rakesh Kochhar, Associate Direcr for Research FOR FURTHER INFORMATION CONTACT: 1615 L St, N.W., Suite 700 Washingn, D.C. 20036 Tel
Welfare, inequality and poverty
 97 Rafael Guerreiro Osório Inequality and Poverty Welfare, inequality and poverty in 12 Latin American countries Argentina, Bolivia, Brazil, Chile, Colombia, Ecuador, El Salvador, Mexico, Paraguay, Peru,
MIF MULTILATERAL INVESTMENT FUND INTER-AMERICAN DEVELOPMENT BANK
 MULTILATERAL INVESTMENT FUND INTER-AMERICAN DEVELOPMENT BANK SENDING MONEY HOME: AN INTERNATIONAL COMPARISON OF REMITTANCE MARKETS F E B R U A R Y 2 0 0 3 Mexico 10,502 Honduras Cuba 1,138 Haiti 931 Dominican
NUMBERS, FACTS AND TRENDS SHAPING THE WORLD FOR RELEASE OCTOBER 29, 2014 FOR FURTHER INFORMATION ON THIS REPORT:
 NUMBERS, FACTS AND TRENDS SHAPING THE WORLD FOR RELEASE OCTOBER 29, 2014 FOR FURTHER INFORMATION ON THIS REPORT: Mark Hugo Lopez, Director of Hispanic Research Molly Rohal, Communications Associate 202.419.4372
Distr. LIMITED LC/L.4068(CEA.8/3) 22 September 2014 ENGLISH ORIGINAL: SPANISH
 22 September 2014 ENGLISH ORIGINAL: SPANISH") Distr. LIMITED LC/L.4068(CEA.8/3) 22 September 2014 ENGLISH ORIGINAL: SPANISH Eighth meeting of the Statistical Conference of the Americas of the Economic Commission for Latin America and the Caribbean
Distr. LIMITED LC/L.4068(CEA.8/3) 22 September 2014 ENGLISH ORIGINAL: SPANISH Eighth meeting of the Statistical Conference of the Americas of the Economic Commission for Latin America and the Caribbean
Source: Same as table 1. GDP data for 2008 are not available for many countries; hence data are shown for 2007.
 Migration and Development Brief 10 Migration and Remittances Team Development Prospects Group, World Bank July 13, 2009 Outlook for Remittance Flows 2009-2011: Remittances expected to fall by 7-10 percent
MIGRATION TRENDS IN SOUTH AMERICA
 South American Migration Report No. 1-217 MIGRATION TRENDS IN SOUTH AMERICA South America is a region of origin, destination and transit of international migrants. Since the beginning of the twenty-first
Remittances and Income Distribution in Peru
 64 64 JCC Journal of CENTRUM Cathedra in Peru by Jorge A. Torres-Zorrilla Ph.D. in Agricultural Economics, University of California at Berkeley, CA M.Sc. in Agricultural Economics, North Carolina State
Wage Inequality in Latin America: Understanding the Past to Prepare for the Future Julian Messina and Joana Silva
 Wage Inequality in Latin America: Understanding the Past to Prepare for the Future Julian Messina and Joana Silva 2002 2003 2004 2005 2006 2007 2008 2009 2010 2011 US (Billions) Gini points, average Latin
Trademarks FIGURE 8 FIGURE 9. Highlights. Figure 8 Trademark applications worldwide. Figure 9 Trademark application class counts worldwide
 Trademarks Highlights Applications grew by 16.4% in 2016 An estimated 7 million trademark applications were filed worldwide in 2016, 16.4% more than in 2015 (figure 8). This marks the seventh consecutive
A Demographic Profile of Mexican Immigrants in the United States
 A Demographic Profile of Mexican Immigrants in the United States Ariel G Ruiz Soto Associate Policy Analyst, U.S. Programs Migration Policy Institute Mexico Institute, Wilson Center November 5, 2018 Number
Envía CentroAmérica at gives you free information on how much it costs you to send money.
 Envía CentroAmérica at www.enviacentroamerica.org gives you free information on how much it costs you to send money. From: To: United States Costa Rica El Salvador Guatemala Honduras Nicaragua Panama Dominican
AmericasBarometer Insights: 2014 Number 105
 AmericasBarometer Insights: 2014 Number 105 Bridging Inter American Divides: Views of the U.S. Across the Americas By laura.e.silliman@vanderbilt.edu Vanderbilt University Executive Summary. The United
The Real Hispanic Challenge
 3 The Real Hispanic Challenge With President Obama s recent announcement that longterm unauthorized immigrants will be allowed to remain in the country without fear of deportation, the debate on immigration
International migration can be costly to a country in terms of the loss of. Commentary on Session III
 Commentary on Session III U.S. Mexico Remittances: Recent Trends and Measurement Issues Jesus Cañas, Roberto Coronado, and Pia M. Orrenius International migration can be costly to a country in terms of
Remittance Trends 2007
 Migration and Development Brief 3 Development Prospects Group, Migration and Remittances Team November 29, 2007 Remittance Trends 2007 Dilip Ratha, Sanket Mohapatra, K. M. Vijayalakshmi, Zhimei Xu 1 Recorded
Notes to Editors. Detailed Findings
 Notes to Editors Detailed Findings Public opinion in Russia relative to public opinion in Europe and the US seems to be polarizing. Americans and Europeans have both grown more negative toward Russia,
Migration and Development Brief
 Migration and Development Brief 8 Migration and Remittances Team Development Prospects Group, The World Bank Outlook for Remittance Flows 2008 2010: November 11, 2008 Growth expected to moderate significantly,
Migrants Remittances and Related Economic Flows
 Cornell University ILR School DigitalCommons@ILR Federal Publications Key Workplace Documents 2-2011 Migrants Remittances and Related Economic Flows Congressional Budget Office Follow this and additional
WORLD DECEMBER 10, 2018 Newest Potential Net Migration Index Shows Gains and Losses BY NELI ESIPOVA, JULIE RAY AND ANITA PUGLIESE
 GALLUP WORLD DECEMBER 10, 2018 Newest Potential Net Migration Index Shows Gains and Losses BY NELI ESIPOVA, JULIE RAY AND ANITA PUGLIESE STORY HIGHLIGHTS Most countries refusing to sign the migration pact
Dollarization in Ecuador. Miguel F. Ricaurte. University of Minnesota. Spring, 2008
 Dollarization in Ecuador Miguel F. Ricaurte University of Minnesota Spring, 2008 My name is Miguel F. Ricaurte, and I am from ECUADOR and COSTA RICA: And I studied in Ecuador, Chile, and Kalamazoo, MI!
An Awakened Giant: The Hispanic Electorate Is Likely to Double by 2030
 November 14, 2012 Aging, Naturalization and Immigration Will Drive Growth An Awakened Giant: The Hispanic Electorate Is Likely to Double by 2030 Paul Taylor, Director Ana Gonzalez-Barrera, Research Associate
OFFICIAL DEVELOPMENT ASSISTANCE AND THE FIGHT AGAINST POVERTY AND HUNGER IN LATIN AMERICA AND THE CARIBBEAN
 OFFICIAL DEVELOPMENT ASSISTANCE AND THE FIGHT AGAINST POVERTY AND HUNGER IN LATIN AMERICA AND THE CARIBBEAN Regional Consultations on the Economic and Social Council Annual Ministerial Review Ministry
Towards the 5x5 Objective: Setting Priorities for Action
 Towards the 5x5 Objective: Setting Priorities for Action Global Remittances Working Group Meeting April 23, Washington DC Massimo Cirasino Head, Payment Systems Development Group The 5x5 Objective In many
Monthly Census Bureau data show that the number of less-educated young Hispanic immigrants in the
 Backgrounder Center for Immigration Studies July 2009 A Shifting Tide Recent Trends in the Illegal Immigrant Population By Steven A. Camarota and Karen Jensenius Monthly Census Bureau data show that the
Latin America in the New Global Order. Vittorio Corbo Governor Central Bank of Chile
 Latin America in the New Global Order Vittorio Corbo Governor Central Bank of Chile Outline 1. Economic and social performance of Latin American economies. 2. The causes of Latin America poor performance:
How Distance Matters: Comparing the Causes and Consequence of Emigration from Mexico and Peru
 How Distance Matters: Comparing the Causes and Consequence of Emigration from Mexico and Peru Ayumi Takenaka & Karen A. Pren May 2008 Latino migrants are heterogeneous Latino migrants are heterogeneous
I. LEVELS AND TRENDS IN INTERNATIONAL MIGRANT STOCK
 I. LEVELS AND TRENDS IN INTERNATIONAL MIGRANT STOCK A. INTERNATIONAL MIGRANT STOCK BY DEVELOPMENT GROUP The Population Division estimates that, worldwide, there were 214.2 million international migrants
Brazilians in the United States: A Look at Migrants and Transnationalism
 Brazilians in the United States: A Look at Migrants and Transnationalism Alvaro Lima, Eugenia Garcia Zanello, and Manuel Orozco 1 Introduction As globalization has intensified the integration of developing
International migration within Latin America. Mostly labor circulation flows Industrial and urban destinations Rural origin to urban destination
 International migration within Latin America Mostly labor circulation flows Industrial and urban destinations Rural origin to urban destination International to and from Latin America Colonial migrations
Rapid Assessment of Data Collection Structures in the Field of Migration, in Latin America and the Caribbean
 www.migration-eu-lac.eu Rapid Assessment of Data Collection Structures in the Field of Migration, in Latin America and the Caribbean EXECUTIVE SUMMARY PURPOSE OF THE STUDY The purpose of this document
PRIVATE CAPITAL FLOWS RETURN TO A FEW DEVELOPING COUNTRIES AS AID FLOWS TO POOREST RISE ONLY SLIGHTLY
 The World Bank News Release No. 2004/284/S Contacts: Christopher Neal (202) 473-7229 Cneal1@worldbank.org Karina Manaseh (202) 473-1729 Kmanasseh@worldbank.org TV/Radio: Cynthia Case (202) 473-2243 Ccase@worldbank.org
Dealing with Government in Latin America and the Caribbean 1
 Public Disclosure Authorized Public Disclosure Authorized Public Disclosure Authorized Public Disclosure Authorized WORLD BANK GROUP LATIN AMERICA AND THE CARIBBEAN SERIES NOTE NO. 6 REV. 8/14 Basic Definitions
NUMBERS, FACTS AND TRENDS SHAPING THE WORLD. FOR RELEASE Friday, Nov. 7, 2014 FOR FURTHER INFORMATION ON THIS REPORT:
 NUMBERS, FACTS AND TRENDS SHAPING THE WORLD FOR RELEASE Friday, Nov. 7, 2014 FOR FURTHER INFORMATION ON THIS REPORT: Mark Hugo Lopez, Director of Hispanic Research Molly Rohal, Communications Associate
Trump, Immigration Policy and the Fate of Latino Migrants in the United States
 Trump, Immigration Policy and the Fate of Latino Migrants in the United States Manuel Orozco Trump s stated course of action is a frontal attack on all of the problems that he says have made America weak.
Chapter 3 Institutions and Economic, Political, and Civil Liberty in Latin America
 Chapter 3 Institutions and Economic, Political, and Civil Liberty in Latin America Alice M. Crisp and James Gwartney* Introduction The economic, political, and civil institutions of a country are interrelated
Inter-American Development Bank (IDB)
") REPORT ON ACTIVITIES AND PROGRAMMES ON MIGRATION, DEVELOPMENT AND REMITTANCES Inter-American Development Bank (IDB) This paper provides a brief summary of the main activities of the Inter-American Development
REPORT ON ACTIVITIES AND PROGRAMMES ON MIGRATION, DEVELOPMENT AND REMITTANCES Inter-American Development Bank (IDB) This paper provides a brief summary of the main activities of the Inter-American Development
Migration and remittances in times of recession: Effects on Latin American economies
 Migration and remittances in times of recession: Effects on Latin American economies Manuel Orozco Inter American Dialogue April 2009 Introduction 1 The report shows that in 2009 immigrants from Latin
Find us at: Subscribe to our Insights series at: Follow us
 . Find us at: www.lapopsurveys.org Subscribe to our Insights series at: insight@mail.americasbarometer.org Follow us at: @Lapop_Barometro China in Latin America: Public Impressions and Policy Implications
The Political Culture of Democracy in El Salvador and in the Americas, 2016/17: A Comparative Study of Democracy and Governance
 The Political Culture of Democracy in El Salvador and in the Americas, 2016/17: A Comparative Study of Democracy and Governance Executive Summary By Ricardo Córdova Macías, Ph.D. FUNDAUNGO Mariana Rodríguez,
THE AMERICAS. The countries of the Americas range from THE AMERICAS: QUICK FACTS
 THE AMERICAS THE AMERICAS The countries of the Americas range from the continent-spanning advanced economies of Canada and the United States to the island microstates of the Caribbean. The region is one
The Political Culture of Democracy in El Salvador, 2008
 The Political Culture of Democracy in El Salvador, The Impact of Governance Ricardo Córdova Macías, Fundación Dr. Guillermo Manuel Ungo José Miguel Cruz, Instituto Universitario de Opinión Pública, Universidad
Worker Remittances: An International Comparison
 Worker Remittances: An International Comparison Manuel Orozco Inter-American Dialogue February 28th, 2003 Inter-American Development Bank Worker Remittances: An International Comparison Manuel Orozco,
Distr. LIMITED LC/L.4008(CE.14/3) 20 May 2015 ENGLISH ORIGINAL: SPANISH
 20 May 2015 ENGLISH ORIGINAL: SPANISH") Distr. LIMITED LC/L.4008(CE.14/3) 20 May 2015 ENGLISH ORIGINAL: SPANISH Fourteenth meeting of the Executive Committee of the Statistical Conference of the Americas of the Economic Commission for Latin
Distr. LIMITED LC/L.4008(CE.14/3) 20 May 2015 ENGLISH ORIGINAL: SPANISH Fourteenth meeting of the Executive Committee of the Statistical Conference of the Americas of the Economic Commission for Latin
Mexico. Brazil. Colombia. Guatemala. El Salvador. Dominican Republic
 Migration and Remittances in Puerto Rico, the Dominican Republic, and Mexico Jorge Duany Department of Sociology and Anthropology University of Puerto Rico, Río Piedras Main Objectives Assess the growing
Emerging Market Consumers: A comparative study of Latin America and Asia-Pacific
 Emerging Market Consumers: A comparative study of Latin America and Asia-Pacific Euromonitor International ESOMAR Latin America 2010 Table of Contents Emerging markets and the global recession Demographic
Democracy's ten-year rut Oct 27th 2005 From The Economist print edition
 The Latinobarómetro poll Democracy's ten-year rut Oct 27th 2005 From The Economist print edition Latin Americans do not want to go back to dictatorship but they are still unimpressed with their democracies.
for Latin America (12 countries)
") 47 Ronaldo Herrlein Jr. Human Development Analysis of the evolution of global and partial (health, education and income) HDI from 2000 to 2011 and inequality-adjusted HDI in 2011 for Latin America (12
47 Ronaldo Herrlein Jr. Human Development Analysis of the evolution of global and partial (health, education and income) HDI from 2000 to 2011 and inequality-adjusted HDI in 2011 for Latin America (12
BY Amy Mitchell, Katie Simmons, Katerina Eva Matsa and Laura Silver. FOR RELEASE JANUARY 11, 2018 FOR MEDIA OR OTHER INQUIRIES:
 FOR RELEASE JANUARY 11, 2018 BY Amy Mitchell, Katie Simmons, Katerina Eva Matsa and Laura Silver FOR MEDIA OR OTHER INQUIRIES: Amy Mitchell, Director, Journalism Research Katie Simmons, Associate Director,
REMITTANCE PRICES W O R L D W I D E
 Public Disclosure Authorized Public Disclosure Authorized Public Disclosure Authorized Public Disclosure Authorized REMITTANCE PRICES W O R L D W I D E PAYMENT SYSTEMS DEVELOPMENT GROUP FINANCIAL AND PRIVATE
New data from the Census Bureau show that the nation s immigrant population (legal and illegal), also
, also") Backgrounder Center for Immigration Studies October 2011 A Record-Setting Decade of Immigration: 2000 to 2010 By Steven A. Camarota New data from the Census Bureau show that the nation s immigrant population
Backgrounder Center for Immigration Studies October 2011 A Record-Setting Decade of Immigration: 2000 to 2010 By Steven A. Camarota New data from the Census Bureau show that the nation s immigrant population
Unauthorized Immigrants Today: A Demographic Profile Immigration P...
 Unauthorized Immigrants Today: A Demographic Profile With Congress gridlocked on immigration reform, all eyes have turned to the White House to implement administrative reforms that will address some of
Latinos Express Growing Confidence In Personal Finances, Nation s Direction
 November 2, 2012 Latinos Express Growing Confidence In Personal Finances, Nation s Direction Mark Hugo Lopez, Associate Director Seth Motel, Research Assistant FOR FURTHER INFORMATION CONTACT: 1615 L St,
MIGRATORY OUTLOOK. International migration: global trends and dimensions of the phenomenon in Mexico MO01
 MIGRATORY OUTLOOK International migration: global trends and dimensions of the phenomenon in Mexico MO01 February 2018 D.R. Centro de Estudios Migratorios/Unidad de Política Migratoria/ Subsecretaría de
Mortgage Program for Mexican Migrant Workers. Second International Conference on Migrant Remittances London, November 2006
 Mortgage Program for Mexican Migrant Workers Second International Conference on Migrant Remittances London, November 2006 Contents 5 I. Introduction II. Mi Casa Program in Mexico What is SHF 6 Government
Should We Be Alarmed That One-in-Four U.S. Citizens Believes. Justifiable?
 Should We Be Alarmed That One-in-Four U.S. Citizens Believes a Military Take-Over Can Be Justifiable? Elizabeth J. Zechmeister Vanderbilt University liz.zechmeister@vanderbilt.edu January 9, 2018 Approximately
Earnings Inequality, Educational Attainment and Rates of Returns to Education after Mexico`s Economic Reforms
 Latin America and the Caribbean Region The World Bank Poverty Reduction and Economic Management Division The World Bank Earnings Inequality, Educational Attainment and Rates of Returns to Education after
What's Driving the Decline in U.S. Population Growth?
 Population Reference Bureau Inform. Empower. Advance. What's Driving the Decline in U.S. Population Growth? Mark Mather (May 2012) Between 2010 and 2011, the U.S. population increased by 0.7 percent, after
Hispanics, Immigration and the Nation s Changing Demographics
 Hispanics, Immigration and the Nation s Changing Demographics Ana Gonzalez-Barrera Senior Researcher Immigration and Demographics U.S. Immigrant Population Reached 45 million in 2015; Projected to be 78.2
UNHCR organizes vocational training and brings clean water system to the Wounaan communities in Panama
 UNHCR organizes vocational training and brings clean water system to the Wounaan communities in Panama Argentina Belize Bolivia Brazil Chile Colombia Costa Rica Cuba Ecuador El Salvador Guatemala Guyana
New Economical, Political and Social Trends in Latin America, and the Demands for Participation
 New Economical, Political and Social Trends in Latin America, and the Demands for Participation Bernardo Kliksberg DPADM/DESA/ONU 21 April, 2006 AGENDA 1. POLITICAL CHANGES 2. THE STRUCTURAL ROOTS OF THE
Incarceration Data: Selected Comparisons
 Incarceration Data: Selected Comparisons Charles Patton III Race/Ethnicity: Multidisciplinary Global Contexts, Volume 2, Number 1, Autumn 2008, pp. 151-156 (Article) Published by Indiana University Press
WORLD RADIOLOGY DAY CELEBRATION 2013
 WORLD RADIOLOGY DAY CELEBRATION 2013 CURRENT STATUS OF RADIOLOGY IN LATIN AMERICA AND THE CARIBBEAN GLORIA SOTO GIORDANI President Inter American College of Radiology (CIR) Latin America 20 countries:
DEMOGRAPHIC AND CULTURAL DATA OF LATIN AMERICA AND THE HISPANIC CARIBBEAN. (Complementary information compiled by the Conference Coordinators)
") DEMOGRAPHIC AND CULTURAL DATA OF LATIN AMERICA AND THE HISPANIC CARIBBEAN (Complementary information compiled by the Conference Coordinators) The purpose of this complementary document is to show some
DEMOGRAPHIC AND CULTURAL DATA OF LATIN AMERICA AND THE HISPANIC CARIBBEAN (Complementary information compiled by the Conference Coordinators) The purpose of this complementary document is to show some
Women in Agriculture: Some Results of Household Surveys Data Analysis 1
 Women in Agriculture: Some Results of Household Surveys Data Analysis 1 Manuel Chiriboga 2, Romain Charnay and Carol Chehab November, 2006 1 This document is part of a series of contributions by Rimisp-Latin
Levels and trends in international migration
 Levels and trends in international migration The number of international migrants worldwide has continued to grow rapidly over the past fifteen years reaching million in 1, up from million in 1, 191 million
Using data provided by the U.S. Census Bureau, this study first recreates the Bureau s most recent population
 Backgrounder Center for Immigration Studies December 2012 Projecting Immigration s Impact on the Size and Age Structure of the 21st Century American Population By Steven A. Camarota Using data provided
MIGRATION FLOWS REPORT IN CENTRAL AMERICA, NORTH AMERICA AND THE CARIBBEAN
 MIGRATION FLOWS REPORT IN CENTRAL AMERICA, NORTH AMERICA AND THE CARIBBEAN N 6 (JANUARY - MARCH, 2018) IOM REGIONAL OFFICE IN SAN JOSE - COSTA RICA MIGRATION FLOWS REPORT IN CENTRAL AMERICA, NORTH AMERICA
CLACLS. A Profile of Latino Citizenship in the United States: Demographic, Educational and Economic Trends between 1990 and 2013
 CLACLS Center for Latin American, Caribbean & Latino Studies A Profile of Latino Citizenship in the United States: Demographic, Educational and Economic Trends between 1990 and 2013 Karen Okigbo Sociology
Growth in the Foreign-Born Workforce and Employment of the Native Born
 Report August 10, 2006 Growth in the Foreign-Born Workforce and Employment of the Native Born Rakesh Kochhar Associate Director for Research, Pew Hispanic Center Rapid increases in the foreign-born population
New Patterns in US Immigration, 2011:
 Jeffrey S. Passel Pew Hispanic Center Washington, DC Immigration Reform: Implications for Farmers, Farm Workers, and Communities University of California, DC Washington, DC 12-13 May 2011 New Patterns
Dominicans in New York City
 Center for Latin American, Caribbean & Latino Studies Graduate Center City University of New York 365 Fifth Avenue Room 5419 New York, New York 10016 212-817-8438 clacls@gc.cuny.edu http://web.gc.cuny.edu/lastudies
1.3. Rankings: imports, exports and overall trade volume Philippines trade with EU Member States Structure and trends by product
 Front Cover Contents 1 Overview 2 1. Trade Relations 1.1. Trade in goods: main trends 1.2. Trade in services 1.3. Rankings: imports, exports and overall trade volume 1.4. Comparison of EU-Philippines
Can Presidential Popularity Decrease Public Perceptions of Political Corruption? The Case of Ecuador under Rafael Correa
 Can Presidential Popularity Decrease Public Perceptions of Political Corruption? The Case of Ecuador under Rafael Correa Sebastian Larrea and J. Daniel Montalvo sebastian.c.larrea@vanderbilt.edu daniel.montalvo@vanderbilt.edu
U.S.-Latin America Trade: Recent Trends
 Order Code 98-840 Updated May 18, 2007 U.S.-Latin America Trade: Recent Trends Summary J. F. Hornbeck Specialist in International Trade and Finance Foreign Affairs, Defense, and Trade Division Since congressional
The Road Ahead. What should be done to improve capacity of developing countries to finance trade
 The Road Ahead What should be done to improve capacity of developing countries to finance trade Rubens V. Amaral Jr. CEO, Bladex Geneva, March 27 th 2015 a) Latin America context - Trade Finance Availability
Poverty Reduction and Economic Management The World Bank
 Financiamento del Desarollo Productivo e Inclusion Social Lecciones para America Latina Danny Leipziger Vice Presidente Poverty Reduction and Economic Management, Banco Mundial LAC economic growth has
Americas. North America and the Caribbean Latin America
 North America and the Caribbean Latin America Working environment Despite recent economic growth in Latin America and the Caribbean, global increases in food and fuel prices have hurt people across the
Overview. Main Findings. The Global Weighted Average has also been steady in the last quarter, and is now recorded at 6.62 percent.
 This Report reflects the latest trends observed in the data published in September. Remittance Prices Worldwide is available at http://remittanceprices.worldbank.org Overview The Remittance Prices Worldwide*
International Migrant Stock: estimates and dissemination. Pablo Lattes Migration Section, Population Division - DESA United Nations, New York
 International Migrant Stock: estimates and dissemination Pablo Lattes Migration Section, Population Division - DESA United Nations, New York Chisinau, Moldova, 8-9 September 2014 The international migrant
REPORT ON THE ACTIVITIES OF THE COMMISSION biennium
 Economic Commission for Latin America and the Caribbean Thirty-first session of the Commission Montevideo, Uruguay, 20-24 March 2006 REPORT ON THE ACTIVITIES OF THE COMMISSION 2004-2005 biennium REPORT
Older Immigrants in the United States By Aaron Terrazas Migration Policy Institute
 Older Immigrants in the United States By Aaron Terrazas Migration Policy Institute May 2009 After declining steadily between 1960 and 1990, the number of older immigrants (those age 65 and over) in the
REPORT OF THE INTERGOVERNMENTAL WORKING GROUP ON THE MULTILATERAL EVALUATION MECHANISM (MEM)
") 0 FIFTH MEETING OF THE INTERGOVERNMENTAL OEA/Ser.L./XIV.4.5 WORKING GROUP ON THE MULTILATERAL CICAD/MEM/doc.13/99 rev.1 EVALUATION MECHANISM (MEM) 17 June 1999 May 3-5, 1999 Original: Spanish Washington,
0 FIFTH MEETING OF THE INTERGOVERNMENTAL OEA/Ser.L./XIV.4.5 WORKING GROUP ON THE MULTILATERAL CICAD/MEM/doc.13/99 rev.1 EVALUATION MECHANISM (MEM) 17 June 1999 May 3-5, 1999 Original: Spanish Washington,
North-South Migration To Developing Countries
 North-South Migration To Developing Countries Frank Laczko Head, Migration Research Division, European Migration Network Conference, Dublin, June 14, 2013 Policy Dialogue on Migration and Development 2013
Last Time Industrialization in the late 19th Century up through WWII Import Substitution Industrialization (ISI) (1940s 1970s) Export Promotion
 (1940s 1970s) Export Promotion") Last Time Industrialization in the late 19th Century up through WWII Import Substitution Industrialization (ISI) (1940s 1970s) Export Promotion Industrialization TODAY Population growth, distribution,
Last Time Industrialization in the late 19th Century up through WWII Import Substitution Industrialization (ISI) (1940s 1970s) Export Promotion Industrialization TODAY Population growth, distribution,
Meanwhile, the foreign-born population accounted for the remaining 39 percent of the decline in household growth in
 3 Demographic Drivers Since the Great Recession, fewer young adults are forming new households and fewer immigrants are coming to the United States. As a result, the pace of household growth is unusually