Summary of At-Border Data Collection Results
|
|
|
- Solomon Green
- 5 years ago
- Views:
Transcription
1 Summary of At-Border Data Collection Results Economic and Air Quality/Climate Impacts of Delays at the Border San Diego, CA December 8,
2 Contents Introduction... 4 Overview of the Study Area... 4 Overview of Data Collection Efforts... 5 Summary Statistics for Key Economic Survey Variables... 9 Trip Purpose... 9 Average Border-Crossing Trip Spending...14 Average Expenditures of Border-Crossing Travelers by Expenditure Category...16 Alternate Average Spending in Home Country...18 Average Expenditures by Expenditure Category If Trip is Not Taken...20 Average Wages...22 Elasticities of Travel Demand with respect to Border Delay...23 Summary Statistics for Key Air Quality Variables...25 Model Year...25 Odometer Reading and Units...26 Fuel Type...27 Share of Fuel Purchased in Mexico...28 Smog Check Program...29 Switch to Non-Motorized Crossing Mode...30 Summary Statistics for Key CBX Variables...32 Trip Purpose...32 Expenditure per Trip...32 Crossing Behavior Before CBX...33 Summary Statistics for Other Relevant Variables...35 Origin-Destination of Crossborder Trips...35 Productivity Loss...36 Summary of Total Border Crossing Time, Baseline Crossing Time and Delays at Crossing..38 Summary Statistics for Willingness to Pay Questions from Previous Surveys...42 Appendix 1: Weighting Methodology...46 Appendix 2: Median Statistics for Key Variables...49 Median Border-Crossing Trip Spending...49 Median Expenditures of Border-Crossing Travelers by Expenditure Category...49 Alternate Median Spending in Home Country
3 Median Expenditures by Expenditure Category If Trip is Not Taken...52 Median Wages...54 Appendix 3: Origins and Destinations of Crossborder Trips...55 Crossborder Trip Origins...55 Crossborder Trip Destinations...57 Appendix 4: Graphs of Total Border Crossing Times Collected in the Field...59 Passenger Vehicles...59 Commercial Vehicles
4 Introduction The California Baja California border region is one of the most important and dynamic economic zones in North America. However, demand is poised to outstrip supply at the region s border crossings. While the crossings have become a critical element of the bi-national region s economic integration and competitiveness, growing demand has led to increased congestion at border crossings and generated delay and unreliable crossing times for cars, trucks and pedestrians. These delays and travel time unreliability at the border have the potential to reduce the region s economic competitiveness and attractiveness to businesses, resulting in lower levels of economic activity and growth. In 2006, SANDAG and Caltrans completed a study that showed how border delays cause significant reductions in economic output and employment. The study highlighted the need for improving border crossings and helped make the case for developing a third crossing between San Diego and Tijuana (the planned Otay Mesa East-Mesa de Otay II border crossing). Similarly, in 2007, the former Imperial Valley Association of Governments (IVAG) and Caltrans conducted an economic delay study for Imperial County border crossings. Much has changed since these earlier studies the regional economy has rebounded from the Great Recession and there are new emerging industry clusters that depend on cross-border trade. As a result, and coupled with the need to identify cross border wait time impacts on the region s air quality, SANDAG has commissioned the HDR team (led by HDR Inc., and supported by T. Kear Transportation Planning and Management, Inc., Crossborder Group and Sutra Research) to conduct the study on Economic and Air Quality/Climate Impacts of Delays at the Border. The current report was developed by HDR to report the results of the field data collection efforts. In particular, this document summarizes five kinds of data collected in the field related to this study: 1) data collected through at-border surveys at the six main POEs that will be used as inputs into the economic analysis; 2) data collected through at-border surveys at the six main POEs that will be used as inputs into the air quality analysis; 3) data collected on-site for users of the CBX facility; 4) data on total border crossing times collected through at-border observations at the six main POEs that will be used as inputs into both the economic and air quality analyses; 5) data from an earlier (and separate) study collected through at-border surveys at the Calexico West POEs related to the willingness to pay for a faster border crossing lane at that site. The data summarized includes surveys of pedestrians, individuals crossing in private vehicles, individuals crossing in commercial vehicles as well as border crossing time data. Overview of the Study Area Figure 1 below shows a map of the cross-border region, including the ports of entry in the study area and where surveys and data collection were conducted as part of this study. 4

5 Figure 1: Map of the Cross-Border Region Source: SANDAG. Overview of Data Collection Efforts AT-BORDER SURVEYS The HDR team collected more than 10,000 survey responses from border crossers at all six land POEs along the California Baja California border from August through December of 2016 and at the Cross Border Xpress facility 1 in April Collectively, these responses are identified as the SANDAG Border Survey. After removing observations for outliers and missing information, the dataset comprises 11,326 observations. Of those, 10,897 observations correspond to the responses collected at the six land POEs in the region, with the remaining 429 corresponding to responses collected at CBX. About two thirds of these were collected from respondents crossing through San Diego County, and the rest were from people crossing through Imperial County. About three quarters of the total dataset captures people crossing from Mexico to the United States, and the remaining observations capture people traveling south from the U.S. to Mexico. 1 Cross Border Xpress (CBX) is an enclosed pedestrian skywalk bridge used by Tijuana International Airport ticketed passengers who pay a fee. 5
6 All participants were surveyed on the Mexican side of the border, so people who lived in Mexico were questioned about their trip on their way to the United States. People who lived in the U.S. were surveyed on their return trip home, with the questions concerning the trip they had already taken to Mexico. Note that in the survey responses, we assume that country of residence indicates the direction of crossing, so respondents stating they live in Mexico are considered taking a northbound trip, and vice versa for southbound trips from the United States. The surveys conducted at the six land POEs (excluding CBX) had two components: an economic component and an emissions component. The economic component was geared primarily to understand the expenditure behavior of border crossers that cross either by foot or on privately-owned vehicles (POVs) while the emissions component was geared to collect characteristics of the privately owned and commercial vehicle fleets that impact the amount of air pollution generated in the region from border crossing activities. Normally each participant was asked to provide answers for only one component (the specific component being asked was predetermined for specific days and times of data collection), but surveyors in the field had the discretion to ask POV users for both components if the queue length conditions allowed it. As a result, some participants responded to both components of the survey. The number of economic component survey responses broken down by country of residence (as reported by the respondents) as well as by the county used to cross the border is provided in Table 1. Table 1. Number of Economic Surveys Collected, by Country Where Respondent Lives and County of Border- Crossing Sample size by Self-Reported Country Where Respondent Lives Imperial County POEs San Diego County POEs Mexico 2,361 5,062 United States and Other 925 1,388 Total 3,286 6,450 The sample size can also be broken down by the number of surveys collected across counties and travel modes. Table 2 below presents that information. Table 2. Number of Economic Surveys Collected, by Travel Mode and County of Border-Crossing Sample size by Travel Mode Imperial County POEs San Diego County POEs Pedestrians 1,056 1,764 Privately-owned vehicles 2,230 4,686 Total 3,286 6,450 6
7 The SANDAG Border Survey also collected 4,026 emission component responses from privately-owned and commercial vehicles. 2 The breakdown by vehicle type as well as by the county used to cross the border is provided in the following table. Table 3. Number of Emissions Surveys Collected, by Vehicle Type and County of Border-Crossing Sample Size by Vehicle Type recorded Imperial County POEs San Diego County POEs Commercial Vehicles Passenger Vehicles 1,070 1,794 Total 1,389 2,637 The numbers shown in Table 2 and Table 3 are not additive, since a significant number of participants who drove POVs answered both components of the survey. Additionally, for people crossing in a POV, one person per car was interviewed for the survey, and we assume that their answer was applicable to all the persons in the car. In the case of the CBX surveys, they focused primarily on collecting variables such as trip purpose, expenditure during the trip and behavior related to air transportation before the existence of CBX. The number of responses broken down by country of residence (as reported by the respondents) is provided in Table 4. Table 4. Number of Surveys Collected at CBX, by Country Where Respondent Lives Sample size by Self-Reported Country Where Respondent Lives Number of Responses % of Total Mexico % United States % Totals % EXPANDING THE AT-BORDER SURVEY SAMPLE To appropriately represent the economic behavior of the underlying border crossing populations in each county, the sample of economic component responses collected through the SANDAG Border Survey was expanded using factors calculated from annual border crossing traffic volumes reported by the Bureau of Transportation Statistics (BTS). 3 These expansion factors allow the sample collected in the field to be statistically comparable to the underlying population 2 Besides the data collected as part of the SANDAG Border Survey, the study will use information from comparable, recently-collected GHG/air emission surveys from 2014 at the San Ysidro and Calexico West POEs for POVs (over 2,100 surveys total; almost 1,100 at San Ysidro and more than 1,000 at Calexico West), and at the Calexico East POE for trucks (over 200 surveys total). The characteristics of this additional survey data are described in the Assessment of Existing Data Gaps memo of this study. 3 The number of economic component observations collected through the survey at the POE and lanetype level was scaled-up using the appropriate factors to represent the numbers in the true population. The true population numbers are presented in Appendix 1 by travel mode (i.e., pedestrians or passenger vehicles). 7
8 of border crossers by adjusting for the differences in volumes across lane types and ports of entry in each county. 4 The results obtained using this scaling process are identified as weighted statistics of the corresponding variable. For survey questions that only applied to a certain subset of the respondents (like people crossing for work purposes), the expansion process used was slightly different: we applied proportions estimated from the survey to data reported by BTS to obtain the corresponding expanded samples that were then used in the estimation of weighted statistics. 5 All the summary statistics in this report correspond to weighted statistics, unless explicitly stated otherwise. OVERVIEW OF BORDER CROSSING TIME MEASUREMENTS The HDR team recorded data on the total border-crossing time for both passenger vehicles and commercial vehicles at all six POEs in the study area. For passenger vehicles, measurements were conducted at all POEs during the following days: July 1, 4 and 5 and October 16 and 17, 2016, or five days at each POE in total. For commercial vehicles, the measurements were conducted also during five days at each POE on the following days: October 12, 13 and 14 (Tecate POE), October 19, 20 and 21, 2016 (Calexico East POE) and February 10, 13 and 14, 2017 (Otay Mesa POE), March 1-2, 2017 (Calexico East and Tecate POEs), March 8-9, 2017 (Otay Mesa POE). 4 See Appendix 1 for a description of how the expansion factors were used to generate the weighted indicators presented in this document. 5 This is due to the fact that the true underlying population from which the sample was taken is unknown. 8
9 Summary Statistics for Key Economic Survey Variables There are a handful of variables considered as key inputs into the Economic Impact model that is being developed as part of the Economic and Air Quality/Climate Impacts of Delays at the Border study. In general, these key variables are related to trip purpose, measures of expenditure per border-crossing trip and type of goods/services bought during that trip, and an indicator of the attitude of crossers with respect to higher wait times at the border, and were collected through the SANDAG Border Survey. The (weighted) summary statistics for the key variables identified in this study are presented in this section. In particular, the summary statistics for the following variables are reported in this document: 6,7 Primary and Secondary Trip Purpose Average Border-Crossing Trip Spending Average Border-Crossing Trip Spending by Category Alternate Average Spending in Home Country Alternate Average Spending in Home Country by Category Average Wage Elasticity of Travel Demand with respect to Border Delay Since the SANDAG Border Survey was applied to different modes of transportation used to cross the border (i.e., passenger vehicles and pedestrians), the summary statistics for each variable in this section are presented separately for POVs and pedestrians. Trip Purpose The survey respondents were asked about the primary and secondary purposes for their crossborder trip and we received answers from all respondents. Primary trip purpose varies depending on country of residence, travel mode, and to a lesser degree, the county used to cross. A majority of northbound trips are taken for work, shopping, or social and family visiting purposes; together these make up 75 to 90 percent of all primary trip purposes listed across POE counties and travel modes (see Figure 2). About one third of pedestrians and one third of POVs crossing north into San Diego County are crossing for work. For Imperial County, the survey shows that 15 to 18 percent of northbound trips are workrelated for both POVs and pedestrians, whereas the shopping portion is more than half. Family and social visits are the next most frequently listed primary reason for crossing northbound, comprising 14 to 20 percent of trip purposes across pedestrians, POVs, both in San Diego County and Imperial County. 6 The variables listed correspond to those variables for which the SANDAG Border Survey was the source of the statistics. These variables were discussed during the Risk Analysis Session of the Economic Peer- Review. 7 The median results for border-crossing trip expenditure, border-crossing trip expenditure by category, alternate spending in home country, alternate spending in home country by category and wage were also calculated and are presented in the Appendix of this document. 9


10 Figure 2. Primary Trip Purposes for Northbound Trips by Mode and County of Crossing For people crossing into Mexico southbound, family and/or social visits comprise over half of the primary purposes for trips taken for both counties and travel modes, and work or business trips comprise closer to 10 percent of southbound trips. Additionally, for trips in vehicles through Imperial and San Diego County, 10 percent of trips are taken for medical or health reasons. For pedestrians the proportion is similar, but relatively more trips through Imperial County are taken for medical reasons (16 percent), as can be seen in Figure 3. 10


11 Figure 3. Primary Trip Purposes for Southbound Trips by Mode and County of Crossing Overall, the survey indicates that relatively more cross-border trips for shopping as a primary purpose are taken through Imperial County than San Diego County, and conversely more workrelated cross-border trips are taken through San Diego County than Imperial County. 8 A majority of respondents (about 80 percent overall) listed that they had no secondary purpose for taking their trip. For northbound trips, this proportion is slightly higher for both pedestrians and POVs at the POEs in Imperial County compared to the POEs in San Diego County. 8 This is in relative terms because in absolute terms cross-border traffic is much higher through POEs in San Diego County compared to POEs in Imperial County. 11
12 Figure 4. Secondary Trip Purposes for Northbound Trips by Mode and County of Crossing For those northbound crossers that reported having a secondary purpose, family or social visit and shopping were important across the county of crossing and the crossing mode. Table 5 presents the complete breakdown of the answers to the secondary purpose for northbound trips. For southbound crossings, the highest percentage of trips without a secondary purpose corresponded to those of pedestrians crossing through Imperial County (87 percent), while the lowest percent corresponded to pedestrians crossing through San Diego County (75 percent). Figure 5. Secondary Trip Purposes for Southbound Trips by Mode and County of Crossing 12

13 Table 5. Secondary Trip Purposes for Northbound Trips, by Crossing Mode and County Secondary Trip Purpose, Northbound Trips Imperial County POEs San Diego County POEs Pedestrians No Secondary Reason 86% 74% Airport 0% 0% Family or Social Visit 5% 8% Medical or Health 1% 1% Other 0% 0% Recreation/Vacation 2% 3% School 0% 1% Shopping 4% 11% Work or business 1% 3% Private Vehicle Crossers No Secondary Reason 84% 79% Airport 0% 0% Family or Social Visit 5% 6% Medical or Health 1% 1% Other 0% 0% Recreation/Vacation 2% 2% School 0% 1% Shopping 7% 9% Work or business 1% 1% Those southbound crossers that reported a secondary trip purpose mentioned family or social visit, shopping, medical or health and recreation / vacation were important across the county and crossing modes. Table 6 presents the complete breakdown of the answers to the secondary purpose for southbound trips. 13
14 Table 6. Secondary Trip Purposes for Southbound Trips, by Crossing Mode and County Secondary Trip Purpose, Southbound Trips Imperial County POEs San Diego County POEs Pedestrians No Secondary Reason 87% 75% Airport 0% 0% Family or Social Visit 4% 9% Medical or Health 1% 5% Other 1% 0% Recreation/Vacation 1% 5% School 0% 0% Shopping 6% 6% Work or business 1% 1% Private Vehicle Crossers No Secondary Reason 79% 81% Airport 0% 0% Family or Social Visit 8% 6% Medical or Health 2% 2% Other 0% 0% Recreation/Vacation 3% 5% School 0% 0% Shopping 6% 4% Work or business 2% 1% Average Border-Crossing Trip Spending The SANDAG Border Survey also collected information on expenditure patterns by border crossers. In particular, it elicited information on the amount of expenditure during border crossing trips and the categories of expenditure. Furthermore, it also asked interviewees about their expenditure behavior in case a border crossing trip had to be cancelled (i.e., the degree by which the expenditure would be deferred or substituted in the home country) in order to better understand the impact of foregone trips to the economy on either side of the border. All respondents were asked how much they spent or will spend on their border-crossing trip to Mexico or the United States. They were also asked to describe how they would spend the money, by listing amounts of expense in several spending categories, such as shopping, gas, groceries, and entertainment. The data was validated by reconciling responses in the overall expenditure question with responses in the expenditure breakdown, disregarding outliers with expenditures of over $10, The expenditure data are particularly skewed right (i.e., not 9 We also excluded observations with corresponding wage/salary responses above $40,000 per month. 14


15 normally distributed), meaning that though many respondents listed expenses from $0 to $100, a significant number of respondents also listed more than $500 in expenses, some listing up to thousands of dollars in expenditure. About 80% of the data is contained within the range of $7 to $350. Some but not all of the large expenses may be explained by vacations on either side of the border. Figure 6 shows the skewedness of the expenditure of southbound trips crossing in a vehicle through Imperial County POEs. This category of crossers features almost 70 percent of their reported border crossing expenditures between $0 and $100 but also shows that approximately 10 percent of their expenditures were reported to be are above $ Figure 6. Distribution of Expenditures from Imperial County Southbound Vehicles Subsample Chart displays only 90 percent of the survey results; the remaining values range from $400 to $10,000. In general, the survey data indicates that average spending per trip ranges from $112 to $220, across travel modes, border counties, and north and southbound trips. On average, crossers living in Mexico spend less per trip than people living in the U.S., except for vehicle drivers who cross through San Diego County, where spending appears similar for north and southbound trips. People crossing in Imperial County spend less per trip than people crossing in San Diego County, except for people who live in the United States and cross in a vehicle. For border crossers through Imperial County, the average pedestrian spends less than the average person driving across the border, whereas spending patterns across travel mode for crossers in San Diego County display the opposite relationship. Weighted average expenditure per trip is displayed in Table The median will be used to introduce risk analysis to this variable, since it represents the behavior of the individual at the center of the distribution of possible expenditure levels. 15
16 Table 7. Average Spending per Border Crossing Trip Average Spending per Border Crossing Trip, Dollars Pedestrians Imperial County San Diego County Crossers Living in Mexico $112 $182 Crossers Living in the U.S. $142 $220 Vehicles Crossers Living in Mexico $147 $166 Crossers Living in the U.S. $165 $165 Average Expenditures of Border-Crossing Travelers by Expenditure Category The SANDAG Border Survey asked border-crossing travelers to break down their trip-related expenditures by broad expenditure categories. The categories considered included entertainment, gas, groceries, hotel, public transportation, restaurants, shopping and a category called other to capture expenditures not listed in the survey. The data collected was analyzed using the place where the respondent reported to live, the county where the POE used to cross is located and the type of crossing (i.e., pedestrians and vehicles). An analysis of the survey data shows that the average crosser living in Mexico has different expenditure habits compared to the average crosser living in the U.S. regardless of the mode and the POE used to cross. Crossers living in Mexico have a high concentration of expenditures on shopping, while crossers living in the U.S. diversify their expenditures more across categories such as groceries, restaurants and shopping. The average pedestrian living in Mexico has similar expenditure patterns regardless of the location of the POE used to cross. The average (weighted) expenditures and the percentage share of each category of expenditure by pedestrians during a single border-crossing trip is presented in Table Notice that the sum of expenditures across all categories is equal to the average expenditure 16
17 Table 8. Average Spending by Pedestrians per Border Crossing Trip by Category Imperial San Diego Crossers living in Mexico % share $ % share $ Entertainment 5.5% $6 4.0% $7 Gas 2.7% $3 2.3% $4 Groceries 17.1% $ % $27 Hotel 0.0% $0 3.8% $7 Other % $1 2.7% $5 Public Transportation 0.3% $0 4.3% $8 Restaurants 8.7% $ % $19 Shopping 64.8% $ % $105 Total, all categories 100.0% $ % $182 Crossers living in the U.S. Entertainment 2.2% $3 12.5% $27 Gas 2.9% $4 4.0% $9 Groceries 31.3% $ % $42 Hotel 0.0% $0 8.9% $19 Other 7.1% $10 8.9% $20 Public Transportation 0.2% $0 7.2% $16 Restaurants 25.4% $ % $42 Shopping 31.0% $ % $46 Total, all categories 100.0% $ % $220 The average (weighted) expenditures and the percentage share of each category of expenditure by vehicle users during a single border-crossing trip is presented in Table Some of the POV and pedestrian respondents provided an explanation for the Other category. Common answers included: gym, church, paperwork, betting, postal services, and parking. 17
18 Table 9. Average Spending by Vehicle Users per Border Crossing Trip by Category Imperial San Diego Crossers living in Mexico % share $ % share $ Entertainment 6.4% $9 3.9% $7 Gas 9.7% $ % $17 Groceries 19.2% $ % $22 Hotel 0.6% $1 2.1% $3 Other 3.2% $5 2.1% $3 Public Transportation 0.0% $0 0.0% $0 Restaurants 10.1% $15 7.3% $12 Shopping 50.9% $ % $101 Total, all categories 100.0% $ % $166 Crossers living in the U.S. Entertainment 12.7% $21 6.0% $10 Gas 9.3% $15 9.0% $15 Groceries 16.3% $ % $28 Hotel 2.9% $5 5.8% $10 Other 15.2% $ % $22 Public Transportation 0.0% $0 0.2% $0 Restaurants 14.1% $ % $36 Shopping 29.4% $ % $45 Total, all categories 100.0% $ % $165 Alternate Average Spending in Home Country The SANDAG Border Survey asks questions concerning the respondents spending patterns in case they were to cancel their current trip (in other words, if they decided not to take the trip due to, for example, border wait times being too long). In particular, interviewees were asked to consider a situation in which their current border-crossing trip would not take place and were asked to choose between spending the amount they were anticipating spending on the trip either at their home country or to defer the expenditure until they performed a future bordercrossing trip. Based on the survey responses, people are generally more likely to defer their spending rather than spend it at their home county, but this varies. Crossers who live in the U.S. are more likely to spend in their home country when a border-crossing trip is not taken. The exception to this are pedestrians in Imperial County, for which crossers living in Mexico are slightly more prone than crossers living in the U.S. to spend in their home country if the trip is not taken. About half of pedestrians through Imperial County and one third of pedestrians through San Diego stated that they would spend their money at their home country versus deferring their spending for another trip. About one third of vehicle crossers through both counties stated they 18
19 would spend at their home country instead, except for the one half of vehicle crossers living in the U.S. crossing through San Diego that stated they would defer spending instead. The percent of respondents that would spend at their home country if the border crossing trip was not taken is presented in Table 10. Table 10. Respondents that Would Spend at Home Country if Border Crossing Trip was Not Taken Respondents that would spend at home country if border trip is not taken, percent Pedestrians Imperial County San Diego County Crossers Living in Mexico 51.4% 27.7% Crossers Living in the U.S. 50.6% 38.5% Vehicles Crossers Living in Mexico 31.4% 36.1% Crossers Living in the U.S. 38.3% 50.4% The survey also asked those individuals that would not defer their expenditure due to a border crossing trip not taken to report the amount of money they would spend at their home country. 13 The average expenditure ranges from $79 for pedestrians living in the U.S. and crossing through San Diego County POEs to $167 for vehicle occupants living in Mexico and crossing through POEs in Imperial County. 14 In general, crossers living in Mexico have higher average expenditures in their home country than crossers living in the U.S. across modes when a border crossing trip is not taken. The exception are pedestrian crossers using Imperial County POEs, since crossers living in the U.S. average $111 dollars of home country expenditure when a border trip is not taken compared to $99 for crossers living in Mexico. A possible explanation for this is that the expenditure categories include groceries, shopping and restaurants, which are more expensive in the U.S. The average spending at home if a border trip is not taken is reported in Table As in the case of the border-crossing trip expenditures variable, the statistic that will be used to introduce risk analysis to this variable is the median, since expenditure values when a trip is not taken tend to be skewed (in a statistical sense) and the median captures the behavior of the individual at the center of the distribution of possible expenditure levels. 14 It is worth noting that the behavior of home-country expenditure differs by mode and POE location of the forgone crossing. The percentage of respondents that reported that they would spend at their home country in case a border trip is not taken (by travel mode) is presented in the Appendix for each specific expenditure category. 19
20 Table 11. Average Spending at Home if a Border Trip is Not Taken Average Spending at Home if Border Trip is not taken, per Trip, Dollars Pedestrians Imperial County San Diego County Crossers Living in Mexico $99 $128 Crossers Living in the U.S. $111 $79 Vehicles Crossers Living in Mexico $167 $130 Crossers Living in the U.S. $102 $95 Notice that in the majority of the cases the average expenditure at home if a border trip is not taken is smaller than the average spending for border crossing trips made. The exception is vehicle crossers that live in Mexico and cross through Imperial County POEs, whose at-home average spending if a trip is not taken is higher than their average spending while on a crossborder trip. There could be several explanations to this result, including price differences between goods and services that belong to expenditures categories that are less likely to be deferred by this group of border-crossers when a border trip is not taken. Average Expenditures by Expenditure Category If Trip is Not Taken As in the case of expenditure for border-crossing trips made, the survey collected information on expenditures at home by category in case a trip was not taken. The same categories of expenditure as those described for border-crossing trips are used for this question. As in the case of a trip taken, the data collected was analyzed using the place where the respondent reported to live, the county where the POE used to cross is located and the mode for crossing (i.e., pedestrian or vehicles). An analysis of the survey data shows that, in general, the average pedestrian crosser that decides not to take a border-crossing trip has a tendency to spend at home primarily on groceries and shopping, regardless of where the crosser lives or the county of crossing. For crossers living in the U.S. and crossing through San Diego County, a category of home expenditure that is also significant is restaurants. The average (weighted) expenditures and the percentage share of each category of expenditure at home by pedestrians in case a bordercrossing trip is not taken are presented in Table
21 Table 12. Average Spending at Home by Pedestrians, by Category if a Border Trip is Not Taken Imperial San Diego Crossers living in Mexico Entertainment 3.9% $4 1.6% $2 Gas 4.7% $5 1.6% $2 Groceries 15.0% $ % $34 Hotel 0.0% $0 6.9% $9 Other 3.1% $3 13.0% $17 Public Transportation 0.0% $0 10.3% $13 Restaurants 5.2% $5 9.8% $13 Shopping 68.0% $ % $39 Total, all categories 100.0% $ % $128 Crossers living in the U.S. Entertainment 0.3% $0 10.9% $9 Gas 0.1% $0 5.0% $4 Groceries 35.6% $ % $23 Hotel 0.0% $0 0.0% $0 Other 7.8% $9 0.0% $0 Public Transportation 0.0% $0 2.2% $2 Restaurants 7.4% $8 35.1% $28 Shopping 48.9% $ % $14 Total, all categories 100.0% $ % $79 As in the case of the average pedestrian, the average vehicle crosser that decides not to take a border-crossing trip has a tendency to spend at home primarily on groceries and shopping, regardless of where the crosser lives or the county of crossing. However, other categories that also represent significant home expenditure regardless of where the crosser lives or the POE used are gas and restaurants. The average (weighted) expenditures and the percentage share of each category of expenditure at home by vehicle crossers in case a border-crossing trip is not taken are presented in Table It is worth noting that the shares of expenditures in the categories of Entertainment for crossers living in Mexico and Other for crossers living in the U.S. show a significant difference between the San Diego and Imperial County border regions. 21
22 Table 13. Average Spending at Home by Vehicle Users, by Category if a Border Trip is Not Taken Imperial San Diego Crossers living in Mexico Entertainment 13.8% $23 4.7% $6 Gas 11.2% $ % $15 Groceries 21.9% $ % $21 Hotel 0.7% $1 1.2% $2 Other 4.0% $7 0.5% $1 Public Transportation 0.0% $0 0.0% $0 Restaurants 12.1% $ % $16 Shopping 36.3% $ % $70 Total, all categories 100.0% $ % $130 Crossers living in the U.S. Entertainment 4.4% $4 5.5% $5 Gas 8.3% $8 14.1% $13 Groceries 17.4% $ % $24 Hotel 0.5% $1 1.7% $2 Other 18.1% $19 2.5% $2 Public Transportation 0.0% $0 0.0% $0 Restaurants 17.2% $ % $22 Shopping 34.0% $ % $27 Total, all categories 100.0% $ % $95 Average Wages Respondents who indicated their trip was work related were also asked for their monthly wage. Across all travel modes, counties, and trip directions, we received 677 useful wage responses, 177 from crossers at Imperial County POEs, and the rest from San Diego POEs. This data was validated by transforming numeric responses given for a different time period (i.e., daily wage or yearly salary) to monthly wages and identified two outliers that were greater than $40,000 a month. 16 The average monthly wage for a pedestrian crossing the border for work is $1,114 in San Diego County and $872 in Imperial County. For people driving across the border, the weighted averages for both counties are around $1, For the purposes of risk analysis, we will be using the median for this variable, since wages tend to have non-symmetric distributions and therefore the median captures the wage of the individual at the center of the distribution of possible salary levels. 22
23 Table 14. Average Monthly Wages Weighted Average Monthly Wage/Salary, Dollars Imperial County POEs San Diego County POEs Pedestrians crossing for work $872 $1,114 People crossing in vehicles for work $1,705 $1,685 Elasticities of Travel Demand with respect to Border Delay A key question of the survey asked respondents to report how much longer (compared to their perception of currently-anticipated wait time) they would be willing to wait before deciding to cancel a cross border trip they had already planned. Respondents were given a series of time intervals representing additional wait times (ranging from 5 minutes to more than 4 hours) that they could choose from. Using this information, an estimate of the elasticity of travel demand with respect to border delays was derived using a standard formula for the estimation of elasticities. In particular, for every time interval included in the survey, the percentage change in the number of respondents that reported would cancel the trip was estimated and compared to the percentage change that the additional wait time represents over the current wait time. The estimated elasticities show that pedestrians are less sensitive to additional wait times than occupants of vehicles and that crossers motivated by work purposes are less sensitive to additional wait times (i.e., they have higher tolerance to border crossing wait times than those crossing for non-working purposes). Similarly, the estimates show that vehicle crossers in San Diego County are less sensitive to additional border crossing wait times than crossers in Imperial County but the opposite is true for pedestrian crossers (i.e., pedestrian crossers are less sensitive to wait times in Imperial County). 17 Since this variable represents the percentage change in border crossings associated with a one percent increase in wait time at the border, an elasticity of (reported for pedestrians crossing for work or business purposes in Imperial County) means that a 1 percent increase in current wait times at the pedestrian crossings in Imperial would represent a reduction of 0.03 percent in the number of pedestrian crossings through these POEs for this type of crossing purpose. The estimates of the elasticities derived from the SANDAG Border Survey are presented in Table 15 for different types of crossers, trip purposes and counties where the crossings occur. 18 These elasticities will be combined in the economic model with the average delays estimated in this study (see section Summary of Total Border Crossing Time, Baseline Crossing Time and Delays at Crossing in this document) and the future delays calculated through the Binational Travel Demand Model to assess the impact of delays on future volumes through the POEs. 17 Since border crossers travel in both directions during any particular border crossing trip, the elasticity is assumed to be equal for crossers living in the U.S. and Mexico. 18 Since the survey asked about a range of potential additional wait times, several sets of elasticities were estimated based on their answers (one for each potential range). The elasticities listed in the table correspond to the median elasticity, since that represents the most-likely response. 23
24 Table 15. Elasticity of Travel Demand With Respect to Border Delays Elasticity of Travel Demand With Respect to Border Delays Pedestrians Imperial County San Diego County Crossing for work or business Crossing for a non-work purpose Vehicles Crossing for work or business Crossing for a non-work purpose Table 15 shows that the response of border crossers to increased wait times is fairly inelastic across all crossing types and across counties where the POEs are located. For example, a one percent increase in wait times for pedestrians crossing for work or business through Imperial County POEs will translate in a reduction in the number of pedestrians crossing the border through that region of only 0.03 percent. In other words, the increased wait time has a very small impact on the number of border-crossing trips, suggesting that crossers have high tolerance to wait times throughout the area (i.e., the volume of crossings is inelastic with respect to wait times). Furthermore, when the maximum ranges for this elasticity estimate are analyzed, it shows that the sensitivity of travelers to wait times is slightly higher, but still shows that the responses of travelers at the California-Baja California border are inelastic. The minimum and maximum elasticity estimates are presented in Table 16. Table 16. Minimum and Maximum Elasticities of Travel Demand With Respect to Border Delays Elasticity of Travel Demand With Respect to Border Delays Pedestrians Imperial County San Diego County MIN MAX MIN MAX Crossing for work or business Crossing for a non-work purpose Vehicles Crossing for work or business Crossing for a non-work purpose
25 Summary Statistics for Key Air Quality Variables There are a few variables considered as key inputs into the Air Quality (Emissions) Impact model that are being developed as part of the study. In general, these key variables are related to the year when the vehicle used to cross the border was manufactured, the condition of the engines for those vehicles as measured by the mileage, the fuel type used by them, the country where fuel is purchased and the adherence to a smog check program. Answers to these questions were collected through the SANDAG Border Survey. The summary statistics for the key air quality variables identified in this study are presented in this section. In particular, the summary statistics for the following variables are reported in this document: Model Year Odometer Reading (indicator for condition of engine) and Units of Odometer Measurement (indicator for where vehicle was built) Fuel Type Share of Fuel Purchased in Mexico Adherence to a Smog Check Program Willingness to Switch to Non-Motorized Border Crossing Mode The units for reporting each one of these variables may differ, but are clearly indicated in each one of the corresponding variable descriptions. Model Year The relevant statistics related to model year for the commercial and passenger vehicle fleets surveyed, by county where the border crossing occurred, are reported in Table 17. Table 17. Relevant Statistics on Model Year by County Imperial County San Diego County Commercial Vehicles Newest Model Year Median Model year Oldest Model year Average Model year Passenger Vehicles Newest Model Year Median Model year Oldest Model year Average Model year In general, median and average model years for commercial and passenger vehicles are very similar, indicating that their distributions are relatively symmetric. For commercial vehicles, however, Imperial County seems to have a slightly newer fleet (both newest, median and average model year are more recent than those in San Diego), however, this county also has 25
 is presented in Figure 7.")
26 the oldest model year in the survey. For passenger vehicles, the situation is similar as that of commercial vehicles (i.e., Imperial has a slightly newer fleet based on median and average model year indicators). A histogram depicting the shares of 5-year groupings of the model year variable for each one of the different vehicle types considered (i.e., passenger vehicles, light vehicles and heavy vehicles) is presented in Figure 7. Figure 7. Histogram of Model Year by Vehicle Type The figure above shows that light vehicles have their largest share in the model year bin or category, while passenger vehicles and heavy vehicles have their largest share in the bin. Odometer Reading and Units Of the total number of vehicles surveyed, the majority of them have an odometer with units in miles, indicating that a significant share of the vehicles crossing the border was built in the U.S. This is particularly true for commercial vehicles, where more than 90 percent of respondents reported an odometer in miles. The table below summarizes these results. Note that the shares do not differ significantly between geographies, and therefore the results are listed for all POEs in the California-Baja California region. Table 18. Odometer Units by Vehicle Type Sample Size by Vehicle Type and Odometer Units All POEs Commercial Vehicles Odometer in kilometers 94 8% Odometer in miles 1,068 92% Passenger Vehicles Odometer in kilometers % Odometer in miles 2,416 84% 26
27 The actual readings on the odometers were transformed into miles and the average and median odometer reading were calculated for each border region where the crossing took place (i.e., Imperial and San Diego Counties). The results are presented in the table below. 19 Table 19. Relevant Statistical Measures for the Odometer Reading Variable Odometer Reading (in miles) by Vehicle Type Imperial County San Diego County Commercial Vehicles Average 285, ,707 Median 154, ,162 Passenger Vehicles Average 126, ,435 Median 105, ,500 The statistics on odometer readings show a similar picture to that of the model year, with vehicles that cross through Imperial County showing less use than those that cross through San Diego County. However, in this case the median estimates are lower than the average estimates, suggesting that some vehicles in the sample have a large number of miles traveled. Fuel Type The fuel type has a direct impact on the emissions created by vehicles crossing the border. Table 20 shows the share of fuels used by border-crossing vehicles by vehicle type and county of crossing. 19 Potential outliers (i.e., odometer readings greater than the equivalent of 5.6 million miles, the maximum passenger vehicle odometer reading) were removed from the sample to create the estimates shown in the table. 27
28 Table 20. Fuel Type by Vehicle Type and County of Crossing Fuel Type by Vehicle Type Imperial County San Diego County Commercial Vehicles 100% Electric 0 0.0% 2 0.2% Diesel % % Gasoline % % Hybrid electric 0 0.0% 1 0.1% Natural Gas 4 1.3% % Total, all categories % % Passenger Vehicles 100% Electric 5 0.5% 7 0.4% Diesel 1 0.1% 4 0.2% Gasoline 1, % 1, % Hybrid electric 9 0.8% % Natural Gas % % Total, all categories 1, % 1, % In the case of commercial vehicles, the vast majority of crossers use diesel and gasoline. However, the share of crossers that uses gasoline through Imperial County is higher than the share of users of this fuel type through San Diego County. In the case of passenger vehicles, the vast majority of crossers use gasoline as their vehicle s fuel. For these type of vehicles, crossers through San Diego County reported significantly larger shares of hybrid and natural gas-powered vehicles than crossers through Imperial County, though the absolute shares of these fuels are small. Share of Fuel Purchased in Mexico The share of fuel purchased in Mexico also affects the emissions into the atmosphere. The responses to this survey question are concentrated primarily along the extremes (i.e., the majority of responses correspond to border crossers that do not buy fuel in Mexico or that only buy fuel in Mexico) regardless of the vehicle type considered. Table 21 shows the share of fuel bought in Mexico by vehicle type and county where the crossing occurred. 28
29 Table 21. Percent of fuel purchased in Mexico, by Vehicle Type Percent of fuel purchased in Mexico, by Vehicle Type Imperial County San Diego County Commercial Vehicles 0% % % 1-9% 12 4% 49 6% 10-19% 16 5% 41 5% 20-29% 16 5% 33 4% 30-39% 6 2% 24 3% 40-49% 9 3% 31 4% 50-59% 33 10% 75 9% 60-69% 10 3% 20 2% 70-79% 7 2% 28 3% 80-89% 22 7% 33 4% 90-99% 9 3% 40 5% 100% 69 22% % Total, all categories % % Passenger Vehicles 0% % % 1-9% 47 4% 163 9% 10-19% 59 6% 122 7% 20-29% 51 5% 130 7% 30-39% 31 3% 92 5% 40-49% 37 3% 95 5% 50-59% 99 9% 139 8% 60-69% 21 2% 37 2% 70-79% 29 3% 81 5% 80-89% 53 5% 160 9% 90-99% 74 7% 141 8% 100% % % Total, all categories 1, % 1, % The results show that in the case of commercial vehicles, crossers in San Diego County tend to purchase less fuel in Mexico. In particular, the share of border crossers in San Diego that does not buy fuel in Mexico is higher than the share of border crossers in Imperial County that do not buy fuel in Mexico. Similarly, the share of crossers in San Diego County that buy all their fuel in Mexico is lower in San Diego County. In the case of passenger vehicles, both the share of crossers that does not buy fuel in Mexico and the share of crossers that only buys fuel in Mexico is higher in the case of Imperial County. Smog Check Program Participation in a smog check program can reduce the emissions related to border crossing trips. In general, both commercial and passenger vehicles in the border region have a high share of participation in these programs. The share of responses to the question about having a 29
30 smog check inspection during the last 12 months is presented in the table below, by vehicle type and county of crossing. Table 22. Participation in Smog Check Inspection in Last 12 Months, by Vehicle Type Responses to a Smog-Check in the last 12 months, By Vehicle Type Imperial County San Diego County Commercial Vehicles DK/NA 2 1% 8 2% No 47 22% 38 8% Yes % % Total, all categories % % Passenger Vehicles DK/NA 22 2% 40 2% No % 161 9% Yes % 1,593 89% Total, all categories 1, % 1, % Based on these results, crossers that use San Diego County POEs reported a higher participation on smog check programs over the last 12 months compared to crossers that use Imperial County POEs. Also, the results suggest that the rate of participation in these programs differs primarily between geographies, and not so much between vehicle types in the same geography. Switch to Non-Motorized Crossing Mode The emissions component of the SANDAG Border Survey asked participants to report the wait time at pedestrian crossing that would induce them to switch from a motorized crossing to a non-motorized one (i.e., to cross by foot, bicycle or using public transportation). The shares of responses for different time intervals of pedestrian wait times are provided in Table 23 by county of crossing. 30
31 Table 23. Ranges of Border Crossing Wait Times that Would Cause Vehicle User to Switch to Pedestrian Crossing Ranges of wait time at pedestrian crossing 20 Imperial County San Diego County Passenger Vehicles 0 delay % 151 8% 1-10 minutes % % minutes 56 5% 160 9% minutes 37 3% 106 6% minutes 13 1% 44 2% minutes 8 1% 12 1% minutes 13 1% 13 1% 60+ minutes 42 4% 49 3% Wouldn t change from car % % Total, all categories 1, % 1, % The majority of the respondents for each county of crossing reported they would not switch to a non-motorized mode regardless of how much the wait time is at the pedestrian crossings. Furthermore, crossers in San Diego County are less likely to switch to a non-motorized mode than crossers in Imperial County. Across geographies, of those respondents that showed a willingness to switch to a nonmotorized mode, a significant portion said they would consider the switch only if wait times at pedestrian crossings were 20 minutes or less. The share of those that would switch only if zero delays are experienced at the pedestrian POEs is larger at Imperial County. 20 This question was also posed to commercial vehicle drivers, and even though over 200 responses were gathered at the Imperial Valley POEs and over 400 responses were gathered at the San Diego POEs, these were not reported since it does not seem plausible that truck drivers can switch to a nonmotorized mode and move freight across the border. 31

32 Summary Statistics for Key CBX Variables The surveys collected at CBX as part of the SANDAG Border Survey shed light on the recent change in behavior of border crossers that use airplane as their mode of travel due to the opening of this facility. The short survey conducted at the facility was geared toward capturing responses on the following variables: Trip Purpose Expenditure per Trip Crossing Behavior Before the Existence of CBX The summary statistics for these key variables are presented in this section. Trip Purpose Survey participants were asked to report their primary trip purpose while using CBX. The share of responses for the different trip purposes is reported in Figure 8, broken down by the place of living given by each respondent. Figure 8. Trip Purpose by CBX Users by Self-Reported Place of Residence The vast majority of CBX users, regardless of their self-reported place of residence, reported an airport / recreation / vacation trip purpose, with family or social visit having also an important share of the responses (though the share of this purpose is significantly lower than that of airport / recreation / vacation). The other trip purposes received a low share of responses. Expenditure per Trip The participants on this survey were asked to report their expenditure (per person) during the trip. The average and median expenditures estimated from the sample are presented in Table
33 Table 24. Average and Median Expenditures for CBX Users, by Country of Self-Reported Residence Expenditure ($) per person Crossers living in Crossers living in Mexico the U.S. Average Expenditure $1,139 $1,163 Median Expenditure $1,000 $780 Both the average and the median expenditure by this group of crossers is considerably higher than the average and median expenditure for crossers that use land modes. As in the case of crossings on the other six POEs in the region, median expenditures of CBX users are lower than average expenditures. Even though the average between crossers living in Mexico is similar to that of crossers living in the U.S., the median for CBX users that reported living in Mexico is significantly higher than the median for CBX users that reported living in the U.S. Crossing Behavior Before CBX The survey asked respondents about their use of the Tijuana airport before CBX existed. The share of responses by country of self-reported residence is presented in the table below. Note that questions were phrased differently depending on the place of residence to capture the different nature of the trips. Crossers living in Mexico: Before the CBX terminal opened, had you ever flown into the Tijuana Airport in order to visit the US? Number of Responses No 74 40% Yes % Crossers living in the U.S.: Before the CBX terminal opened, had you ever flown into the Tijuana Airport before to visit Mexico? Number of Responses No 77 32% Unsure/DK/NA 5 2% Yes % % % For CBX users that live in Mexico, approximately 60 percent of them had use the Tijuana airport before CBX opened. A slightly higher percentage (66 percent) of CBX users that live in the U.S. used the Tijuana airport before CBX began operations. As a follow-up question, respondents were asked to report their border-crossing behavior related to air travel in the absence of CBX. The shares of the responses provided by the survey participants to the different alternatives presented to them are provided in Figure 9, by selfreported place of residence. 33

34 Figure 9. Crossing Behavior in Absence of CBX by Self-Reported Place of Residence Current users of CBX, regardless of their place of residence, reported that they would cross the border before or after flying out of the Tijuana airport instead of flying into or out of other regional airports (i.e., San Diego or other Southern California airports). 34
35 Summary Statistics for Other Relevant Variables The survey captured information on other relevant variables that may not be the key drivers of economic impacts in the region but are relevant to understanding behavioral patterns of border crossers. Two variables are worth mentioning in this report: Origin-destination of crossborder trips Productivity loss due to delays at the border The summaries of these variables are presented as simple averages of the responses collected through the SANDAG Border Survey. Origin-Destination of Crossborder Trips The SANDAG Border Survey included questions about the origin and the destination of the trip the interviewee was taking at the time he or she was surveyed. Even though the origin and destination of each trip is recorded in the SANDAG Border Survey database, reporting about them by origin-destination pair is complicated due to the long list of possibilities. Therefore, in order to represent these origins and destinations in a simplified way, the results are presented by country where the trip began or ended (i.e., U.S. or Mexico) and by component of the trip (i.e., origin or destination). As such, this document presents the flows of border crossers in the following way: 1) trips originating in Mexico; 2) trips originating in the U.S.; 3) trips ending in Mexico; 4) trips ending in the U.S. 21 Within each country, we identify a number of relevant zones for reporting origins and destinations. In the case of Mexico, the main areas considered are Tijuana, Mexicali, Tecate, Algodones and Ensenada and an external zone that captures origins or destinations outside these cities. In the case of the U.S., the relevant zones considered for reporting are broken down by county to provide further detail. For San Diego County, the areas considered are Carlsbad, Chula Vista, Coronado, Del Mar, El Cajon, Encinitas, Escondido, Imperial Beach, La Mesa, Lemon Grove, National City, Oceanside, Poway, San Diego, San Marcos, Santee, Solana Beach, Vista and the unincorporated areas of San Diego County. For Imperial County, the areas considered are Brawley, Calexico, Calipatria, El Centro, Holtville, Imperial, Westmorland, and unincorporated areas. The U.S. also has an external zone that captures origins or destinations outside the areas listed under San Diego and Imperial Counties. When it comes to origins of border-crossing trips, the survey shows that approximately 88 percent of the trips that begin in Mexico start in either Tijuana or Mexicali. The survey also captured trips (approximately 6 percent of the respondents) that began outside of the main areas considered in Baja California. For border-crossing trips originating in the U.S., the survey shows that almost 80 percent begin in San Diego County (with the majority of those starting within the City of San Diego), a little over 10 percent begin in Imperial County and approximately 10 percent start outside of San Diego and Imperial Counties (the majority of those start in the State of California). 21 Maps are presented in Appendix 3. 35
36 Regarding destinations in Mexico, Tijuana and Mexicali account for 76 percent of all bordercrossing trips captured through the SANDAG Border Survey. Trips ending in areas outside of the regions considered in our list accounted for approximately 16 percent. Finally, 61 percent of the U.S. destinations listed for border-crossing trips are in San Diego County (primarily within the City of San Diego), 27 percent are in Imperial County and approximately 11 percent are in regions outside of these two counties. A table capturing the share of origins and destinations in each region considered is presented in Table 25, broken down by country. Table 25. Share of Origins and Destinations by Region Region Share of Origins Share of Destinations In Mexico Tijuana 47% 44% Mexicali 41% 32% Tecate 2% 1% Algodones 4% 7% Ensenada <1% 0% External 6% 16% In the U.S. In San Diego County 79% 61% San Diego 57% 43% Chula Vista 1% 12% National City 0% 1% Solana Beach 0% 1% Lemon Grove 0% 1% Santee 0% <1% La Mesa 0% <1% Carlsbad 0% <1% Coronado 0% <1% Poway 0% <1% Escondido 0% <1% Oceanside 0% <1% Imperial Beach 5% <1% Del Mar 0% <1% Vista 0% <1% Unincorporated 16% 4% In Imperial County 11% 27% Calexico 6% 17% El Centro 3% 7% Imperial 1% 1% Brawley 1% 1% Calipatria 0% <1% Holtville 0% <1% Westmorland 0% <1% Unincorporated <1% 1% External 10% 11% Productivity Loss Interviewees were also asked to report the impacts on their productivity resulting from delays at the border. In particular, survey participants were asked to identify what would happen to their number of hours worked on a given day if they arrived one hour late to work due to delays at the 36
37 POEs. The options given were the following: 1) make up the lost hour; 2) see their paycheck reduced by 1 hour; 3) lose the entire day or work; or 4) other. 22 Pedestrians in general reported being more likely to be able to make up for their hour lost. The exception to this is crossers living in the U.S. and crossing through Imperial, whose response was other though the number of responses was only one. However, a significant number (more than 20 percent) of crossers living in Mexico and crossing through Imperial County POEs responded that they could lose their entire day of work if they were an hour late. The share of pedestrian responses by country where the respondent lives and the county where the crossing POE is located is presented in the table below. Table 26. Productivity Loss Results for Pedestrians Productivity Loss Responses, Living in Mexico Living in the U.S. percentage Imperial San Diego Imperial San Diego Can make up hour of work 48.3% 69.3% 0.0% 80.0% Paycheck will be one hour less 31.0% 22.9% 0.0% 20.0% Will lose day of work 20.7% 5.7% 0.0% 0.0% Other 0.0% 2.1% 100.0% 0.0% TOTAL 100.0% 100.0% 100.0% 100.0% The number of survey respondents that are able to make up the hour of work due to delays at the border is also high for vehicle crossers, but the percentage of interviewees that reported that their paycheck will be one hour less is also considerable. The share of respondents that mentioned they would lose the entire day of work was lower for crossers using Imperial County POEs compared to that share for pedestrians. The share of responses from vehicle crossers is presented in the table below by country where the respondent lives and the county where the crossing POE is located. Table 27. Productivity Loss Results for Vehicle Users Productivity Loss Responses, Living in Mexico Living in the U.S. percentage Imperial San Diego Imperial San Diego Can make up hour of work 41.8% 55.5% 40.7% 48.1% Paycheck will be one hour less 41.1% 35.8% 25.9% 28.8% Will lose day of work 8.9% 5.2% 7.4% 11.5% Other 8.2% 3.6% 25.9% 11.5% TOTAL 100.0% 100.0% 100.0% 100.0% 22 The survey can be used to create a proxy for hours of productivity lost due to increasing wait times, but this estimate is not robust since the respondents were limited by the options of answer given in the survey. 37
38 Summary of Total Border Crossing Time, Baseline Crossing Time and Delays at Crossing The Economic and Air Quality/Climate Impacts of Delays at the Border study also included a data collection activity to record total border-crossing times for passenger and commercial vehicles at the six POEs in the region. In particular, total border crossing time was measured for these vehicles using a time-stamp methodology (with one observer placed on one side of the border where vehicles queue and another one at the exit of the Federal inspection complex at the other side of the border). Even though this was a separate effort from the SANDAG Border Survey, a summary of the results for this activity is presented here since it is a key input to the Economic Impact model. As described in the Overview of Border Crossing Time Measurements section, for passenger vehicles, measurements were conducted at all POEs during the following days: July 1, 4 and 5 and October 16 and 17, 2016, or five days at each POE in total. The hours where data was collected spanned from 7 am until 7 pm. For commercial vehicles, the measurements were conducted also during five days at each POE on the following days: October 12, 13 and 14 (Tecate POE), October 19, 20 and 21, 2016 (Calexico East POE) and February 10, 13 and 14, 2017 (Otay Mesa POE), March 1-2, 2017 (Calexico East and Tecate POEs), March 8-9, 2017 (Otay Mesa POE). The hours where data was collected spanned from 8 am until 6 pm. The data collection effort included collecting more than 12,000 observations on total border crossing times for passenger vehicles using the General Purpose, Ready Lanes and SENTRI lanes for northbound trips and a representative general lane for southbound trips across all six land POEs in the region. 23 It also included collecting more than 3,700 observations on total border crossing times for commercial vehicles using the Regular and FAST lanes for northbound trips and a representative general lane for southbound trips for those POEs that handle commercial vehicle traffic. 24 At the same time, the effort included collecting information on more than 120 crossings using GPS loggers to accurately capture the total border crossing time for passenger vehicles across the San Ysidro, Otay Mesa, Calexico East and Calexico West POEs. The average total border-crossing times registered in the field for passenger vehicles are presented in the table below, by POE and lane type (three types of northbound lane types plus southbound). Table 28 lists the total crossing times in terms of the number of average minutes per border-crossing trip The method used to collect POV total crossing data is license plate sampling (last 5-digits of a license plate at the beginning of the queue and at the exit of the border crossing compound) as described in the Border Wait Time Data Collection Plan for this study. 24 The method used to collect truck total crossing data is the same as that used for POVs. 25 Detailed graphs of total border crossing times collected in the field and used to produce the averages in this section are presented in Appendix 4 by POE and lane type. 38
39 Table 28. Average Total Border-Crossing Times for Passenger Vehicles (In Minutes) Lane Type San Ysidro Otay Mesa Tecate Calexico East Calexico West Andrade NB General Purpose NB Ready Lane NB SENTRI Southbound Note: Total border-crossing times were collected on the days mentioned in this section between the hours of 7 am and 7 pm. POEs in Imperial and San Diego Counties that handle large volumes of passenger vehicles (i.e., Calexico East, Calexico West, San Ysidro and Otay Mesa) have similar average total crossing times for northbound trips for the different lane types available at them. The exception is Otay Mesa for SENTRI crossers, which displays a significantly lower total crossing time compared to the other POEs. Tecate and Andrade, on the other hand, also display similar average total crossing times for the lanes available at them. The average total border-crossing times for commercial vehicles at the three POEs in the region that handle this type of crossing are displayed in Table 29. Table 29. Average Total Border-Crossing Times for Commercial Vehicles (In Minutes) Lane Type Otay Mesa Tecate Calexico East NB General Purpose NB FAST Southbound Note: Total border-crossing times were collected on the days mentioned in this section between the hours of 8 am and 6 pm. For northbound flows, Otay Mesa has significantly higher average total crossing time compared to the Tecate and Calexico East POEs. For southbound flows, however, Calexico East recorded the highest average total crossing times, while Otay Mesa and Tecate recorded relatively similar measurements. The information on total border-crossing times collected in the field was used to define a baseline border-crossing time that represents an acceptable time that vehicles need to cross the border. To do this, a statistical analysis of the total border crossing dataset was used 26 to identify percentiles in the data that would appropriately represent this acceptable crossing time. The specific percentiles were discussed with U.S. Customs and Border Protection (CPB) staff to determine their appropriateness and, in general, it was found that the 10 th percentile is a good representation of what an acceptable border-crossing time would be. The preliminary baseline border-crossing times for passenger vehicles are presented in Table 30, by lane type and POE. Notice these baseline times are expressed in minutes per trip. 26 In the case of the baseline border-crossing times for passenger vehicles, the statistical analysis was complemented with information from a small number of GPS runs collected as part of this study. 39
40 Table 30. "Baseline" Border-Crossing Times for Passenger Vehicles (In Minutes) Lane Type San Ysidro Otay Mesa Tecate Calexico East Calexico West Andrade NB General Purpose NB Ready Lane NB SENTRI Southbound Note: Baseline times were derived from total border-crossing times collected on the days mentioned in this section between the hours of 7 am and 7 pm. Similarly, the preliminary baseline border-crossing times for commercial vehicles are presented in the table below, expressed in minutes per trip. Table 31. "Baseline" Border-Crossing Times for Commercial Vehicles (In Minutes) Lane Type Otay Mesa Tecate Calexico East NB General Purpose NB FAST Southbound Note: Baseline times were derived from total border-crossing times collected on the days mentioned in this section between the hours of 8 am and 6 pm. The identification of a baseline border-crossing time for passenger and commercial vehicles allows for the estimation of average delay times for each lane type at each POE. This is done by subtracting the baseline crossing time for each lane type and POE from the average total crossing time for each corresponding lane type and POE. The resulting average delays at the border for passenger vehicles are shown in the table below. Table 32. Average Border-Crossing Delay for Passenger Vehicles (In Minutes) Lane Type San Ysidro Otay Mesa Tecate Calexico East Calexico West Andrade NB General Purpose NB Ready Lane NB SENTRI Southbound Note: Average border-crossing delay was derived from total border-crossing times collected on the days mentioned in this section between the hours of 7 am and 7 pm. As in the case of average total border-crossing times, average delays for northbound trips across the POEs in Imperial and San Diego Counties that handle the largest number of crossings (Calexico East, Calexico West, San Ysidro and Otay Mesa) are relatively similar, while delays for northbound trips on POEs that handle lesser volumes (Tecate and Andrade) are also similar. Again, the exception is SENTRI crossers through Otay Mesa, who experience lower average delays compared to the other POEs in the region. The average delays for commercial vehicles are shown in the table below, expressed as number of minutes per trip. 40
41 Table 33. Average Border-Crossing Delay for Commercial Vehicles (In Minutes) Lane Type Otay Mesa Tecate Calexico East NB General Purpose NB FAST Southbound Note: Average border-crossing delay was derived from total border-crossing times collected on the days mentioned in this section between the hours of 8 am and 6 pm. Even though Otay Mesa still shows higher delays compared to the other POEs that handle commercial traffic, the difference between this POE and Calexico East (the larger of the other two POEs with commercial crossings) is smaller compared to the case when the average total crossing times are compared. 41
42 Summary Statistics for Willingness to Pay Questions from Previous Surveys In May and August of 2014, Crossborder Group (a member of the HDR team for the Economic and Air Quality/Climate Impacts of Delays at the Border study) undertook proprietary surveys at the Calexico West POEs to assess a range of economic and policy issues. The questionnaire (which was applied randomly to 784 northbound vehicles in both Regular and SENTRI lanes) included two specific questions that relate to the issue of potential demand for a tolled border crossing between Mexicali and Calexico. Those questions were: If a toll-based express lane existed with a wait of fifteen minutes or less, would you use it and how much would you be willing to pay? ; and If this express toll lane existed, in a normal month how many times would you use it? This survey was applied to a total of 784 individual drivers of passenger vehicles at the Calexico/Mexicali I POE (Calexico West). Of those, 537 responses are from the Regular lanes and the remaining 247 responses are from the SENTRI lanes. Below are the summary results to those two questions, and other key questions, from that Crossborder Group survey. 27 Slightly more than half (51.3 percent) of Calexico West POV drivers reported being frequent border crossers crossing at least 2 or more times per week, as shown in the table below. Table 34. Frequency of Crossing for Willingness-to-Pay Respondents Which answer best describes how frequently Number of you cross the border northbound? Responses % 5+ times / week % 2-4 times / week % 1 time / week % 1-2 times / month % Less than once / month % First time crossing 5 0.6% TOTAL % During the survey time period (which included holiday travelers), nearly 80 percent reported their primary residence as either Mexicali or Imperial County, as shown in the table below. Given potential tourist respondents during the survey dates, it is possible that local border crossers may have been undercounted. 27 All data presented here is owned by Crossborder Group, and is considered proprietary in nature. It is being provided under a limited license to HDR for its use in this study. It may not be released to the general public. 42
43 Table 35. Place of Residence for Willingness-to-Pay Respondents In what area do you have your primary residence or do you live? Number of Responses % Mexicali % Imperial County % Tecate 1 0.1% Tijuana 2 0.3% San Diego County % Ensenada 4 0.5% Rosarito % Other Areas of US % Other Areas of Mexico 4 0.5% Other 1 0.1% TOTAL % To test for perceived time spent at the border, and possible demand for a tolled express lane, participants were asked the two questions presented in the next two tables. Notably, approximately 40 percent indicated that they spent 2:00-4:59 hours in border queues in a typical week, with just over 9 percent estimating 5+ hours (see table below). Table 36. Perceived Wait Time per Week by Respondents In a typical week, approximately how many hours do you estimate that you spend in your vehicle waiting in line at the border? Number of Responses % 0:01-0: % 1:00-1: % 2:00-2: % 3:00-3: % 4:00-4: % 5:00-5: % 6:00-6: % 7:00-7: % 8:00-8: % 9:00-9: % 10:00-10: % 11:00-11: % 12:00-12: % 14:00-14: % 15: % TOTAL % 43
44 In terms of the tolled express lane, over 44 percent (largely SENTRI users) indicated that they wouldn t use it or be willing to pay anything, however another 40 percent stated they would be willing to pay US$2.00 or more (see table below). If a toll-based express lane existed with a wait of fifteen minutes or less, would you use it and how much would you be willing to pay? Number of Responses % Would not use or would not pay % 1-99 Cents % $ % $ % $ % $ % $ % $ % $ % $ % $ % $ or more % Of the 437 respondents that stated they would use the tolled express lane, the majority would use it somewhat infrequently (1-5 times/month); however, nearly 28 percent indicated that they would use it more than 10 times/month (and within this, there is a subset of over 9 percent that stated they would use it more than 20 times/month). The shares of the responses for the potential use for the tolled express lanes are presented in the table below. If this express toll lane existed, in a normal month, how many times would you use it? Number of Responses % 1-5 times /month % 6-10 times /month % times /month % times /month % times /month % times /month % When the previous responses are broken down by lane type, it is clear that the tolled express lanes are more appealing to border crossers that use the Regular lanes, as the following table demonstrates. 44
45 Table 37. Breakdown of Willingness-to-Pay Responses by Lane Type If a toll-based express lane existed with a wait of fifteen minutes or less, would you use it and how much would you be willing to pay? Wouldn't Use 1-99 Cents $ $ $ $ $ $ $ $ $ $ OR MORE Total Calexico West Regular Calexico West SENTRI 21.4% 5.6% 15.6% 9.3% 5.2% 7.1% 16.9% 1.3% 1.5% 0.7% 5.2% 10.1% 100.0% 93.9% 2.8% 1.2% 0.8% 0.0% 0.0% 0.4% 0.0% 0.0% 0.0% 0.0% 0.8% 100.0% Total 44.3% 4.7% 11.1% 6.6% 3.6% 4.8% 11.7% 0.9% 1.0% 0.5% 3.6% 7.1% 100.0% 45
46 Appendix 1: Weighting Methodology The weighted averages of the variables relevant to the study (including averages of expenditures and wages) were generated by using the sample sizes collected in the field and scaling them up to represent actual population sizes, so that when grouped together, the values from the surveyed samples would statistically represent the actual underlying population in terms of proportions of travel modes/lane types and POE crossing volumes. Below is a description of the steps followed to generate these weighted averages: 1. The first step is to obtain averages of the relevant variable from the survey sample for each subpopulation that needs to be weighted. Each subpopulation consists of a combination of a travel mode/lane type (SENTRI, Ready Lane, General Purpose, and pedestrians) and each one of the six POEs. Additionally, for expenditures, residents of Mexico and residents of the US were kept separate because their spending patterns are expected to be different, thus adding this additional variable to the definition of a subpopulation. For the wage variable, that separation was not made, because it appeared that wages of people crossing the border for work were similar enough regardless of which direction they were crossing. The expenditure variable will be used as the example below to outline the steps followed in the weighting process. In step 1 above, the expenditure averages for each of the relevant subpopulations were compiled (a data processing software was used but this can be done with Excel filters too). The result was a set of 38 averages because not all POEs have all lane types. 2. Vehicles are separated from the pedestrians, US residents are separated from Mexico residents, and Imperial County averages are separated from San Diego County averages (there are six groups of averages, but there are many options for formatting these groups in a spreadsheet). 3. The averages are scaled up by combining them across the subpopulations for each table using the right proportions (i.e., weights). The weighting steps can be done in any order of categories, but it is recommended to scale up using the lane types first, then scale up using the POEs. Vehicles in San Diego County crossing from Mexico are used as an example below. a. For each POE, there are between one and three lane types, each with a corresponding annual total border crossing volume for the most recent year (see Appendix B in the RAP workbook). The sum-product of the average expenditure by each lane type for each POE and the most recent annual volume for that same lane type and POE is calculated and then divided by the total annual border crossing volume across all lane types for that POE (i.e., the average expenditure and the border crossing volume for each lane type are multiplied, then these quantities are added; the resulting amount is then divided by the total border crossing volume for the POE, which is the sum of the border crossing volumes for all lane types). b. What results is the average expenditure for vehicles for each POE in San Diego, and the same scaling up process is repeated again, but at the POE level. The sum-product of the average expenditures and the border crossing volumes for each POE is calculated, then divided by the total border crossing volumes for all POEs in San Diego. 46
47 4. The result of the previous steps is one value, the average expenditure for Mexico residents crossing in vehicles in San Diego County. The same procedure is done for each group described above: a. San Diego vehicles for US residents b. San Diego Mexico resident pedestrians c. San Diego US resident pedestrians d. Imperial vehicles for Mexico residents e. Imperial vehicles for US residents f. Imperial Mexico resident pedestrians g. Imperial US resident pedestrians 5. Note that for vehicles, there are two levels of weighting (lane type to POE and POE to county), for pedestrians there is only one (POE to county, since all pedestrians are recorded as a single lane type). Also, for POEs with only one or two lane-types, this procedure still works, because averages and border crossing values are zero for the absent lane types (i.e. the same excel functions can be used) For wages, one level of computational complexity is swapped for another, because there is no separation between US and Mexico residents, but the annual border crossing volumes have to be altered to only those who are crossing the border for work purposes. 1. Border crossing volumes are adjusted by multiplying the annual border crossing volumes by lane type and POE used in the scaling up of expenditures by the percent of crossers who crossed for work purposes. Worker percentages are gathered from the primary trip purpose question, by travel mode and POE (see Appendix C and D in the RAP Workbook for these percentages). At the end, there should be 19 adjusted volumes (6 for pedestrians and 13 for vehicles). 2. Wage averages calculated from the survey sample by county and by travel mode (pedestrian vs. vehicle) are separated. 3. The scaling up process continues as described in step 3 above, beginning with 19 average wage values and 19 worker border crossing volumes that have been adjusted as described in step 1 for this variable. A sum product formula looks like this: (AA 1 XX 1 + AA 2 XX 2 + AA 3 XX 3 ) (XX 1 + XX 2 + XX 3 ) Where averages for lane types or POEs are A i and border crossing volumes for lane types or POEs are X i. In excel, this function looks like this: =sumproduct(a1:a3,b1:b3)/sum(b1:b3) Where the cells A1:A3 are the averages for your subpopulation, and cells B1:B3 are the border crossing volumes. 47
48 Table 38. Border Crossing Volumes Used For Scaling The Survey Responses Pedestrians Northbound Border Crossings, Pedestrian Volumes (2016) Volume Andrade, Imperial County 833,296 Calexico East, Imperial County 253,992 Calexico West, Imperial County 4,270,911 Otay Mesa, San Diego County 3,504,800 San Ysidro, San Diego County 7,382,363 Tecate, San Diego County 673,605 Source: U.S. Department of Transportation, Research and Innovative Technology Administration, Bureau of Transportation Statistics Table 39. Border Crossing Volumes Used For Scaling The Survey Responses Passenger Vehicles Northbound Border Crossings, Vehicle Volumes (2016) Andrade, Imperial County Volume General purpose lane 506,230 Calexico East, Imperial County SENTRI lane 604,147 Ready Lane 2,222,282 General purpose lane 1,003,055 Calexico West, Imperial County SENTRI lane 1,810,340 General purpose lane 2,516,694 Otay Mesa, San Diego County SENTRI lane 1,831,119 Ready Lane 4,097,403 General purpose lane 1,793,742 San Ysidro, San Diego County SENTRI lane 4,664,964 Ready Lane 4,349,713 General purpose lane 4,687,290 Tecate, San Diego County General purpose lane 971,193 Source: U.S. Department of Transportation, Research and Innovative Technology Administration, Bureau of Transportation Statistics 48
49 Appendix 2: Median Statistics for Key Variables In order to provide a better understanding of the statistical distribution of the key variables used in the Economic Impact model, the study also estimated their median values based on the data collected under the SANDAG Border Survey. Median Border-Crossing Trip Spending In general, the survey data indicates that median spending per trip ranges from $50 to $87, across travel modes, border counties, and north and southbound trips. The median crosser 28 living in Mexico spends less per trip than the median crosser living in the U.S. for trips that take place in San Diego County, but the opposite is true for trips that take place in Imperial County. In general, people crossing in Imperial County spend less per trip than people crossing in San Diego County and pedestrians spend less than people driving across the border. The weighted median expenditure per trip is displayed in the table below. Table 40. Median Spending per Border Crossing Trip Median Spending per Border Crossing Trip, Dollars Pedestrians Imperial County San Diego County Crossers Living in Mexico $58 $69 Crossers Living in the U.S. $50 $84 Vehicles Crossers Living in Mexico $72 $82 Crossers Living in the U.S. $69 $87 Median Expenditures of Border-Crossing Travelers by Expenditure Category The SANDAG Border Survey asked border-crossing travelers to break down their trip-related expenditures by broad expenditure categories. The categories considered included entertainment, gas, groceries, hotel, public transportation, restaurants, shopping and a category called other to capture expenditures not listed in the survey. The data collected was analyzed using the place where the respondent reported to live, the county where the POE used to cross is located and the mode for crossing (i.e., pedestrian or vehicles). An analysis of the survey data shows that the median crosser living in Mexico has different expenditure patterns compared to the median crosser living in the U.S. regardless of the mode and the POE used to cross. 29 The median crosser living in Mexico has a high propensity to concentrate expenditures on shopping, while the median crosser living in the U.S. 28 The median crosser is identified as the crosser that would have the same number of crossers in front of him/her and behind him/her if the total number of crossers were sorted (from higher to lower) by the amount of money they spend on a cross-border trip. 29 The median was identified to be the relevant statistic for this variable since it represents a breakdown of the border-crossing trip expenditure variable, whose relevant statistic is the median (as described above). 49
50 diversifies expenditures across categories such as entertainment, groceries, restaurants and shopping regardless of the mode used to cross the border. The median pedestrian living in Mexico has similar expenditure patterns regardless if the crossing takes place through San Diego or Imperial County POEs. In other words, the share of expenditures by category of the median pedestrian crosser living in Mexico that uses a POE in Imperial County is relatively similar to that of the median pedestrian crosser living in Mexico that uses San Diego POEs, even though crossers in San Diego County spend approximately $11 more per trip. Pedestrian crossers living in the U.S. also have similar expenditure patterns for most categories, even though few categories (like entertainment, hotel, and public transportation) differ significantly across the San Diego and Imperial County regions. The median (weighted) expenditures by pedestrians during border-crossing trips is presented in the table below. Table 41. Pedestrian Median Expenditures by Category Imperial County San Diego County Crossers living in Mexico $ $ Entertainment $3 $3 Gas $2 $2 Groceries $10 $10 Hotel $0 $3 Other $1 $2 Public Transportation <$1 $3 Restaurants $5 $7 Shopping $37 $40 Total, all categories $58 $69 Crossers living in the U.S. Entertainment $1 $10 Gas $1 $3 Groceries $16 $16 Hotel $0 $7 Other $4 $7 Public Transportation <$1 $6 Restaurants $13 $16 Shopping $15 $17 Total, all categories $50 $84 As in the case of pedestrians, the median vehicle crosser living in Mexico has similar expenditure patterns regardless of the location of the crossing used to enter the U.S. even though crossers in San Diego County spend approximately $10 more per trip. The percentages on the individual categories, however, show slightly more variation than those of pedestrians living in Mexico, but still concentrate heavily on shopping. Median crossers living in the U.S. diversify their expenditures more compared to median crossers living in Mexico, but the shares 50
51 of expenditures for categories such as gas, groceries and shopping are very similar regardless of the county used to cross. The median (weighted) expenditures by vehicle users during border-crossing trips is presented in the table below. Table 42. Vehicle Users Median Expenditures by Category Imperial County San Diego County Crossers living in Mexico $ $ Entertainment $5 $3 Gas $7 $8 Groceries $14 $11 Hotel $0 $2 Other $2 $2 Public Transportation $0 $0 Restaurants $7 $6 Shopping $36 $50 Total, all categories $72 $82 Crossers living in the U.S. Entertainment $9 $5 Gas $6 $8 Groceries $11 $15 Hotel $2 $5 Other $10 $11 Public Transportation $0 <$1 Restaurants $10 $19 Shopping $20 $24 Total, all categories $69 $87 Alternate Median Spending in Home Country The median expenditure ranges from $43 for pedestrians living in the U.S. and crossing through Imperial County POEs to $81 for vehicle occupants living in Mexico and crossing through POEs in Imperial County. 30 In general, the median crosser living in Mexico has higher average expenditures in their home country than the median crosser living in the U.S. across modes when a border crossing trip is not taken. The exception is the median pedestrian crosser using San Diego POEs, since the median crosser living in the U.S. averages $62 dollars of home expenditure when a border trip is not taken compared to $58 for the median crosser living in Mexico. A possible explanation for this is that the expenditure categories include groceries, shopping and restaurants, which are more expensive in the U.S. The median spending at home if a border trip is not taken is reported in Table It is worth noting that the behavior of home consumption differs by mode and POE location of the forgone crossing. 51
52 Table 43. Median Spending at Home if Border Crossing Trip is Not Taken Median Spending at Home if Border Trip is not taken, per Trip, Dollars Pedestrians Imperial County San Diego County Crossers Living in Mexico $70 $58 Crossers Living in the U.S. $43 $62 Vehicles Crossers Living in Mexico $81 $72 Crossers Living in the U.S. $53 $49 Notice that in the majority of the cases the median expenditure at home if a border trip is not taken is smaller than the average spending for border crossing trips made. The exceptions are pedestrian crossers that live in Mexico and cross through Imperial County POEs and vehicle crossers that live in Mexico and cross through Imperial County, whose at-home median spending if a trip is not taken are higher than their median spending while on a cross-border trip. There could be several explanations to this result, including price differences between goods and services between the two sides of the border that belong to expenditures categories that are less likely to be deferred by this group of border-crossers when a border trip is not taken. Median Expenditures by Expenditure Category If Trip is Not Taken An analysis of the survey data shows that, in general, the median pedestrian crosser that decides not to take a border-crossing trip has a tendency to spend at home primarily on groceries and shopping, regardless of where the crosser lives or the county of crossing. 31 For crossers living in the U.S. and crossing through San Diego County, a category of home expenditure that is also significant is restaurants. The median (weighted) expenditures at home by pedestrians in case a border-crossing trip is not taken are presented in Table As in the case of expenditures of border-crossing trips by category, the relevant statistic for this variable is the median since it consists of the breakdown of another key variable identified by its median (i.e., alternate spending in home country). 52
53 Table 44. Median Expenditures at Home by Pedestrians if Border Crossing Trip is Not Taken Imperial County San Diego County Crossers living in Mexico Entertainment $3 $1 Gas $3 $1 Groceries $11 $15 Hotel $0 $4 Other $2 $8 Public Transportation $0 $6 Restaurants $4 $6 Shopping $48 $18 Total, all categories $70 $58 Crossers living in the U.S. Entertainment $0 $7 Gas $0 $3 Groceries $15 $18 Hotel $0 $0 Other $3 $0 Public Transportation $0 $1 Restaurants $3 $22 Shopping $21 $11 Total, all categories $43 $62 As in the case of the median pedestrian, the median vehicle crosser that decides not to take a border-crossing trip has a tendency to spend at home primarily on groceries and shopping, regardless of where the crosser lives or the county of crossing. However, other categories that also represent significant home expenditure regardless of where the crosser lives or the POE used are gas and restaurants. The median (weighted) expenditures at home by vehicle crossers in case a border-crossing trip is not taken are presented in Table
54 Table 45. Median Expenditures at Home by Vehicle Users if Border Crossing Trip is Not Taken Imperial County San Diego County Crossers living in Mexico Entertainment $11 $3 Gas $9 $9 Groceries $18 $11 Hotel $1 $1 Other $3 $0 Public Transportation $0 $0 Restaurants $10 $9 Shopping $30 $39 Total, all categories $81 $72 Crossers living in the U.S. Entertainment $2 $3 Gas $4 $7 Groceries $9 $13 Hotel $0 $1 Other $10 $1 Public Transportation $0 $0 Restaurants $9 $11 Shopping $18 $14 Total, all categories $53 $49 Median Wages The median monthly wage for a pedestrian crossing the border for work is $758 in San Diego County and $604 in Imperial County. For people driving across the border, the weighted median for Imperial County is around $1,700 while the weighted median for San Diego County is $1,126. Table 46. Median Monthly Wage by Mode and County of Crossing Weighted Median Monthly Wage/Salary, Dollars Imperial County POEs San Diego County POEs Pedestrians crossing for work $604 $758 People crossing in vehicles for work $1,693 $1,126 54
55 Appendix 3: Origins and Destinations of Crossborder Trips The data collected on origin or destination of border crossing trip is presented in this appendix with corresponding maps and graphs. As stated earlier in the report, the results are presented by country where the trip began or ended (i.e., U.S. or Mexico) and by component of the trip (i.e., origin or destination). The survey data for this variable are reflective of respondents crossing via privately-owned vehicle (POV) only. Symbols shown in the maps below are meant to show the overall proportion of trip origins or destinations by jurisdiction and are not a precise representation of actual origin or destination locations. Relevant zones not shown in the graphs below were either not identified as origins or destinations by survey respondents or had proportionate responses of less than 1 percent of the data set. Excluded from the graphs presented below are the following zones and cities in the U.S. for: 1) Origins: Calipatria, Carlsbad, Coronado, Del Mar, Escondido, Holtville, La Mesa, Lemon Grove, National City, Oceanside, Poway, Santee, Solana Beach, Unincorporated Imperial County, Vista, Westmorland, and the external zone that captures other areas in the U.S. outside of these cities. 2) Destinations: Calipatria, Carlsbad, Coronado, Del Mar, Escondido, Holtville, Imperial Beach, La Mesa, Oceanside, Poway, Santee, Vista, Westmorland and the external zone that captures other areas in the U.S. outside of these cities. Crossborder Trip Origins Figure 10. Crossborder Trip Origins, POV Crossers Source: SANDAG Border Survey,
56 Figure 11. Share of Origins in Mexico, POV Crossers 60% 40% 20% 0% Tijuana Mexicali External (Mexico) Source: SANDAG Border Survey, 2016 Algodones Tecate Ensenada Figure 12. Share of Origins in the U.S., POV Crossers 60% 40% 20% 0% City of San Diego Unincorporated San Diego County External (CA) Calexico Imperial Beach El Centro Chula Vista Imperial Brawley External (AZ) Source: SANDAG Border Survey,
 Algodones Tecate Ensenada Source: SANDAG")
57 Crossborder Trip Destinations Figure 13. Crossborder Trip Destinations, POV Crossers Source: SANDAG Border Survey, 2016 Figure 14. Share of Destinations in Mexico, POV Crossers 60% 50% 40% 30% 20% 10% 0% Tijuana Mexicali External (Mexico) Algodones Tecate Ensenada Source: SANDAG Border Survey,
58 Figure 15. Share of Destinations in the U.S., POV Crossers 60% 40% 20% 0% City of San Diego Calexico Chula Vista External, CA El Centro Unincorporated San Diego County Unincorporated Imperial County External, AZ National City Solana Beach Lemon Grove Imperial Brawley Source: SANDAG Border Survey,


59 Appendix 4: Graphs of Total Border Crossing Times Collected in the Field The data collected on total border crossing times is presented in this appendix by vehicle type, POE and lane type. Based on discussions with CBP personnel, the data to produce the summary wait times excludes those observations above 4 hours of total border crossing time. The graphs presented below exclude these outliers. Notice that in the graphs the blue dots represent actual observations and that the graphs aggregate the data from all days when border-crossing times where collected. As a result, a particular time of arrival to the queue may be associated with multiple observations for bordercrossing time (each one of them representing a different date of collection). Since the dates when data was collected include different seasons of the year, this aggregation also explains potential variances observed in border-crossing times for a particular time of arrival to the queue. Passenger Vehicles The graphs for the total border crossing times of passenger vehicles are presented by lane type (southbound flows are treated as a lane type) for each POE in the following order: San Ysidro, Otay Mesa, Tecate, Calexico West, Calexico East and Andrade. SAN YSIDRO POE Note: Data collected on July 1, 4, 5 and October 16 and 17,


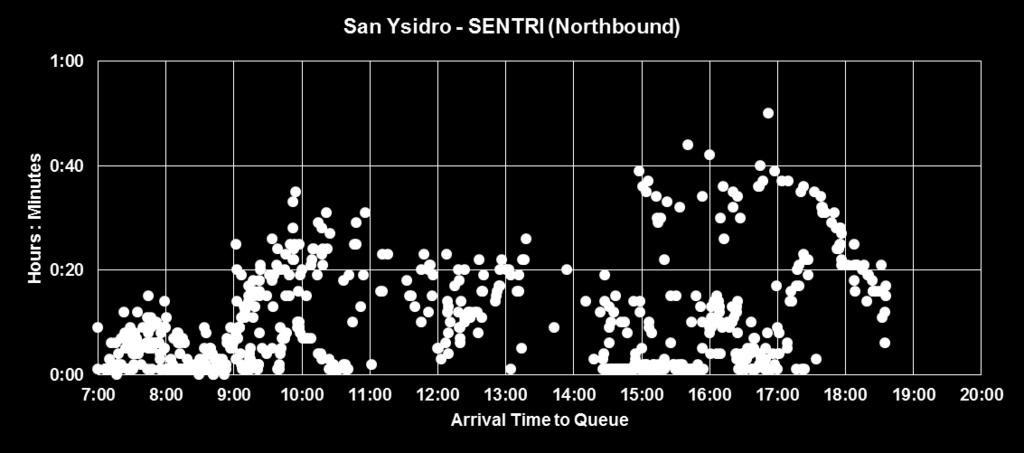
60 Note: Data collected on July 1, 4, 5 and October 16 and 17, 2016 Note: Data collected on July 1, 4, 5 and October 16 and 17,


61 Note: Data collected on July 4, 5 and October 16 and 17, 2016 OTAY MESA POE Note: Data collected on July 1, 4, 5 and October 16 and 17,

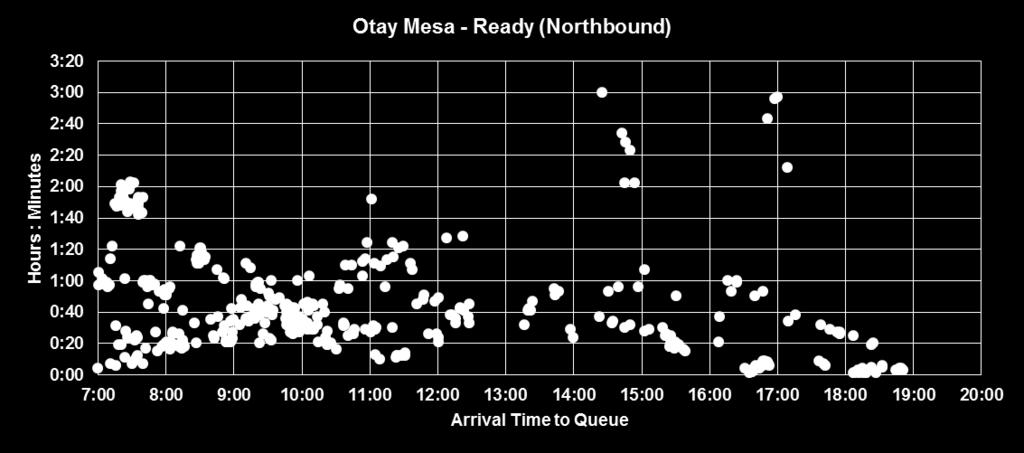
62 Note: Data collected on July 1, 4, 5 and October 16 and 17, 2016 Note: Data collected on July 1, 4, 5 and October 16 and 17,

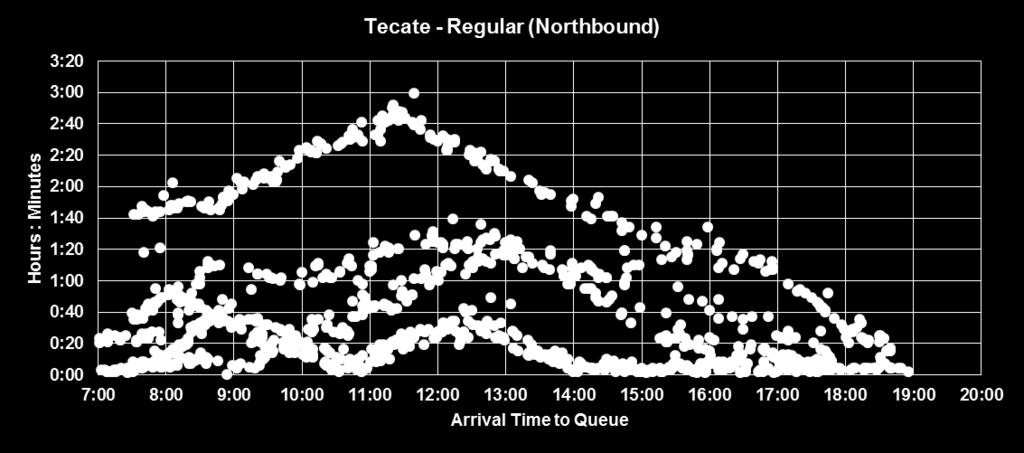
63 Note: Data collected on July 1, 4, 5 and October 16 and 17, 2016 TECATE POE Note: Data collected on July 1, 4, 5 and October 16 and 17,


64 Note: Data collected on July 1, 4, 5 and October 16 and 17, 2016 CALEXICO WEST POE Note: Data collected on July 1, 4, 5 and October 16 and 17,


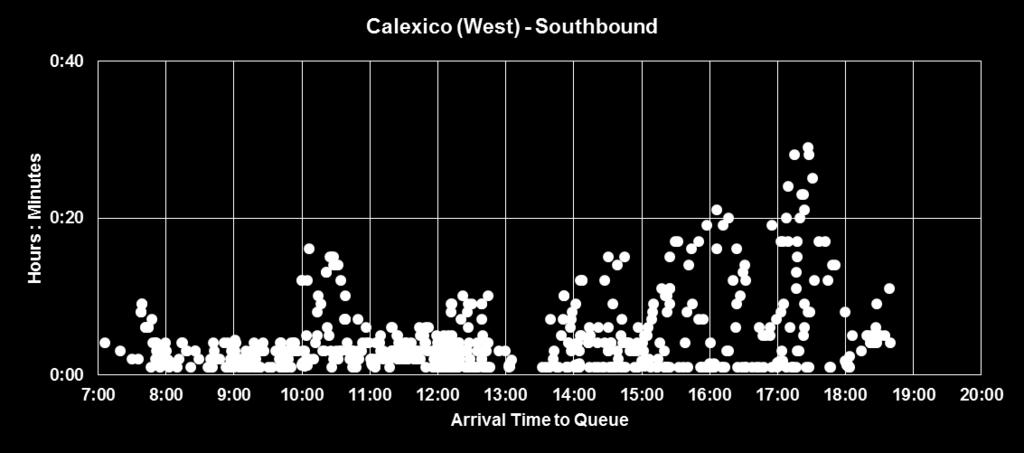
65 Note: Data collected on July 1, 4, 5 and October 16 and 17, 2016 Note: Data collected on July 1, 4, 5 and October 16 and 17,


66 CALEXICO EAST POE Note: Data collected on July 1, 4, 5 and October 16 and 17, 2016 Note: Data collected on July 1, 4, 5 and October 16 and 17,

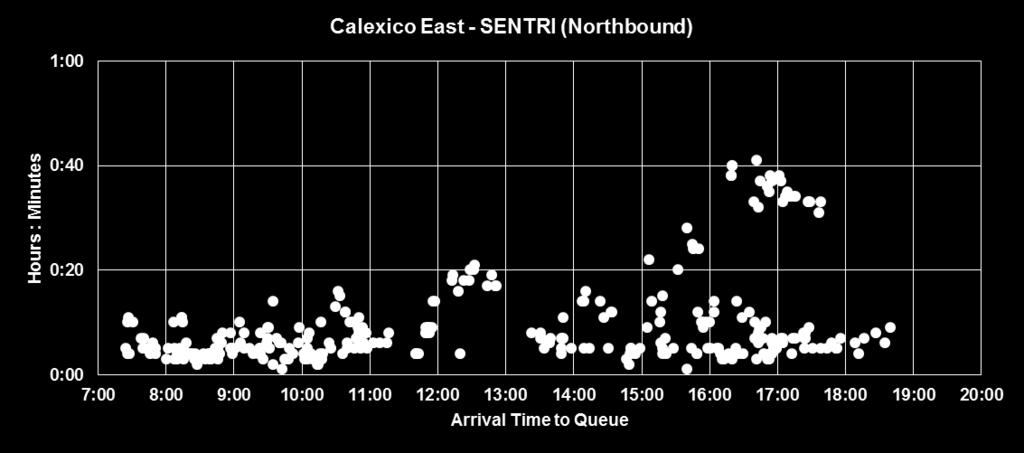
67 Note: Data collected on July 1, 4, 5 and October 16 and 17, 2016 Note: Data collected on July 1, 4, 5 and October 16 and 17,

 for each POE in the following order: Otay Mesa, Tecate, Calexico East and Andrade.")
68 ANDRADE POE Note: Data collected on July 1, 4, 5 and October 16 and 17, 2016 Note: Data collected on July 1, 4, 5 and October 16 and 17, 2016 Commercial Vehicles The graphs for the total border crossing times of commercial vehicles are presented by lane type (southbound flows are treated as a lane type) for each POE in the following order: Otay Mesa, Tecate, Calexico East and Andrade. 68


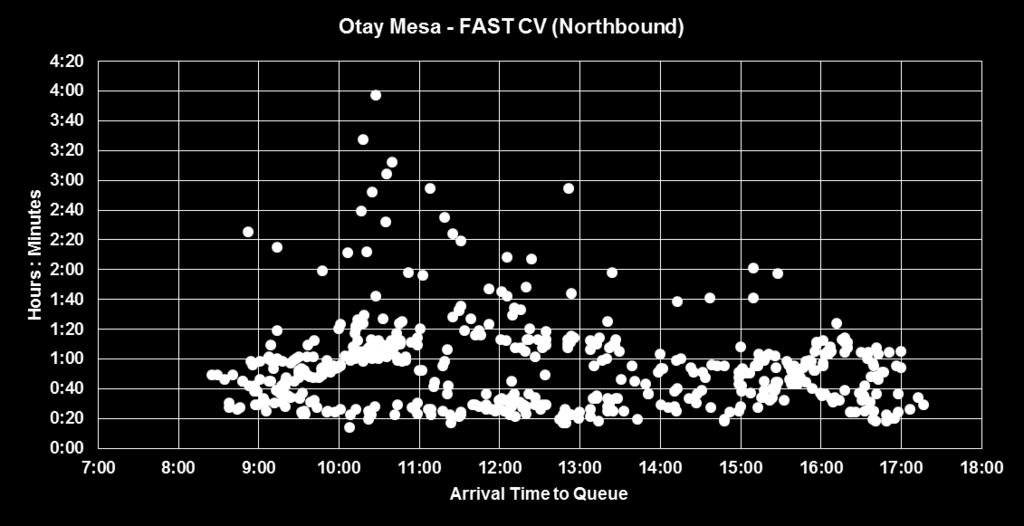
69 OTAY MESA POE Note: Data collected on February 10, 13, 14 and March 8 and 9, 2017 Note: Data collected on February 10, 13, 14 and March 8 and 9,


70 Note: Data collected on February 10, 13, 14 and March 8 and 9, 2017 TECATE POE Note: Data collected on October 12, 13 and 14, 2016 and March 1 and 2,


71 Note: Data collected on October 12, 13 and 14, 2016 and March 1 and 2, 2017 CALEXICO EAST POE Note: Data collected on October 19, 20 and 21, 2016 and March 1 and 2,


72 Note: Data collected on March 1 and 2, 2017 Note: Data collected on October 19, 20 and 21, 2016 and March 1 and 2,
Conducted for. Estimating Economic Impacts of Border Wait Times at the San Diego-Baja California Region. April 6, Research you can trust.
 Estimating Economic Impacts of Border Wait Times at the San Diego-Baja California Region Conducted for April 6, 2005 Research you can trust. The direction you seek. The attention you deserve. Introduction
COMMITTEE ON BINATIONAL REGIONAL OPPORTUNITIES
 San Diego Association of Governments COMMITTEE ON BINATIONAL REGIONAL OPPORTUNITIES September 4, 2018 AGENDA ITEM NO.: 7 Action Requested: INFORMATION 2017 SAN DIEGO BAJA CALIFORNIA BORDER CROSSING File
COMMITTEE ON BINATIONAL REGIONAL OPPORTUNITIES
 San Diego Association of Governments COMMITTEE ON BINATIONAL REGIONAL OPPORTUNITIES September 5, 2017 AGENDA ITEM NO.:6 Action Requested: INFORMATION 2016 SAN DIEGO BAJA CALIFORNIA BORDER CROSSING File
Regional Border Crossing Trends & Economic Impacts
 3,500,000 San Ysidro Monthly Cros Passengers and Pedestrian 3,000,000 2,500,000 2,000,000 1,500,000 1,000,000 500,000 0 Jan-06 Apr-06 Jul-06 Oct-06 Jan-07 Apr-07 Jul-07 Oct-07 Jan-08 Apr-08 Jul-08 Oct-08
I 5 South Multimodal Corridor Study. Appendix B. Issue Statement
 I 5 South Multimodal Corridor Study Appendix B I-5 SOUTH MULTIMODAL CORRIDOR STUDY ISSUE STATEMENT JUNE 5, 2009 PROJECT DESCRIPTION The goal of the Interstate 5 (I-5) South Multimodal Corridor Study is
ITS at the Border. Technologies, Strengths/Weaknesses & Why It s Important
 ITS at the Border Technologies, Strengths/Weaknesses & Why It s Important About Y2K Engineering Founded in 2017 by Yung Koprowski Headquartered in Gilbert, AZ Y2K is a transportation planning and civil
2017 SAN DIEGO-BAJA CALIFORNIA BORDER CROSSING AND TRADE STATISTICS
 2017 SAN DIEGO-BAJA CALIFORNIA BORDER CROSSING AND TRADE STATISTICS SAN DIEGO-BAJA CALIFORNIA LAND POES San Ysidro / Puerta México - El Chaparral Otay Mesa / Mesa de Otay Tecate / Tecate Cross Border Xpress
APPENDIX D - APPENDIX E - APPENDIX F - APPENDIX G - APPENDIX H
 Appendices APPENDIX A - CROSSING VOLUMES AND WAIT TIMES APPENDIX B - DOCUMENT REVIEW APPENDIX C - STUDY AREA AND MAJOR DESTINATIONS APPENDIX D - NETWORK CONNECTIVITY ASSESSMENT APPENDIX E - NETWORK AMENITIES
Cross-Border Transportation
 Cross-Border Transportation Monterrey, Mexico May 8th & 9th, 2006 Pedro Orso-Delgado, Director Caltrans District 11 Outline California/Baja California Border Region Border Reality Trade Statistics Institutional
4-71. Tecate / Tecate. Ports of Entry Tecate Pedestrian/ Transit Facilities
 Figure 4.17: Roadway and Interchange and Non-Motorized Modes of Crossborder Travel Projects - Tecate-Tecate POE California-Baja California 2014 Border Master Plan Update Non-Motorized Facilties Interchange
Economic Impact Study: Otay Mesa East Port of Entry. e RB. conomic research bureau
 Economic Impact Study: Otay Mesa East Port of Entry e RB Executive Summary This study estimates the economic impact from the construction of an additional Port of Entry (POE) on the U.S.- Mexico border
FINAL REPORT SAN DIEGO REGION-BAJA CALIFORNIA CROSS-BORDER TRANSPORTATION STUDY
 FINAL REPORT SAN DIEGO REGION-BAJA CALIFORNIA CROSS-BORDER TRANSPORTATION STUDY Prepared for SAN DIEGO ASSOCIATION OF GOVERNMENTS Prepared by PARSONS TRANSPORTATION GROUP In Association with CIC RESEARCH
Zones of Hope. Challenges and Opportunities in Improving U.S.-Mexico Border Economic Micro-Zones. Project Preview
 Zones of Hope Challenges and Opportunities in Improving U.S.-Mexico Border Economic Micro-Zones Project Preview July 2016 1 Research Team Erik Lee, Rick Van Schoik and Siria Alvarez, North American Research
Contributions to NAFTA COMMENT PERIOD
 SMART BORDER COALITION SAN DIEGO-TIJUANA 2508 Historic Decatur Road, Suite 130 San Diego, CA 92106 Contributions to NAFTA COMMENT PERIOD The San Diego Tijuana Smart Border Coalition appreciates the opportunity
THREE UNIT, RETAIL/OFFICE OPPORTUNITY
 THREE UNIT, RETAIL/OFFICE OPPORTUNITY 161 W. SAN YSIDRO BLVD SAN YSIDRO, CA 92173 Anthony Acosta, BRE# 01900150 Advisor 619.658.1103 anthony.acosta@svn.com CalBRE #01900150 Jorge Jimenez, BRE# 01413353
MEXICO U.S. BORDER INFRASTRUCTURE
 MEXICO U.S. BORDER INFRASTRUCTURE Sean Carlos Cázares Ahearne Deputy Director General for Border Affairs Mexico s Ministry of Foreign Affairs (SRE) Future of North American Infrastructure North American
THE IMPACT ON THE U.S. ECONOMY OF CHANGES IN WAIT TIMES AT PORTS OF ENTRY
 National Center for Risk and Economic Analysis of Terrorism Events University of Southern California THE IMPACT ON THE U.S. ECONOMY OF CHANGES IN WAIT TIMES AT PORTS OF ENTRY by Bryan Roberts, Nathaniel
San Diego Regional Briefing I-5 South Realignment Communications Plan
 San Diego Regional Briefing I-5 South Realignment Communications Plan GSA Public Buildings Service 50 United Nations Plaza, San Francisco, CA www.gsa.gov 2 3 Project Overview PHASE 1E VATC WEST PED GSA
2017 Nonresident Visitation, Expenditures & Economic Impact Estimates
 University of Montana ScholarWorks at University of Montana Institute for Tourism and Recreation Research Publications Institute for Tourism and Recreation Research 3-2018 2017 Nonresident Visitation,
SMART BORDER COALITION
 SMART BORDER COALITION SAN DIEGO-TIJUANA The World s Largest Bi-National Metropolitan Area More then 5 million citizens! Mission Statement To help assure border efficiency between the Californias. What
THE TIJUANA-SAN DIEGO CROSS BORDER MARKET
 2014 MEDIA KIT THE TIJUANA-SAN DIEGO CROSS BORDER MARKET IN 2013, AN AVERAGE OF 42 MILLION INDIVIDUALS CROSSED THE BORDER FROM TIJUANA INTO SAN DIEGO SHOPPING IS THE #1 MOTIVE FOR INDIVIDUALS CROSSING
City and County of San Francisco. Office of the Controller City Services Auditor. City Services Benchmarking Report: Jail Population
 City and County of San Francisco Office of the Controller City Services Auditor City Services Benchmarking Report: Jail Population February 21, 2013 CONTROLLER S OFFICE CITY SERVICES AUDITOR The City Services
Survey Results Summary
 Survey Results Summary January 28, 2014 FINAL Introduction As part of the Public Outreach Task for VTrans 2040, an online survey was designed and administered to residents of the Commonwealth. The purpose
MEETING NOTICE AND AGENDA
 MEETING NOTICE AND AGENDA COMMITTEE ON BINATIONAL REGIONAL OPPORTUNITIES The Committee on Binational Regional Opportunities (COBRO) may take action on any item appearing on this agenda. Tuesday, November
San Diego Association of Governments BORDERS COMMITTEE
 San Diego Association of Governments BORDERS COMMITTEE July 22, 2005 AGENDA ITEM NO.: 1 Action Requested: APPROVE File Number 3003200 JOINT MEETING OF THE BORDERS COMMITTEE AND THE COMMITTEE ON BINATIONAL
San Diego Association of Governments BORDERS COMMITTEE. BORDERS COMMITTEE DISCUSSION AND ACTIONS Meeting of February 24, 2006
 April 28, 2006 San Diego Association of Governments BORDERS COMMITTEE AGENDA ITEM NO.: 1a Action Requested: APPROVE BORDERS COMMITTEE DISCUSSION AND ACTIONS Meeting of February 24, 2006 The regularly scheduled
ASIC 2018 Penelope (Jenny) Quintana San Diego State University School of Public Health. Pictured David Flores, Casa Familiar
 Quintana San Diego State University School of Public Health. Pictured David Flores, Casa Familiar") ASIC 2018 Penelope (Jenny) Quintana San Diego State University School of Public Health Pictured David Flores, Casa Familiar X San San Ysidro Ysidro Port of Port of Entry Entry Pollution Concerns Freeways
ASIC 2018 Penelope (Jenny) Quintana San Diego State University School of Public Health Pictured David Flores, Casa Familiar X San San Ysidro Ysidro Port of Port of Entry Entry Pollution Concerns Freeways
THE ARIZONA-MEXICO RELATIONSHIP
 THE ARIZONA-MEXICO RELATIONSHIP An Overview By: Luis Ramirez Thomas, MSFS Tucson, Arizona September 1, 2011 OUR BORDER National negative perception of the border National and global perception of Arizona
Influence of Consumer Culture and Race on Travel Behavior
 PAPER Influence of Consumer Culture and Race on Travel Behavior JOHANNA P. ZMUD CARLOS H. ARCE NuStats International ABSTRACT In this paper, data from the National Personal Transportation Survey (NPTS),
NOVEMBER visioning survey results
 NOVEMBER 2016 visioning survey results 2 Denveright SECTION 1 SURVEY INTRODUCTION OVERVIEW Our community is undertaking an effort that builds upon our successes and proud traditions to design the future
NAFTA II: California Border Zone Land Transportation Issues
 MTI Report 01-06 Norman Y. Mineta International Institute for Surface Transportation Policy Studies Created by Congress in 1991 NAFTA II: California Border Zone Land Transportation Issues San Jos é State
A New Vision for the Border
 A New Vision for the Border Senator Eliot Shapleigh 800 Wyoming, Suite A El Paso, Texas 79902 (915) 544-1990 Texas has the 2nd busiest land port and 6 of the top busiest ports on the U.S.-Mexico border
info Poverty in the San Diego Region SANDAG December 2013
 info December 2013 SANDAG Poverty in the San Diego Region Table of Contents Overview... 3 Background... 3 Federal Poverty Measurements... 4 Poverty Status for Individuals in the San Diego Region... 6 Demographic
Container Cast 44, Creating Border Environment 2014
 Speaker: Time: Text: This is ContainerCast from the Center for International Trade and Transportation at California State University, Long Beach. I m Mat Kaplan, and I ll be talking once again with Tom
Economic Linkages and Impact Analysis for the Oregon Sea Grant Programmed and Operated Hatfield Marine Science Center Visitor Center
 Economic Linkages and Impact Analysis for the Oregon Sea Grant Programmed and Operated Hatfield Marine Science Center Visitor Center Oregon State University Extension Service June 2017 Bruce Sorte, Extension
Second Binational Summit
 Second Binational Summit of the United States-Mexico Border Mayors Association Tijuana, B.C., February 09, 2012 Joint Declaration XX Ayuntamiento de Tijuana SECOND BINATIONAL SUMMIT OF THE UNITED STATES-MEXICO
U.S. Customs and Border Protection
 U.S. Customs and Border Protection Protecting America by Securing Our Borders Adele J. Fasano, Director San Diego Field Office November 2005 CBP secures America s borders to protect the American people
Telephone Survey. Contents *
 Telephone Survey Contents * Tables... 2 Figures... 2 Introduction... 4 Survey Questionnaire... 4 Sampling Methods... 5 Study Population... 5 Sample Size... 6 Survey Procedures... 6 Data Analysis Method...
THE BUSINESS CLIMATE INDEX SURVEY 2008
 THE BUSINESS CLIMATE INDEX SURVEY 2008 Prepared by: The Steadman Group, Riverside Drive, P.O. Box 68230 00200 Nairobi, Tel: 44450190-6, October, 2008 1 Summary of Main Findings 1. Introduction In meeting
For whom the city? Housing and locational preferences in New Zealand
 Chapter 2 For whom the city? Housing and locational preferences in New Zealand Nick Preval, Ralph Chapman & Philippa Howden-Chapman New Zealand was once famously described as the quarter-acre pavlova paradise,
OFFICE OF THE CONTROLLER. City Services Auditor 2005 Taxi Commission Survey Report
 OFFICE OF THE CONTROLLER City Services Auditor 2005 Taxi Commission Survey Report February 7, 2006 TABLE OF CONTENTS INTRODUCTION 3 SURVEY DATA ANALYSIS 5 I. The Survey Respondents 5 II. The Reasonableness
How s Life in Mexico?
 How s Life in Mexico? November 2017 Relative to other OECD countries, Mexico has a mixed performance across the different well-being dimensions. At 61% in 2016, Mexico s employment rate was below the OECD
Survey sample: 1,013 respondents Survey period: Commissioned by: Eesti Pank Estonia pst. 13, Tallinn Conducted by: Saar Poll
 Survey sample:,0 respondents Survey period:. - 8.. 00 Commissioned by: Eesti Pank Estonia pst., Tallinn 9 Conducted by: Saar Poll OÜ Veetorni, Tallinn 9 CHANGEOVER TO THE EURO / December 00 CONTENTS. Main
Metro Atlanta Workforce:
 Metro Atlanta Workforce: Industries in Demand & Opportunity Occupations October, 2018 Atlanta Regional Commission For more information, contact: cdegiulio@atlantaregional.org In Sum In looking at a more
The economic impact of the University of Exeter s international students
 The economic impact of the University of Exeter s international students APRIL 2010 Contents Executive summary 1 1. Introduction 3 1.1. The brief 3 2. Economic impact of the University of Exeter s international
Borders Committee Agenda
 Members Serge Dedina, Chair Mayor, City of Imperial Beach (Representing South County) Ed Gallo, Vice Chair Councilmember, City of Escondido (Representing North County Inland) David Alvarez Councilmember,
Follow this and additional works at: Part of the Transportation Commons
 San Jose State University SJSU ScholarWorks Mineta Transportation Institute Publications 8-1-1999 Impact of the North American Free Trade Agreement on Transportation in the Border Areas of the United States:
NATIONAL HOUSEHOLD SURVEY: LABOUR FORCE, EMPLOYMENT, AND INCOME
 Clause No. 15 in Report No. 1 of was adopted, without amendment, by the Council of The Regional Municipality of York at its meeting held on January 23, 2014. 15 2011 NATIONAL HOUSEHOLD SURVEY: LABOUR FORCE,
14. General functions, powers and duties of department. Effective: April 1, 2005
 14. General functions, powers and duties of department Effective: April 1, 2005 The department, by or through the commissioner or his duly authorized officer or employee, shall have the following general
Immigrants strengthen Colorado s economy, generating $42 billion of activity in 2011
 Immigrants strengthen Colorado s economy, generating $42 billion of activity in 2011 February 14, 2013 By Christopher Stiffler Economist Executive Summary The foreign-born population is a growing presence
City of Janesville Police Department 2015 Community Survey
 City of Janesville Police Department 2015 Community Survey Presentation and Data Analysis Conducted by: UW-Whitewater Center for Political Science & Public Policy Research Susan M. Johnson, Ph.D. and Jolly
THE ECONOMIC IMPACTS OF MEXICAN VISITORS TO ARIZONA: 2001
 THE ECONOMIC IMPACTS OF MEXICAN VISITORS TO ARIZONA: 2001 Alberta H. Charney, Ph.D. and Vera K. Pavlakovich - Kochi, Ph.D. * July 2002 Economic and Business Research Program Karl Eller College of Business
Visit Sarasota County
 Visit Sarasota County Economic Impact of Tourism: Fiscal Year 2017 Presentation Purpose of Economic Impact Research Document Inform Marketing Inspire Communicate 2 Tourism Matters to Sarasota County $2,989,923,750
Greater Washington Transportation Issues Survey
 4/16/2016 Greater Washington Transportation Issues Survey April 18, 2016 Conducted December 1-5, 2015 1 Greater Washington Transportation Issues Survey Page 1 Survey Overview The Northern Virginia Transportation
ETC REPORT VISA POLICY AND CHINESE TRAVEL TO EUROPE
 ETC REPORT VISA POLICY AND CHINESE TRAVEL TO EUROPE Brussels, November 2018 Copyright 2018 European Travel Commission All rights reserved. The contents of this report may be quoted, provided the source
In the National Interest The U.S. Presidential Permit Process, Cross-border Trade and the U.S. Economy
 In the National Interest The U.S. Presidential Permit Process, Cross-border Trade and the U.S. Economy 1 U.S. Customs and Border Protection Photo of the Bridge of the Americas, El Paso, Texas. Photo by
YEAR END PROGRESS REPORT-2013
 SMART BORDER COALITION San Diego-Tijuana YEAR END PROGRESS REPORT-2013 ENVISION THE BORDER AS IT SHOULD BE OPPORTUNITY COMES FROM A SEAMLESS INTERNATIONAL REGION WHERE ALL CITIZENS WORK TOGETHER FOR MUTUAL
This memo was published originally as Appendix C to the 1996 Report of the Governor s Advisory Task Force on Civil Justice Reform.
 This memo was published originally as Appendix C to the 1996 Report of the Governor s Advisory Task Force on Civil Justice Reform. M E M O R A N D U M TO: FROM: Governor s Task Force on Civil Justice Reform
Economic Impacts of the South Denali Implementation Plan
 Economic Impacts of the South Denali Implementation Plan prepared for: National Park Service and Planning and Land Use Department, Matanuska-Susitna Borough prepared by: Steve Colt Nick Szymoniak Institute
Community Economic Impact Study of the Proposed Kenosha-Racine-Milwaukee (KRM) Commuter Rail
 Commuter Rail") Institute for Survey and Policy Research P. O. Box 413 Milwaukee, WI 53201 Community Economic Impact Study of the Proposed Kenosha-Racine-Milwaukee (KRM) Commuter Rail Prepared by the Institute for Survey
Institute for Survey and Policy Research P. O. Box 413 Milwaukee, WI 53201 Community Economic Impact Study of the Proposed Kenosha-Racine-Milwaukee (KRM) Commuter Rail Prepared by the Institute for Survey
The Impact of Foreign Workers on the Labour Market of Cyprus
 Cyprus Economic Policy Review, Vol. 1, No. 2, pp. 37-49 (2007) 1450-4561 The Impact of Foreign Workers on the Labour Market of Cyprus Louis N. Christofides, Sofronis Clerides, Costas Hadjiyiannis and Michel
Mexico Outreach -Travel Packet Leave prepared
 Mexico Outreach -Travel Packet Leave prepared 1. Things to Bring 2. Driver s Info for the Outreach 3. Directions to the Orphanage: Guys Version 4. Directions to the Orphanage: Girls Version 5. Contact
Lesson 1: Migration, Traditions, and Population
 Lesson 1: Migration, Traditions, and Population Focus Questions: What are some of your family s cultural and religious traditions? When and why did your family come to San Diego? What is the population
Release of 2006 Census results Labour Force, Education, Place of Work and Mode of Transportation
 Backgrounder Release of 2006 Census results Labour Force, Education, Place of Work and Mode of Transportation On March 4, 2008 Statistics Canada released further results from the 2006 census focusing on
The Economy of Gunnison County
 THE ENTERPRISE RESEARCH INSTITUTE The Economy of Gunnison County A Report Prepared for Gunnison Valley Futures by Paul Holden Version F3 ERI 601 North Taylor Street Gunnison, CO 81230 T Work Phone 970
How would you describe Libertyville as a community?
 APPENDIX B PUBLIC PARTICIPATION RESULTS APPENDIX B B.1 Key Person Interviews B.2 Downtown Focus Group B.3 Community Survey B.4 Input from Key Constituent Groups B.1 KEY PERSON INTERVIEWS Key person interviews
Appendix A: Economic Development and Culture Trends in Toronto Data Analysis
 Appendix A: Economic Development and Culture Trends in Toronto Data Analysis Introduction The proposed lenses presented in the EDC Divisional Strategy Conversation Guide are based in part on a data review.
Origin & Destination Study
 Sierra Vista Metropolitan Planning Organization Origin & Destination Study Contract MPO-06 February 14, 2017 Prepared for: Sierra Vista Metropolitan Planning Organization Prepared by: Lee Engineering,
ANNUAL SURVEY REPORT: REGIONAL OVERVIEW
 ANNUAL SURVEY REPORT: REGIONAL OVERVIEW 2nd Wave (Spring 2017) OPEN Neighbourhood Communicating for a stronger partnership: connecting with citizens across the Eastern Neighbourhood June 2017 TABLE OF
POVERTY in the INLAND EMPIRE,
 POVERTY in the INLAND EMPIRE, 2001-2015 OCTOBER 15, 2018 DAVID BRADY Blum Initiative on Global and Regional Poverty, School of Public Policy, University of California, Riverside ZACHARY PAROLIN University
Safety and Justice Challenge: Interim performance measurement report
 Safety and Justice Challenge: Interim performance measurement report Jail Measures CUNY Institute for State and Local Governance February 5, 218 1 Table of contents Introduction and overview of report
Immigrant Legalization
 Technical Appendices Immigrant Legalization Assessing the Labor Market Effects Laura Hill Magnus Lofstrom Joseph Hayes Contents Appendix A. Data from the 2003 New Immigrant Survey Appendix B. Measuring
ACKNOWLEDGEMENTS. Special thanks for advisory contributions on this issue from
 ACKNOWLEDGEMENTS ARIZONA-MEXICO ECONOMIC INDICATORS ANNUAL REPORT 2016 PREPARED BY Vera Pavlakovich-Kochi, Ph.D., Senior Regional Scientist Maile L. Nadelhoffer, Senior Research Economist and Webmaster
SB001_L.084 HOUSE COMMITTEE OF REFERENCE AMENDMENT Committee on Transportation & Energy. SB be amended as follows:
 SB001_L.084 HOUSE COMMITTEE OF REFERENCE AMENDMENT Committee on Transportation & Energy. SB18-001 be amended as follows: 1 Amend reengrossed bill, strike everything below the enacting clause and 2 substitute:
Short-term International Migration Trends in England and Wales from 2004 to 2009
 Short-term International Migration Trends in England and Wales from 2004 to 2009 Simon Whitworth, Konstantinos Loukas and Ian McGregor Office for National Statistics Abstract Short-term migration estimates
The Bayt.com Middle East and North Africa Salary Survey May 2013
 The Bayt.com Middle East and North Africa Salary Survey 2013 May 2013 Objective The research was conducted to gauge employee satisfaction of their current salaries and factors affecting thereof. The key
TRANSPORTATION COMMITTEE
 San Diego Association of Governments TRANSPORTATION COMMITTEE July 15, 2011 AGENDA ITEM NO.: 1 Action Requested: APPROVE TRANSPORTATION COMMITTEE DISCUSSION AND ACTIONS MEETING OF JUNE 17, 2011 The meeting
UNWTO Statistics Capacity Building Program WORKSHOP IV November 2009 Vienna, Austria
 UNWTO Statistics Capacity Building Program WORKSHOP IV 18-20 November 2009 Vienna, Austria Reporting on main challenges remaining for continuing progress in measuring INBOUND TOURISM DijanaMili, MinistryofTourism
How s Life in Switzerland?
 How s Life in Switzerland? November 2017 On average, Switzerland performs well across the OECD s headline well-being indicators relative to other OECD countries. Average household net adjusted disposable
How s Life in the United States?
 How s Life in the United States? November 2017 Relative to other OECD countries, the United States performs well in terms of material living conditions: the average household net adjusted disposable income
Special Report: Trade and Travel Patterns at the Canada-US Border: Policy Implications
 Western Washington University Western CEDAR Border Policy Research Institute Publications Border Policy Research Institute 2009 Special Report: Trade and Travel Patterns at the Canada-US Border: Policy
CONNECTING NORTH AMERICA: U.S. ROAD BORDER NEEDS
 CONNECTING NORTH AMERICA: U.S. ROAD BORDER NEEDS Special thanks to the following CAGTC Member Organizations for donating their time and resources for the development of this paper: Kootenai Metropolitan
How s Life in Portugal?
 How s Life in Portugal? November 2017 Relative to other OECD countries, Portugal has a mixed performance across the different well-being dimensions. For example, it is in the bottom third of the OECD in
Chile s average level of current well-being: Comparative strengths and weaknesses
 How s Life in Chile? November 2017 Relative to other OECD countries, Chile has a mixed performance across the different well-being dimensions. Although performing well in terms of housing affordability
Policy Analysis Report
 CITY AND COUNTY OF SAN FRANCISCO BOARD OF SUPERVISORS BUDGET AND LEGISLATIVE ANALYST 1390 Market Street, Suite 1150, San Francisco, CA 94102 (415) 552-9292 FAX (415) 252-0461 Policy Analysis Report To:
Do you generally feel closer to the...
 Life in Hampton Roads Survey Press Release #6 Politics This report examines regional perceptions of political figures and political affiliation from the 2017 Life In Hampton Roads survey (LIHR 2017) conducted
YG Network Congressional District Poll: December Topline Results
 YG Network Congressional District Poll: December 2013 Topline Results Methodology: This YG Network Congressional District Poll was conducted from December 13-17, 2013, among a sample of 1,652 likely voters
International Mobility & Trade Corridor Program Steering Committee Meeting Summary. April 19, Meeting packet available at: theimtc.
 International Mobility & Trade Corridor Program Steering Committee Meeting Summary April 19, 2018 Meeting packet available at: theimtc.com/meetings Meeting location The meeting was held at Douglas Port-of-Entry,
MEETING NOTICE AND AGENDA
 MEETING NOTICE AND AGENDA COMMITTEE ON BINATIONAL REGIONAL OPPORTUNITIES The Committee on Binational Regional Opportunities (COBRO) may take action on any item appearing on this agenda. Tuesday, June 7,
Selected ACE: Data Distributions Investigation 1: #13, 17 Investigation 2: #3, 7 Investigation 3: #8 Investigation 4: #2
 Selected ACE: Data Distributions Investigation 1: #13, 17 Investigation 2: #3, 7 Investigation 3: #8 Investigation 4: #2 ACE Problem Investigation 1 13. a. The table below shows the data for the brown
Improving the accuracy of outbound tourism statistics with mobile positioning data
 1 (11) Improving the accuracy of outbound tourism statistics with mobile positioning data Survey response rates are declining at an alarming rate globally. Statisticians have traditionally used imputing
UK Data Archive Study Number International Passenger Survey, 2016
 UK Data Archive Study Number 8016 - International Passenger Survey, 2016 Article Travel trends: 2016 Travel trends is an annual report that provides estimates and profiles of travel and tourism visits
Understanding Transit s Impact on Public Safety
 Understanding Transit s Impact on Public Safety June 2009 401 B Street, Suite 800 San Diego, CA 92101-4231 Phone 619.699.1900 Fax 619.699.1905 Online www.sandag.org UNDERSTANDING TRANSIT S IMPACT ON PUBLIC
4.A.16-2 Federal Legislation House Measure Author Topic Status Summary CCTA Position TBD Shuster Transportation Reauthorization Not yet introduced (NY
 Contra Costa Transportation Authority STAFF REPORT Meeting Date: September 17, 2014 Subject Summary of Issues Legislative Update This is an update on relevant developments in policy, legislation and finance
TECHNICAL ADVISORY COMMITTEE AGENDA N. Imperial Ave., Suite 1 El Centro, CA 92243
 TECHNICAL ADVISORY COMMITTEE AGENDA DATE: Thursday, February 26, 2015 TIME: LOCATION: 10:00 a.m. 12:00 p.m. Offices 1405 N. Imperial Ave., Suite 1 El Centro, CA 92243 Chairperson: Bill Brunet, County of
How s Life in Austria?
 How s Life in Austria? November 2017 Austria performs close to the OECD average in many well-being dimensions, and exceeds it in several cases. For example, in 2015, household net adjusted disposable income
Preliminary Effects of Oversampling on the National Crime Victimization Survey
 Preliminary Effects of Oversampling on the National Crime Victimization Survey Katrina Washington, Barbara Blass and Karen King U.S. Census Bureau, Washington D.C. 20233 Note: This report is released to
PLEASE CERTIFY THAT YOU MEET THE ELIGIBILITY CRITERIA BY CHECKING THE BOXES
 PLEASE CERTIFY THAT YOU MEET THE ELIGIBILITY CRITERIA BY CHECKING THE BOXES I am a woman journalist Journalism is my full-time profession I have 3+ years of professional reporting experience I AM A (SELECT
2015 Constitutional Committee Proposed Changes
 2015 al Committee Proposed Changes Proposed Change #1 ARTICLE 3 Membership 3. Any Member of this Local promoted to a supervisory position may retain their membership without voice or voting privileges.
State of the World by United Nations Indicators. Audrey Matthews, Elizabeth Curtis, Wes Biddle, Valery Bonar
 State of the World by United Nations Indicators Audrey Matthews, Elizabeth Curtis, Wes Biddle, Valery Bonar Background The main objective of this project was to develop a system to determine the status