Board Standing Committee Meeting Public Session
|
|
|
- Avis Eaton
- 5 years ago
- Views:
Transcription
1 Board Standing Committee Meeting Public Session 1. Approval of Agenda Monday, May 5, 2008 Board Room 7:00 p.m. 2. Special Announcements 3. Public Forum 4. NEW BUSINESS Pages a) School Council Recognition Verbal - Dr. J.M. Denison Secondary School b) Delegation Arts York Parent Group Verbal re: Transportation - David Ruuskanen - Braedon Quarles c) Census 2006 Initial Report Robert Dunn, Superintendent of Education d) Naming of New Elementary School, Whitchurch Stouffville - Denese Belchetz, Coordinating Superintendent of Education e) Cash Disbursements, March Bruce Richardson, Associate Director of Education 5. Adjournment
2 YORK REGION DISTRICT SCHOOL BOARD Census 2006 Initial Results Background: The 2006 census data has been analyzed at the municipal level. This data demonstrates the shifts that have occurred in the region, both in terms of the growth but also in the characteristics of residents. Currently, the data is available only by municipality and does not yet include family income data. However, the data does paint a picture of the changing demographic of York Region. In September, the comprehensive data set will be available at the Distribution Area (DA) level (by the first three digit of the postal code). On the basis of this data, staff will be in a position to make recommendations which will identify our high needs schools based on Socio-Economic Status indicators and the resources which will support their improvement. As well, as the DA level data is analyzed, staff will generate school profiles which document the make up of the school community to support the school planning process. The Board is a partner in a consortium with the Region of York, the York Region District Catholic School Board, the United Way and Children s Aid to purchase the census data and disseminate its findings. We participate in a process of creating and disseminating reports based on the census data which supports different community agencies and businesses in York Region. Rationale: As the Board continues to grow the census provides clear data with respect to the changing nature of the communities served by the Board. An understanding of that data allows staff to target programs and services to this changing demographic. Estimated Cost: The Initial cost to the Board was $10,000 as part of the consortium. Timeline: In the fall, the Distribution Area data will have been analyzed. Staff will use that data to inform decisions with respect to our Performance Plus program as well as other considerations resulting from the data. Recommendation: That the York Region District School Board receive the report of the Census 2006 Initial Results for information. Communications Implementation Plan: Leading Edge will be used to highlight some of the significant changes in the population of the region. Respectfully submitted, Robert Dunn Date May 5, Attachment. For further information, please contact (contact name) or the Director of Education.
3 1
4 Purpose Preliminary observations about what the 2006 Census is telling us about York Region s community trends 2


5 York Region s Growing Quickly What does it look like? Between 2001 and 2006 York Region: Grew by 22% to 892,712 (as of May, 2006). Fastest growing Census Division in Ontario and third fastest in Canada Had the highest growth rate for all age groups in Ontario Immigrant population accounts for about 60% of the growth between 2001 and 2006 In 2006, the number of Aboriginals represents 0.4% of York Region s total population. Same as


6 What s the 2006 Census Telling Us About Our Residents? Age Groups Median age of York Region residents is 37.5 Number of children between 0 14 years increased by 14% and youth years increased by 24% 1 in 10 residents in York Region are seniors, compared to one in seven Canadians in this age group 63% residents over 80 years old are women and a high proportion live alone 4


7 What are the characteristics of York Region residents? Families Number of families increased by 23% and the number of lone parent families grew by 37% 12% of children live in lone parent families majority led by women 83% of families are married couples and majority have children highest proportion in Canada. In comparison, 46% of Canadian couples are married with children Vaughan, Markham and Richmond Hill rank 2nd, 3rd and 4th in Canada for the highest proportion of married couples with children 5


8 What are the characteristics of York Region residents? People with Disabilities The number of people with disabilities increased by an estimated 49,700 ( 55%) 6


9 Housing The Housing Market Continues to Tighten In 2006 there were approximately 276,000 private dwellings in York Region compared to 223,000 in 2001 York Region has highest proportion of owned dwellings (88%) and lowest proportion of rental dwellings (12%) in GTA Average household size in York Region is 3.2 people per household impacting transportation patterns (2006 Transportation for Tomorrow Survey) 7


10 Immigration and Citizenship Source: Statistics Canada, Census 1991, 1996, 2001 and


11 Immigration and Citizenship Immigrant Population Continues to Grow Between 2001 and 2006 the number of immigrants living in York Region grew by 34% from 283,790 to 380,535. This is the highest growth rate in the GTA The number of recent immigrants increased by 7%. York Region has the third largest number of recent immigrants in the GTA 9

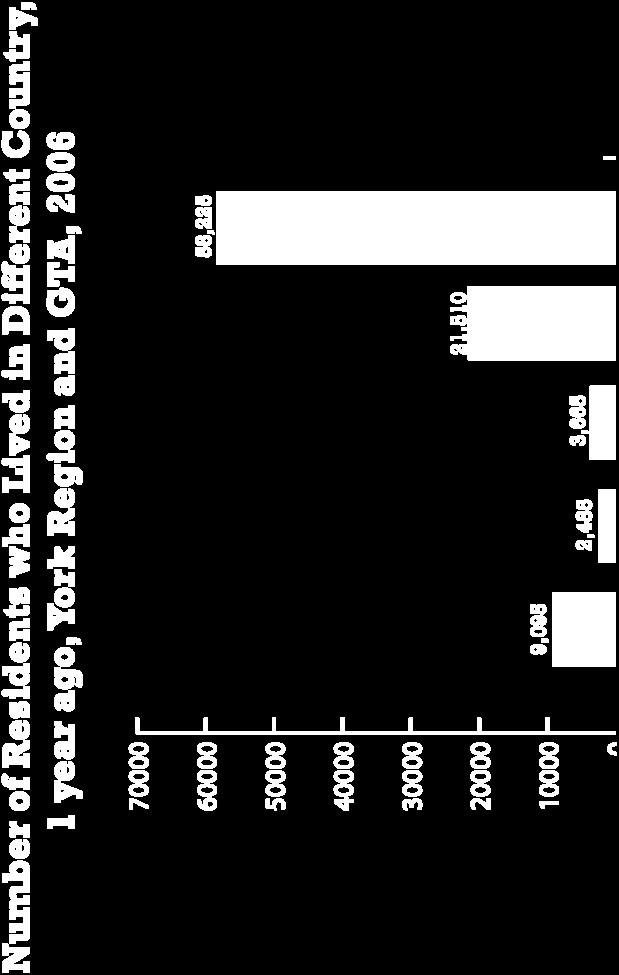


12 Mobility 10


13 Language Continues to Diversify Knowledge of Official Language and Home Language Approximately 35,000 York Region residents have no knowledge of English or French 18% of all people 65 years and over have no knowledge of English or French The number of residents who speak a nonofficial language at home has increased by 152% since 2001 The top five non-official languages spoken in York Region homes are: Chinese languages, Italian, Russian, Persian, and Tamil 11


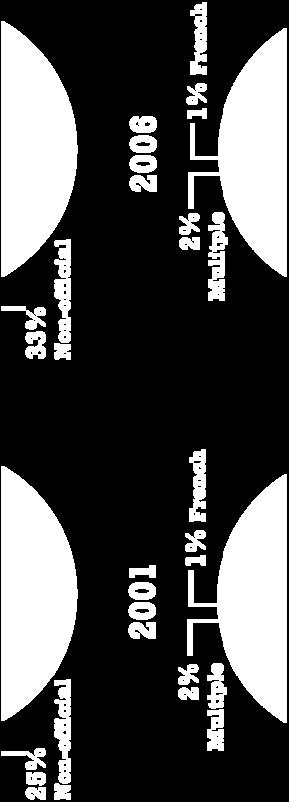
14 York Region s Language Diversity Mother Tongue 12

15 Diversification among the Nine Local Municipalities 13


16 Diversification among the Nine Local Municipalities Family and Household Trends In 2006, Georgina had the highest proportion of lone parents at 16%. Georgina also had the highest proportion of people living alone at 19% Whitchurch-Stouffville had the highest median age at 42.2 years whereas Vaughan had the youngest median age at 35.9 years 14
, Markham (21%), Richmond Hill (15%) and Aurora (5%) Five municipalities")

17 Diversification among the Nine Local Municipalities Age Groups The highest growth rate for children under 15 was in Vaughan (27%), Markham (21%), Richmond Hill (15%) and Aurora (5%) Five municipalities are experiencing a decrease in the number of people between 0 14 years but an increase in the number of people above age 65 years Vaughan, Markham, Richmond Hill and Aurora have growth in all age groups 15


18 Diversification among the Nine Local Municipalities Diverse Housing Stock 16


19 Diversification among the Nine Local Municipalities Immigration and Language Trends The number of recent immigrants in Newmarket almost doubled Aurora had the highest growth rate for all immigrants 57% of Markham s residents are foreign born the 2nd highest proportion in Canada 2001 to 2006 The municipalities with a significant number of residents with no knowledge of English or French are Markham, Vaughan and Richmond Hill 17
20 What s Driving Change? Immigration and growing cultural groups Attractiveness of suburbia to traditional families Aging population Key economic drivers such as employment opportunities Close proximity to Toronto and the benefits of being near Canada s largest city Current housing options influences type of growth we re seeing Transportation network changing 18
21 YORK REGION DISTRICT SCHOOL BOARD Naming of a New Elementary School Town of Whitchurch-Stouffville Background: To obtain approval to name the elementary school located at the intersection of Hoover Drive and Sandiford Drive in the Town of Whitchurch-Stouffville. Rationale: The York Region District School Board is scheduled to open a new elementary school in Whitchurch-Stouffville in September The site is located at the intersection of Hoover Drive and Sandiford Drive. The attendance area for this new elementary school was established and approved by the Board in January While Oscar Peterson was recognized as a great jazz pianist throughout the world, in Canada he was also seen as a leading personage and statesman. This can be seen in the acclaim and awards he received, especially in the last twenty or so years of his life. He was made an Officer of the Order of Canada in 1972, and promoted to Companion, its highest rank, in He was also a member of the Order of Ontario, a Chevalier of the National Order of Quebec, and an officer of the Ordre des Arts et des Lettres of France. From 1991 to 1994 Peterson was chancellor of York University in Toronto. He received honourary doctorates from many Canadian universities: Carleton University, Queen's University, Concordia University, McMaster University, Mount Allison University, the University of Victoria, the University of Western Ontario, York University, the University of Toronto, and the Université Laval, as well as from Northwestern University in the United States. As such, Oscar Peterson Public School is the name for this new elementary school which is recommended in this report. Estimated Cost: Not applicable. Timeline: Immediate. Recommendation: That the York Region District School Board approve the name Oscar Peterson Public School for the unnamed public elementary school located at the intersection of Hoover Drive and Sandiford Drive in the Town of Whitchurch-Stouffville. Communications Implementation Plan: Coordinating Council of Superintendents April 16, 2008 Board Standing Committee May 5, 2008 Board May 29, 2008 Respectfully submitted, May 5, 2008 For further information, please contact Gayle Brocklebank-Vincent, Superintendent of Education Community Education Centre East, Denese Belchetz, Coordinating Superintendent of Education, or the Director of Education, Bill Hogarth.
22 YORK REGION DISTRICT SCHOOL BOARD REPORT OF CASH DISBURSEMENTS MARCH 2008 Background: To report to the Board s Standing Committee the Cash Disbursements for the month of March 2008 for the York Region District School Board. Rationale: Section 170 (3) of the Education Act R.S.O. 1990, c. E. 2 states that every board shall give the necessary orders on the treasurer for payment of all money expended for school purposes and of such other expenses for promoting the interests of the schools under the jurisdiction of the board. Estimated Cost: Not applicable. Time Line: Immediate. Recommendation: Staff recommends: 1. That Cash Disbursements for March 2008 for all expenditures, except item # 26, in the sum of $9,113, be approved. 2. That Cash Disbursements for March 2008 for item # 26, in the sum of $76,417, be approved. Appended Data: Respectfully submitted, Report of Cash Disbursements March May 5, 2008 For further information please contact B. A. Richardson or the Director of Education.
23 The Over 15,000 Report for the month of March 2008 COMPANY LOCATION DESCRIPTION AMOUNT TOTAL 1 Aurora Cable Education Centre Internet Access March and April 2008 $ 25, Braywood Services Inc. Various Water line repairs $ 81, CDI Computer Dealers Inc. Richmond Rose Public School Computers $ 18, Giant Steps Education Centre Educational Services - February and March 2008 $ 100, Hewlett-Packard (Canada) Co. Various Computers $ 62, Hill Supplies Various Electrical and related supplies $ 17, Lake Simcoe Region Conservation Authority Various Visit to Natural Resources Education Centre - partially recoverable $ 20, Lake Simcoe Region Conservation Authority Education Centre Board share of salaries and benefits for Natural Resources Education Centre $ 15, OARBS Software Corporation Education Centre OARBS / Web based resource booking software and licenses $ 50, Optimira Controls Inc. Dr. Denison Secondary School Temperature and mechanical control system replacement $ 64, Pneumatemp Systems Ltd. Various Annual ventilator service $ 16, Richmond Hill Chinese Community Church Education and Community Services Cancelled permit, refund issued $ 33, Rogers Business Solutions Education Centre Wide area network costs $ 39, Shepell.fgi Limited Partnership Education Centre EAP Installment - March 2008 $ 15, Sheraton Parkway Toronto North Curriculum & Instructional Services Literacy Collaborative - Continuous Improvement Session $ 32, SRB Education Solutions Inc. Education Centre Trillium training and on-site support $ 21, The Tartan Painters Huron Heights Secondary School Painting $ 21, The York Region Administrator's Council Education Centre Professional Development funds for 07/08 school year $ 284, TSMJC Properties Inc. York Region Learning Connections Rent March and April 2008 $ 38, Workplace Safety & Insurance Board Education Centre Workplace Safety & Insurance Board payments $ 26, Workplace Safety & Insurance Board Education Centre Physician Fees/Administration Charge $ 22, Wynn Family Properties Education and Community Services Rent March and April 2008 $ 32, York Catholic District School Board Education Centre Transportation Consortium Expenditures - Qtrly $ 125, YRDSB - Capital Fund Education Centre Transfer of funds to Capital $ 3,000, Total Disbursements under 15,000 $ 4,948, Disbursements by type Debentures $ - Transportation $ 3,924, Payroll deductions $ 35,723, Utilities - telephone $ 73, gas $ 1,122, water $ 13, waste $ 47, hydro $ 1,057, fuel $ 29, Net payroll $ 34,425, $ 9,113, Total disbursements by type $ 76,417, Grand Total $ 85,530,761.55
NATIONAL HOUSEHOLD SURVEY: LABOUR FORCE, EMPLOYMENT, AND INCOME
 Clause No. 15 in Report No. 1 of was adopted, without amendment, by the Council of The Regional Municipality of York at its meeting held on January 23, 2014. 15 2011 NATIONAL HOUSEHOLD SURVEY: LABOUR FORCE,
YORK REGION. Let s Talk Inclusion: Creating Strong, Caring, Safe Communities. Your Insights on York Region s Diverse Communities
 YORK REGION Creating Strong, Caring, Safe Communities Let s Talk Inclusion: Your Insights on York Region s Diverse Communities LEADING CHANGE FOR A STRONGER COMMUNITY LET S TALK INCLUSION WORKBOOK We want
REVISED AGENDA TRANSPORTATION AND WORKS COMMITTEE REGULAR MEETING
 Regional Clerk s Office CORPORATE SERVICES DEPARTMENT REVISED AGENDA TRANSPORTATION AND WORKS COMMITTEE Committee Room "A" Wednesday, Administrative Centre 17250 Yonge Street Newmarket, Ontario 9:00 a.m.
Fanshawe Neighbourhood Profile
 Fanshawe Profile For further information contact: John-Paul Sousa Planning Research Analyst Direct: (519) 661-2500 ext. 5989 I email: jpsousa@london.ca Page 1 Page 2 Population Characteristics & Age Distribution
Bostwick Neighbourhood Profile
 Bostwick Profile For further information contact: John-Paul Sousa Planning Research Analyst Direct: (519) 661-2500 ext. 5989 I email: jpsousa@london.ca Page 1 Page 2 Population Characteristics & Age Distribution
CENSUS BULLETIN #5 Immigration and ethnocultural diversity Housing Aboriginal peoples
 CENSUS BULLETIN #5 Immigration and ethnocultural diversity Housing Aboriginal peoples October 25, 217 Bulletin Highlights: 86.1 per cent of the Brampton s 216 surveyed population held a Canadian citizenship
Simcoe County Census 2016 Update. Prepared by Research Analyst
 Simcoe County Census 2016 Update Prepared by Research Analyst Census 2016 Update 1. Census 2016 2. Population Growth 3. Children 0-6 years 4. Census Families 5. Median Household Income 6. Prevalence of
Corporate. Report COUNCIL DATE: April 28, 2008 NO: R071 REGULAR COUNCIL. TO: Mayor & Council DATE: April 28, 2008
 Corporate NO: R071 Report COUNCIL DATE: April 28, 2008 REGULAR COUNCIL TO: Mayor & Council DATE: April 28, 2008 FROM: General Manager, Planning and Development FILE: 6600-01 SUBJECT: 2006 Census Information
CITY OF MISSISSAUGA. Overview 2-1. A. Demographic and Cultural Characteristics
 Portraits of Peel Overview 2-1 A. Demographic and Cultural Characteristics Population: Size, Age and Growth 2-2 Immigrants 2-3 Visible Minorities 2-4 Language 2-5 Religion 2-6 Mobility Status 2-7 B. Household
BRAMALEA. Overview A. Demographic and Cultural Characteristics
 The Social Planning Council of Peel Portraits of Peel BRAMALEA Overview 13-1 A. Demographic and Cultural Characteristics Population: Size, Age and Growth 13-2 Immigrants 13-3 Visible Minorities 13-4 Language
Social and Demographic Trends in Burnaby and Neighbouring Communities 1981 to 2006
 Social and Demographic Trends in and Neighbouring Communities 1981 to 2006 October 2009 Table of Contents October 2009 1 Introduction... 2 2 Population... 3 Population Growth... 3 Age Structure... 4 3
1 YORK REGION'S APPLICATION FOR THE LOCAL IMMIGRATION PARTNERSHIPS INITIATIVE
 1 THE REGIONAL MUNICIPALITY OF YORK REPORT NO. 1 OF THE COMMISSIONER OF COMMUNITY AND HEALTH SERVICES For Consideration by The Council of The Regional Municipality of York on February 21, 2008 1 YORK REGION'S
Demographics. Chapter 2 - Table of contents. Environmental Scan 2008
 Environmental Scan 2008 2 Ontario s population, and consequently its labour force, is aging rapidly. The province faces many challenges related to a falling birth rate, an aging population and a large
North York City of Toronto Community Council Area Profiles 2016 Census
 Bar Chart showing the rate of population growth between the years 2006 and 2016 for the Ward compared to the City of based on the 2006 and data. For more information, please contact Michael Wright at 416-392-7558
20 Court Services Annual Report 2015
 Clause 20 in Report No. 11 of Committee of the Whole was adopted, without amendment, by the Council of The Regional Municipality of York at its meeting held on June 23, 2016. 20 Court Services Annual Report
people/hectare Ward Toronto
 Bar Chart showing the rate of population growth between the years 2006 and 2016 for the Ward compared to the City of based on the 2006 and data. For more information, please contact Michael Wright at 416-392-7558
We hope you find this report useful. It is available online at the websites of each of the contributing organizations:
 1 Over half of Ontario s population lives and works in the province s central region. With high rates of immigration, commuting and re-location based on life stage, the region is often on the move. In
Census 2016 Summary Results Part 1
 Census 2016 Summary Results Part 1 Press conference, Government Buildings 6 th April 2017 Reminder Census Day : Sunday April 24 th 2016 Just over 2 million dwellings visited by 5,000 staff Preliminary
Release of 2006 Census results Labour Force, Education, Place of Work and Mode of Transportation
 Backgrounder Release of 2006 Census results Labour Force, Education, Place of Work and Mode of Transportation On March 4, 2008 Statistics Canada released further results from the 2006 census focusing on
Verdun borough HIGHLIGHTS. In 1996, the Verdun borough had a population of 59,714. LOCATION
 Socio-economic profile borough February 2002 HIGHLIGHTS In 1996, the borough had a population of 59,714. LOCATION Between 1991 and 1996, the population of the borough declined by 2.6%. One-person households
Ward 17 Davenport City of Toronto Ward Profiles 2016 Census
 Bar Chart showing the rate of population growth between the years 2006 and 2016 for the Ward compared to the City of based on the 2006 and data. For more information, please contact Michael Wright at 416-392-7558
Ward 4 Etobicoke Centre City of Toronto Ward Profiles 2016 Census
 Bar Chart showing the rate of population growth between the years 2006 and 2016 for the Ward compared to the City of based on the 2006 and data. For more information, please contact Michael Wright at 416-392-7558
Scarborough City of Toronto Community Council Area Profiles 2016 Census
 Bar Chart showing the rate of population growth between the years 2006 and 2016 for the Ward compared to the City of based on the 2006 and data. For more information, please contact Michael Wright at 416-392-7558
Population and Dwelling Counts
 Release 1 Population and Dwelling Counts Population Counts Quick Facts In 2016, Conception Bay South had a population of 26,199, representing a percentage change of 5.4% from 2011. This compares to the
COMMUNITY PROFILE COQUITLAM. Coquitlam Immigrant Demographics I Page 1
 COMMUNITY PROFILE COQUITLAM Coquitlam Demographics I Page 1 COQUITLAM IMMIGRANT DEMOGRAPHICS Your quick and easy look at facts and figures around immigration. Newcomers are an important and growing part
(Note: These are inititial neighbourhood estimates and are subject to change.) SCARBOROUGH SHORELINE. NEI Score. 1,500 Female 53%
 SCARBOROUGH SHORELINE. NEI Score. 1,500 Female 53%") 0-4 5-9 10-14 15-19 20-24 25-29 30-34 35-39 40-44 45-49 50-54 55-59 60-64 65-69 70-74 75-79 80-84 85-89 90-94 95-99 100+ 2011 Neighbourhood Demographic Estimates HIGHLAND CREEK WEST HIGHLAND CREEK KINGSTON
0-4 5-9 10-14 15-19 20-24 25-29 30-34 35-39 40-44 45-49 50-54 55-59 60-64 65-69 70-74 75-79 80-84 85-89 90-94 95-99 100+ 2011 Neighbourhood Demographic Estimates HIGHLAND CREEK WEST HIGHLAND CREEK KINGSTON
Immigrant PORT COQUITLAM, B.C Port Coquitlam Immigrant Demographics I
 Immigrant demographics PORT COQUITLAM, B.C. - 2018 Immigrant Demographics I Page 1 PORT COQUITLAM IMMIGRANT DEMOGRAPHICS Your quick and easy look at facts and figures around immigration. Newcomers are
Artists and Cultural Workers in Canadian Municipalities
 Artists and Cultural Workers in Canadian Municipalities Based on the 2011 National Household Survey Vol. 13 No. 1 Prepared by Kelly Hill Hill Strategies Research Inc., December 2014 ISBN 978-1-926674-36-0;
MONITORING THE METROS: A MUCH-AWAITED 2011 UPDATE
 THE METRO BEAT TD Economics MONITORING THE METROS: A MUCH-AWAITED 211 UPDATE The 211 National Household Survey release on May 8 th provides a demographic and diversity update across Canada. This is the
The population universe (target population) of the 2011 Census includes the following groups:
 of the 2011 Census includes the following groups:") Glossary DEMOGRAPHICS Population The population universe includes variables that provide information about individuals, covering demographic characteristics and language. See Figure 16 for a list of these
Glossary DEMOGRAPHICS Population The population universe includes variables that provide information about individuals, covering demographic characteristics and language. See Figure 16 for a list of these
STRENGTHENING RURAL CANADA: Fewer & Older: Population and Demographic Crossroads in Rural Saskatchewan. An Executive Summary
 STRENGTHENING RURAL CANADA: Fewer & Older: Population and Demographic Crossroads in Rural Saskatchewan An Executive Summary This paper has been prepared for the Strengthening Rural Canada initiative by:
(Note: These are inititial neighbourhood estimates and are subject to change.) NEI Score. 1,000 Female 52%
 NEI Score. 1,000 Female 52%") 0-4 5-9 10-14 15-19 20-24 25-29 30-34 35-39 40-44 45-49 50-54 55-59 60-64 65-69 70-74 75-79 80-84 85-89 90-94 95-99 100+ 2011 Neighbourhood Demographic Estimates EGLINTON AVE E C P R DON VALLEY PARKWAY
0-4 5-9 10-14 15-19 20-24 25-29 30-34 35-39 40-44 45-49 50-54 55-59 60-64 65-69 70-74 75-79 80-84 85-89 90-94 95-99 100+ 2011 Neighbourhood Demographic Estimates EGLINTON AVE E C P R DON VALLEY PARKWAY
Chairman and Members of the Planning and Development Committee. Thomas S. Mokrzycki, Commissioner of Planning and Building
 CD.15.DAT DATE: TO: FROM: SUBJECT: Chairman and Members of the Planning and Development Committee Thomas S. Mokrzycki, Commissioner of Planning and Building Mississauga: A City of Many Cultures MEETING
(Note: These are inititial neighbourhood estimates and are subject to change.) 1,000 Female 54%
 1,000 Female 54%") LAWRENCE AVE E 0-4 5-9 10-14 15-19 20-24 25-29 30-34 35-39 40-44 45-49 50-54 55-59 60-64 65-69 70-74 75-79 80-84 85-89 90-94 95-99 100+ 2011 Neighbourhood Demographic Estimates RAILSIDE RD C P R DON RIVER
LAWRENCE AVE E 0-4 5-9 10-14 15-19 20-24 25-29 30-34 35-39 40-44 45-49 50-54 55-59 60-64 65-69 70-74 75-79 80-84 85-89 90-94 95-99 100+ 2011 Neighbourhood Demographic Estimates RAILSIDE RD C P R DON RIVER
new westminster, B.C New Westminster Immigrant Demographics I
 Immigrant demographics new westminster, B.C. - 2018 Immigrant Demographics I Page 1 new westminster IMMIGRANT DEMOGRAPHICS Your quick and easy look at facts and figures around immigration. Newcomers are
Social Profile of Oakville An Overview
 Social Profile of Oakville An Overview Prepared by Community Development Halton Funding support provided by the United Way of Oakville 2004 Community Development Halton, all rights reserved. Copies of
TOWNSHIP OF LANGLEY, B.C Township of Langley Immigrant Demographics I
 Immigrant demographics TOWNSHIP OF LANGLEY, B.C. - 2018 Township of Langley Immigrant Demographics I Page 1 TOWNSHIP OF LANGLEY IMMIGRANT DEMOGRAPHICS Your quick and easy look at facts and figures around
Immigrant. coquitlam, B.C Coquitlam Immigrant Demographics I
 Immigrant demographics coquitlam, B.C. - 2018 Immigrant Demographics I Page 1 coquitlam IMMIGRANT DEMOGRAPHICS Your quick and easy look at facts and figures around immigration. Newcomers are an important
2011 National Household Survey Profile on the Town of Richmond Hill: 1st Release
 2011 National Household Survey Profile on the Town of Richmond Hill: 1st Release Every five years the Government of Canada through Statistics Canada undertakes a nationwide Census. The purpose of the Census
Aboriginal Peoples in Canada: First Nations People, Métis and Inuit
 Aboriginal Peoples in Canada: First Nations People, Métis and Inuit 2011 National Household Survey (NHS) Social and Aboriginal Statistics September 16, 2013 Main analytical document Aboriginal Peoples
Ward 14 Parkdale-High Park City of Toronto Ward Profiles 2016 Census
 Bar Chart showing the rate of population growth between the years 2006 and 2016 for the Ward compared to the City of based on the 2006 and data. For more information, please contact Michael Wright at 416-392-7558
York Region will receive over 300 Syrian refugees by end of 2016
 Office of the Commissioner Community and Health Services Department Memorandum To: From: Members of Committee of the Whole Adelina Urbanski Commissioner of Community and Health Services Date: October 6,
STRENGTHENING RURAL CANADA: Fewer & Older: The Coming Population and Demographic Challenges in Rural Newfoundland & Labrador
 STRENGTHENING RURAL CANADA: Fewer & Older: The Coming Population and Demographic Challenges in Rural Newfoundland & Labrador An Executive Summary 1 This paper has been prepared for the Strengthening Rural
Statistical portrait of English-speaking immigrants in Québec
 Statistical portrait of English-speaking immigrants in Québec Lorna Jantzen in collaboration with Fernando Mata February 2012 Research and Evaluation The views and opinions expressed in this document are
STRENGTHENING RURAL CANADA: Fewer & Older: Population and Demographic Challenges Across Rural Canada A Pan-Canadian Report
 STRENGTHENING RURAL CANADA: Fewer & Older: Population and Demographic Challenges Across Rural Canada A Pan-Canadian Report This paper has been prepared for the Strengthening Rural Canada initiative by:
2011 CENSUS & NATIONAL HOUSEHOLD SURVEY CITY OF BRAMPTON - WARD 3 PROFILE
 2011 CENSUS & NATIONAL HOUSEHOLD SURVEY CITY OF BRAMPTON WARD 3 PROFILE WARD HIGHLIGHTS Population 47,500 2011 Population 50.7% Females 2011 Population by Age Group 13% 18% 014 9.07% of total population
COMMUNITY PROFILE BURNABY
 COMMUNITY PROFILE BURNABY Burnaby Demographics I Page 1 BURNABY IMMIGRANT DEMOGRAPHICS Your quick and easy look at facts and figures around immigration. Newcomers are an important and growing part of your
Visit our Publications and Open Data Catalogue to find our complete inventory of our freely available information products.
 Welcome to Mississauga Data This report and other related documents can be found at www.mississauga.ca/data. Mississauga Data is the official City of Mississauga website that contains urban planning related
Introduction... i. Population Family Structure Education Mobility Status... 7
 Table of Contents Introduction... i Population... 2 Family Structure... 5 Education... 6 Mobility Status... 7 Ethnicity, Language, Immigrants and Visible Minority... 9 ward three Labour Force Characteristics...13
Spryfield Highlights. Household Living Arrangements. The following are highlights from the 2016 Census.
 Highlights The following are highlights from the 2016 Census., as defined for United Way's Action for Neighbourhood Change, had a Census population of 11,700 in 2016. The outline shown to the right, and
The Chinese Community in Canada
 Catalogue no. 89-621-XIE No. 001 ISSN: 1719-7376 ISBN: 0-662-43444-7 Analytical Paper Profiles of Ethnic Communities in Canada The Chinese Community in Canada 2001 by Colin Lindsay Social and Aboriginal
Community Social Profile Cambridge and North Dumfries
 Community Trends for 2013 in Cambridge, North Dumfries, Wellesley, Wilmot and Woolwich Community Social Profile - Cambridge and North Dumfries Published December 2014 Community Social Profile Cambridge
Changing Faces Profile of Burlington Newcomers. November 2010
 Changing Faces Profile of Burlington Newcomers November 2010 2010 Community Development Halton, all rights reserved. Copies of this document may be reproduced non-commercially for the purpose of community
If this information is required in an accessible format, please contact ext. 2564
 If this information is required in an accessible format, please contact 1-800-372-1102 ext. 2564 From: Report: Date: Commissioner of Planning and Economic Development #2018-INFO-53 April 13, 2018 Subject:
Immigrant DELTA, B.C Delta Immigrant Demographics I
 Immigrant demographics DELTA, B.C. - 2018 Immigrant Demographics I Page 1 DELTA IMMIGRANT DEMOGRAPHICS Your quick and easy look at facts and figures around immigration. Newcomers are an important and growing
2011 CENSUS & NATIONAL HOUSEHOLD SURVEY CITY OF BRAMPTON - WARD 10 PROFILE
 2011 CENSUS & NATIONAL HOUSEHOLD SURVEY CITY OF BRAMPTON WARD 10 PROFILE WARD HIGHLIGHTS Population 10.72% of total population 56,185 2011 Population 33 Median Age 50.1% Females 49.9% Males 2011 Population
IMMIGRANTS AND VISIBLE MINORITIES IN PEEL
 THE SOCIAL PLANNING COUNCIL OF PEEL ISSN #1198-5976 I n f o S h a r e VOLUME 11, NUMBER 1 MAY 2003 IMMIGRANTS AND VISIBLE MINORITIES IN PEEL Information on cultural diversity within a population is important
MINUTES OF COUNCIL FEBRUARY 21, 2002 MINUTES OF COUNCIL
 MINUTES OF COUNCIL OF THE REGIONAL MUNICIPALITY OF YORK February 21, 2002 The Regional Council met at 9:35 a.m. in the Council Chambers, York Region Administrative Centre, 17250 Yonge Street, Newmarket,
Introduction... i. Population Family Structure Education Mobility Status... 7
 Table of Contents Introduction... i Population... 2 Family Structure... 5 Education... 6 Mobility Status... 7 ward two Ethnicity, Language, Immigrants and Visible Minority... 9 Labour Force Characteristics...13
Vaughan Community Health Centre Community Profiles
 Vaughan Community Health Centre Community Profiles Prepared by Public Interest Strategy and Communications May 2009 Table of Contents Vaughan Stories to Tell...3 Concord Neighbourhood Profile...19 Kleinburg
22 UPDATE ON THE IMPLEMENTATION OF THE YORK REGION IMMIGRATION SETTLEMENT STRATEGY
 Clause No. 22 in Report No. 13 of the Committee of the Whole was adopted, without amendment, by the Council of The Regional Municipality of York at its meeting held on September 11, 2014. 22 UPDATE ON
Introduction... i. Population Family Structure Education Mobility Status... 7
 ward ten Table of Contents Introduction... i Population... 2 Family Structure... 5 Education... 6 Mobility Status... 7 ward ten Ethnicity, Language, Immigrants and Visible Minority... 9 Labour Force Characteristics...13
CENSUS RESULTS WARD 3 PROFILE
 2011 CENSUS RESULTS WARD 3 PROFILE Town of Halton Hills City of Brampton Hwy. 407 Finch Ave. Town of Milton Hwy. 407 ETR Ninth Line 10 Derry Rd. Winston Churchill Blvd. 9 Erin Mills Pkwy. Mississauga Rd.
2016 Census Bulletin: Immigration & Ethnic Diversity
 2016 Census Bulletin: Immigration & Ethnic Diversity Kingston, Ontario Census Metropolitan Area (CMA) The 2016 Census Day was May 10, 2016. On October 25, 2017, Statistics Canada released its sixth data
Regina City Priority Population Study Study #2 - Immigrants. August 2011 EXECUTIVE SUMMARY
 Regina City Priority Population Study Study #2 - Immigrants August 2011 EXECUTIVE SUMMARY Executive Summary The City of Regina has commissioned four background studies to help inform the development of
Immigrant Seniors in British Columbia
 Immigrant Seniors in British Columbia December 2010 Immigrant Seniors in British Columbia Most people who immigrate as seniors come to B.C. to reunite with their families. In fact, 86.2% of the 5,733 new
Immigrant and Temporary Resident Children in British Columbia
 and Temporary Resident Children in British Columbia January 2011 During the five-year period from 2005 to 2009, on average, approximately 40,000 immigrants arrived in B.C. annually and approximately 7,900
COMMUTE DISTANCE AND POLICY IMPLICATIONS Sundar Damodaran, Ph.D., P.Eng.
 Introduction COMMUTE DISTANCE AND POLICY IMPLICATIONS, Ph.D., P.Eng. Commute distance is the distance between a worker's place of residence and his/her usual place of work. Nationally, Census data is the
Ward 16 River. City of Ottawa Ward Profiles 2011 Census and National Household Survey POPULATION* 45, ,390. Total City of Ottawa Population
 POPULATION* Total Ward Population 45,795 +2.0% 2006-2011 Total City of Ottawa Population 883,390 +8.8% 2006-2011 Population by Age Group Ward 16 City of Ottawa 2006 2011 06-11 2006 2011 06-11 Age Group
Socio-Economic Profile
 LOCAL HEALTH AREA 7 - Socio-Economic Profile Powell River Comox Cumberland Denman Island Hornby Island Qualicum CENSUS POPULATION LAND AREA POPULATION DENSITY Number % of Region Sq. Km. % of Region Persons
Measuring Identities, Diversity and Inclusion: Results from the 2016 Census
 Measuring Identities, Diversity and Inclusion: Results from the 2016 Census www.statcan.gc.ca Telling Canada s story in numbers Jane Badets Assistant Chief Statistician Social, Health and Labour Statistics
International Immigration and Official-Language Minority Communities : Challenges and Issues for the Canadian Linguistic Duality
 International Immigration and Official-Language Minority Communities : Challenges and Issues for the Canadian Linguistic Duality Jean-Pierre Corbeil, Ph.D. Statistics Canada Annual meeting of the Language
2011 CENSUS & NATIONAL HOUSEHOLD SURVEY CITY OF BRAMPTON - WARD 1 PROFILE
 CENSUS & NATIONAL HOUSEHOLD SURVEY CITY OF BRAMPTON WARD 1 PROFILE WARD HIGHLIGHTS Population 53,130 Population 51.0% Females Population by Age Group 9% 20% 014 10.14% of total population 36 Median Age
3.1 HISTORIC AND FORECASTED POPULATION FIGURES
 SECTION 3: COMMUNITY PROFILE This section contains an overview of demographic characteristics which are applicable to the analysis of Vaughan s parks, recreation, and library facilities. Identifying who
2016 Census: Release 5 Immigration and ethnocultural diversity, Housing and the Aboriginal population
 2016 Census: Release 5 Immigration and ethnocultural diversity, Housing and the Aboriginal population Dr. Doug Norris Senior Vice President and Chief Demographer November 2, 2017 Today s presenter Dr.
2011 CENSUS & NATIONAL HOUSEHOLD SURVEY CITY OF BRAMPTON - WARD 4 PROFILE
 2011 CENSUS & NATIONAL HOUSEHOLD SURVEY CITY OF BRAMPTON WARD 4 PROFILE WARD HIGHLIGHTS Population 9.51% of total population 49,850 2011 Population 34 Median Age 50.5% Females 49.5% Males 2011 Population
THE ETHNIC DIVERSITY SURVEY. Content and Data Availability
 THE ETHNIC DIVERSITY SURVEY Content and Data Availability September 2004 Statistics Canada Statistique Canada Canadian Heritage Patrimoine canadien Ethnic Diversity Survey objectives To provide information
Keelesdale-Eglinton West
 BLACK CREEK DR 0-4 5-9 10-14 15-19 20-24 25-29 30-34 KEELE ST 35-39 40-44 45-49 50-54 -59 KANE AVE 60-64 65-69 70-74 75-79 80-84 85-89 90-94 95-99 100+ 2011 Neighbourhood Demographic Estimates EGLINTON
STRENGTHENING RURAL CANADA: Fewer & Older: The Coming Demographic Crisis in Rural Ontario
 STRENGTHENING RURAL CANADA: Fewer & Older: The Coming Demographic Crisis in Rural Ontario An Executive Summary 1 This paper has been prepared for the Strengthening Rural Canada initiative by: Dr. Bakhtiar
Immigrants Economic Integration: Successes and Challenges
 Social Planning Council of Ottawa REPORT SUMMARY Immigrants Economic Integration: Successes and Challenges A Profile of Immigrants in Ottawa Based on the 2006 Census June 2009 Suggested Donation: $20.00
COMMUNITY PROFILE TOWNSHIP OF LANGLEY. Township of Langley Immigrant Demographics I Page 1
 COMMUNITY PROFILE TOWNSHIP OF LANGLEY Township of Langley Demographics I Page 1 TOWNSHIP OF LANGLEY IMMIGRANT DEMOGRAPHICS Your quick and easy look at facts and figures around immigration. Newcomers are
YORK REGION LOCAL IMMIGRATION PARTNERSHIP: IMMIGRATION SETTLEMENT STRATEGY SEPTEMBER 2011 DRAFT
 YORK REGION LOCAL IMMIGRATION PARTNERSHIP: IMMIGRATION SETTLEMENT STRATEGY SEPTEMBER 2011 DRAFT 4775 09 2011 Mayor Frank Scarpitti Town of Markham Regional Councillor Jack Heath Town of Markham Regional
(Note: These are inititial neighbourhood estimates and are subject to change.) C N R. NEI Score. Female 54%
 C N R. NEI Score. Female 54%") 0-4 5-9 10-14 15-19 20-24 25-29 30-34 35-39 40-44 45-49 50-54 55-59 60-64 65-69 70-74 75-79 80-84 85-89 90-94 95-99 100+ 2011 Neighbourhood Demographic Estimates STANSBURY CRES MIDLAND AVE CITADEL DR WEST
0-4 5-9 10-14 15-19 20-24 25-29 30-34 35-39 40-44 45-49 50-54 55-59 60-64 65-69 70-74 75-79 80-84 85-89 90-94 95-99 100+ 2011 Neighbourhood Demographic Estimates STANSBURY CRES MIDLAND AVE CITADEL DR WEST
Chapter 8 Ontario: Multiculturalism at Work
 Chapter 8 Ontario: Multiculturalism at Work Ontario is Canada's largest province, home to almost 40 percent of its population (over 13 million people). It has been hit hard by by economic restructuring
Article Aboriginal Population Profile for
 Component of Statistics Canada Catalogue no. 89-638-X o. 20000 2006 Aboriginal Population Profiles for Selected Cities and Communities: Article 2006 Aboriginal Population Profile for 20 How to obtain more
Tell us what you think. Provide feedback to help make American Community Survey data more useful for you.
 DP02 SELECTED SOCIAL CHARACTERISTICS IN THE UNITED STATES 2016 American Community Survey 1-Year Estimates Supporting documentation on code lists, subject definitions, data accuracy, and statistical testing
CITY OF VAUGHAN EXTRACT FROM COUNCIL MEETING MINUTES OF OCTOBER 24, 2017
 CITY OF VAUGHAN EXTRACT FROM COUNCIL MEETING MINUTES OF OCTOBER 24, 2017 Item 11, Report No. 35, of the Committee of the Whole, which was adopted, as amended, by the Council of the City of Vaughan on October
Rural Poverty in Canada. Robert Annis and Lonnie Patterson Rural Development Institute Brandon University
 Rural Poverty in Canada Robert Annis and Lonnie Patterson Rural Development Institute Brandon University Presentation Overview Poverty as a Human Rights Issue Poverty in Canada Poverty in Rural Canada
Tracking Trends in Kingston
 Tracking Trends in Photo: 22, Courtesy of City Hall Total Population: 152,358 Population Changes for CMAs, 21 to 26 25 19.2 2 15 1 11.6 9.2 8.9 8.2 6.6 59 5.9 55 5.5 54 5.4 51 5.1 51 5.1 5 5. 46 4.6 3.8
Demographic Change: The Changing Character of Toronto s Inner City, 1961 to 2001
 Demographic Change: The Changing Character of Toronto s Inner City, 1961 to 2001 SERIES 2 Maps based on the Canadian Census, using Census Tract level data The CURA Study Area: Bathurst St, Bloor St., Roncesvales
CENSUS RESULTS NATIONAL HOUSEHOLD SURVEY
 2011 CENSUS RESULTS NATIONAL HOUSEHOLD SURVEY INTRODUCTION The inaugural National Household Survey (NHS) was a voluntary survey which replaced the mandatory long-form census questionnaire. The NHS was
 Page 1 of 5 DP02 SELECTED SOCIAL CHARACTERISTICS IN THE UNITED STATES 2013 American Community Survey 1-Year Estimates Although the American Community Survey (ACS) produces population, demographic and housing
Canada at 150 and the road ahead A view from Census 2016
 Canada at 150 and the road ahead A view from Census 2016 Dr. Doug Norris Senior Vice President and Chief Demographer 2017 Environics Analytics User Conference November 8, 2017 Canada continues to lead
City of Surrey. Preface. Labour Force Fact Sheet
 City of Labour Force Fact Sheet Preface Statistics Canada conducts its Census of Population every five years with the most recent census having occurred in 2006. The Census provides information on the
Chinese Ethnic Economy in Toronto
 Chinese Ethnic Economy in Toronto Preliminary Report By Eric Fong University of Toronto and Ambrose Ma President, South East Asians Services Centre Overview Ethnic economy is an alternative avenue of economic
CANADIAN DATA SHEET CANADA TOTAL POPULATION:33,476,688 ABORIGINAL:1,400,685 POPULATION THE ABORIGINAL PEOPLE S SURVEY (APS) ABORIGINAL POPULATION 32%
 ABORIGINAL POPULATION 32%") CANADA TOTAL POPULATION:33,476,688 ABORIGINAL:1,400,685 THE ABORIGINAL PEOPLE S SURVEY (APS) The 2012 Aboriginal Peoples Survey (APS) is a national survey of First Nations, Métis and Inuit people living
CANADA TOTAL POPULATION:33,476,688 ABORIGINAL:1,400,685 THE ABORIGINAL PEOPLE S SURVEY (APS) The 2012 Aboriginal Peoples Survey (APS) is a national survey of First Nations, Métis and Inuit people living
Chapter One: people & demographics
 Chapter One: people & demographics The composition of Alberta s population is the foundation for its post-secondary enrolment growth. The population s demographic profile determines the pressure points
The Future of North West Sydney
 The Future of North West Sydney AUGUST 2018 2 Contents Demographic & Education Trends in Sydney s North West 5 Methodology 7 Sydney s North West 8 Population growth 8 Age profile 9 Student enrolments 12
MUNICIPAL ACT APPLICATION BY TREASURER
 Environment and Land Tribunals Ontario Assessment Review Board, 655 Bay Street, Suite 1200, Toronto, Ontario M5G 2K4 Phone: (416) 212-6349 or 1-866-448-2248 Fax: (416) 645-1819 or 1-866-297-1822 Website:
CENSUS RESULTS WARD 9 PROFILE
 2011 CENSUS RESULTS WARD 9 PROFILE Town of Halton Hills City of Brampton Hwy. 407 Finch Ave. Town of Milton Hwy. 407 ETR Ninth Line 10 Derry Rd. Winston Churchill Blvd. 9 Erin Mills Pkwy. Mississauga Rd.