EMERGENCY FOOD SECURITY ASSESSMENT GULU DISTRICT MARCH/APRIL 2004
|
|
|
- Jayson Byrd
- 5 years ago
- Views:
Transcription

1 EMERGENCY FOOD SECURITY ASSESSMENT GULU DISTRICT FINAL REPORT JUNE 2004
2
3 SUMMARY: Since 1986 Gulu district has disproportionately suffered the consequences of the LRA led civil insecurity in the Acholi sub-region. Up to March 2002, 33 displaced persons camps in had been established as a consequence of LRA activity in the district. Following the declaration of the military operation Iron Fist and the failure to achieve a ceasefire between the protagonists, the LRA infiltrated the porous border from their base in Sudan and intensified the commitment of heinous and brutal acts against the populace. From March 2002, the wanton and indiscriminate acts of the LRA worsened to the extent that in July 2002, WFP had to suspend its operations and only resumed after guarantees that the GoU would provide military escort for its food aid convoys, under a background of a worsening humanitarian situation. By May 2003, 81% of the population in Gulu was domiciled in 33 displaced persons camps. Various assessments have been undertaken during this period. These assessments recognized that despite the on-going insecurity, the displaced persons were industrious and utilized whatever resources they could access while food aid was used to complement their efforts. The displaced persons would exploit the periods of relative calm which were sometimes very short and far in between, to undertake some productive activities. In the last such assessment carried out in October/November 2003, it was established that the ability to complement food aid varied very slightly between camps within the districts depending on the length of calm. Based on the findings of the assessment, WFP food aid was programmed to cover 65 percent of Recommended Daily Allowance (RDA) in all the camps in Gulu district for the period October 2003 to April The current assessment represents a review of the food aid needs using the new Emergency Food Security Assessment methodology developed in November/December The assessment was undertaken in March out of 33 camps in the district were randomly selected using a table of random numbers. Using Participatory Rural Appraisal (PRA) techniques and household questionnaires, 10 village basic interviews, 10 only women focus group discussions, 10 only men focus group discussions, 10 market surveys and 100 household interviews were conducted. In addition 10 seasonal calendars and 10 village resource maps were developed. The findings confirm that the majority of the households have three major sources of food: own production, market and food aid. Contribution from own production is limited because on the average, most households can only access about 0.5 acres of land. From this land, maximum production can provide only two months of the grain-equivalent requirement for an average household of seven persons. Given that most of the crop was harvested by January 2004, and the next harvest is not expected till July/August, most of the households are only able to cover 33 to 47 percent of RDA. 3
4 Although various income-earning opportunities exist, the most widespread is the exchange of Labour. The activity is predominantly undertaken by women. Given the disproportionate labor demand on women s time and the relatively high dependency ratio, the women may be able to undertake the activities for between 15 to 20 days a month. Analysis of household expenditure revealed that about 38 percent was devoted to food. This implies that from the total earnings, only between 5,700 to 7,600 shillings (Equivalent to US $3 to $ 4) are available as expenditure on food. Analysis of the current grain market prices revealed that out of this expenditure a household could only procure grain sufficient to cover percent of household requirements. Given that most households did not own any liquid assets, the potential of acquiring food through this means was considered negligible. Although food aid was programmed to provide 65 percent of RDA overall, analysis of deliveries reveals that owing to various reasons (largely delays due to logistical constraints), WFP was only able to meet 84 percent of target. This translates to 50 percent of RDA. However most of the vegetable oil received is not appropriately used because of the need to procure the condiments necessary, which is constrained by the lack of income. On the other hand, it appears that a portion of the cereal component is sometimes traded in order that the households procure more pulses that are more difficult to complement as a result of the constrained cropping practice that places a premium on cereal production. Analysis of the different sources of food reveals that food accessed is short of recommended daily intake by about 19 percent of RDA while analysis of household consumption reveals a shortfall of about percent of RDA, as of April About 80 percent of the households indicated that they have suffered the strain of inadequate food. As a result, most of them are coping by eating less preferred foods, eating less by limiting the proportions at meal times and by reducing the number of meals per day. If this level of consumption is sustained over a long period, it may have serious consequences on the nutritional status of the population. Given that food aid is currently meeting 40 percent of need, and that households on average are suffering a 19 percent shortfall in consumption, the study would ideally recommend that WFP aid provide 59 percent of food requirement. However, given that most of the other crops that the IDPs depend on are seasonal and quickly running out, it may be prudent to cover another 12 to 19 percent of RDA. To this effect, WFP aid should provide between 70 to 80 percent of RDA composed of 350 grams of cereal per person per day (ppd), 100 grams of pulses ppd and 10 grams of vegetable oil ppd. The food basket includes a disproportionately large amount of pulses given the inability of the households to complement this component. Approximately 438,000 displaced persons in the district will require this level of food assistance till December 2004 (8 months). This translates to approximately 36,792 tons of Cereal, 10,512 tons of Pulses and 1,050 tons of vegetable oil. The study also collected some data on literacy, sanitation, health and water availability. However it was deemed inappropriate to make specific recommendations in respect of these issues mainly because of the lack of competence to do so. 4
5 1. BACKGROUND INFORMATION: Gulu is one of the districts that form the Acholi sub-region. With an estimated population 1 of 468,407 persons, the district has a population density of about 39.9 persons per square kilometer. 17 years of protracted insurgency has affected the socio-economic development in the district. Since 1986, the area has been ravaged by armed rebellion of the Holy Spirit Movement and its successor The Lord s Resistance Army (LRA). Following the intensification of the rebellion in 1996, the Government of Uganda decreed that LRA affected populations should move into protected villages where the Uganda People s Defence Force (UPDF) would provide physical security. This marked the genesis of the Internally Displaced Persons (IDP) camps as they are known today. By November 2000, about 370,000 people (80% of the then estimated district rural population) were living in 20 WFP-assisted camps in the district. The livelihood options of the people in camps were severely disrupted by the limited freedom of movement of persons to their gardens and/or markets. Small bands of the rebels continuously attacked areas at random (both in location and time), destroying houses, looting household property, abducting children and committing such other heinous acts including brutal murder and rape of women. Following a lull in the insurgency in 2001, the WFP-assisted IDP population declined to as low as 291,000. During this time, a number of IDPs were undertaking appreciable agricultural production in their home areas while others moved to satellite settlements nearer to the their areas of habitual domicile. A Food Needs Assessment 2 conducted in 20 camps (13 unassisted and 7 out the 20 assisted camps) documented that food aid contributed about 32% of total food intake in the WFP assisted camps while own production contributed about 60% of food intake in the unassisted camps. Following this assessment and a request form the Government of Uganda (GoU), the numbers to be assisted was increased from 20 to 33 IDP camps and food aid was programmed to meet 30 percent of the minimum dietary requirements of 2,100 Kcal per person per day. In late 2001, the LRA was internationally declared a terrorist organization. Following this declaration, the Government of Sudan (GoS) permitted the GoU to pursue the LRA within southern Sudan. Subsequent to the permission, the GoU launched a military operation code named Iron Fist to flush the LRA out their operational bases in southern Sudan and incapacitate their operations in Northern Uganda. Following this pursuit, the LRA took advantage of the porous borders and re-entered the northern region. The LRA then intensified its commitment of brutal acts against the population to such an extent that by June 2002, most of the gains achieved during the lull in 2001 were lost. It was also during this time that WFP was forced to temporarily suspend its activities (during much of June to July 2002) as a result of numerous and frequent attacks on vehicles plying the roads. WFP only resumed operations in July 2002 following guarantees that the GoU would provide 1 Provisional results of the national housing and population census of November A Collaborative Emergency Food Needs Assessment for Gulu District, October
6 military escort for the food convoys. At this time, it was estimated that about 372,000 persons were variously displaced in Gulu district 3. The IDPs had only extremely limited access to their fields and consequently lost their August/September 2002 harvest. The humanitarian situation rapidly degenerated and a rapid nutritional survey 4 conducted in January 2003 documented Global Acute Malnutrition rates of 18.1 and 31.6 percent in Pabbo and Anaka camps respectively. A programme review 5 undertaken in May 2003 confirmed a progressively worsening humanitarian situation as a result of the renewed insurgency and the failure to achieve a ceasefire. The report highlighted an increase in child abductions and a new phenomenon of night commuters 6. Conditions in the camps were appalling and deteriorating as a result of congestion and basic social services were barely operational. During the review it was established that about 379,394 persons were variously displaced in 33 camps. During the WFP Emergency Food Needs Assessment conducted in September 2003 and the comprehensive verification and registration exercise undertaken about the same time, it was established that the number of displaced persons had grown to 416,923 persons. Analysis of the coping strategies, the sources of food and income, social differentiation, household consumption, and the ability of households to cover food needs revealed that there was very little difference between the camps. The results of the study revealed that on average, most of the residents in camps required about 63 percent of their food requirement from food aid. This level of assistance was programmed to pertain until April 2004 when this current food security assessment to inform programming decisions was scheduled. 2. THE CURRENT ASSESSMENT: The Emergency Food Needs Assessment (EFNA) methodology was piloted in November 2000 and has been in use as the major tool for the determination of food aid needs since then. Three years later, the methodology was comprehensively reviewed and the nomenclature changed to Emergency Food Security Assessment (EFSA) in November Whereas the principle behind the EFNA was purposive sampling among the likes (Like camps and like social groupings based on stratification) and then extrapolation of the results to represent like communities, the principle behind the EFSA is random sampling in order to eliminate the bias that may be occasioned by purposive sampling. This was found appropriate given that social targeting was impractical in a situation where need was as widespread as it is in the 3 Emergency Food Assistance Strategy to Internally displaced Persons in Northern Uganda. Report indicates that there were 325,000 IDPs in 24 camps and 47,000 IDPs in transit camps. 4 A nutritional Survey among the Internally Displaced Population in Northern Uganda, WFP, DLG, DDHS January WFP Emergency Assistance in Northern Uganda: Report of the Programme Review, May These are children from pre-urban areas trekking to Gulu town at night to sleep rough in the open in order to avoid abduction by the LRA at night 7 A Review of the Emergency Food Needs Assessment (EFSA) Methodology: Facilitated by Partha V Ippadi; Consultant. 6
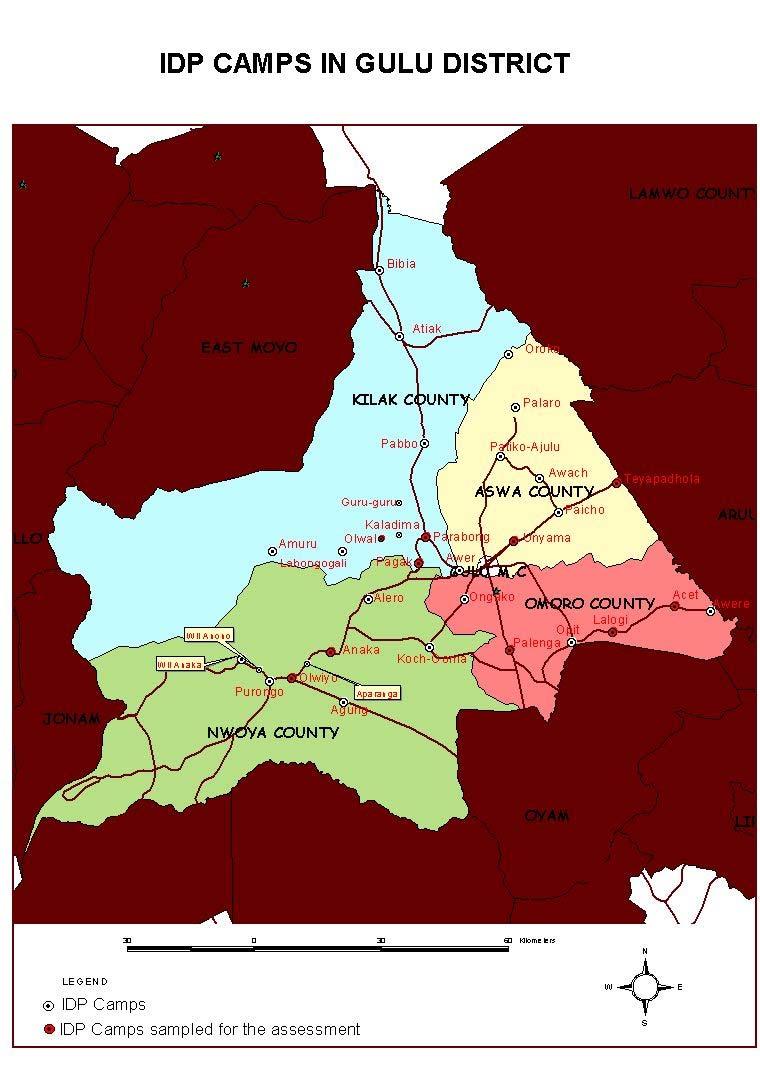
7 current crisis afflicting the northern region (question of individual camps getting a higher ratio yet they tend to suffer the same processes affecting food security). In order to allow for the possible stratification among the communities, the individual Household questionnaire was expanded from an analysis of the household consumption to include such other themes as household demography and additional household information, the nature of housing and other facilities including access to water and sanitation, ownership of household assets, household sources of income, food sources, household expenditure, household employment of coping strategies and the use of food aid. Rather than consider 3 households for each of the stratified social groupings in a selected number of camps that would be determined by the like camp groupings so determined, the EFSA relies on an equal number of Households in an equal number of camps in a given sampling frame. For this assessment, Gulu district was considered a single sampling frame. Employing the table of random numbers, 10 camps namely: Acet, Anaka, Lalogi, Olwal, Olwiyo, Pagak, Palenga, Parabong, Teyapadhola and Unyama were chosen. In all 1 district level interview, 10 settlement entry interviews, 10 women focus group discussions, 10 men focus group discussions, 10 seasonal calendars (one each for the identified camps), 10 local market surveys and 100 household interviews were conducted. In addition 10 settlement maps indicating resource availability and access were developed. 3. RESULTS: 3.1: General livelihood groupings in the Camps In the focus group discussions of the village basic data, 9 major livelihood groupings were identified. These are: Predominantly crop based; predominantly livestock based; mixed crop and livestock; predominantly labor-based exchange; shopkeepers; artisans; petty traders (small scale vending); Fishing and, others. Using proportional piling, the proportions in each group were determined as follows: Livelihood groupings in IDP camps in Gulu District Fishing Vendors 0% 9% Others 8% crop based 4% Livestock based 6% Mixed 7% Artisans 17% Shopkeepers 7% Labor based 42% 3.2: General household demography: 7
8 Camp # HH 8 # FHHH Age group of HHH as % of total # of HH < X 55 > 55 Marital status of HHH as % of total # of HH Married Widowed Divorced Average HH Size Average dependency ratio Acet Anaka Lalogi Olwal Olwiyo Pagak Palenga Parabong Teyapadhola Unyama Total/average Households (HH) were interviewed of which 14% were female headed. None of the HH heads was minor while about 13 percent of the HH heads were over 55 years old and considered elderly. 85% of the heads of HH are married, 14% are widowed and only 1% divorced. Average family size of the HH interviewed was 7.0 with a dependency ration of 1.9:1. This implies that on average, each family has 2 3 able-bodied adults that have to fend for 4-5 dependants and self. In response to the question related to disability within the family, 1% of the HH indicated they had an amputee, 9% had a blind person, 3% had some body with mental illness, 13% had some body deaf/mute, 8% indicated lameness associated with polio, 5% lame as a result of injury and 8% with somebody suffering some chronic illness. Data collected at the HH level is in consonance with the data collected at the village level during the focus group discussions. Average family size is between 6-8 persons except in Lalogi where the respondents reported a family size of 10. The number of female-headed households fluctuates widely. It is possible that the respondents, understanding the implications of exaggerating the number of female-headed households did so for an ulterior motive. For example in Olwiyo and Unyama, the focus group indicated that they percent female headed households. For the other camps female-headed households were said to be percent of all households. 3.3: Literacy Levels of Heads of Household and Spouses: 8 HH = Households; FHHH = Female Headed Households; HHH = Heads of Household. 8
9 Camp Average years of education (Years) Proportion that can read and write (%) Head of Household Spouse Head of Household Spouse Acet Anaka Lalogi Olwal Olwiyo Pagak Palenga Parabong Teyapadhola Unyama Average The average years of education for the head of HH is 5 to 6 while that of the spouse is 2 3 years. About 78% of all heads of HH can read and write as compared to 29% for all the spouses. There is discernible pattern that can explain the causal factors for the level of education. For example, Olwiyo camp that is further away from the Gulu municipality as compared to Pagak and Unyama reports about the same years of education of the head of household (6.9 years compared with 6.8 and 6.6 respectively). However, opportunities for primary education have improved considerably in all the camps. 3.4: Other HH information: Camp Location where household has spent most time in the last 5 years (%) Current camp Other camp Rural Uganda Urban area Acet Anaka Lalogi Olwal Olwiyo Pagak Palenga Parabong Teyapadhola Unyama Average % of the Heads of HH interviewed have spent the last 5 years in IDP camps, 24% were in rural Uganda and therefore only recently displaced and 2% were resident in other camps. 1% of the households were previously domiciled in an urban center (especially so for Unyama that is about 11 Km from Gulu municipality) 3.5: Year of displacement to area of current domicile: 9
10 Camp Proportion of households displaced in a given year as a proportion of households interviewed (%) Total Acet Anaka Lalogi Olwal Olwiyo Pagak Palenga Parabong Teyapadhola Unyama Average Based on HH indication of years of displacement, 56 % of the HH were displaced between 1996 and 1998 (at the height of the LRA insurgency when the protected camps were created) and only 4% of them were displaced prior to Of the 40% of the HH displaced after 1998, 22% of them were displaced between 2002/2003 (period after the declaration of operation Iron Fist) and 18% of them between (the period of relative calm). 3.6: Reasons preventing return to place of origin: Camp Major problem preventing return to place of origin as % Insecurity No resources to return Nothing to return to Acet Anaka Lalogi Olwal Olwiyo Pagak Palenga Parabong Teyapadhola Unyama Average All the HH interviewed indicated that they had land holding in their places of habitual domicile (none of the land has been occupied/taken away) and that if they returned, they would find work and/or earn sufficient income. However 93% cannot immediately return because of insecurity. About 6% indicated that they would need some resources if they were to return and only 4% indicated that they have nothing to return to in their areas of habitual domicile. 3.7: General housing characteristics: 10
11 Camp Ave # yrs in current dwelling Housing characteristics general Average number of Huts owned Average # of persons staying in dwelling Acet Anaka Lalogi Olwal Olwiyo Pagak Palenga Parabong Teyaphadola Unyama Average Minus toilet but including such other huts as kitchen and goat pens etc, most of the HH interviewed own an average of 2 huts that house between 6-7 persons. Most of the HH have lived in these dwellings for between 5-6 years. There is consistency between the numbers of years in displacement and the actual year of displacement for most of the camps. The number of years in displacement does not correlate with the number of huts. This is probably because most camps have been displaced for more than two years. However a correlation can be established between the average number of persons staying in the family dwellings and the number of huts owned. Apart from the anomalies associated with Lalogi and to some extent for Anaka, it can be said that families with a household size above 6 will have at least two huts while those with less that 5 persons have between 1-2 huts. 3.8 Medical facilities Information gathered during the focus group discussions on the village basic data indicates that 7 out of the 10 camps visited had a health facility within a radius of 1 Km. The camps that did not have such a facility were Palenga, Pagak and Olwiyo. In the incidence of the first two, the explanation may lie in the fact that they are close to the municipality and therefore access the health facilities therein. For Olwiyo, the assessment could not immediately establish the reason. Although the facilities exist, the centers are plagued by staff absenteeism (Most centers are open between Monday and Friday only), and infrequent and inadequate drug supply that renders the services inefficient. The IDPs enumerated a number of diseases that afflict the communities. Most of these are personal health and hygiene related except the now frequent fungal infection oral candidaisis (Two lango) among children. In addition the IDPs reported widespread incidence of Sexually Transmitted Infections (STI s). 3.9 Water and Sanitation 11
12 During the HH interviews, information on access to water and issues related to sanitation was collected but never analyzed. As a consequence, the information below is based on what was collected during the Focus Group discussions and is therefore not triangulated. For most of the IDPs, the inadequacy of protected water sources has meant that a number of the IDPs are compelled to use unprotected water sources. Most of these are normally springs and streams that are seasonal and often dry up between January and May of each year. At the time of the assessment, the IDP population reported that these sources were drying up and it was taking the women close to 4 hours for the women to fetch a 20-litre can of water. In Olwal, which appears to be hardest hit, it took the women close to 7 hours. Sanitation in the camps is still very poor. Although the IDPs reported the presence of latrines, most of them confessed that the latrines never lasted the rainy season. As a result the bulk of the IDPs use the convenience of the dark to ease themselves about 10 to 100 meters away from the homesteads. Most of the places of ease are not very far away from the water sources leading to possible water contamination Ownership of assets: Camps Liquid assets Productive assets Poultry Livestock Radio B/cycle M/cycle B/cart Oxplough Land Chicken Ducks Pigeon Goats Sheep Pigs Bulls Cows Acet Anaka Lalogi Olwal Olwiyo Pagak Palenga Parabong Teyapadhola Unyama Average Ownership of liquid assets is low in almost all households. None of the HH interviewed owned a motorcycle, 43% owned a b/cycle and 35% owned a radio. Ownership of livestock is also low. There is almost no ownership of large ruminants while ownership of shoats (goats and sheep) is less than 10%. There is little ownership of poultry; 11% of the HH own Pigeons, 11% own Ducks while 24% have some chicken. Ownership of ducks is more widespread as compared to chicken and pigeons. At least one HH reported owning a duck in each of the camps visited while it was only in 5 camps that a HH owned chickens. Only in 2/10 camps visited did a household report ownership of pigeons. As is the case for liquid assets, ownership of productive assets is low. None of the HH interviewed owns a cart and only 2% own an ox-plough. However about 65% have access to arable land despite the continued displacement and insecurity. On average each household has access to approximately 0.5 acres of land. About 30% of the HH have average to above 12
13 average access while 70% access less than average land (access to less than half an acre). Only about 57% have access to a vegetable garden Shock and Risk analysis in the camps: From the focus group discussions, the most widespread risk was the increasing rebel attacks by the LRA since September The attacks were often coupled with flogging and/or brutal murders of the civilian population. The rebels also harvested whatever crops they found in the garden especially simsim (Sesame), cassava, sorghum and groundnuts. In addition, the IDPs reported a dry spell between September and November This was compounded by wild bushfires that affected the crop in the garden, the reduction in rations in September 2003 (from 89 to 65% of RDA) and delays in delivery of food aid by WFP. The net effect of these processes has been that the IDPs have had very little land around the camps on which to undertake any agricultural activity. At the risk of being butchered to death, the IDPs risk the to and fro movements to their lands to dig and access whatever little harvest they have. This is used to compliment the food-aid that is received from WFP HH Food Storage and Stocks: Camp % of HH with stored food Average Months % of HH reporting Storage in: Food will last Sacks Granaries Pots/Gourd Acet Anaka Lalogi Olwal Olwiyo Pagak Palenga Parabong Teyapadhola Unyama Average % of the HH interviewed had some stored food. This almost mirrors the percentage of HH that reported access to land. Many of the HH interviewed indicated that much of the food stored will last less than a month. 92% of the HH reported that such food was stored in sacks while 5% reported storage in pots/gourds. Only 3% reported any storage in granaries. In 5/10 camps visited, the percentage of HH with food matched the percentage of HH with access to land within 10% variability. In the other 5, the variability is large. In Anaka, 100% of the HH reported access to land but only 40% reported any stored food whereas for Acet 100% reported stored food while only 50% reported access to land. Similar variability is reported in the cases of Olwiyo, Teyapadhola and Unyama. A priori, it is expected that access to land should correlate with food storage all other conditions constant. 13
14 Clustering the camps according to the parameter proportion of HH reporting access to land gives us the following picture: Cluster 1 with between % of the Households indicating that they had access to land. This cluster includes Anaka and Olwiyo camps and will hitherto be referred to as the Anaka cluster; Cluster 2 with between 60 70% of the households indicating that they had access to land. This cluster includes Lalogi, Olwal, Pagak, Parenga and Parabongo and will be referred to as the Lalogi cluster and; Cluster 3 with less than 50% of the households indicating that they had access to land. This cluster includes Acet, Teyapadhola and Unyama and will hitherto be referred to as the Acet cluster. Although the Anaka cluster has the best access to land, proportionately fewer households had any food stored as compared to the Acet cluster that had the worst access to land but proportionately more households with stored food. The Lalogi cluster appears to have the best mix, although it has comparatively moderate access to land, it had more households indicating that they had stored food as compared to the rest Income Earning Opportunities: In the household interviews, the households were asked the priority household income source, who of the family members participates in the activity and using proportional piling, the estimate of the contribution of the given income source to total household income. The following is a discussion of the results: Household Ranking of Income sources: Activity Rank 1 Rank 2 Rank 3 Rank 4 Total Labor for cash Brewing Crop sales NRB Based Petty trade Others Remittance/Kinship Handicraft Animal sales Credit/Savings No Responses Total Analysis of no responses gives us the following information: 28% of the HH interviewed have only a single income earning activity; 33% undertake two activities; 30% undertake three activities and; 9% do at least 4 activities. We will work with the premise that diversity of income earning activities is an indication of stress. If this were the case, then 14
15 the proportion of the HH considered well-off (28%) correlates with the percentage of HH that have average and/or more than average access to land (29%). From the data, the most widely engaged income activities are labor for cash (64%), brewing (49%) and crop sales (36%). Natural resource based activities (31%) and petty trade (24%) can be considered as activities of last resort while remittances (5%), sale of handicraft (2%), animal sales (1%) and, reliance on credit and saving schemes (1%) are exclusive. Understanding the proportional prioritization of the three major income activities (Labor for cash, brewing and crop sales) based on the proportion of the population that regarded the activity a priority among the different clusters provides the following picture: The Anaka cluster has the ratio 1:1:1; the Lalogi cluster has the ratio 0.8:1.4:1 and; the Acet cluster has the ratio 10:6:1. This implies that the Acet cluster has the highest reliance on Labor for cash, followed by the Anaka cluster and then the Lalogi cluster. Correlating the results above with access to land indicates that Acet cluster with the least access to land has the highest reliance on labor for cash, the Lalogi cluster with moderate access to land is the least reliant on labor for cash and, the Anaka cluster with the highest access to land is moderately reliant on labor for cash : Men s Focus Group ranking of income sources: Camp/ Strategy Crop Sales Animal Sales Brewing Labour for Cash NRB 9 Petty Trade Handicrafts Kinship Salaries/ Wages Acet Pagak Olwal Lalogi Palenga Parabongo Olwiyo Anaka Teyapadhola Unyama No of Camps ranking Average Ranking During the focus group discussions in all the 10 camps sampled, the men ranked labor for cash as the most important source of income because a number of activities are being initiated by NGO s including school construction, digging pit latrines, land preparation and road construction/clearing (Parabongo, Palenga); and because opportunities for labour exist amongst the teachers, businessmen, (Unyama, Anaka, Olwiyo) and payment is made in cash. 9 NRB refers to Natural Resource-Based products are largely cutting of wood for charcoal, collection of firewood, and grass for thatching. 15
16 The exploitation of natural resources was ranked second by the men with an average ranking of in 8 out of the 10 sampled camps because it is not taken by the rebels, its long lasting, firewood and grass is free and can be sold to get money. It is not precisely clear what long lasting means but what is clear is that the IDPs said that the proceeds are used to maintain families and pays for school fees, and medical treatment for the children. The men ranked crop sales third at an average ranking of 3.2 in all the sampled camps. Crop sales were ranked thus because it provides income that can be used to buy food to balance the diet; proceeds are used to pay for costs of grinding WFP relief maize; and because yields from agriculture are reliable and complement WFP relief food when the security situation is stable. However, it is limited by insecurity; lack of access to cultivable land; lack of tools and seeds; bush fires; drought, pests and diseases. Brewing was ranked fourth by the men at an average ranking of 3.2 in 6 out of the 10 camps and petty trade was ranked fifth at an average ranking of 3.6 in 6 out of 10 sampled camps because it is used as an income source to buy clothes and other basic needs. However, petty trade is limited because of the risks associated with moving to and from the camps to replenish stocks and because of lack of start up capital Women s Focus Group Ranking of Income sources: Camp/ Strate gy Crop Sales Animal Sales Brewing Labour for Cash NRB Food Aid Petty Trade Handicraft s Acet Salarie s/wag es Pagak Olwal Lalogi Palenga Parabon go Olwiyo Anaka Teyapa dhola Unyama No of Camps ranking Average Ranking Boda Unlike the men, the women ranked exploitation of natural resources first at an average ranking of in 8 out of the 10 sampled camps because the raw materials are free and most able-bodied persons are involved in the activity. In addition the activity is cheap and the resources are available at all times but only hampered by rebel presence and bush fires. The activities also provide a means of earning some money. 16
17 The women ranked brewing second at an average ranking of 2.5 in all the 10 sampled camps because many women in the camps are engaged in the activity and sell the brew to get money. The only problem was that the raw materials are lacking, expensive and the men often consume the brew on credit. Like the men, the women ranked crop sales third at an average ranking of 2.5 in 9 out of 10 of the sampled camps, respectively. Crop sales were ranked thus because it provides income that can be used to buy food to balance the diet and because yields from agriculture are reliable and complement WFP relief food when the security situation is stable. Proceeds are also used to pay for costs of grinding WFP relief maize. However the activity is limited by insecurity, lack of access to cultivable land; lack of tools and seeds; bush fires; drought, pests and diseases. The women on the other hand ranked petty trade (awaro) fourth at an average ranking of 3.14 in 7 out of the 10 IDP camps. However few people, predominantly women, are involved in the activity, because of lack of business skills and start up capital. The major activities undertaken include selling of various items like mukene (small dried fish), pancakes and produce. The women ranked labour for cash fifth and last at an average ranking of 3.25 in 8 out of the 10 sampled camps because of lack of opportunities within the camps, coupled with under payment by the employers and because it is a predominantly dry season activity (fetching water, smearing huts with cow dung), for the women Participation in the activities: Who Priority 1 Priority 2 Priority 3 Priority 4 Men Only 11 7 (10) 5 (13) 2(22) Women Only (47) 16 (41) 5 (56) Children Only 1 0 1(3) 0 Adults Only 27 23(32) 15 (38) 2 (22) Women and Children 9 6 (8) 2 (5) - Men and Children 1 1(2) - - Everybody 8 1(1) - - No Response Totals for activity The figures in parentheses represent the percentage of the persons undertaking the activity as a percentage of those that indicated they participated instead of the total number interviewed. Based on this statistic, it is evident that women play a very major role in generating income for the families. 43% of the Households indicated that women were responsible for whatever activity the HH consider as first priority in generating household income as compared to 11% for men. 27% indicated that adults undertake the first priority income earning activity and in 1% of the HH, the premier activity is undertaken by children. 17
18 For those households that have a second income generating activity, 47% indicated that the activity is undertaken by women, 32% indicated that it was undertaken by adults only and 10% indicated that it was undertaken by men only. No children were involved in the second activity. In HH were a third income generating activity was mentioned, 41% of the HH indicated that the activity is undertaken by women while 38% indicated that it was undertaken by adults only. Only 13% indicated that males only undertook the activity. In HH were a fourth activity was indicated, 56% indicated that women undertook the activity. This is a very disproportionate demand on women s time. Depending on how much time is required to undertake a particular activity, the returns for undertaking the activity and the Dependency Ratio (DR) of 2:1 for an average family of seven, there is a opportunity cost. Amount of adult labor available to the family will influence the family s well being HH Sources of food: Food Source Priority 1 Priority 2 Priority 3 Priority 4 Total Own crop Animal products Hunting Gathering Fishing Milk/milk products Purchases Labor Exchange Food aid Bartering Gifts Others No responses Totals From the analysis of the non-responses, 3% of the HH have only one source of food; 22% of the HH have 2 sources of food; 43% have three sources of food and; 32% have four sources of food. Using conventional wisdom, HH with just one source of food in the IDP camps will be the most vulnerable. This implies that the most vulnerable households are the 25% that have 2 or less sources of food. This correlates to the 30% that have to undertake three activities to earn income and the 9% that undertake 4. From the table above, the four most important sources of food are own crop, Purchases, labor exchange and food aid. Of the four 69% considered food aid as the most important source of food while 31% considered the other three options. Using the clusters earlier developed, and developing ratios based on the proportional prioritization of the premier sources of food vis-à-vis food aid: purchase: own crop, the following picture is revealed; the Anaka cluster has the ratio 90:10:0; the Lalogi cluster has the ratio 2.4:0.5:1 and; the Acet cluster has the ratio 23:5:1. This implies that the Anaka cluster is heavily dependent on food aid; the Acet cluster is moderately dependent and; the Lalogi cluster has the least dependence on food aid. 18
19 In addition to the HH interviews, 20 focus group interviews, 10 with women and 10 with men, were conducted with the following results: Men s Focus Group Ranking Camp/ Strategy Own Crops Gathering Purchases Exchange (Labour for food) Food Aid Barter Gifts Acet Pagak Olwal Lalogi Palenga Parabongo Olwiyo Anaka Teyapadhola Unyama No of Camps ranking Average Ranking Women s Focus Group Ranking Camp/ Strategy Own Crops Hunting Gathering Purchases Exchange (Labour for food) Food Aid Acet Pagak Barter Olwal Lalogi Palenga Parabongo Olwiyo Anaka Teyapadhola Unyama No of Camps ranking Average Ranking Gifts Food aid was ranked first by all the men in the ten sampled camps, at an average ranking of 1, and all the women in eight camps out of ten, at an average ranking of 1.2 during the focus group discussions, because the respondents considered it as being most important and guaranteed food source that lasts a long time. The respondents also indicated that food aid 19
20 is the most reliable source of food because of the lack of access to cultivable land due to frequency of rebel movements in most of the camps. Insecurity was another factor that led to heavy dependence on food aid from WFP. The men ranked labour for food second at an average ranking of 2.6 in all the 10 sampled camps because the proceeds are used to buy other food items in order to change the diet, opportunities for labour are available within the camp from NGO cash-for-work programmes (eg. ACDI/VOCA in Palenga) and digging pit latrines. Labour for food was also ranked second because not everybody in the camp receives WFP relief food and opportunities exist amongst the teachers and the business community in the camp. The women on the other hand ranked own crops second at an average ranking of 2.3 in 9 out of the 10 sampled camps because the host community is able to provide the IDP s small plots within the camp for cultivation (Teyapadhola, Parabongo, Anaka); and because occasionally some people sneak back to their original homes to get food from their gardens (Lalogi). Own crops was ranked third by the men at an average ranking of 3.2 in all the 10 sampled camps because it supplements food aid provided by WFP (Acet, Pagak); about 30% of the camp population are composed of the host community who are cooperative and provide portions of their land to the IDP s for cultivation in the case of Parabongo; and because in a fair security situation people are able to cultivate small plots of land around the camp. The women ranked purchase third at an average ranking of 3 in 8 out of the 10 sampled camps because proceeds from leja leja (casual labour), charcoal burning, firewood sales, sales of WFP food, brick laying and fetching water at construction sites are used to purchase food. In Palenga camp purchase was ranked third because clashes between the Langi and Acholi (following the incursion of the LRA south into the Lango sub-region as of 2002) have prevented people from accessing food from Apac district and they have to rely on the market. Purchase was on the other hand ranked fourth by the men at an average ranking of 3.6 in 7 out of the 10 sampled IDP camps because purchased food is used to change the diet; proceeds from labour are used to buy food; because there is heavy dependence on the market due restriction of access to own gardens; those who do not have land but earn a salary and those who work for cash are able to purchase food from the market. The women ranked labour for food fourth with an average ranking of 3 in 6 out of the 10 sampled camps because it is easier to get work that is paid in cash in the case of Teyapadhola; it helps as a food source since everybody is in the camp; and because opportunities are readily available but limited by lack of tools, under payment and delays in payment by the employers. Both the men and the women ranked gathering fifth at an average ranking of 4.2 in 6 out of the 10 sampled camps and 4.5 in 6 out of the 10 sampled camps respectively, because it is 20
21 only wild yams that can be collected from the bush (Olwal); the security situation does not favour movement outside the camp and the rebels claim that whatever is remaining in the villages belong to them and that the people in the camp should access food from WFP. Gathering was also ranked thus because it is seasonal and limited by insecurity HH Expenditure on Food: Average percentage expenditure on food is about 38% of total HH expenditure. About 40% of the HH interviewed had household expenditure above average, 13% had HH expenditure equal to average and 42% had below average expenditure on food. Ordinarily, this expenditure on food is relatively low for a rural household. This may be due to the fact that most of the expenditure for the month under review (February) was mainly for school fees and the associated expenses. Applying the clustering previously employed, the following picture is revealed: The Anaka cluster has an average expenditure on food of about 36%; the Lalogi cluster has an average expenditure on food of 37% and; the Acet cluster has an average expenditure on food of about 39%. This implies that regardless of the other factors, most of the households interviewed are proportionally spending the same amount on food as a proportion of total expenditure. To ensure consistency of analysis however the Acet cluster is slightly worse off, the Lalogi cluster is moderate and the Anaka cluster is slightly better off. For most of the camps, a daily under the tree market operates and sometimes, once a month, the IDPs benefit from bigger regional markets called auctions, when security permits. The table below represents an average price for the key cereal grains in both Kitgum and Pader. Commodity Average market prices per kg and/or unit in Gulu district(shs /Kgs and-or unit) Price 2 months ago Current Price Projected Price in 2 mths Maize grain Maize flour Sorghum grain Sorghum Flour (Mug) Millet grain Millet Flour Pigeon Peas Green Peas Kidney Beans Simsim (Sesame) 985 1,130 1,200 Fresh Cassava Cassava flour Sweet potato (fresh) Mukene (small dried fish) 2,500 2,700 2,520 All the commodities in the market were more expensive that they were about 2 months ago and only a moderate increase is expected in the next 2 months. A moderate reduction in prices is anticipated only for Sorghum grain. This may be in anticipation of an early harvest of Sorghum (especially the very short-term high yielding variety). Prices for both Cassava 21
22 and Potatoes are expected to increase. The basic inference from this market data is the fact by March the IDP camps were already in a situation of stress and that the situation is not expected to get any better in the next 2 months Household Caloric Intake: Camp HH with Food gap Percentage Average Food Gap Percentage Net food Gap Analysis of Average Food gap Analysis of Net food Gap Deeper Average Better Deeper Average Better Lalogi Palenga Parabongo Pagak Olwal Acet Cwero Olwiyo Anaka Unyama Averages/Totals 82 33% 47% About 82% of the HH interviewed are unable to afford the minimum Recommended Daily Allowance (RDA) of Kilocalorie (Kcal) intake based on the analysis of consumption. The shortfall on RDA is about 33% on average (if all 100 HH are considered) and about 47% if only households with a consumption gap are considered. Based on the gross gap, approximately 57% of the HH have a food gap deeper that 32% of RDA while at net food gap, approximately 36% of the HH had a food gap deeper than 47% of RDA. This implies that: 18% of HH have no food gap; 25% of HH have food gap between 0 to 33% of RDA; 21% of HH have food gap between 33 to 47% of RDA; 36% with a food gap deeper than 47% of RDA. Understanding the clustering of the camps based on the spread and depth of the food gaps reveals that the Lalogi and Acet clusters have about 8 HH with a food gap while the Anaka cluster have 9 and therefore that Lalogi and Acet clusters are better off while the Anaka cluster is worse off in terms of spread. When you consider the depth, the Lalogi cluster is better off with an average depth of 25% of RDA, the Acet cluster is moderate with an average gap of 37% and; the Anaka cluster is worse off with an average gap of 46% of RDA What foods are being accessed and what is the contribution to current intake: Food Lalogi Palenga P Bongo Pagak Olwal Acet Cwero Olwiyo Anaka Unyama Average type Beans Posho Veg-oil Others FoodGap Total
23 The table above is an attempt to analyze household consumption by food types and the extent to which the HH may be able to complement food aid. Beans, Posho (maize meal/grain) and vegetable oil are traditional food aid items and are therefore treated as such. Others reflect the other foods that the HH are able to access and therefore reflect the ability of the HH to complement food aid and the food gap represents the difference between RDA and what the households are able to access. On average, food aid provides about 39% of recommended food intake. Although oil should be making a significant contribution to food consumption, it does not. This is mainly because the nature of use of the oil requires that condiments like onions and tomatoes be procured. In a situation where access to income is difficult, most families are unable to procure the condiments and often, the oil is traded. Consumption of other foods provides an understanding of how the environment around a particular camp facilitates the IDPs ability to complement food aid, albeit inadequately. On average, most IDPs can complement food aid to the tune of 28% of RDA. In camps like Palenga, Pagak, Cwero and Olwiyo the consumption of other foods contribute more to consumption than all the food-aid components together. This is a bit unusual given that all households are ideally provided 65% of their intake through food aid. What is does reflect however is the differential management and use of food aid. The table below is an analysis of the key components of other foods and their contribution as a percentage of the RDA: 3.18 What other foods are being accessed and what is their contribution to recommended daily Kcal intake: Food type Lalogi Palenga P Bongo Pagak Olwal Acet Cwero Olwiyo Anaka Unyama Average Cassava Millet Sorghum S. Potato Minorfoods Total The principle other foods that IDPs are consuming to complement food aid are Cassava at 9%, Sorghum at 7% and Sweet Potatoes at 5%. Minor-foods refers to the traditional pulses that the IDP population can access. Apart from cassava that is ordinarily available throughout the year, the other food types are dried, stored and consumed as appropriate. Many of the households have indicated that the food stored would last less than a month. This leaves cassava as the only plausible complementary food that can be accessed from own production How are the Households coping with the inability to have adequate food? About 62% of the households have had a point in time when they had inadequate food resources and have had to resort to the following coping mechanisms: 23
Rapid Household Economy Analysis, Bidibidi Refugee Settlement, Yumbe District, Uganda
 Rapid Household Economy Analysis, Bidibidi Refugee Settlement, Yumbe District, Uganda Household Economy Analysis (HEA) Assessment conducted by DanChurchAid-DCA and Save the Children, February 2017 Report
Main Findings. WFP Food Security Monitoring System (FSMS) West Darfur State. Round 10 (May 2011)
 West Darfur State. Round 10 (May 2011)") WFP Food Security Monitoring System (FSMS) Round 1 (May 11) West Darfur State Main Findings Data collection was carried out in May 11, which corresponds to the pre hunger season and all the sentinel sites
WFP Food Security Monitoring System (FSMS) Round 1 (May 11) West Darfur State Main Findings Data collection was carried out in May 11, which corresponds to the pre hunger season and all the sentinel sites
15+85A. Situation Overview: Western Bahr el Ghazal, South Sudan. Introduction. Population Movement and Displacement
 Situation Overview: Western Bahr el Ghazal, South Sudan January - March 2018 Introduction. Ongoing conflict in Western Bahr el Ghazal (WBeG) State resulted in a continued deterioration of food security
VULNERABILITY STUDY IN KAKUMA CAMP
 EXECUTIVE BRIEF VULNERABILITY STUDY IN KAKUMA CAMP In September 2015, the World Food Programme (WFP) and the United Nations High Commissioner for Refugees (UNHCR) commissioned Kimetrica to undertake an
FOOD SECURITY MONITORING, TAJIKISTAN
 Fighting Hunger Worldwide BULLETIN February 2017 ISSUE 18 Tajikistan Food Security Monitoring Highlights The food security situation presents expected seasonal variation better in December after the harvest,
Kenya Inter-agency Rapid Assessment Community Group Discussion
 Kenya Inter-agency Rapid Assessment Community Group Discussion General information G1. Take the GPS location G2. Name of the data collector G3. County G4. Sub-County G5. Ward G6. Location G7. Sub-location
EASTERN SUDAN FOOD SECURITY MONITORING
 EASTERN SUDAN FOOD SECURITY MONITORING KASSALA STATE, ROUND 1 JULY 2010 Highlights Round 1 of the FSMS in was carried out at the peak of the lean season. The food security situation in the urban and rural
Kenya Initial Rapid Assessment Community Group Discussion
 Kenya Initial Rapid Assessment Community Group Discussion GENERAL INFORMATION G1. Take the GPS location G3. County G10. Type of crisis G.11 Type of site / settlement G2. Name of the data collector G4.
Rapid Multi Sectoral Needs Assessment in Kukawa, Cross Kauwa and Doro Baga
 Rapid Multi Sectoral Needs Assessment in Kukawa, Cross Kauwa and Doro Baga November 2017 List of Contents Introduction and Methodology... 2 Main findings... 2 Kukawa... 2 Cross Kauwa... 4 Doro Baga...
WINGS Women s Income Generation Support Program. Northern Uganda
 WINGS Women s Income Generation Support Program Northern Uganda Promoting Recovery after War: Micro-enterprises for Vulnerable Women? SAIS International Development Washington, DC, 26th March 2012 By Francesca
Returning Home: Post-Conflict Livelihoods in Northern Uganda. Extended Abstract
 Returning Home: Post-Conflict Livelihoods in Northern Uganda Kim Lehrer Extended Abstract Wars and civil conflicts have substantial destructive impacts. In addition to the direct consequences, conflicts
Community and Household Surveillance in North Western Tanzania: Programme Outcome Monitoring in Nyarugusu Refugee Camp
 Community and Household Surveillance in North Western Tanzania: Programme Outcome Monitoring in Nyarugusu Refugee Camp Undertaken Jointly by WFP and UNHCR May 2010 1 Acknowledgment The survey is the result
SKBN CU Humanitarian Update. May 2017
 Overview SKBN CU Humanitarian Update May 2017 Conflict in and nearby refugee camps puts thousands in danger and threatens the stability of the region during the main planting season. Medical supplies,
GENDER FACTS AND FIGURES URBAN NORTH WEST SOMALIA JUNE 2011
 GENDER FACTS AND FIGURES URBAN NORTH WEST SOMALIA JUNE 2011 Overview In November-December 2010, FSNAU and partners successfully piloted food security urban survey in five towns of the North West of Somalia
Coordination of Afghan Relief (CoAR) Needs Assessment for Water, Sanitation and Hygiene of Pakistan Refugees and IDPs - Afghanistan
 Needs Assessment for Water, Sanitation and Hygiene of Pakistan Refugees and IDPs - Afghanistan") Coordination of Afghan Relief (CoAR) Needs Assessment for Water, Sanitation and Hygiene of Pakistan Refugees and IDPs - Afghanistan Submitted to: UNHCR Date: Contents 1. Introduction 1.1 Background 1.2
Coordination of Afghan Relief (CoAR) Needs Assessment for Water, Sanitation and Hygiene of Pakistan Refugees and IDPs - Afghanistan Submitted to: UNHCR Date: Contents 1. Introduction 1.1 Background 1.2
BANQUE AFRICAINE DE DEVELOPPEMENT
 BANQUE AFRICAINE DE DEVELOPPEMENT Publication autorisée Publication autorisée KENYA: PROPOSAL FOR AN EMERGENCY HUMANITARIAN ASSISTANCE TO POPULATION AFFECTED BY DROUGHT AND FAMINE* LIST OF ACRONYMS AND
Food Crisis in the Horn of Africa: CARE Emergency Fund Seeks $48 million
 More than 1,500 refugees at least 80 percent of them children are arriving at refugee camps in Kenya daily as a result of a widespread food crisis. Food Crisis in the Horn of Africa: CARE Emergency Fund
Under-five chronic malnutrition rate is critical (43%) and acute malnutrition rate is high (9%) with some areas above the critical thresholds.
 and acute malnutrition rate is high (9%) with some areas above the critical thresholds.") May 2014 Fighting Hunger Worldwide Democratic Republic of Congo: is economic recovery benefiting the vulnerable? Special Focus DRC DRC Economic growth has been moderately high in DRC over the last decade,
May 2014 Fighting Hunger Worldwide Democratic Republic of Congo: is economic recovery benefiting the vulnerable? Special Focus DRC DRC Economic growth has been moderately high in DRC over the last decade,
FOOD SECURITY AND OUTCOMES MONITORING REFUGEES OPERATION
 Highlights The yearly anthropometric survey in Kakuma was conducted in November with a Global Acute Malnutrition (GAM) rate of 11.4% among children less than 5 years of age. This is a deterioration compared
Internally Displaced Camps in Lira and Pader Northern Uganda. A Baseline Health Survey. Preliminary Report
 Internally Displaced Camps in Lira and Pader Northern Uganda A Baseline Health Survey Preliminary Report Sick one day, and dead the next. It is scary,if this person can die, what about me? (Mother of 9,
Kakuma Refugee Camp: Household Vulnerability Study
 Kakuma Refugee Camp: Household Vulnerability Study Dr. Helen Guyatt Flavia Della Rosa Jenny Spencer Dr. Eric Nussbaumer Perry Muthoka Mehari Belachew Acknowledgements Commissioned by WFP, UNHCR and partners
Myanmar Displacement in Kachin State
 Myanmar Displacement in Kachin State 28 December 2011 This report is compiled by UN-OCHA with the Humanitarian Country Team partners contribution. It covers the period from 25 October 2011 to 28 December
Horn of Africa Situation Report No. 19 January 2013 Djibouti, Ethiopia, Kenya, Somalia, South Sudan
 Horn of Africa Situation Report No. 19 January 2013 Djibouti, Ethiopia, Kenya, Somalia, South Sudan AT A GLANCE Conditions across the Horn of Africa have improved, however a crisis food security situation
NEPAL. mvam Food Security Monitoring Survey respondents interviewed. 6.2 members per household on average. 17% female headed households
 NEPAL mvam Bulletin #1: June 2017 mvam Food Security Monitoring Survey Mid-Western and Far-Western The eight districts of the mid and far-western mountains of are some of the most food insecure areas in
IRNA Report: [Mundri West and East Counties, Western Equatoria State] [5 th -10 th June 2015]
![IRNA Report: [Mundri West and East Counties, Western Equatoria State] [5 th -10 th June 2015]](/thumbs/95/126107016.jpg "IRNA Report: [Mundri West and East Counties, Western Equatoria State] [5 th -10 th June 2015]") IRNA Report: [Mundri West and East Counties, Western Equatoria State] [5 th -10 th June 2015] Situation overview From 5 th to 10 th June, ADRA team carried a rapid needs assessment in Mundri town, Kotobi
IRNA Report: [Mundri West and East Counties, Western Equatoria State] [5 th -10 th June 2015] Situation overview From 5 th to 10 th June, ADRA team carried a rapid needs assessment in Mundri town, Kotobi
Health Outcomes of Children in Northern Uganda: Does Current IDP Status Matter?
 Health Outcomes of Children in Northern Uganda: Does Current IDP Status Matter? Carlos Bozzoli and Tilman Brück Work in progress Bonn, 4 May 2009 Overview Motivation Literature Methodological approach
JOINT RAPID ASSESSMENT IN GAJIRAM TOWN, NGANZAI LGA, BORNO STATE. BY Action Against Hunger AND NRC. DATE : 3rd JANUARY 2018
 JOINT RAPID ASSESSMENT IN GAJIRAM TOWN, NGANZAI LGA, BORNO STATE BY Action Against Hunger AND NRC DATE : 3rd JANUARY 2018 EXECUTIVE SUMMARY This report present the findings of the joint rapid needs assessment
MALAWI mvam Bulletin #10: October 2016
 Food security improves for the first time in three months in response to humanitarian assistance Key points: Negative coping strategies decrease across the country on account of increased scale up of humanitarian
Tajikistan. Food Security Monitoring System. Highlights. Fighting Hunger Worldwide. June 2014 Number 13
 June 2014 Number 13 Tajikistan Food Security Monitoring System The Food Security Monitoring System (FSMS) provides a seasonal trend of food insecurity in rural Tajikistan by analyzing data from 1,300 rural
Fighting Hunger Worldwide. WFP Response to the Syria Crisis. Funding Appeal to the Kingdom of Saudi Arabia
 Fighting Hunger Worldwide WFP Response to the Syria Crisis Funding Appeal to the Kingdom of Saudi Arabia Emergency Food Assistance to Vulnerable Syrian Populations inside Syria and the Neighbouring Countries
A BRIEF NOTE ON POVERTY IN THAILAND *
 A BRIEF NOTE ON POVERTY IN THAILAND * By Medhi Krongkaew ** 1. Concept of Poverty That poverty is a multi-dimensional concept is beyond dispute. Poverty can be looked upon as a state of powerlessness of
AFGOYE JOINT PROTECTION ASSESSMENT REPORT 2 JULY 2012
 Somalia Protection Cluster BACKGROUND OF MISSION AFGOYE JOINT PROTECTION ASSESSMENT REPORT 2 JULY 2012 Afgoye is thirty kilometers far from the capital city of Mogadishu and is a very strategic town that
REACH Situation Overview: Intentions and Needs in Eastern Aleppo City, Syria
 REACH Situation Overview: Intentions and Needs in Eastern Aleppo City, Syria 18 August 2016 INTRODUCTION Since the closure of Castello road in early July and the ensuing intensification of conflict in
UGANDA: SUDANESE REFUGEES
 UGANDA: SUDANESE REFUGEES emergency appeal no. 01.07/96 situation report no. 1 period covered: January - March 3 May 1996 The increasing levels of insecurity in northern Uganda as rebel groups attack civilian
APRIL Market Assessment in Refugee Areas. Pakelle, Rhino Camp and Kiryandongo Settlements
 APRIL 2014 Market Assessment in Refugee Areas Pakelle, Rhino Camp and Kiryandongo Settlements Hamidu A. Tusiime Analysis, Monitoring & Evaluation (AME) Unit WFP, Kampala APRIL 2014 Executive Summary In
BUDGET REVISION NUMBER 2 TO SUDAN EMERGENCY OPERATION
 BUDGET REVISION NUMBER 2 TO SUDAN EMERGENCY OPERATION Sudan 200151 - Food Assistance to Vulnerable Populations Affected by Conflict and Natural Disasters Cost (United States dollars) Present budget Change
Vulnerability Assessment Framework
 Vulnerability Assessment Framework JORDAN RESPONSE PLAN Key findings June 2015 Developed under an interagency steering committee, including 5 NGOs, 5 UN agencies, BPRM and ECHO Refugees Outside of Camps
WFP SAFE Project in Kenya
 WFP SAFE Project in Kenya Project Summary Report June 2013 This report briefly summarises WFP s Safe Access to Firewood and alternative Energy (SAFE) project in Kenya. SAFE background In 2007, the Inter-Agency
TO: Laurent Bukera, Chief, OMXP DATE: 4 September 2009 FROM: Annalisa Conte, Country Director, Burkina Faso
 TO: Laurent Bukera, Chief, OMXP DATE: 4 September 2009 FROM: Annalisa Conte, Country Director, Burkina Faso PAGE 1 OF 5 (Information note 3 pages, EMOP budget 2 pages) CC: Thomas Yanga, Regional Director,
BUDGET INCREASE TO EMERGENCY OPERATION PAKISTAN (BUDGET REVISION NUMBER 3)
") BUDGET INCREASE TO EMERGENCY OPERATION PAKISTAN 10828.0 (BUDGET REVISION NUMBER 3) Food Assistance to Internally Displaced and Conflict Affected Persons in Pakistan s NWFP and FATA Cost (United States
BUDGET INCREASE TO EMERGENCY OPERATION PAKISTAN 10828.0 (BUDGET REVISION NUMBER 3) Food Assistance to Internally Displaced and Conflict Affected Persons in Pakistan s NWFP and FATA Cost (United States
Rapid Market Assessment. Maban County, Upper Nile State South Sudan
 Rapid Market Assessment Maban County, Upper Nile State South Sudan February 2013 Table of Contents 1. Executive summary... 3 2. Emergency context... 6 3. EMMA methodology... 7 4. The target population...
NFI and Emergency Shelter ASSESSMENT / VERIFICATION REPORT
 NFI and Emergency Shelter ASSESSMENT / VERIFICATION REPORT ASSESSMENT: X VERIFICATION: (tick) Report Date: Assessment Undertaken August 17-23 Assessment/Verification date(s): Location Information State:
Nepal: Oxfam EFSVL response to the Nepal Mid and Far West Floods and Landslides, Oxfam Canada s Intervention CHAF September 01, 2014
 Canadian Humanitarian Assistance Fund (CHAF) Disaster Response Strategy Nepal: Oxfam EFSVL response to the Nepal Mid and Far West Floods and Landslides, 2014 Oxfam Canada s Intervention CHAF September
Somali refugees arriving at UNHCR s transit center in Ethiopia. Djibouti Eritrea Ethiopia Kenya Somalia Uganda. 58 UNHCR Global Appeal
 Somali refugees arriving at UNHCR s transit center in Ethiopia. Djibouti Eritrea Ethiopia Kenya Somalia Uganda 58 UNHCR Global Appeal 2010 11 East and Horn of Africa Working environment UNHCR The situation
SKBN CU Humanitarian Update. August 2017
 Overview SKBN CU Humanitarian Update August 2017 Critical level of immediate and chronic malnutrition, well exceeding WHO emergency thresholds, were captured in a recent SMART survey in. SAM levels in
The World Food Programme (WFP) Jordan FOOD SECURITY OUTCOME MONITORING (FSOM) Quarter 3 (Q3) 2017: Summary Report
 Jordan FOOD SECURITY OUTCOME MONITORING (FSOM) Quarter 3 (Q3) 2017: Summary Report") The World Food Programme (WFP) Jordan FOOD SECURITY OUTCOME MONITORING (FSOM) KEY FINDINGS: Food consumption improved amongst Syrian refugee households in quarter 3 (Q3), for both WFP general food assistance
The World Food Programme (WFP) Jordan FOOD SECURITY OUTCOME MONITORING (FSOM) KEY FINDINGS: Food consumption improved amongst Syrian refugee households in quarter 3 (Q3), for both WFP general food assistance
DISPLACEMENT TRACKING MATRIX (DTM) AFAR REGION, ETHIOPIA ROUND III: JANUARY FEBRUARY 2017 AFAR REGION - KEY FINDINGS.
 AFAR REGION, ETHIOPIA ROUND III: JANUARY FEBRUARY 2017 AFAR REGION - KEY FINDINGS.") AFAR REGION - KEY FINDINGS DISPLACEMENT TRACKING MATRIX (DTM) AFAR REGION, ETHIOPIA ROUND III: JANUARY FEBRUARY 2017 Published: 8 Mar 2017 LOCATION AND CAUSE OF DISPLACEMENT: 36,089 displaced individuals
AFAR REGION - KEY FINDINGS DISPLACEMENT TRACKING MATRIX (DTM) AFAR REGION, ETHIOPIA ROUND III: JANUARY FEBRUARY 2017 Published: 8 Mar 2017 LOCATION AND CAUSE OF DISPLACEMENT: 36,089 displaced individuals
Testimony of Javier Alvarez Senior Team Lead of Strategic Response and Global Emergencies, Mercy Corps
 Testimony of Javier Alvarez Senior Team Lead of Strategic Response and Global Emergencies, Mercy Corps Submitted to the Senate Foreign Relations Subcommittee on African Affairs For the hearing: The Ebola
South Sudan - Jonglei State
 April 06 SUDAN Overview Conflict in Jonglei State first broke out in late December 0, only days after fighting began in Juba. Since then, the state has been one of the worst affected by the conflict, and
1.1 million displaced people are currently in need of ongoing humanitarian assistance in KP and FATA.
 Pakistan: FATA Displacements Situation Report No. 1 (as of 21 May 2013) This report is produced by OCHA Pakistan in collaboration with humanitarian partners. It was issued by OCHA Pakistan. It covers the
MOGADISHU. (July 2011 April 2012)
") MOGADISHU Food Security & Nutrition Situation Trends (July 2011 April 2012) TABLE OF CONTENTS Acknowledgement iv Introduction 1 Methodology 1 Background 2 Markets and Trade 2 Population Movement 2 Household-Level
MOGADISHU Food Security & Nutrition Situation Trends (July 2011 April 2012) TABLE OF CONTENTS Acknowledgement iv Introduction 1 Methodology 1 Background 2 Markets and Trade 2 Population Movement 2 Household-Level
PROJECT BUDGET REVISION FOR APPROVAL BY THE REGIONAL DIRECTOR
 PROJECT BUDGET REVISION FOR APPROVAL BY THE REGIONAL DIRECTOR 5) To: Initials In Date Out Date Reason for Delay Regional Director 4) Through: Initials In Date Out Date Reason for Delay Programme Adviser,
SKBN CU Humanitarian Update. September 2017
 Overview SKBN CU Humanitarian Update September 2017 continues to face a dire humanitarian situation with thousands displaced by violence and flooding. Initial estimates put the number of internally displaced
% of IDP population living in camps that have been registered at the household level
 Key humanitarian indicators have been identified by global clusters and are available for use by country teams to create a composite and ongoing picture of the humanitarian situation. CCCM Indicators C1
E Distribution: GENERAL WFP/EB.A/2001/4-C 17 April 2001 ORIGINAL: ENGLISH POLICY ISSUES. Agenda item 4
 Executive Board Annual Session Rome, 21-24 May 2001 POLICY ISSUES Agenda item 4 For information* WFP REACHING PEOPLE IN SITUATIONS OF DISPLACEMENT Framework for Action E Distribution: GENERAL WFP/EB.A/2001/4-C
The Role of Migration and Income Diversification in Protecting Households from Food Insecurity in Southwest Ethiopia
 The Role of Migration and Income Diversification in Protecting Households from Food Insecurity in Southwest Ethiopia David P. Lindstrom Population Studies and Training Center, Brown University Craig Hadley
ANNUAL REPORT OF THE HUMANITARIAN/RESIDENT COORDINATOR ON THE USE OF CERF GRANTS. Marta Ruedas Reporting Period 01 January 31 December 2008
 ANNUAL REPORT OF THE HUMANITARIAN/RESIDENT COORDINATOR ON THE USE OF CERF GRANTS Country Lebanon Humanitarian / Resident Coordinator Marta Ruedas Reporting Period 01 January 31 December 2008 I. Executive
CAMEROON NW & SW CRISIS CARE EXPLORATORY MISSION REPORT. Sectors: Shelter, NFI, Food security, WASH, Health, Protection, Education
 CAMEROON NW & SW CRISIS EXPLORATORY MISSION REPORT September 2018 Sectors: Shelter, NFI, Food security, WASH, Health, Protection, Education Data collection: 3-09-18 until 9-09-18 Contact person: Anne Perrot-Bihina,
Situation Overview: Awerial, Yirol East and Yirol West Counties, Lakes, South Sudan
 Situation Overview:, and Counties, Lakes, South Sudan July - September 2018 Introduction ern Lakes continued to be affected by intercommunal violence and cattle raids, particularly in areas near county
Impacts of civil war on labour market outcomes in Northern Uganda: Evidence from the Northern Uganda Panel Survey. By Ibrahim Kasirye
 Impacts of civil war on labour market outcomes in Northern Uganda: Evidence from the 2004 2008 Northern Uganda Panel Survey. By Ibrahim Kasirye Economic Policy Research Centre, Plot 51 Pool Makerere University
Rapid Food Security Assessment in Banki, Gwoza and Pulka, Borno State June 2017
 Fighting Hunger Worldwide Nigeria Rapid Food Security Assessment in Banki, Gwoza and Pulka, Borno State June 2017 Key Messages for Decision Makers The prevalence of poor food consumption is relatively
The World Food Programme (WFP) Jordan FOOD SECURITY OUTCOME MONITORING (FSOM) Quarter 4 (Q4) 2016: Summary Report
 Jordan FOOD SECURITY OUTCOME MONITORING (FSOM) Quarter 4 (Q4) 2016: Summary Report") The World Food Programme (WFP) Jordan FOOD SECURITY OUTCOME MONITORING (FSOM) Quarter 4 (Q4) 26: Summary Report Quarter 4 (Q4) 26: Summary Report KEY FINDINGS: The food security situation has overall worsened
The World Food Programme (WFP) Jordan FOOD SECURITY OUTCOME MONITORING (FSOM) Quarter 4 (Q4) 26: Summary Report Quarter 4 (Q4) 26: Summary Report KEY FINDINGS: The food security situation has overall worsened
Persons of concern. provided with food. UNHCR s voluntary repatriation operationtosouthernsudan,whichbeganin2006, continued in 2008.
 Economic growth rates in Uganda are high and well above the average of sub-saharan Africa. Nonetheless, infrastructure constraints, economic problems in the northern part of the country and the persistence
LIBERIA. and Food. Security
 Nimba Refugee Assessment LIBERIA Ivorian Refugee Influx and Food Security March 2011 Data collected from 8 to 13 March 2011 This report was produced by: Sayba Y. Tamba, Food Security Analyst, MOA. sayb.tambyawa@gmail.com
66+34+A. Situation Overview: Unity State, South Sudan. Introduction. Population Movement and Displacement
 Situation Overview: Unity State, South Sudan July-August 2017 Introduction Displacement trends, population needs and humanitarian access have all been negatively affected by the insecurity resulting from
RAPID NEED ASSESSMENT REPORT
 RAPID NEED ASSESSMENT REPORT Syrian Refugees Marj el Khokh Informal Camp Marjeyoun District, South Lebanon 3 rd of April 2013 AVSI Foundation EMERGENCY TEAM Jounieh Ghadir, Rue st. Fawka (Lebanon) Telefax:
THE WAGES OF WAR: How donors and NGOs can build upon the adaptations Syrians have made in the midst of war
 THE WAGES OF WAR: How donors and NGOs can build upon the adaptations Syrians have made in the midst of war FEBRUARY 2018 The scale of death and suffering in Syria is monumental. What began as a series
Quick and Dirty Livelihoods Survey, Kakuma Refugee Camp FIRST DRAFT
 UNIVERSITY OF CAMBRIDGE 1/1 shelterproject.org report title Quick and Dirty Livelihoods Survey, Kakuma Refugee Camp FIRST DRAFT date published July 2003 who undertook the work Jon Fowler jon@shelterproject.org
Map 1: REACH assessment coverage of Greater Equatoria, March - June 2017 MVOLO MUNDRI WEST IBBA! MARIDI YAMBIO YEI
 Situation Overview: Greater Equatoria, South Sudan March - June 2017 Introduction Following the outbreak of violence in Juba in July 2016, the South Sudanese civil war spread from its historic epicentre
Acute Food Insecurity Situation Overview
 TAJIKISTAN Acute Food Insecurity Situation Overview Created on 31/05/2016 Aggregate Numbers Key Findings and Issues Overall, an estimated 12% of the population (about 715,000 people) in rural areas are
Above-average use of food-related coping continued for households in Anbar (20%) and Ninewa (18%) and declined by 11 percent in Salah Al-Din.
 and Ninewa (18%) and declined by 11 percent in Salah Al-Din.") Fighting hunger worldwide Bulletin 11 October 2015 IRAQ October 2015: Food security indicators continue to be poor in Anbar and Ninewa governorates, and for IDPs Highlights Food consumption indicators
Fighting hunger worldwide Bulletin 11 October 2015 IRAQ October 2015: Food security indicators continue to be poor in Anbar and Ninewa governorates, and for IDPs Highlights Food consumption indicators
SUDAN: DROUGHT. The context. appeal no. 17/96 situation report no. 1 period covered: 10 October - 3 November 1996.
 SUDAN: DROUGHT appeal no. 17/96 situation report no. 1 period covered: 10 October - 3 November 1996 11 November 1996 The Red Sea Hills region, located in north-eastern Sudan, is susceptible to chronic
Refugee influx Emergency Vulnerability Assessment (REVA) - Summary Report
 - Summary Report") World Food Programme Subtitle xxx Refugee influx Emergency Vulnerability Assessment (REVA) - Summary Report Cox s Bazar, Bangladesh, December 2017 Data collection supported by: Overall vulnerability to
World Food Programme Subtitle xxx Refugee influx Emergency Vulnerability Assessment (REVA) - Summary Report Cox s Bazar, Bangladesh, December 2017 Data collection supported by: Overall vulnerability to
Supporting Livelihoods in Azraq Refugee Camp
 Supporting Livelihoods in Azraq Refugee Camp A preliminary evaluation of the livelihood and psychological impacts of the IBV scheme in Azraq Refugee Camp, Jordan JULY 2017 Danish Refugee Council Jordan
Syrian Refugee Crisis:
 Syrian Refugee Crisis: Rapid Assessment Amman, Jordan July 2012 A Syrian refugee child receives a meal from the U.N. World Food Programme at his temporary home in the Jordanian city of Al Ramtha, near
RWANDA. Overview. Working environment
 RWANDA 2014-2015 GLOBAL APPEAL UNHCR s planned presence 2014 Number of offices 5 Total personnel 111 International staff 27 National staff 65 UN Volunteers 14 Others 5 Overview Working environment Rwanda
Household Vulnerability and Population Mobility in Southwestern Ethiopia
 Household Vulnerability and Population Mobility in Southwestern Ethiopia David P. Lindstrom Heather F. Randell Population Studies and Training Center & Department of Sociology, Brown University David_Lindstrom@brown.edu
Food Insecurity among Latin American Recent Immigrants in Toronto. Dr. Mandana Vahabi. Dr. Cecilia Rocha. Daphne Cockwell School of Nursing
 Food Insecurity among Latin American Recent Immigrants in Toronto Dr. Mandana Vahabi Daphne Cockwell School of Nursing Dr. Cecilia Rocha School of Nutrition Centre for Studies in Food Security Ryerson
East Africa Hunger Crisis East Africa Hunger Crisis Emergency Response Emergency Response Mid-2017 Updated Appeal Mid-2017 Appeal
 ETHIOPIA SOUTH SUDAN East Africa Hunger Crisis East Africa Hunger Crisis Emergency Response Emergency Response Mid-2017 Updated Appeal Mid-2017 Appeal KEY MESSAGES Deteriorating security situation: All
LÓVUA SETTLEMENT. 13,606 Refugees in Lóvua. 49% Women. 57% Children <18 years old. 3,343 Households. 4,505 Refugees under education age
 FACTSHEET Angola / May 2018 LÓVUA SETTLEMENT 13,606 Refugees in Lóvua 21,705 Refugees receiving assistance in Lunda Norte 3,343 Households 50 Persons with disabilities 57% Children
MALAWI TESTIMONIES. By getting this assistance, I was able to feed my family properly. Estor Elliott
 By getting this assistance, I was able to feed my family properly. Estor Elliott TESTIMONIES "It was fair to receive this additional support because SCT cash amounts are very small and meant for survival.
VERIFICATION (please tick)
") 1. General Information NFI and Emergency Shelter ASSESSMENT / VERIFICATION REPORT Type of Activities* Alert Date ASSESSMENT (please tick) Assessment/Verification Date 1 st -9 th Feb, 2017 VERIFICATION
1. General Information NFI and Emergency Shelter ASSESSMENT / VERIFICATION REPORT Type of Activities* Alert Date ASSESSMENT (please tick) Assessment/Verification Date 1 st -9 th Feb, 2017 VERIFICATION
evsjv `k cwimsl vb ey iv BANGLADESH BUREAU OF STATISTICS Statistics Division, Ministry of Planning
 PRELIMINARY REPORT ON HOUSEHOLD INCOME & EXPENDITURE SURVEY-2010 June, 2011 evsjv `k cwimsl vb ey iv BANGLADESH BUREAU OF STATISTICS Statistics Division, Ministry of Planning Household Income and Expenditure
WFP News Video: WFP Alarmed At Increase in Hunger in South Sudan as Conflict Continues and Rainy Season Approaches
 WFP News Video: WFP Alarmed At Increase in Hunger in South Sudan as Conflict Continues and Rainy Season Approaches TRT: Shot: 20-22 March 2015 Shotlist: 00:00-00:13 UNMISS Protection of Civilians Camp,
South Sudan First Quarterly Operational Briefing. Presentation to the WFP Executive Board
 South Sudan 2015 First Quarterly Operational Briefing Presentation to the WFP Executive Board WFP Auditorium 27 January 2015 SITUATIONAL UPDATE Humanitarian Situation Over 1.9 million people have been
Southern Sudan: Overcoming obstacles to durable solutions now building stability for the future
 Southern Sudan: Overcoming obstacles to durable solutions now building stability for the future Briefing paper - August 2010 After two and a half decades of war, the 2005 Comprehensive Peace Agreement
BUDGET INCREASE TO EMERGENCY OPERATION PAKISTAN (BUDGET REVISION NUMBER 6)
") BUDGET INCREASE TO EMERGENCY OPERATION PAKISTAN 108280 (BUDGET REVISION NUMBER 6) Food Assistance to Internally Displaced and Conflict Affected Persons in Pakistan s NWFP and FATA Cost (United States dollars)
BUDGET INCREASE TO EMERGENCY OPERATION PAKISTAN 108280 (BUDGET REVISION NUMBER 6) Food Assistance to Internally Displaced and Conflict Affected Persons in Pakistan s NWFP and FATA Cost (United States dollars)
Suffering will worsen accross South Sudan without adequate humanitarian support
 Suffering will worsen accross South Sudan without adequate humanitarian support Photo: Jeremiah Young World Vision South Sudan Policy Brief Juba, South Sudan July 22, 2016 Overview: The recent escalation
The Church and Community holistic ministry
 The Church and Community holistic ministry Samuel Ocung, Micah Network Global Consultation, Thailand, 2006 Case Study of Pentecostal Assemblies of God in Uganda Brief history and background of PAG Pentecostal
SKBN CU Humanitarian Update. June 2017
 Overview SKBN CU Humanitarian Update June 2017 Conflict in continues to affect nearly all aspects of life. A complete cessation of hostilities is needed to address the critical humanitarian situation in
PROTECTION RAPID NEED ASSESSMNET IN QARARAT AL-KATEF. PROTECTION RAPID NEED ASEESMENT Qararat al-qataf. PROTECTION SECTOR- LIBYA 28 February, 2018
 PROTECTION RAPID NEED ASEESMENT Qararat al-qataf PROTECTION SECTOR- LIBYA 28 February, 2018 BACKGROUND ON THE RETURN OF TAWARGHA On 26 December 2018, the Libyan Government of National Accord ratified an
Syria Crisis Regional Response M&E Updates. April-June 2014
 Syria Crisis Regional Response M&E Updates April-June Monitoring results from WFP Regional Emergency Operation 200433 Food assistance to vulnerable Syrian populations in Jordan, Lebanon, Iraq, Turkey,
South Sudan 2016 Third Quarterly Operational Briefing
 2016 Presentation to the WFP Executive Board WFP Rome Auditorium Humanitarian Situation The most recent IPC analysis shows that food insecurity has deteriorated across the country, with the most significant
Response to the Somali displacement crisis into Ethiopia, Djibouti and Kenya, 2011
 Response to the Somali displacement crisis into Ethiopia, Djibouti and Kenya, 2011 Donor Relations and Resource Mobilization Service July 2011 Ethiopia, recently arrived Somali refugees waiting to be registered
444% 0-2 years 4% Multi-Sector Needs Assessment - July W Demographics. Camp 23 / Shamlapur, Teknaf, Cox s Bazar, Bangladesh
 +53A 47% +43A 57% Multi-Sector Needs Assessment - July 2018 Background and Methodology An estimated 723,000 Rohingya refugees have fled violence in Myanmar s Rakhine state since August 25, 2017 1. Most
Effects Of Rural Urban Migration By Youths On Agricultural Labour In Aniocha South Local Government Area of Delta State, Nigeria.
 Quest Journals Journal of Research in Agriculture and Animal Science Volume 2 ~ Issue 6 (2014) pp: 14-22 ISSN(Online) : 2321-9459 www.questjournals.org Research Paper Effects Of Rural Urban Migration By
ETHIOPIA HUMANITARIAN FUND (EHF) SECOND ROUND STANDARD ALLOCATION- JULY 2017
 SECOND ROUND STANDARD ALLOCATION- JULY 2017") ETHIOPIA HUMANITARIAN FUND (EHF) SECOND ROUND STANDARD ALLOCATION- JULY 2017 I. OVERVIEW 1. This document outlines the strategic objectives of the EHF Second Standard Allocation for 2017. The document
ETHIOPIA HUMANITARIAN FUND (EHF) SECOND ROUND STANDARD ALLOCATION- JULY 2017 I. OVERVIEW 1. This document outlines the strategic objectives of the EHF Second Standard Allocation for 2017. The document
Situation Overview: Western Equatoria, South Sudan. Introduction. Population Movement and Displacement
 Map based on Longitude (generated) and Latitude (generated) and Latitude (generated). For pane Latitude (generated): Color shows details about A.Indicator color (coverage). Details are shown for County
Published in Switzerland, 2004 by the Joint UNEP/OCHA Environment Unit
 Darfur Crisis Rapid Environmental Assessment at the Kalma, Otash and Bajoum Camps Joint UNEP/OCHA Environment Unit . Published in Switzerland, 2004 by the Joint UNEP/OCHA Environment Unit Copyright 2004
IOM SOUTH SUDAN. New arrivals at the Malakal PoC site. IOM/2015. and economic stress. a continual flow of IDPs arrive at the site each day from
 IOM SOUTH SUDAN 23 July 10 August 2015 H U M A N I TA R I A N U P D AT E # 5 3 HIGHLIGHTS Nearly 10,700 IDPs arrived at Malakal PoC between 1 and 10 August: http://bit.ly/1ibavbt IOM responds to influx