Hand on the plow: South Carolina. Unaddressed disparities among rural minority populations. Jan Probst, PhD Director
|
|
|
- Polly Spencer
- 5 years ago
- Views:
Transcription


1 Hand on the plow: Unaddressed disparities among rural minority populations Jan Probst, PhD Director May 8, 2018
2 Overview Modest progress in some areas Social determinants do not suggest improvement will continue Research and advocacy both needed
3 SOAP Notes Subjective Objective Assessment Plan

4 Subjective: the world is ending!
5 Epidemic of Despair Change in Causes of Death, to , Ages Age Source: Stein et al 2017
6 Objective Despair may be the diagnosis du jour The data illustrate consistent disparities experienced by rural and minority populations Death rates Adverse health conditions
7 AI/AN suicide disparities are longstanding Suicide rate per 100,000 population, by race/ethnicity and residence, age 15 and over, White NonMet Black NonMet AI/AN NonMet White Metro Black Metro AI/AN Metro Rate per 100,000 Population Source: AHRQ Health Disparities Report, 2017
8 Rural mortality disparities date to the 1980 s Age-adjusted mortality, by race and residence, Source: James & Cossman JRH 2016
9 Current death rate disparities vary For American Indian/Alaska Native, African American, and White populations, death rates increase with rurality For Asian/Pacific Islander and Hispanic populations, the patterns are not clear
10 Death rates, AI/AN and White Large Central Metro Large Fringe Metro Medium Metro Small Metro Micropolitan (nonmetro) NonCore (nonmetro) Ai/AN White Author s analysis; CDC 2016 WONDER data, both sexes
11 Death rates, African American and White Large Central Metro Large Fringe Metro Medium Metro Small Metro Micropolitan (nonmetro) Black White NonCore (nonmetro) Author s analysis; CDC 2016 WONDER data, both sexes
12 Death rates, Asian/Pacific Is. and white 1000 Age adjusted death rates, 2016, by race/ethnicity and residence Large Central Metro Large Fringe Metro Medium Metro Small Metro Micropolitan (nonmetro) NonCore (nonmetro) Asian/Pacific White Author s analysis; CDC 2016 WONDER data, both sexes
13 Death rates, Hispanic and White 1000 Age adjusted death rates, 2016, by race/ethnicity and residence Large Central Metro Large Fringe Metro Medium Metro Small Metro Micropolitan (nonmetro) NonCore (nonmetro) Hispanic White Author s analysis; CDC 2016 WONDER data, both sexes
14 Which disorders/diseases contribute to higher rural death rates for white, black and American Indian/Alaska Native populations?

15 Infant mortality, NCHS Data Brief No. 300, February 2018

16 Cancer is part of the problem.
17 Cancer incidence lower in rural Cancer incidence rates, , by race/ethnicity and residence Large Metro Large Rural Small metro Small rural White Black Amer Ind/Alaska Asian/Pacific Hispanic Source: SS6614
18 But death rates are higher in rural 250 Cancer Death Rates, , by race/ethnicity and residence White Black Amer Ind/Alaska Asian/Pacific Hispanic Large Metro Small metro Large Rural Small rural Source: SS6614
19 Assessment Proximate causes of excess mortality: Poor health Adverse behavior patterns Lack of access to care Underlying causes of disparity: Poverty of education and resources
20 Proximate causes Selected health indices, non-core rural counties only, by race/ethnicity, Fair-Poor self reported Health Delayed MD, cost White Black Hispanic Asian AI/AN Source: James et al 2017 Obese
21 Proximate causes: compared to urban Selected self-reported variables, black only, Metro counties compared to Noncore rural counties, BRFSS, selected years Fair-Poor self reported Health Urban (2012, 2015 only) Noncore rural, Delayed MD, cost Insured (any) Age-appropriate mammogram (2012 only) Source: James et al 2017 & author s analysis Obese

22 Not Mayberry: teen births Birth rates among women ages 15-19, by race/ethnicity and residence, White Afr Amer Hispanic Urban Small urban Rural efs/db264.htm
23 Poorer access to consistent care Percent People who identified a hospital, emergency room, or clinic as a source of ongoing care, by residence and race/ethnicity, Large Central Metro Large Fringe Metro Medium Metro Small Metro Micropolitan Noncore White Black Hispanic Drawn from AHRQ Rural Health Disparities Chartbook, 2017 Source: Centers for Disease Control and Prevention, National Center for Health Statistics, National Health Interview Survey, Note: For this measure, lower rates are better. White and Black are non-hispanic. Hispanic includes all races.

24 Distance as barrier to care & prevention Ryan White providers, 50 states, 2008

25 HIV incidence: failure of prevention Source: AIDSVU.org

26 Shortages of health professionals

27 Diabetes Self Management Education Programs Only 38% of rural counties have a DSME Program
28 Rural counties with DSME Are larger (35K versus 16K population) Have lower diabetes prevalence (11.1% v 11.8%) Are whiter: DSME versus other rural: 5.6% black, versus 8.8% 5.6% Hispanic, versus 9.3% Asian Americans: 0.7% versus 0.5% No difference for American Indian/Alaska Native In general, high need areas lack programs Source: Rutledge, et al 2017 Tables 1 & 2

29 Rural residents see these gaps Percent answering no to the question do you think you community has enough Enough doctors? Enough hospitals Rural All US Source: Author s reanalysis of KFF/WaPo Survey June 2017
30 Assessment: Underlying causes Rural Health Action Plan: Year long effort, listening sessions around the state followed by response sessions Rural view of the key issues for health: Can we bring jobs to rural areas? Can we address broken school systems? Can we address gaps in low-income housing?
31 Refresher: Rural minority populations tend to be concentrated: AI/AN in the West, Northwest Hispanic in the South, West African American in the historic South Asian more highly dispersed Quick look at social determinants of health will use maps

32 Recalling geography

33 Recalling geography

34 Recalling geography
35 Recalling geography
36 Recalling geography
37 Ultimate causes Education Poverty Culture
38 Segregated public schools
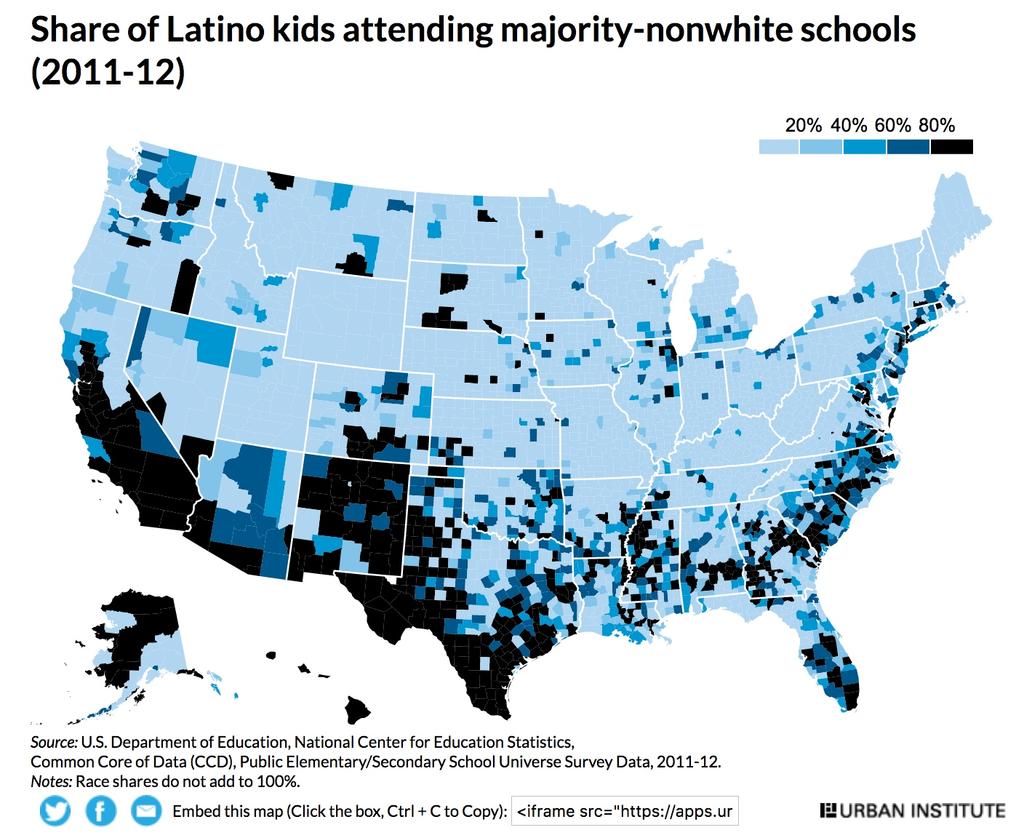
39 Segregated public schools

40 Educational disparities affect health literacy

41 Restricted upward mobility Source:

42 Rural poverty

43 Rural child poverty

44 Lack of health insurance

45 Households with debt in collections Any debt: 27% white 45% nonwhite
46 Households with medical debt Nationally: 16% white 21% nonwhite
47 Reflecting on resources Poor education poor health literacy Low income reduced ability to seek care, afford medications Fewer practitioners Difficulty getting into services Crowded visit schedules Little time for assessment, counseling
48 Assessment: back to culture To be culturally sensitive, we must listen and explore beliefs. But Listening can be alarming: deeply divided communities In, the division is race In other regions, the division may be economic class Communities where some groups of persons are perceived to have inferior cultures And culture has a very long shelf life

49 WWII rejection rates parallel current health disparities Source: Goldstein 1951


50 Historical culture can be problematic DRAFT not for public release No lynchings on record Any through 0.934/10,000 residents > /10,000 residents > 2.508/10,000 residents Photo credit: Samuel Corum/Anadolu Agency via Getty Images
51 Age-adjusted mortality, , by lynching rate category Five-year age adjusted mortality rates for: White Males (N = 1,217) Black Males (N=888) White Females (N=1,217) Black Females (N=873) Lynch rate category: Overall (N=1,221) Category 1: 863 1,014 1, Category 2: 889** 1,032 1,202** 747* 817*** Category 3: 905*** 1,041* 1,218*** * Category 4: 910*** 1,042* 1,220*** ** P values indicate differences between the starred value and the value for Category 1. * p 0.05 ** p 0.01 *** p Category definitions: 1: No lynchings on record 2: Any lynchings through 0.934/10,000 residents 3: More than to 2.508/10,000 residents 4: Greater than /10,000 residents DRAFT not for public release
 Category 2: 17.04 39.43 9.53 25.34 Category 3: 26.55** 43.44 20.10** 41.01** Category 4: 34.94** 31.25 23.68** 30.")
52 Adjusted for county characteristics Change in mortality rates compared to Category 1: Five-year age adjusted mortality rates among: White Males (N = 1,217) Black Males (N=888) White Females (N=1,217) Black Females (N=873) Category 2: Category 3: 26.55** ** 41.01** Category 4: 34.94** ** 30.97* P values indicate differences between the starred value and the value for Category 1. * p 0.05 ** p 0.01 *** p Category definitions: 1: No lynchings on record 2: Any lynchings through 0.934/10,000 residents 3: More than to 2.508/10,000 residents 4: Greater than /10,000 residents DRAFT not for public release Model adjusts for: Population (% African American, % African American squared, and Z-scores for: % unemployed, Median household income, % uninsured, % high school graduates); Community (primary care physician population ratio in quartiles, and dichotomous variables for county metro/non-metro status and USDA classifications as persistent poverty county, farming county, mining county, manufacturing county, or population loss county (2010)) and Social capital (Census response 2010, % of eligibles voting 2008, associations per population 2009, all as Z- scores, and income ratio.
53 Plan Can rural disparities be addressed? Resource disparities could be addressed with political will Cultural disparities are more subtle

54 Two views on culture Vance: those hillbillies have a horrible culture Duncan: divided societies do not equip lower class residents with the tools needed to navigate successfully in a world structured around upper class needs and tastes.
55 Duncan: cultural toolkit Duncan focuses on schools as vehicles for perpetuating either community or disparity In a community where students of all social classes attended a single school system, individual social mobility occurred In two communities with divided school systems, stagnation Schools also identified in s Rural Health Action Plan
56 Expand surveillance and set goals Rural minority double disparities will not be addressed if they are not seen CDC s 11-report rural series is a good beginning, but 2 reports examined racial disparities only within a subset of rural counties (no urban) and 3 did not include race/residence tables
57 Health US series only periodically examines race & residence Percent of working age adults delaying care, by race & residence 30.0 White Urban Large Central Urban Medium and small Rural Small 30.0 Black Urban Large Fringe Rural Micropolitan Source: HUS 2013 Table 75; CDC SS6623-H
58 Set goals Include rural, rural minority, and rural LGBTQ populations in HP2030 goal-setting Include rural, rural minority, and rural LGBTQ populations in AHRQ s Health Disparity series
59 Address disparities in health care resources At a minimum, protect existing infrastructure: Critical access hospitals Rural health clinics Federally qualified health centers Other CMS and state rural funding categories A newer, better Hill-Burton program? Re-examining the concept of minimum necessary facilities Changing the way care is funded Changing the way care is delivered
60 More on funding Expand Medicaid? Of course, it s better than nothing Change the game? Global budgeting for hospitals as a model for health care services as a utility
61 And most importantly. Keep your hand on the plough Think how much worse things might be Hold on
62 Thanks! Our web site: rhr.sph.sc.edu Core funding from: Federal Office of Rural Health Policy, Health Resources & Services Administration, USDHHS Contact:


63 The Rural Health Research Gateway provides access to all publications and projects from eight different research centers. Visit our website for more information. ruralhealthresearch.org Sign up for our alerts! ruralhealthresearch.org/alerts Center for Rural Health University of North Dakota 501 N. Columbia Road Stop 9037 Grand Forks, ND 58202
64 Potentially avoidable hospitalizations for all conditions per 100,000 population, by residence location, stratified by race/ethnicity, 2014 Rate per 100,000 Population 3,000 2,500 2,000 1,500 1, Large Central Metro Large Fringe Metro Medium Metro Small Metro Micropolitan Noncore Total White Black API Hispanic Key: API = Asian or Pacific Islander. Source: Agency for Healthcare Research and Quality (AHRQ), Healthcare Cost and Utilization Project, 2014 State Inpatient Databases disparities analysis file, and AHRQ Quality Indicators, version 4.4. Note: For this measure, lower rates are better. White, Black, and API are non-hispanic. Hispanic includes all races. Data for medium metropolitan, micropolitan, and noncore areas for APIs are not included because these populations did not meet criteria for statistical reliability. Rates are adjusted by age and gender using the total U.S. resident population for 2010 as the standard population.
65 Percent Children ages 2-17 for whom a health provider gave advice within the past 2 years about the amount and kind of exercise, sports, or physically active hobbies they should have, by residence location, stratified by race/ethnicity, 2014 Large Central Metro Large Fringe Metro Medium Metro Small Metro Micropolitan Noncore Total White Black Hispanic Source: Agency for Healthcare Research and Quality, Medical Expenditure Panel Survey, Note: Data unavailable for Blacks in small metropolitan areas. White and Black are non-hispanic. Hispanic includes all races.
Key Facts on Health and Health Care by Race and Ethnicity
 REPORT Key Facts on Health and Health Care by Race and Ethnicity June 2016 Prepared by: Kaiser Family Foundation Disparities in health and health care remain a persistent challenge in the United States.
Minorities in Rural America
 Minorities in Rural America South Carolina Rural Health Research Center Department of Health Administration Norman J. Arnold School of Public Health University of South Carolina Columbia, SC 29203 Michael
SECTION 1. Demographic and Economic Profiles of California s Population
 SECTION 1 Demographic and Economic Profiles of s Population s population has special characteristics compared to the United States as a whole. Section 1 presents data on the size of the populations of
City of Hammond Indiana DRAFT Fair Housing Assessment 07. Disparities in Access to Opportunity
 ANALYSIS EDUCATIONAL OPPORTUNITIES i. Describe any disparities in access to proficient schools based on race/ethnicity, national origin, and family status. ii. iii. Describe the relationship between the
The Integration of Immigrants into American Society WATER SCIENCE AND TECHNOLOGY BOARD
 The Integration of Immigrants into American Society WATER SCIENCE AND TECHNOLOGY BOARD Committee on Population Division of Behavioral and Social Sciences and Education Health Status and Access to Care
California s Congressional District 37 Demographic Sketch
 4.02.12 California s Congressional District 37 Demographic Sketch MANUEL PASTOR JUSTIN SCOGGINS JARED SANCHEZ Purpose Demographic Sketch Understand the Congressional District s population and its unique
Gopal K. Singh 1 and Sue C. Lin Introduction
 BioMed Research International Volume 2013, Article ID 627412, 17 pages http://dx.doi.org/10.1155/2013/627412 Research Article Marked Ethnic, Nativity, and Socioeconomic Disparities in Disability and Health
Income. If the 24 southwest border counties were a 51 st state, how would they compare to the other 50 states? Population
 Executive Summary At the Cross Roads: US / Mexico Border Counties in Transition If the 24 southwest border counties were a 51 st state, how would they compare to the other 50 states? In 1998, former Texas
An Equity Profile of the Southeast Florida Region. Summary. Foreword
 An Equity Profile of the Southeast Florida Region PolicyLink and PERE An Equity Profile of the Southeast Florida Region Summary Communities of color are driving Southeast Florida s population growth, and
 www.actrochester.org Monroe County General Overview Monroe County is the region s urban center and reflects the highs and lows, and stark disparities, of the Finger Lakes region. It has the most educated
OVERVIEW. Demographic Trends. Challenges & Opportunities. Discussion
 People on the Move James H. Johnson, Jr. Frank Hawkins Kenan Institute of Private Enterprise Kenan-Flagler Business School University of North Carolina at Chapel Hill January 2017 OVERVIEW Demographic
Rural America At A Glance
 Rural America At A Glance 7 Edition Between July 5 and July 6, the population of nonmetro America grew.6 percent. Net domestic migration from metro areas accounted for nearly half of this growth. Gains
Low-Skill Jobs A Shrinking Share of the Rural Economy
 Low-Skill Jobs A Shrinking Share of the Rural Economy 38 Robert Gibbs rgibbs@ers.usda.gov Lorin Kusmin lkusmin@ers.usda.gov John Cromartie jbc@ers.usda.gov A signature feature of the 20th-century U.S.
Race, Ethnicity, and Economic Outcomes in New Mexico
 Race, Ethnicity, and Economic Outcomes in New Mexico Race, Ethnicity, and Economic Outcomes in New Mexico New Mexico Fiscal Policy Project A program of New Mexico Voices for Children May 2011 The New Mexico
Understanding Racial Inequity in Alachua County
 Understanding Racial Inequity in Alachua County (January, 2018) Hector H. Sandoval (BEBR) Department of Economics College of Liberal Arts and Sciences University of Florida Understanding Racial Inequity
National Urban League s THE STATE OF BLACK AMERICA 2004
 Executive Summary National Urban League s THE STATE OF BLACK AMERICA 2004 The National Urban League s 2004 edition of The State of America: The Complexity of Progress will explore and examine the progress
The EEO Tabulation: Measuring Diversity in the Workplace ACS Data Users Conference May 29, 2014
 The EEO Tabulation: Measuring Diversity in the Workplace ACS Data Users Conference May 29, 2014 Ana J. Montalvo Industry and Occupation Statistics Branch Social, Economic, and Housing Statistics Division
PROJECTING THE LABOUR SUPPLY TO 2024
 PROJECTING THE LABOUR SUPPLY TO 2024 Charles Simkins Helen Suzman Professor of Political Economy School of Economic and Business Sciences University of the Witwatersrand May 2008 centre for poverty employment
Hispanic Health Insurance Rates Differ between Established and New Hispanic Destinations
 Population Trends in Post-Recession Rural America A Publication Series of the W3001 Research Project Hispanic Health Insurance Rates Differ between and New Hispanic s Brief No. 02-16 August 2016 Shannon
Briefing Book- Labor Market Trends in Metro Boston
 Briefing Book- Labor Market Two other briefing books focus on the importance of formal education and ESOL courses to Boston s foreign-born residents. While there are a number of reasons why improving immigrant
Institute for Public Policy and Economic Analysis
 Institute for Public Policy and Economic Analysis The Institute for Public Policy and Economic Analysis at Eastern Washington University will convey university expertise and sponsor research in social,
Socio-Economic Mobility Among Foreign-Born Latin American and Caribbean Nationalities in New York City,
 Socio-Economic Mobility Among Foreign-Born Latin American and Caribbean Nationalities in New York City, 2000-2006 Center for Latin American, Caribbean & Latino Studies Graduate Center City University of
Counting for Dollars: A Study of Census-guided Financial Assistance to Rural America
 Counting for Dollars: A Study of Census-guided Financial Assistance to Rural America Andrew Reamer, Research Professor George Washington Institute of Public Policy George Washington University Congressional
FOCUS. Native American Youth and the Juvenile Justice System. Introduction. March Views from the National Council on Crime and Delinquency
 FOCUS Native American Youth and the Juvenile Justice System Christopher Hartney Introduction Native American youth are overrepresented in the juvenile justice system. A growing number of studies and reports
The Brookings Institution Metropolitan Policy Program Amy Liu, Deputy Director
 The Brookings Institution Metropolitan Policy Program Amy Liu, Deputy Director Mind the Gap: Reducing Disparities to Improve Regional Competitiveness in the Twin Cities Forum on the Business Response to
Cook County Health Strategic Planning Landscape
 Cook County Health Strategic Planning Landscape Terry Mason, MD COO Cook County Department of Public Health December 21, 2018 1 Cook County Population Change 2000-2010* U.S. Census 2000 population 2010
Disaggregating SDG indicators by migratory status. Haoyi Chen United Nations Statistics Division
 Disaggregating SDG indicators by migratory status Haoyi Chen United Nations Statistics Division Defining migratory status Step 1. Country of birth or citizenship Country of birth: foreign-born vs native
Trends in Medicaid and CHIP Eligibility Over Time
 REPORT Trends in Medicaid and CHIP Eligibility Over Time August 2015 Prepared by: Samantha Artiga and Elizabeth Cornachione Kaiser Family Foundation Executive Summary... 1 Section 1: Eligibility Trends
Post-Secondary Education, Training and Labour September Profile of the New Brunswick Labour Force
 Post-Secondary Education, Training and Labour September 2018 Profile of the New Brunswick Labour Force Contents Population Trends... 2 Key Labour Force Statistics... 5 New Brunswick Overview... 5 Sub-Regional
Disclosure of Conflict of Interest
 Disclosure of Conflict of Interest Disclosure of Relationship Company/Organization(s) If you think this might be perceived as biasing your presentation or a conflict of interest, identify how you will
Advancing Equity and Inclusive Growth in San Joaquin Valley: Data for an Equity Policy Agenda
 Advancing Equity and Inclusive Growth in San Joaquin Valley: Data for an Equity Policy Agenda Equity is the Superior Growth Model Image source: Flickr. Regional indicators database Coverage: 150 largest
Rural Child Poverty across Immigrant Generations in New Destination States
 Rural Child Poverty across Immigrant Generations in New Destination States Brian Thiede, The Pennsylvania State University Leif Jensen, The Pennsylvania State University March 22, 2018 Rural Poverty Fifty
6/8/2015. Webinar Guidelines. Partners and Sponsors
 Webinar Guidelines You will be listening to this webinar over your computer speakers. There is no need to call in. There is a chat box located on the lower right side of your screen for the live webinar.
Tracking Oregon s Progress. A Report of the
 Executive Summary Tracking Oregon s Progress A Report of the Tracking Oregon s Progress (TOP) Indicators Project Many hands helped with this report. We are indebted first of all to the advisory committee
Labor Force Characteristics by Race and Ethnicity, 2015
 Cornell University ILR School DigitalCommons@ILR Federal Publications Key Workplace Documents 9-2016 Labor Force Characteristics by Race and Ethnicity, 2015 Bureau of Labor Statistics Follow this and additional
Disruptive Demographics and the Triple Whammy of Geographic Disadvantage
 Disruptive Demographics and the Triple Whammy of Geographic Disadvantage James H. Johnson, Jr. Frank Hawkins Kenan Institute of Private Enterprise Kenan-Flagler Business School University of North Carolina
WILLIAMSON COUNTY STATISTICAL AREA COMMUNITY HEALTH PROFILE: SOUTH
 2013 WCSA COMMUNITY HEALTH PROFILE: WEST WILLIAMSON COUNTY STATISTICAL AREA COMMUNITY HEALTH PROFILE: SOUTH Executive Summary Williamson County grew 83 percent from 2000 to 2012. Round Rock, the largest
Population. Thursday, March 19, Geography 05: Population and Migration. Population geography. Emigration: Immigration:
 Thursday, March 19, 2015 Geography 05: Population and Migration Population Population geography Distribution of humankind Emigration: The flow of people out of a place Immigration: The flow of people into
Health Issues of Immigrants and Refugees
 Health Issues of Immigrants and Refugees Dr. Chris Greenaway Associate Professor of Medicine, McGill University, Division of Infectious Diseases SMBD-Jewish General Hospital Outline Overview of migration
DOING GOOD AND DOING WELL: WHY EQUITY MATTERS FOR SUSTAINING PROSPERITY IN A CHANGING AMERICA
 DOING GOOD AND DOING WELL: WHY EQUITY MATTERS FOR SUSTAINING PROSPERITY IN A CHANGING AMERICA 11/13 MANUEL PASTOR @Prof_MPastor 1 2 U.S. Change in Youth (
U.S./ Mexico Border Fact Sheet: Demographic Profile
 U.S./ Mexico Fact Sheet: Demographic Profile La Fe Policy Research and Education Center 1313 Guadalupe,Ste 102, * San Antonio, TX, 78207 * 210 208-.9494 B or de r S t a t e s* Non Non B or de r S t a t
Demographic Changes, Health Disparities, and Tuberculosis
 Demographic Changes, Health Disparities, and Tuberculosis Joan M. Mangan, PhD, MST October 22, 2015 Delivering Culturally Competent Patient Education and Care to Tuberculosis Program Clients Austin, TX
Tuberculosis Epidemiology Renai Edwards, MPH July 22, 2008
 TB Nurse Case Management Albuquerque, New Mexico July 22-23, 2008 Tuberculosis Epidemiology Renai Edwards, MPH July 22, 2008 Tuberculosis Epidemiology Renai Edwards, MPH Program Manager TB & Refugee Health
Seattle Public Schools Enrollment and Immigration. Natasha M. Rivers, PhD. Table of Contents
 Seattle Public Schools Enrollment and Immigration Natasha M. Rivers, PhD Table of Contents 1. Introduction: What s been happening with Enrollment in Seattle Public Schools? p.2-3 2. Public School Enrollment
APPENDIX G DEMOGRAPHICS
 APPENDIX G DEMOGRAPHICS Analyzing current and past demographic data is an important step in defining future transportation needs for individuals living and working in the PPUATS Metropolitan Planning Area.
MIGRATION & HEALTH: MEXICAN IMMIGRANT WOMEN IN THE U.S.
 MIGRATION & HEALTH: MEXICAN IMMIGRANT WOMEN IN THE U.S. Mtro. Félix Vélez Fernández Varela Secretario General Consejo Nacional de Población Octubre 2011 Binational Collaboration National Population Council
Executive Director. Gender Analysis of San Francisco Commissions and Boards
 Emily M. Murase, PhD Executive Director Edwin M. Lee Mayor Gender Analysis of San Francisco Commissions and Boards December 2015 Page 1 Acknowledgements The San Francisco Department on the Status of Women
Characteristics of Poverty in Minnesota
 Characteristics of Poverty in Minnesota by Dennis A. Ahlburg P overty and rising inequality have often been seen as the necessary price of increased economic efficiency. In this view, a certain amount
info Poverty in the San Diego Region SANDAG December 2013
 info December 2013 SANDAG Poverty in the San Diego Region Table of Contents Overview... 3 Background... 3 Federal Poverty Measurements... 4 Poverty Status for Individuals in the San Diego Region... 6 Demographic
Rural Poverty in Canada. Robert Annis and Lonnie Patterson Rural Development Institute Brandon University
 Rural Poverty in Canada Robert Annis and Lonnie Patterson Rural Development Institute Brandon University Presentation Overview Poverty as a Human Rights Issue Poverty in Canada Poverty in Rural Canada
Acculturation Measures in HHS Data Collections
 Acculturation Measures in HHS Data Collections Rashida Dorsey, PhD, MPH Director, Division of Data Policy Senior Advisor on Minority Health and Health Disparities Office of the Assistant Secretary for
The Status of Women in Ventura and Santa Barbara Counties
 The Status of Women in Ventura and Santa Barbara Counties March 3, 2010 Foreword March, 2010 One hundred and fifty-three years ago, thousands of women garment workers marched to change their poverty level
A BIRTH COHORT STUDY OF ASIAN AND PACIFIC ISLANDER CHILDREN REPORTED FOR ABUSE OR NEGLECT BY MATERNAL NATIVITY AND ETHNIC ORIGIN
 A BIRTH COHORT STUDY OF ASIAN AND PACIFIC ISLANDER CHILDREN REPORTED FOR ABUSE OR NEGLECT BY MATERNAL NATIVITY AND ETHNIC ORIGIN Megan Finno-Velasquez, PhD, New Mexico State University Lindsey Palmer,
Part 1: Focus on Income. Inequality. EMBARGOED until 5/28/14. indicator definitions and Rankings
 Part 1: Focus on Income indicator definitions and Rankings Inequality STATE OF NEW YORK CITY S HOUSING & NEIGHBORHOODS IN 2013 7 Focus on Income Inequality New York City has seen rising levels of income
CHC BORDER HEALTH POLICY FORUM. The U.S./Mexico Border: Demographic, Socio-Economic, and Health Issues Profile I
 CHC BORDER HEALTH POLICY FORUM The U.S./Mexico : Demographic, Socio-Economic, and Health Issues Profile I Hotel Alburquerque Albuquerque, New Mexico Dec 11-12, 2006 La Fe Policy and Advocacy Center 1327
Joint Center for Housing Studies Harvard University
 Joint Center for Housing Studies Harvard University New Americans, New Homeowners: The Role and Relevance of Foreign-Born First-Time Homebuyers in the U.S. Housing Market Rachel Bogardus Drew N02-2 August
Immigration A Megatrends Backgrounder
 Immigration A Megatrends Backgrounder A Publication of The Council of State Governments TABLE OF CONTENTS Executive Summary 1 1. The Foreign-Born Population in the United States 3 Immigration at the State
LEGACIES OF THE WAR ON POVERTY
 LEGACIES OF THE WAR ON POVERTY Sheldon Danziger President, Russell Sage Foundation Grantmakers Income Security Task Force February 27, 2014 Declaration of War On Poverty President Johnson declared an unconditional
CHIS: A Tool for Monitoring Migrant Health 11 th Summer Institute on Migration and Global Health
 CHIS: A Tool for Monitoring Migrant Health 11 th Summer Institute on Migration and Global Health June 14, 2015 The California Endowment Conference Center Oakland, CA Bogdan Rau, MPH Manager, Online Dissemination
Extrapolated Versus Actual Rates of Violent Crime, California and the United States, from a 1992 Vantage Point
 Figure 2.1 Extrapolated Versus Actual Rates of Violent Crime, California and the United States, from a 1992 Vantage Point Incidence per 100,000 Population 1,800 1,600 1,400 1,200 1,000 800 600 400 200
Foundations of Urban Health. Professor: Dr. Judy Lubin Urban Health Disparities
 Foundations of Urban Health Professor: Dr. Judy Lubin Urban Health Disparities Outline The Sociological Perspective Definitions of Health Health Indicators Key Epidemiological/Public Health Terms Defining
Pulling Open the Sticky Door
 Pulling Open the Sticky Door Social Mobility among Latinos in Nebraska Lissette Aliaga-Linares Social Demographer Office of Latino/Latin American Studies (OLLAS) University of Nebraska at Omaha Overview
Rural Pulse 2019 RURAL PULSE RESEARCH. Rural/Urban Findings March 2019
 Rural Pulse 2019 RURAL PULSE RESEARCH Rural/Urban Findings March 2019 Contents Executive Summary 3 Project Goals and Objectives 9 Methodology 10 Demographics 12 Detailed Research Findings 18 Appendix Prepared
The Health of the California Region Bordering Mexico
 Journal of Immigrant Health, Vol. 6, No. 3, July 2004 ( C 2004) The Health of the California Region Bordering Mexico Alvaro Garza, 1,4 Alfonso Rodriguez-Lainz, 2 and India J. Ornelas 3 Healthy Border (HB)
Patient Centered Demographic Data Collection. Kevin Larsen, MD, FACP Hennepin County Medical Center Center for Urban Health
 Patient Centered Demographic Data Collection Kevin Larsen, MD, FACP Hennepin County Medical Center Center for Urban Health Why us? Diverse patient population Wide health disparities Influx of new immigrants
Community Meetings 2005
 Community Meetings 2005 Health Status Report for West Roxbury February 22, 2005 Presented by the Boston Public Health Commission Boston Neighborhoods Charlestown Allston- Brighton Back Bay Fenway Roxbury
We know that the Latinx community still faces many challenges, in particular the unresolved immigration status of so many in our community.
 1 Ten years ago United Way issued a groundbreaking report on the state of the growing Latinx Community in Dane County. At that time Latinos were the fastest growing racial/ethnic group not only in Dane
Peruvians in the United States
 Peruvians in the United States 1980 2008 Center for Latin American, Caribbean & Latino Studies Graduate Center City University of New York 365 Fifth Avenue Room 5419 New York, New York 10016 212-817-8438
People. Population size and growth. Components of population change
 The social report monitors outcomes for the New Zealand population. This section contains background information on the size and characteristics of the population to provide a context for the indicators
24 indicators that are relevant for disaggregation Session VI: Which indicators to disaggregate by migratory status: A proposal
 SDG targets and indicators relevant to migration 10 indicators that are migration-related Session V: Brief presentations by custodian agencies 24 indicators that are relevant for disaggregation Session
RACE, RESIDENCE, AND UNDEREMPLOYMENT: 50 YEARS IN COMPARATIVE PERSPECTIVE,
 RACE, RESIDENCE, AND UNDEREMPLOYMENT: 50 YEARS IN COMPARATIVE PERSPECTIVE, 1964-2017 Tim Slack, Louisiana State University Brian C. Thiede, Penn State University Leif Jensen, Penn State University Submitted
Tuberculosis Epidemiology-local, state, national and global Scott Lindquist MD MPH State Epidemiologist Washington State Department of Health
 Tuberculosis Epidemiology-local, state, national and global Scott Lindquist MD MPH State Epidemiologist Washington State Department of Health 2014 Global TB Incidence 2014 Global MDR TB rate per 100,000
Canada s Health Region Peer Groups. How do we compare?
 Canada s ealth Region Peer Groups ow do we compare? Prepared by James aggerstone September 18, 2014 The following document is a draft document prepared to bring some of the evidence about this subject
LOOKING FORWARD: DEMOGRAPHY, ECONOMY, & WORKFORCE FOR THE FUTURE
 LOOKING FORWARD: DEMOGRAPHY, ECONOMY, & WORKFORCE FOR THE FUTURE 05/20/2016 MANUEL PASTOR @Prof_MPastor U.S. Change in Youth (
Population Outlook for the Portland-Vancouver Metropolitan Region
 Portland State University PDXScholar Institute of Portland Metropolitan Studies Publications Institute of Portland Metropolitan Studies 2007 Population Outlook for the Portland-Vancouver Metropolitan Region
Disruptive Demographics: Implications for North Carolina s Health and Competitiveness
 Disruptive Demographics: Implications for North Carolina s Health and Competitiveness James H. Johnson, Jr. Frank Hawkins Kenan Institute of Private Enterprise Kenan-Flagler Business School University
U.S. immigrant population continues to grow
 U.S. immigrant population continues to grow Millions 45 40 35 30 25 20 15 10 5 0 Source: PEW Research Center. All foreign-born immigrants Unauthorized immigrants 40.4 38.0 31.1 12.0 11.1 8.4 2000 2007
Le Sueur County Demographic & Economic Profile Prepared on 7/12/2018
 Le Sueur County Demographic & Economic Profile Prepared on 7/12/2018 Prepared by: Mark Schultz Regional Labor Market Analyst Southeast and South Central Minnesota Minnesota Department of Employment and
Migration, Poverty & Place in the Context of the Return Migration to the US South
 Migration, Poverty & Place in the Context of the Return Migration to the US South Katherine Curtis Department of Rural Sociology Research assistance from Jack DeWaard and financial support from the UW
Representational Bias in the 2012 Electorate
 Representational Bias in the 2012 Electorate by Vanessa Perez, Ph.D. January 2015 Table of Contents 1 Introduction 3 4 2 Methodology 5 3 Continuing Disparities in the and Voting Populations 6-10 4 National
Population, Health, and Human Well-Being-- Portugal
 Population, Health, and Human Well-Being-- Portugal EarthTrends Country Profiles Demographic and Health Indicators Portugal Europe World Total Population (in thousands of people) 1950 8,405 548,206 2,519,495
Why disaggregate data on U.S. children by immigrant status? Some lessons from the diversitydatakids.org project
 Why disaggregate data on U.S. children by immigrant status? Some lessons from the diversitydatakids.org project Dolores Acevedo-Garcia, PhD, MPA-URP Samuel F. and Rose B. Gingold Professor of Human Development
BIG PICTURE: CHANGING POVERTY AND EMPLOYMENT OUTCOMES IN SEATTLE
 BIG PICTURE: CHANGING POVERTY AND EMPLOYMENT OUTCOMES IN SEATTLE January 218 Author: Bryce Jones Seattle Jobs Initiative TABLE OF CONTENTS Introduction 1 Executive Summary 2 Changes in Poverty and Deep
Poverty in the Third World
 11. World Poverty Poverty in the Third World Human Poverty Index Poverty and Economic Growth Free Market and the Growth Foreign Aid Millennium Development Goals Poverty in the Third World Subsistence definitions
Six Facts About Undocumented Californians: Analysis of California Health Interview Survey. Snapshot
 Six Facts About Californians: Analysis of 2015 2016 California Health Interview Survey Snapshot June 2018 Age, by Citizenship Status California, 2015 2016 2% 14% 65+ 26 64 19 25 0 18 Fact #1 Children and
JULY Esri Diversity Index
 JULY 2018 Esri Diversity Index Copyright 2018 Esri All rights reserved. Printed in the United States of America. The information contained in this document is the exclusive property of Esri. This work
Laos: Ethno-linguistic Diversity and Disadvantage
 Laos: Ethno-linguistic Diversity and Disadvantage Elizabeth M. King Dominique van de Walle World Bank December 2010 1 The Lao People s Democratic Laos is one of the poorest countries in Southeast Asia
Health Disparities in American Indians: Lack of Indoor Plumbing Increases Health Problems
 Health Disparities in American Indians: Lack of Indoor Plumbing Increases Health Problems Introduction Despite all the public health efforts that have been made with water sanitation and improvement, certain
Evaluating the Role of Immigration in U.S. Population Projections
 Evaluating the Role of Immigration in U.S. Population Projections Stephen Tordella, Decision Demographics Steven Camarota, Center for Immigration Studies Tom Godfrey, Decision Demographics Nancy Wemmerus
 Page 1 of 5 DP02 SELECTED SOCIAL CHARACTERISTICS IN THE UNITED STATES 2013 American Community Survey 1-Year Estimates Although the American Community Survey (ACS) produces population, demographic and housing
Chapter 1: The Demographics of McLennan County
 Chapter 1: The Demographics of McLennan County General Population Since 2000, the Texas population has grown by more than 2.7 million residents (approximately 15%), bringing the total population of the
REPORT TO THE STATE OF MARYLAND ON LAW ELIGIBLE TRAFFIC STOPS
 REPORT TO THE STATE OF MARYLAND ON LAW ELIGIBLE TRAFFIC STOPS MARYLAND JUSTICE ANALYSIS CENTER SEPTEMBER 2005 Law Enforcement Traffic Stops in Maryland: A Report on the Third Year of Operation Under TR
Regional Data Snapshot
 Regional Data Snapshot Population, Economy & Education Features SET Civic Forum Glacial Lakes Region, South Dakota Table of Contents 01 Overview 03 Human Capital 02 Demography 04 Labor Force 01 overview
[MSBA REPORT & RECOMMENDATION ON DEMOGRAPHIC DATA COLLECTION]
![[MSBA REPORT & RECOMMENDATION ON DEMOGRAPHIC DATA COLLECTION]](/thumbs/80/81304411.jpg "[MSBA REPORT & RECOMMENDATION ON DEMOGRAPHIC DATA COLLECTION]") 2014 Minnesota State Bar Association Self-identification Subcommittee of the MSBA Council Copyright 2014 by the Minnesota State Bar Association (MSBA). All rights reserved. No part of this document may
2014 Minnesota State Bar Association Self-identification Subcommittee of the MSBA Council Copyright 2014 by the Minnesota State Bar Association (MSBA). All rights reserved. No part of this document may
National Youth Policy of India 2014: Does it Meet Aspirations of Next Gen?
 11 National Youth Policy of India 2014: Does it Meet Aspirations of Next Gen? 2 Table of Contents 1 Overview...3 2 Objectives of the Policy... 4 3 Analysis of Policy Objectives... 5 4 Analysis of Key
A Rural Policy for the 21 st Century
 A Rural Policy for the 21 st Century Report from the Proceedings of the 2003 Southern Legislative Conference Rural Forum Jonathan Watts Hull Regional Representative On November 7 and 8, 2003, legislators
The Brookings Institution Metropolitan Policy Program Bruce Katz, Director
 The Brookings Institution Metropolitan Policy Program Bruce Katz, Director Redefining Urban and Suburban America National Trust for Historic Preservation September 30, 2004 Redefining Urban and Suburban
OPPORTUNITIES AND BARRIERS RELATED TO INCOME NATIONAL VOICES PROJECT, 2014
 OPPORTUNITIES AND BARRIERS RELATED TO INCOME NATIONAL VOICES PROJECT, 2014 FIELDED SEPTEMBER-OCTOBER, 2014 REPORT 4 Matthew M. Davis, MD, MAPP Kathryn L. Moseley, MD, MPH Susan J. Woolford, MD, MPH Dianne
Case Study on Youth Issues: Philippines
 Case Study on Youth Issues: Philippines Introduction The Philippines has one of the largest populations of the ASEAN member states, with 105 million inhabitants, surpassed only by Indonesia. It also has
Institute for Public Policy and Economic Analysis
 Institute for Public Policy and Economic Analysis The Institute for Public Policy and Economic Analysis at Eastern Washington University will convey university expertise and sponsor research in social,