INTERNATIONAL MIGRATION AND THE UNITED KINGDOM REPORT OF THE UNITED KINGDOM SOPEMI CORRESPONDENT TO THE OECD, 2018
|
|
|
- Catherine Spencer
- 5 years ago
- Views:
Transcription
1 INTERNATIONAL MIGRATION AND THE UNITED KINGDOM REPORT OF THE UNITED KINGDOM SOPEMI CORRESPONDENT TO THE OECD, 2018 Prof. John Salt Migration Research Unit Department of Geography University College London 26 Bedford Way London WC1H 0AP In collaboration with the Home Office and the assistance of Victoria Bauer in the production of tables and figures is gratefully acknowledged
2 EXECUTIVE SUMMARY IMMIGRATION AND EMIGRATION FLOWS Total movement Recent trends in the flow pattern The situation in Countries of origin and citizenship Postscript: the situation in the year ending June SETTLEMENT AND FAMILY MIGRATION Settlement Grants of settlement by category and nationality Family migration CITIZENSHIP Applications and decisions Applications by nationality IMMIGRATION AND THE LABOUR MARKET Stocks of foreign nationals in the UK in Stocks of foreign nationals working in the UK in Foreign workers by nationality and socio-economic class Foreign workers by nationality and region of residence Unemployment among foreign workers in the UK by region of residence Inactivity and employment rate among foreign nationals in the UK by region of residence Country of Birth National Insurance statistics 2017/ ENTRY THROUGH POINTS BASED SYSTEM (PBS) Data availability Tier 1 visa applications and issues Tier 2 Visa applications and issues in 2017 and Tier 2 Certificates of sponsorship in 2017 and Students and Tier 4, Youth mobility and temporary workers 2017 Tier Foreign labour immigration through the PBS and other work categories ASYLUM Asylum applications in Asylum decisions in Applications pending POLICY DEVELOPMENTS Labour migration Students Asylum and resettlement Integration Brexit
3 EXECUTIVE SUMMARY Migration Flows In 2017 there was an increase in the estimated net long-term migration: 282,000 more people entered than left the United Kingdom for at least a year, a 13 per cent increase on The estimated inflow of people to the UK, with the intention to remain for at least one year, was 631,000, an increase of 42,000 on the previous year. Estimated outflow was 349,000, up 9,000 from the previous year. Both British and especially non-british inflows rose, by 5,000 and 37,000 respectively. Net migration of EU citizens fell by 33,000 to 100,000, just over half of the total for 2015 (184,000). Non-EU net migration was 229,000, considerably above that of the year before (176,000), of which 151,000 was attributed to Asian net migration. The estimate of immigration for EU citizens was 239,000, similar to the 2016 estimate of 250,000. Immigration of non-eu citizens saw a statistically significant increase from 265,000 to 313,000. The data therefore indicate that, in 2017, EEA migration fell substantially, but this was offset by a larger rise in non-eea migration, resulting in an increase in overall net migration. The proportion of the overall net migration accounted for by men continued its upward trend, from a low of 35.8% in 2013, to reach 50.4% in Stocks of foreign population and workers Between 2017 and 2018 the total population of the UK rose by 0.7 per cent, similar to the last year, to million. That of UK nationals rose by one per cent, twice the increase of the previous year, to million. 1 For the first time in many years, the population of foreign citizens fell, by 2.4 per cent to million, accounting for 9.2 per cent of the national total (down from 9.5 per cent). This followed a marked slowdown in the growth of the foreign population over the previous year. The proportion of foreign citizens from the EU(15)/EFTA states was relatively stable over the past 4 years, at around 28 per cent of the total foreign citizen population, following a steady rise since However, in 2018 the number fell by 66,000, to million. In 2017, the number of citizens of the A8 accession countries fell for the first time, by 24,000 to million. This trend continued more rapidly in 2018, with a further fall of 246,000, to million. This is the smallest A8 population since 2013, reducing their proportion of the total foreign population from 26.2 to 21.5 per cent. Conversely, the number of A2 citizens (Bulgarians and Romanians) continued to rise an increase of 92,000 to 583,000 meaning this group now comprise 9.7 per cent of the foreign population, compared with 6.8 per cent in In 2018, the number of foreign nationals working in the UK fell slightly, for the first time in decades, by 0.4 per cent over the year. The total workforce increased by 1 per cent, similarly 1 The number of UK nationals has risen steadily in the last few years but the rise in 2018 is particularly high. It cannot be accounted for by greater numbers acquiring UK citizenship nor by increased births. It seems year-onyear sampling error may be responsible. 1
4 to the previous year, to million. The UK domestic workforce grew by 1.2 per cent over the period, and accounted for all of the workforce growth for the year. Over the last decade, the proportion of the foreign workforce accounted for by EU/EFTA countries has increased, to 69 per cent of the total in In 2018, this fell sharply to 64.8 per cent, million workers. Nationals of EU15/EFTA countries numbered million (down from million), accounting for 28.6 per cent of all foreign workers; nationals of A8 accession countries numbered 879,000 (down from 996,000), 24.8 per cent and those of A2 accession countries numbered 390,000 (up from 336,000), 11 per cent. There has been a trend over the last decade, in which the proportion of the foreign workforce in highly skilled jobs has fallen. Since 2015, this proportion has fluctuated, and was 36.7 per cent in For the thirteenth successive year, a smaller proportion of the foreign workforce were in highly skilled occupations than for the domestic workforce. In addition, a higher proportion (29.9 per cent) of foreign nationals were in the least skilled (routine) group, compared to 21 per cent of domestic workers. The EU15/EFTA, and non-eu sources except Africa, continue to be over-represented in highly-skilled occupations. Those from the A8, A2 and Africa were less likely to be in highly-skilled work. Foreign nationals had a higher unemployment rate (4.4 per cent) than the UK domestic workforce (3.9 per cent). EU15/EFTA citizens had a lower unemployment rate (3.8 per cent) than that of all foreign citizens, and also of domestic citizens. Unemployment rate amongst A8 citizens was very low (2 per cent) on a very small number. Unemployment rate among non- EU/EFTA citizens was higher at 6.7 per cent. Africans and those from the Indian Sub Continent and South East Asia had relatively high unemployment rates. In 2018 there were million people living in the UK and born outside the country, down 2 per cent from in 2017, following a decline in growth rate in The foreign born population now constitutes 14 per cent of the total UK population. In 2018, million foreign born people, 17.4 per cent of the UK total, were also working, similar to the previous year, and following a prolonged period of increase. Overall, 60.8 per cent of the foreign born population living in the UK were also working, similar to 2017, and a smaller increase than in recent years. Among the foreign born working population, Poles remained the largest national group (588,000), although this constituted an 11.7 per cent fall over the year, and the second consecutive annual fall; Indians were the second largest group, their number increasing by 14.8 per cent after several years of little change. National Insurance (NINo) data suggest a change may be under way in labour migration to the UK with a general fall in the number of new registrations of foreign workers. In there was a substantial fall from 826,500 to 785,700 new registrations, and a continued fall to 669,800 in The fall over the last year was particularly marked in registrations from the EU accession countries, down 20 per cent from 368,500 to 294,100. The number from the EU(15) fell by 18.5 per cent, a substantially larger fall than the previous year (3.2 per cent). There was no change in the number of NINo registrations from non-eu/efta countries, after a fall of 7.8 per cent in the preceding year. Managed labour migration through the points based system Tier 1 is now largely the domain of entrepreneurs and investors as the UK seeks to attract high net worth immigrants. There were substantial increases in numbers of both in-country and out- 2
5 country visas issued in 2017 compared to 2016, from 2,824 to 4,228 and 2,027 to 2,711, respectively. In 2017, entrepreneurs and investors were again major routes for Tier 1 migrants, accounting for 93.8 per cent of in-country issues and 57.7 per cent of out-country. A major shift in 2016 and 2017 was the rise in other permit free employment - high value category for out-country visa issues, down slightly this year to 27.2 per cent of the total, compared to 33.9 per cent in 2016, although this does correspond to a slight increase in the number of visas issued in this category. There was a substantial increase in the Exceptional talent category in 2016, from 7.5 to 15.1 per cent of all out-country visas, and remained steady at 15.1 per cent in In 2017 there were 156,062 Tier 2 visa issues, similar to the 156,732 in Of these, 87,139 were to principal applicants, down from 89,825 in 2016, and the second highest number since the PBS began. In addition, 68, 923 visas were issued to dependents compared to 66,907 in 2016, which is the highest recorded number. The number of general issues exceeded those for intra-company transfers (ICTs) for the first time in 2016, and this continued in 2017, with general issues comprising 52.9 per cent of the total vs for ICTs. The short-term ICT route was closed in April 2017, and salary threshold for long-term ICTs raised, which may have impacted the number of ICT issues. This suggests a growing general shortage of skills which is being met through labour immigration from non-eea sources. Data for the first six months of 2018 suggest a continuing high level of Tier 2 visa issues, the total number similar to the same period in 2017, down 1.6 per cent to 41,988. The data for this period suggest a similar distribution between general migrants and ICTs both around 49 per cent of the total. The total number of Certificates of Sponsorship (CoS) issued in 2017 was 86,685, less than the 89,167 issued in Indians remained the largest group, but the total number fell from 42,026 to 38,867, their proportion consequently falling from 47.1 to 44.8 per cent. Americans were the second largest group, their proportion stable at around 10 per cent. The number and proportion of ICTs has fallen in recent years, falling from 43,520 in 2016 to 39,305 in Indians continue to dominate this route, accounting for 70.1 per cent of the total. The Resident Labour Market Test (RLMT) route overtook ICTs as the principal route of entry in 2017, comprising 48.2 per cent of the total (up from 43.8 per cent in 2016). Of these, Indians were again the largest group, at 23 per cent of the total. Service rather than manufacturing occupations dominate the list. In 2017, information and communication technology professionals (IT) remained the largest group with 37.7 per cent of the total (32,697), a decrease from 39.7 per cent in 2016, and the first decrease since The main demand for foreign IT workers came from two occupations: programmers and software development professionals (34 per cent of IT workers), closely followed by business analysts, architects and systems designers (33 per cent). Business, research and administrative professionals were the second largest group (9,383 issues, 10.8 per cent of the total). The largest occupational group among these was management consultants and business analysts, comprising 51 per cent, followed by chartered and certified accountants (26 per cent). The pattern of issues during the first six months of 2018 was similar to that for calendar year What seems to be happening is an increasing concentration of certificates on a small group of occupations relating to IT, corporate management and business services. Students In 2017, 179,000 students were given leave to enter for study purposes, more than the year before (170,000) accompanied by 9,000 dependents. In addition, there were 229,000 students visitors coming for periods under a year, 21,000 fewer than the year before. 3
6 Family and settlement There were 65,102 grants of settlement in the UK in 2017, up 7.3 per cent on the previous year (60,670), but this is still considerably below the number granted settlement in 2015 (90,839), and is the second lowest level observed since This slight increase was driven by a 30 per cent increase in the number of asylum-related grants, to 18,730. There were 40,131 family-related visas granted in 2017, an increase of 6 per cent compared with 2016 (37,792). In addition, 66,510 visas were granted to dependants (excluding visitor visas) joining or accompanying migrants in the UK, a 4 per cent increase over the year. Just over two thirds of these were granted to other dependants of workers; the bulk of the remainder were with students. The largest nationality group granted family visas in 2017 was Pakistan, with 7,199 visas issued in Citizenship Applications for British citizenship increased by 10,799 (8.2 per cent) to 141,794 in There were 131,547 British citizenship decisions (including withdrawals) in 2017, 19 per cent less than in 2016 (162,729), and consequently grants of British citizenship decreased by 26,306 (18 per cent) to 123,115. Asylum Asylum applications in the UK from main applicants decreased by 14 per cent to 26,547 in 2017, the second consecutive annual fall in asylum applications, following year-on-year increases since The largest number of applications for asylum came from long-standing national sources: Iran (2,570), followed by Pakistan (2,495), Iraq (2,379), Bangladesh (1,712) and Sudan (1,685). Of the 21,269 initial decisions on asylum applications from main applicants, 32 per cent were grants of asylum or an alternative form of protection, compared to 34 per cent in the previous year. The largest numbers of grants went to nationals of Iran (1,260), Eritrea (1,145), Sudan (816), Syria (689) and Afghanistan (525). Policy The UK Government reached an agreement with the EU, guaranteeing the rights of EU citizens living in the UK, and of UK nationals living in the EU. Further details and guidance about how EU citizens and their families can obtain settled status in the UK were published in June 2018, in the policy paper: EU Settlement Scheme: statement of intent. The EU Settlement Scheme will grant eligibility for settled status to EU citizens and their family members who, by 31 December 2020, have been continuously resident in the UK for five years. Settled status will enable those eligible to stay in the UK indefinitely. EU citizens who arrive in the UK by 31 December 2020 will be able to stay in the UK until they reach the five-year threshold, at which point they may also apply for settled status. Close family members living overseas will still be able to join their family in the UK after 31 December 2020, and future children will also be protected. The UK Government published its migration White Paper on 19 December , which sets out its intentions for the future border and immigration system
7 5
8 1. IMMIGRATION AND EMIGRATION FLOWS Total movement The only source of both immigration and emigration data is the International Passenger Survey (IPS), a sample survey of passengers arriving at and departing from UK air and sea ports and the Channel Tunnel. The number of migrant contacts in the sample is around 4,400. Immigrants and emigrants are defined as those intending to stay in the UK or be away from there for a year or more, having lived out of the UK (for immigrants) or in the UK (for emigrants) for a year or more. The Office for National Statistics suggests that the overall totals derived from the IPS should be adjusted to produce Long Term International Migration (LTIM) statistics. The adjustments generally result in a higher LTIM total than that derived directly from the IPS. Details of the adjustments are in Table 1.1. IPS data are based on intentions and so it is likely that they exclude most people seeking asylum and dependants of asylum seekers. An adjustment is made for these (31,000 in the immigration data for 2017). Further adjustments are made for other people: visitor switchers - those who intend to enter, or leave, the UK for less than 12 months but will actually stay or stay away for longer, numbering 24,000 in 2017; and migrant switchers - those who intend to enter, or leave, the UK for at least 12 months without those intentions being realised, numbering 20,000 in It is not possible to provide some breakdowns by migrant characteristics using LTIM data, so later parts of this section are based on IPS unadjusted statistics. ONS revised its net migration estimates for 2001 to 2011 in light of the results of the 2011 Census, which showed that net migration over this period was higher than suggested by previously published Long-Term International Migration (LTIM) estimates. The revised net migration estimates are for the whole of the UK and are for all citizenship groups combined. Only LTIM net migration estimates have been revised. Research has shown that it is likely that the International Passenger Survey (IPS) missed migrants during the middle part of the decade, following EU Accession in Since 2009, the coverage of the IPS sample has been improved, but prior to 2009, the IPS did not adequately cover regional airports and would have missed immigrants to the UK and emigrants leaving the UK. Therefore users should refer to the revised LTIM net migration estimates when analysing net migration during The Census allows us to estimate net migration across the decade by comparing population estimates at the start and end of the decade and by accounting for other components of change such as births and deaths. Other data sources can be used to distribute net migration across the decade in order to produce the revised estimates. Estimates for immigration and emigration for 2001 to 2011 have not been revised. This is because there are no data sources which can provide robust revised estimates of immigration and emigration across the decade. The Census, for example, would not include any people who immigrated after the 2001 Census and subsequently emigrated before the 2011 Census. More information on the revised estimates is in the ONS report on the 'Quality of Long-Term International Migration Estimates from ' and the related Guidance Note for users on the revised net migration series. 6
9 Confidence intervals at the 95 per cent level are provided for most of the data. Numerical differences between years, even for total numbers, may result from sampling error. More detailed breakdowns typically have wide confidence intervals and should be treated with caution. Thus for 2017 the total inflow is estimated at 631,000 +/- 39,000, giving a range of 592, ,000. The outflow has a confidence interval of +/- 26,000, with a range of 323, ,000. Net migration is in the range of 235, ,000 (Table 1.2). When the Coalition government came to power in May 2010 it stated its principal migration policy objective was to reduce net migration to the UK to the tens of thousands. Upon election in 2015, the new Conservative government reiterated this policy, as did the minority Conservative government after the 2017 general election. Because the only measurement of net migration is derived from the IPS, it has therefore assumed considerable political importance. Table 1.2 for and Figures for summarise the Long Term International Migration (LTIM) adjusted statistics, broken down by citizenship. The tables include confidence intervals. In the year ending () December 2017: Net Long-Term International Migration was + 282,000 (up 33,000 from 2016, but not a statistically significant increase) Immigration was 631,000 (up 42,000 from 2016, a statistically significant increase) Emigration was 349,000 (up 9,000 from 2016, not a statistically significant change) The increase in net migration was the result of an increase in immigration with little change in emigration, in contrast to the year before when immigration fell and emigration rose. Unlike 2016, both British and especially non-british inflows rose, in the former case by 5,000 (not statistically significant) and in the latter by 37,000 (not statistically significant) to 552,000, a historic high. Emigration by British people fell by 8,000 (not statistically significant), that by the non-british rose by 17,000 (again, not statistically significant). Net migration of British citizens fell to -47,000 (not statistically significant); net migration of EU citizens fell by 33,000 (not statistically significant) to 100,000. Non-EU net migration rose by 53,000 to 229,000, a statistically significant increase. The estimate of immigration for EU citizens was 239,000, compared with 250,000 in 2016 (not a statistically significant difference). Immigration of non- EU citizens rose from 265,000 to 313,000 (a statistically significant change). Assessing the trend over the last decade or so for the principal geographical regions is complicated by accessions to the EU and by a change in the regional presentations for non- EEA countries. Prior to 2004 and 2007, the A8 and A2 countries were included in the Other Foreign category and Malta and Cyprus in the New Commonwealth. From 2016 a new regional breakdown (Table 1.2) has replaced the older groupings (Old and New Commonwealths, Other Foreign). Net migration of A8 citizens coming into the UK for a period of at least a year has fluctuated, peaking at 87,000 in 2007 (Table 1.2). In 2015, it was 46,000, a similar level to recent years (except 2012). However, in 2016 and 2017 there was a sharp fall to an increase of only 5-6,000, the result of a large fall in inflow and rise in outflow. Recorded net flows of Bulgarians and Romanians (A2) rose to a peak of 58,000 in 2015 before falling to 40,000 in 2017 as inflow fell and outflow rose. The trend in flows from EU(15) has also changed. Net inflow rose steadily from 2010 to 80,000 in 2015, falling to 46,000 in 2017, again as inflow fell and outflow rose. Overall, in 2017 the UK had a net gain of 229,000 non-eu citizens, up from 176,000 in 7
10 2016 (a statistically significant shift) and 100,000 EU citizens, down from 133,000 (not statistically significant). Asian net migration to the UK, which had been stable for a few years rose significantly from 113,000 to 151,000 (Table 1.2). Net migration from Africa was almost unchanged over the year at 30,000 in 2017; that from the Americas was 18,000, with 20,000 from Oceania. Compared with 2016, in 2017 more British entered and fewer left, although the differences were small; at the same time more non-british arrived and more left. Hence, the main reason for the change in net overall migration over the year was the increased inflow of non- British which comfortably exceeded the rise in outflow. The main source for this increased net migration was the non-eu population. The picture since the early 1990s is presented in Figures For most of the period, total in- and outflow rose, with minor fluctuations. After 2008 outflow fell, with inflow following suit after 2010 but in 2013 the two flows began to diverge again, a trend continued in 2014 and to a lesser extent in 2015 but reversed in 2016 before continuing upwards in 2017 (Figure 1.1). With minor fluctuations, the number of non-british coming to the UK rose steadily from the early 1990s and was relatively stable from 2004 until 2012 since when fluctuations have been more pronounced but with a general upward trajectory (Figure 1.2). The trend in the number of non-british leaving has been fairly flat, tending to rise slightly until 2009, followed by a slow fall until 2015 since when numbers emigrating have risen. The picture for the British population is quite different with emigration consistently exceeding immigration, although after a widening gap in the early years of the millennium recent years show some convergence (Figure 1.3). The scale of flows for the British population is less than that for the non-british. Inflow has fluctuated but over the last 15 years or so has gently trended downwards. The main trend of British outflow was upward until 2006, followed by a fall in most years. The net result of these trends is in Figure 1.4. Fluctuating total net gains have tended generally to mirror those of the non-british population, although after the turn of the century the behaviour of the British population increased in importance as net losses among this group increased, contributing to the overall net population gain. The trend of low net positive migration from the EU(15) was remarkably consistent for much of the period until rising after 2010 to its highest level of the period in 2015, since when it has been falling. 1.2 Recent trends in the flow pattern In the rest of this section, unadjusted data from the IPS only are used so that the total flows are lower than most of those discussed in section 1.1. The gap between the IPS and adjusted statistics was reduced after the early 2000s, mainly because of the inclusion of a smaller asylum adjustment. In 2012 the difference in net flow was 22,000; however, it then rose to reach 54,000 in 2015, falling to 44,000 in 2016 and 18,000 in 2017 (Tables 1.1, 1.3). Because of the small sample size, attention should be paid to the confidence intervals included in individual tables Total flows Table 1.3, using IPS data and not LTIM, takes the long view, over a period of 40 years. In the early years net emigration was characteristic with the emigration peak (-80,000) in Not since 1993 has the country suffered net emigration saw the beginning of a major increase in net immigration while 2017 saw the highest recorded immigration. The flow patterns of foreign citizens and of British citizens differed (Table 1.3). Net emigration characterised 8
11 British flows in virtually every year, reaching 100,000 or more in 1981, 2004 and 2006, but in recent years has fallen. For around 20 years after 1975 foreign net immigration was in the region of 30-50,000 after which it rose and since 2004 has been consistently between 200,000 and 350, The situation in 2017 The regional breakdown used in Tables differs from the standard one historically used by ONS and seen in Tables 1.1, 1.3 and 1.4. It is designed to relate the UK flow pattern more closely with levels of economic development as well as traditional links. The four Indian subcontinental countries (ISC) are grouped together as are all foreign developed countries beyond Europe. The Rest of the World group thus contains the less developed countries, excluding the ISC. In Table 1.5 the traditional regional breakdown, now superseded (see Table 1.2) is also included for comparative purposes with past SOPEMI reports Composition: sex, age and citizenship Previous reports have suggested that the proportions of men and women in the flows have fluctuated. Because of sampling error there are likely to be variations from year to year. The proportion of the overall net gain accounted for by men fell from 56.4% in 2010, to 35.8% in This trend reversed thereafter and by 2017 there was parity between the sexes (Table 1.5). There were differences in the sex balance of net flows between British and non-british citizens, although in both cases men were generally preponderant. Since 2005 they have accounted for the bulk of the net loss of British citizens. On average annually, they were responsible for two thirds of the net loss, ranging from 51.7 per cent in 2009 to 82.1 per cent in 2017 (Table 1.6). For the non-british the average annual gain was 51.9 per cent male, ranging from 42.6 per cent in 2013 to 58.5 per cent in 2010 (53.5 per cent in 2017). Total inflow was again fairly equally balanced between the sexes with a slight preponderance of men, averaging 52.6 per cent since 2005 (Table 1.6). There are some differences by nationality. British and non-british males are equally likely to enter (averaging 52.7 and 52.6 per cent respectively) but the former are more likely to leave (57.7 and 53.4 per cent respectively). Given their predominance in the outward flow, the data suggest they are a little more likely than women to stay abroad. The consistency of this pattern indicates that the explanation is not a lag effect. Among the non-british, males were slightly more predominant in the outflow suggesting that they are more likely than women to come and go and that the latter are more likely to come and stay. The breakdown of gender balance for the non-british between in and out migration reveals geographical differences but proportions vary from year to year (Table 1.6). For the EU and EFTA countries, proportions have fluctuated from year to year with no obvious trend. Flows to and from the ISC are heavily male dominated: 60.2 per cent of immigrants and 69.8 per cent of emigrants. However, in the last three years for the ISC this male domination has been less. The longer term trends show considerable annual fluctuations but there does seem to be a pattern emerging with inflows from the Other Foreign Developed and Rest of the World groups female dominated. The rise in net migration overall in 2017 impacted differently on the various age groups. Net gains were mainly among young people in the age group, the number of whom, at 9
12 170,000 was statistically significantly higher than the 2016 figure of 114,000 (Table 1.7). In contrast, the net gain in the group of 68,000 in 2017 was down on 83,000 the year before although the difference was not statistically significant. The downward trend in the group before 2016 followed the constraints introduced by the government on those coming in to study. Figures show the trend in flows for the age group since 2005 by region of origin. The inflow of British people has been fairly flat in recent years, while outflow rose after 2009 before peaking in 2014 then falling for the next three years; net outflow was mostly flat. The trend for EU15 and EFTA year olds was a small net gain in the last couple of years. The net gain for this age group from the rest of Europe rose in 2017, with more arrivals and a slight fall in departures. The major change was a large net gain for the age group from other parts of the world as inflow rose sharply. As will be seen below, this rise coincides with a substantial increase in the number entering for study purposes. When analysed by citizenship, age and sex the situation becomes more complicated (Table 1.7). Annual variations fluctuate and may be a response to sampling error. In 2017, as in most recent years, there were net losses of British citizens across the board except for the over 60/65s. Although the estimate for this group is small and the confidence interval wide, the pattern is ongoing. The data for British over 60/65s do not suggest large numbers who may have previously emigrated to retire coming back in old age. However, 2017 recorded the highest number of returning Britons over the last 20 years. This may, of course, change if Brexit results in retired Britons deciding to return to the UK. Figures take a broader view, including all those aged over 45. Allowing for annual fluctuations there does seem to be a long term upward growth trend of inflows for both Britons and non-britons (Figure 1.8). For emigration there is a different pattern, with a slight upward trend for the non-british; however, the significant element in Figure 1.9 is the rise in emigration by British over 45s in the first years of the millennium, followed by a sustained fall. Thus far, the reasons for these trends are unexplained. It might be suggested that before the recession British citizens were emigrating for retirement but afterwards this changed. Any secular growth in immigration by this age group may then be a trickle back Reason for moving There is uncertainty over the size of labour flows. The IPS gives us two measurements. The first is based on the main reason given for movement in or out of the country. However, because the survey asks only for the priority reason, it underestimates the size of the real migrant worker flow. Hence, the data should be taken as indicative rather than definitive. In 2013, the ONS introduced a new question to the IPS on reason for original entry for those leaving the UK. Table 1.8 shows the reasons for moving for in-, out- and net flows for OECD and non-oecd countries for For all citizenships, 194,000 said their main reason for coming to the UK was to a definite job and a further 77,000 to look for work, giving a total of 271,000 coming for work-related reasons, 8,000 more than the year before. These changes were not statistically significant. The number leaving for work reasons totalled 183,000 in 2017, slightly more than 171,000 in Of these, 123,000 had a definite job to go to while 60,000 left to look for work. Overall, 45 per cent of arrivals were for work reasons (down from 50 per cent the year before) and 55 per cent of departures (similar to the year before). Hence, by this measure a smaller proportion of immigrants came to the UK for work reasons than that of emigrants 10
13 leaving for work, a pattern common in recent years. However, some of those leaving for work reasons are likely to have entered for study purposes (below). Figures 1.10 and 1.11 show the trends since After a period of growth in work-related movement the recent trend is downward. In contrast the fall in inflow for formal study appears to have been reversed while the graph for family movement (accompany/join) has changed little. Work-related movement has dominated emigration and the pattern across reasons has changed little over the period. Britons were a little more likely to leave for work reasons than to enter: 46.9 per cent (38,000) entered for work reasons, down from 48.6 per cent in 2016, and 50.4 per cent (55,000) left for work reasons, down from 53.7 per cent in Among the non-british, 233,000 (similar to the year before) entered for work reasons in 2017, 44.8 per cent of the total (down from 50 per cent in 2016); 128,000 (57.7 per cent) left for work (106,000 in 2016). A further 188,000 non- British came primarily to study, up from 125,000 in 2016 and similar to the levels in These data reinforce what is now a clear trend for a higher proportion of non-british to come for employment, a lower one for study. Reasons for coming to the UK continue to vary between OECD (excluding the UK) and non- OECD area citizens. Overall, the data suggest that those from richer (OECD) countries continue to be predominantly work motivated while those from elsewhere, although still more likely to express study or family reasons for coming to the UK, are also increasingly likely to come for work reasons. Whereas 56.4 per cent of OECD citizens came for work reasons, down from 64.5 in 2016 and lower than in recent years, only 35.8 per cent of non-oecd citizens did so, a similar proportion 2016 but still higher than most recent years and suggesting that employment is now a more important reason for immigration for this group. Unlike OECD citizens, until recently increasing numbers of those from non-oecd countries came primarily to study, peaking at 63 per cent in 2012, then falling annually to 36.2 per cent in 2016 before rising to 45 per cent in The fall is a response to government policy tightening up on student recruitment, especially in the Further Education sector, and the demise of the Post- Study Work Route. However, this trend has now stopped. Non-OECD citizens were also more likely than those from OECD countries to come primarily as family members accompanying or joining someone else, although in 2017 the difference (15 and 12 per cent) was lower than in previous years Labour migration: usual occupation (prior to migration) An alternative and in some ways better measurement of the scale of labour migration is occupation prior to moving since it records whether or not a person was in the labour market at that time. The data give a further indication of the primary role of employment status in UK immigration. In 2017, a net 298,000 non-british citizens entered the UK, having been in employment before moving, up from 275,000 in A further 81,000 (up from 52,000 in 2016) British entered. In 2017, 60.2 per cent of the total inflow and 75.2 per cent of the outflow were people who had been in employment prior to entry or leaving (Table 1.9). The inflow figure has increased in recent years, that of the outflow now seems to be rising after a period of stability. The difference again implies that more of the inflow was coming into the UK to work, not having worked before entering, than was the case with the outflow, although this difference has been narrowing. 11
14 There are differences between the behaviour of the British and non-british, consistent with the tendency for young people to come for training, study or to learn English, gain employment and then leave, although this might now be changing with a higher proportion already in employment before coming to the UK. A higher proportion of British people had been in employment prior to entering, 79 per cent compared with 57.3 per cent of the foreign population. For both groups, higher proportions of those leaving, 80 and 72.5 per cent respectively, had worked before emigration. These proportionate differences are consistent over recent years The main virtue of these data is that they provide an indication of the skill breakdown of labour flows. The IPS identifies two categories of these people: professional and managerial; manual and clerical. Professional and managerial workers have traditionally accounted for the majority of gainfully employed immigrants. Numbers of non-british in this group rose from 82,000 in 1999, fluctuated around 140,000 during most of the 2000s, fell to 87,000 in 2012, then rose to 152,000 in 2017, 29 per cent of non-british labour immigrants. In contrast, the numbers of professional and managerial British citizens entering or re-entering the country fell steadily during the early 2000s, rose after 2007 with minor fluctuations to 41,000 in The number of professional and managerial British leaving has fluctuated since the recession but has generally fallen, to 50,000 in Non-British professional and managerial emigrant numbers have fluctuated in recent years around 50,000, but rising to 67,000 in The consequence of these trends was that in 2017 the country had a net loss of 9,000 professional and managerial British workers, and gained 85,000 non-british. Once again, the foreign inflow more than made up for the domestic loss, leading to an aggregate gain to the economy of around 80,000. On this evidence, foreign labour immigration leads in aggregate to a substantial net gain in high level skills. The overall figures hide marked differences according to origin and destination (Table 1.9). Traditionally, the richer countries (Europe, Old Commonwealth and Other Developed Regions) have tended to fulfil the role of turnover regions. Experience in recent years suggests that those professional and managerial workers who come to the UK from more developed countries are more likely to go again, those from elsewhere are more likely to stay. In 2017 the richer countries accounted for 60.5 per cent of the inflow of non-british professional and managerial workers but 85 per cent of the outflow. In consequence, they were responsible for 58.8 per cent of the net gain of non-british, leaving the lesser developed regions (Indian Subcontinent, Rest of World ), which are the main object of the PBS, to account for the rest. Figures show the recent trends in the inflow, outflow and net flow of non-british professional and managerial workers by regions of origin and destination. Fluctuations from year to year reflect sampling error but some patterns emerge. The largest source of highly skilled is the EU(15)/EFTA. Overall, differences in the scale of inflows vary by region (Figure 1.12). After several years of generally rising inflows after the recession, 2015 and 2016 saw a reversal in trend. This was followed in 2017 by increases from most sources except for the EU(15)/EFTA where there was a fall. There was limited regional differentiation in outflows, but the general pattern was one of increased outflow except among those from the ISC (Figure 1.13). In 2017 the major change was the rise in outflows of European citizens, especially of citizens of the EU(15)/EFTA. Following the recession the UK sucked in high level skills from all sources. More recently the trend is of decreasing net gains from European sources with, in contrast, increase from the ISC and the Rest of the World (Figure 1.14). 12
15 The situation for manual and clerical workers is somewhat different (Figures ). Like their more skilled counterparts, numbers of manual and clerical non-british immigrants have tended to rise while outflows have been fairly stable at a relatively low level, except for those from Europe where they have recently risen. By 2017, 37,000 departing British manual and clerical workers were more than compensated for by 146,000 foreign citizens arriving from abroad. This translates into a net loss of 14,000 British manual and clerical workers compensated by a net gain of 52,000 non-british. The large net inflow of manual and clerical non-british workers is despite government attempts to introduce greater selectivity in foreign labour immigration and reflects the appetite of British employers for lower skilled workers. The breakdown of non-british manual and clerical worker inflows by origin suggests less annual fluctuation than that for professional and managerial workers (Figure 1.15). The broad picture is of continued immigration by Europeans. The inflow from the rest of Europe (mainly A12) fell as the recession began and was then fairly stable before rising steeply in 2013 and 2014, but from 2015 the increase has been slight. The flow from the EU(15)/EFTA was generally flatter, falling in The selectivity of managed migration beyond Europe means that the trend for the other regions is generally flat. The regional pattern of outflows has also generally been more stable (Figure 1.16). However, both European groups showed an increase in emigration in 2016 and In consequence, their net immigration fell, in contrast to the other regions (Figure 1.17). What these data suggest is that in 2016 and 2017 there was a shift in the flows of more and less skilled labour, measured in terms of their work status and the skill levels of the jobs taken. The recent pattern of rising inflows of non-british more than compensating for rising outflows of the domestic population has continued but at a lower level. There also seems to have been a shift in the balance between the two skill levels. In 1999 professional and managerial workers accounted for 82 per cent of the net gain of non-british workers; by 2013 this proportion had fallen to 47 per cent, since when it has risen to 62 per cent in The geographical pattern has also changed in the last two years, with fewer professional and managerial workers and manual and clerical workers coming from Europe. It seems that the UK labour market appears less attractive to highly skilled workers already doing those jobs elsewhere and that this particularly affects Europeans. With 18 months worth of post-brexit referendum data now available it appears that the decision is now substantially affecting skill flows. 1.4 Countries of origin and citizenship Table 1.10 shows the main countries of last and next residence for British and non-british citizens for Because numbers are generally small, confidence intervals are wide. Recent years have seen some jockeying for positions, with China, India and Romania being the main sources. For all migrants (Table 1.10a) China was the lead source in British citizens (Table 1.10b) were again more likely to be returning from Australia, USA or France; the same countries plus Spain and Canada were their most popular destinations. For non-british immigrants, China, India and Romania were the main countries of last residence, significantly ahead of Poland (Table 1.10c). Poland was the lead country of next residence for non-british citizens, followed by Spain, Germany and China. Table 1.11 combines data relating to citizenship for two years, 2016 and 2017, in order to reduce confidence intervals and allow more countries to be listed, as well as data for 2017 alone. Among foreign immigrants the dominance of Romanians, Chinese and Indians is clear but other European countries are well represented. 13
16 The data in Tables 1.10 and 1.11 show clearly the complex mix of countries with which the UK interacts. In some cases there is an exchange of flows involving nationality and country of last/next residence. For example, Britons go to America and return while Americans come to the UK then leave. In other cases the flow is not reciprocal, most notably between the UK and India. Some flows that were important a few years ago are no longer so, such as immigration (mainly nurses) from the Philippines. Other flows, notably with Western European countries, are a response to proximity and factors such as training, language acquisition, retirement or entrepreneurship. Among the A12 countries, Poland is less important than it was: its citizens come and go (although more stay than go) but it is not a favoured destination for the British population. Romanians still tend to come and stay. Perhaps the most significant trend over the last decade is the growth of flows between the UK and China, while India retains its role as a major flow partner. For 2015 and 2016 the most notable trend was the rise in importance of Romania as a source but this was less so in Postscript: the situation in the year ending June 2018 The information here is taken from the Migration Statistics Quarterly Report, November ( nalmigration/bulletins/migrationstatisticsquarterlyreport/november2018 ) The reporting period for the International Passenger Survey data in this release is for year ending () June 2018 and therefore these data cover two years after the EU Referendum. The data suggest that Brexit has had some impact on the migration behaviour of EU citizens. Table 1.12 summarises flows over recent years by major citizenship groups for years ending June. Long-Term International Migration estimates in the June 2018 (data for June 2017 in parenthesis) were: net migration = 273,000 (226,000) immigration = 625,000 (566,000) emigration = 351,000 (340,000) Net migration of EU citizens was 74,000, the lowest estimate since 2012 and the lowest immigration level since 2014 (Table 1.12). Net migration for EU8 citizens has seen a sharp decrease over the last two years and it is now estimated that in June ,000 more EU8 citizens left the UK than arrived. This has been driven by a decrease in EU8 immigration, particularly for work, and an increase in emigration over the last two years. However, none of the changes in net migration of EU citizens were statistically significant. For non-eu citizens there was a statistically significant increase of 76,000 over the year. Asians accounted for the majority of this increase, again statistically significant. Immigration to the UK for all types of work increased between 2012 and the year ending June 2016 to a peak of 312,000, but has been lower since and was 242,000 in year ending June The decrease was largely accounted for by a fall in the number of EU citizens arriving looking for work, with 37,000 in the year ending June 2018, down from 82,000 at the peak two years earlier. The overall number of EU citizens coming to the UK for a definite job has also fallen, particularly from the EU(15) and at 77,000 was now back to a level similar to those seen in 14
17 2013 and Immigration of non-eu citizens coming to work has been broadly stable since
18 Table Long-Term International Migration adjustments, Components Adjustments thousands Year Long-Term International Irish Northern Asylum Visitor Migrant Seekers International Passenger Republic 3 Ireland adjustment 5 Switchers Switchers Inflow to UK Migration (LTIM) Survey (IPS) All adjustment adjustment
19 Components Adjustments Year Long-Term International Irish Northern Asylum Visitor Migrant Outflow from UK International Passenger Republic 3 Ireland Seekers adjustment 5 Switchers Switchers Migration Survey (LTIM) (IPS) All adjustment adjustment
20 Components Adjustments Year Long-Term International Irish Northern Asylum Visitor Migrant Net Flow International Passenger Republic 3 Ireland Seekers adjustment 5 Switchers Switchers Migration Survey (LTIM) (IPS) All adjustment adjustment
21 Table Long-Term International Migration by citizenship, Year All citizenships British (Including Overseas Territories) Non-British European Union 2 European European European European European Union 2 Union EU15 Union EU8 Union EU2 Union Other Est +/-CI Est +/-CI Est +/-CI Est +/-CI Est +/-CI Est +/-CI Est +/-CI Est +/-CI Inflow O utflow ~ 0~ ~ Balance : : : : : ~
22 Asia Rest of the World Stateless Year Non-European Union 3 All 3 Other Europe 3 All Middle East East South South East All Sub-Saharan North Africa North Central and South Oceania and Central Africa America America Est +/-CI Est +/-CI Est +/-CI Est +/-CI Est +/-CI Est +/-CI Est +/-CI Est +/-CI Est +/-CI Est +/-CI Est +/-CI Est +/-CI Est +/-CI Est +/-CI Inflow ~ 0~ ~ 0~ ~ 0~ ~ 0~ ~ ~ 0~ ~ 0~ ~ 0~ ~ ~ ~ 0~ O utflow ~ 0~ ~ 0~ ~ 0~ ~ 0~ ~ 0~ ~ 0~ ~ 0~ ~ 0~ ~ 0~ ~ 0~ ~ 0~ Balance ~ ~ ~ ~ ~ ~ ~ ~ ~ ~ ~ 20
23 Table International Migration: estimates from the International Passenger Survey by citizenship, 1981 to 2017, thousands (a) Inflows and Outflows Date Total British Non-British of which: EU15 EU25/EU28 Non-EU of which: Old C'wlth In Out In Out In Out In Out In Out In Out In Out In Out In Out New C'wlth Other Foreign 21
24 (b) Net flows Date Total British Non-British of which: EU15 EU25/EU27 Non-EU of which: Old CW New CW Oth. For. *
25 Source: Migration Statistics Unit, Office for National Statistics Notes: These data have been revised in line with recent changes to the weightings sed to gross up the IPS data. Therefore they may not agree with previous estimates that have been published. European Union estimates are shown for the EU15 and, for 2005 and 2006, the EU25 (EU15 and A8 groupings plus Malta and Cyprus), for 2007 onwards, the EU27 (EU25 plus Bulgaria and Romania), for 2013, the EU28 (EU 27 plus Croatia). For 2004 onwards, the New Commonwealth excludes Malta and Cyprus. For 2004 onwards, Other foreign excludes the eight Central and Eastern European member states that joined the EU in May
26 Table International Migration: estimates from the International Passenger Survey by citizenship, 1975 to 2017 Year All citizenships British citizens Non-British citizens Inflow Outflow Balance Inflow Outflow Balance Inflow Outflow Balance estimate +/-CI estimate +/-CI estimate +/-CI estimate +/-CI estimate +/-CI estimate +/-CI estimate +/-CI estimate +/-CI estimate +/-CI Source: Migration Statistics Unit, Office for National Statistics Notes: Migration between the UK and the Republic of Ireland is included in IPS estimates for 2008 onwards but excluded for previous years. This table uses 95% confidence intervals (CI) to indicate the robustness of each estimate. For any given estimate, there is a 95% probability that the true figure lies in the range: estimate +/- confidence interval. Users are advised to be cautious when making inferences from estimates with large confidence intervals. 24
27 Table Overall International Migration: estimates from the International Passenger Survey by citizenship and sex, 2017 In Out Net All +/-CI M +/-CI F +/-CI All +/-CI M +/-CI F +/-CI All +/-CI M +/-CI F +/-CI All Citizenships British Non British EU28 & EFTA EU15 & EFTA Rest of Europe (28) Rest of Europe (15) Old Commonwealth Bangladesh, Pakistan, India & Sri Lanka Other Foreign - developed countries Rest of World European Union European Union Old Commonwealth New Commonwealth (28) New Commonwealth (15) Other Foreign (28) Other foreign (15) thousands Source: Migration Statistics Unit, Office for National Statistics Notes: These data have been revised in line with recent changes to the weightings used to gross up the IPS data. Therefore they may not agree with previous estimates that have been published. Shading is where standard level exceeds acceptable level The EFTA consists of Norway, Iceland, Liechtenstein and Switzerland The Rest of Europe excludes the EFTA countries (15) or (28) after a grouping name indicates where Malta, Cyprus, Croatia and the A8 countries have been assigned This table uses 95% confidence intervals (CI) to indicate the robustness of each estimate. For any given estimate, there is a 95% probability that the true figure lies in the range: estimate +/- confidence interval. Users are advised to be cautious when making inferences from estimates with large confidence intervals. 25
28 Table International Migration: estimates from the International Passenger Survey by citizenship and sex, , percent Inflow M F M F M F M F M F M F M F M F M F M F M F M F M F All citizenships British Non British EU28 & EFTA EU15 & EFTA Rest of Europe (15) Old Commonwealth Bangladesh, Pakistan, India & Sri Lanka Other Foreign - developed countries Rest of the world Outflow All citizenships British Non British EU28 & EFTA EU15 & EFTA Rest of Europe (15) Old Commonwealth Bangladesh, Pakistan, India & Sri Lanka Other Foreign - developed countries Rest of the world Balance All citizenships British Non British EU28 & EFTA EU15 & EFTA Rest of Europe (15) Old Commonwealth Bangladesh, Pakistan, India & Sri Lanka Other Foreign - developed countries Rest of the world Source: Migration Statistics Unit, Office for National Statistics The EFTA consists of Norway, Iceland, Liechtenstein and Switzerland The Rest of Europe excludes the EFTA countries (15) or (28) after a grouping name indicates where Malta, Cyprus, Croatia and the A8 countries have been assigned 26
29 Table International Migration: estimates from the International Passenger Survey by citizenship, age and sex, 2017 Age-group and sex All British Non British EU28 & EFTA EU15 & EFTA Rest of Europe (28) Rest of Europe (15) Old Commonwealth 3 Bangladesh, Pakistan, India & Sri Lanka Other Foreign - developed countries thousands Inflow All ages All /-CI M /-CI F /-CI Under 15 All /-CI M ~ ~ 0~ +/-CI ~ 0~ F ~ /-CI ~ All /-CI M /-CI F /-CI All /-CI M /-CI F /-CI /64 All /-CI M /-CI F ~ ~ 1 +/-CI ~ 1 60/65 and over All ~ ~ 0~ 0~ +/-CI ~ ~ 0~ 0~ M ~ 0~ ~ 0~ +/-CI ~ 0~ ~ 0~ F ~. 0~ +/-CI ~. 0~ Rest of World 27
30 Outflow All ages All /-CI M /-CI F ~ /-CI Under 15 All ~ 0~ 0~ 0~ +/-CI ~ 1 0~ M ~ 0~. 0~ +/-CI ~. 0~ F ~. +/-CI All /-CI M /-CI F ~ /-CI ~ All /-CI M /-CI F ~ /-CI /64 All ~ 1 1 +/-CI ~ 1 1 M ~ 1 1 +/-CI ~ 1 1 F ~ 0~.. 0~ +/-CI ~ 60/65 and over All ~. +/-CI M /-CI F ~. +/-CI
31 Balance All ages All /-CI M /-CI F /-CI Under 15 All /-CI M /-CI F /-CI All /-CI M /-CI F /-CI All /-CI M /-CI F /-CI /64 All /-CI M /-CI F /-CI /65 and over All /-CI M /-CI F /-CI Source: Migration Statistics Unit, Office for National Statistics Notes: These data have been revised in line with recent changes to the weightings used to gross up the IPS data. Therefore they may not agree with previous estimates that have been published. European Union estimates are shown for the EU15 and EU27 (EU25 plus Bulgaria and Romania). The EFTA consists of Norway, Iceland, Liechtenstein and Switzerland The Rest of Europe excludes the EFTA countries (15) or (27) after a grouping name indicates where Malta and Cyprus and the A8 countries have been assigned. - No contact. "0~" - rounded to zero. This table uses 95% confidence intervals (CI) to indicate the robustness of each estimate. For any given estimate, there is a 95% probability that the true figure lies in the range: estimate +/- confidence interval. Users are advised to be cautious when making inferences from estimates with large confidence intervals. 29
32 Table International Migration: estimates from International Passenger Survey by Citizenship by reason for visit, Citizenship Total Definite job Looking for work Accompany / join Study Working holiday O ther No reason stated estimate +/-CI estimate +/-CI estimate +/-CI estimate +/-CI estimate +/-CI estimate +/-CI estimate +/-CI estimate +/-CI All citizenships Inflow O utflow Balance
33 All OECD countries Inflow O utflow Balance
34 British Inflow ~ 0~ O utflow Balance
35 Other OECD Inflow O utflow Balance
36 Non OECD Inflow ~ 0~ O utflow Balance ~ 0~
37 So urce: Office fo r Natio nal Statis tics (ONS). No tes : "." - No co ntact. Migratio n between the UK and the Republic o f Ireland is included in IP S es timates fo r 2008 o nwards but excluded fo r previo us years. This table uses 95% confidence intervals (CI) to indicate the robustness of each estimate. For any given estimate, there is a 95% probability that the true figure lies in the range: estimate +/- confidence interval. Users are advised to be cautious when making inferences from estimates with large confidence intervals. 35
38 Table International Migration: estimates from International Passenger Survey by usual occupation and citizenship, 2017 Total estimates +/- CI Professional/Managerial +/-CI estimates Manual and clerical +/- estimates CI thousands Others estimates Inflow All Citizenships British Non British EU28 & EFTA EU15 & EFTA Rest of Europe (28) Rest of Europe (15) Old Commonwealth Bangladesh, Pakistan, India & Sri Lanka Other Foreign - developed countries Rest of World Outflow All Citizenships British Non British EU28 & EFTA EU15 & EFTA Rest of Europe (28) Rest of Europe (15) Old Commonwealth Bangladesh, Pakistan, India & Sri Lanka Other Foreign - developed countries Rest of World Balance All Citizenships British Non British EU28 & EFTA EU15 & EFTA Rest of Europe (28) Rest of Europe (15) Old Commonwealth Bangladesh, Pakistan, India & Sri Lanka Other Foreign - developed countries Rest of World /- CI Source: Migration Statistics Unit, Office for National Statistics Notes: EU15 countries are Austria, Belgium, Denmark, Finland, France, Germany, Greece, the Irish Republic, Italy, Luxembourg, Netherlands, Portugal, Spain and Sweden. EU28 countries are EU15 plus the 13 countries of Bulgaria, Cyprus, the Czech Republic, Estonia, Hungary, Latvia, Lithuania, Malta, Romania, Poland, Slovakia, Slovenia and Croatia. Other citizenships are those not included in British or in EU15. This table uses 95% confidence intervals (CI) to indicate the robustness of each estimate. For any given estimate, there is a 95% probability that the true figure lies in the range: estimate +/- confidence interval. Users are advised to be cautious when making inferences from estimates with large confidence intervals. 36
39 Table International migration, estimates from International Passenger Survey, 2017, thousands a) Top 15 countries of last or next residence of all migrants Country of Last Residence Country of Next Residence Country In-migrants +/-CI Country Out-migrants +/-CI China Spain 29 8 India 48 9 Australia 26 6 Romania Poland 24 7 USA 32 8 USA 20 6 Australia 30 8 Germany 17 7 Spain 27 8 France 16 6 France China 15 4 Poland 23 8 Romania 11 6 Italy 19 7 Italy 11 5 New Zealand 16 8 India 11 3 Germany 16 6 Republic of Ireland 11 8 Pakistan 16 5 Canada 10 4 Portugal 15 8 New Zealand 7 2 Greece 13 7 Greece 6 6 Republic of Ireland 12 9 Portugal 6 4 c) Top 10 countries of last or next residence of migrants who are not British b) Top 10 countries of last or next residence of migrants who are British citizens citizens Country of Last Residence Country of Next Residence Country of Last Residence Country of Next Residence Country In-migrants +/-CI Country Out-migrants +/-CI Country In-migrants +/-CI Country Out-migrants +/-CI Australia 11 5 Australia 19 5 China Poland 23 7 USA 10 5 Spain 11 4 India 48 9 Spain 18 6 France 9 10 USA 11 4 Romania Germany 15 7 Spain 8 4 Canada 6 3 Poland 23 8 China 14 4 United Arab Emirates 4 4 France 6 3 USA 22 7 Romania 11 6 New Zealand 4 3 New Zealand 5 2 Australia 19 6 France 10 5 Germany 3 2 India 3 2 Spain 19 7 Italy 10 5 Greece 3 3 Germany 3 2 Italy 18 6 Republic of Ireland 10 8 Hong Kong 2 2 Thailand 3 2 Portugal 15 8 USA 9 4 Pakistan 2 2 Portugal 3 3 France 15 5 India 8 3 Source: Migration Statistics Unit, Office for National Statistics Notes: This table uses 95% confidence intervals (CI) to indicate the robustness of each estimate. For any given estimate, there is a 95% probability that the true figure lies in the range: estimate +/- confidence interval. Users are advised to be cautious when making inferences from estimates with large confidence intervals. 37
40 Table Long-Term International Migration, estimates from the International Passenger Survey, top 20 End Years combined thousands End Year 2017 thousands Citizenship of Immigrants Citizenship of Emigrants Citizenship of Immigrants Citizenship of Emigrants Citizenship Immigrants +/- CI Citizenship Emigrants +/- CI Citizenship Immigrants +/- CI Citizenship Emigrants +/- CI British British British British Romania Poland China Poland 25 7 China China 26 5 Romania Spain 15 6 India Spain 25 7 India 50 9 Romania 15 7 Poland Romania 25 9 Poland 25 9 China 14 4 Italy 45 9 Italy 23 6 USA 19 6 Italy 13 5 France 39 9 France 21 7 Italy 19 6 France 12 5 Spain India 19 4 Spain 18 7 Republic of Ireland 10 8 USA 36 8 Republic of Ireland 17 9 Australia 18 6 India 8 3 Australia 31 7 USA 16 5 Pakistan 15 5 Germany 8 5 Portugal Germany 16 7 Portugal 15 8 USA 8 4 Pakistan 26 6 Australia 14 4 France 14 5 Australia 8 3 Germany 21 7 Canada 10 5 Germany 12 5 Hungary 6 4 Republic of Ireland Lithuania 10 6 New Zealand 12 8 Portugal 5 3 Nigeria 16 6 Portugal 9 4 Greece 11 7 Czech Republic 5 5 New Zealand 15 8 Czech Republic 9 5 Nigeria 10 5 Greece 5 6 Greece 15 7 Hungary 8 4 Republic of Ireland 10 8 Slovakia 5 4 Turkey 13 7 Slovakia 8 4 Cyprus, Southern 9 8 Bulgaria 4 3 Hong Kong 13 5 Bulgaria 6 3 Hong Kong 8 4 Japan 3 2 Netherlands 13 6 Malaysia 6 3 Hungary 8 4 Canada 3 2 Source: Migration Statistics Unit, Office for National Statistics Notes: This table uses 95% confidence intervals (CI) to indicate the robustness of each estimate. For any given estimate, there is a 95% probability that the true figure lies in the range: estimate +/- confidence interval. Users are advised to be cautious when making inferences from estimates with large confidence intervals. 38
41 Table Long-Term International Migration, by citizenship, Years ending June British EU Non_EU Total Inflow Ye Jun Ye Jun Ye Jun Ye Jun Ye Jun Ye Jun Ye Jun Outflow Ye Jun Ye Jun Ye Jun Ye Jun Ye Jun Ye Jun Ye Jun Balance Ye Jun Ye Jun Ye Jun Ye Jun Ye Jun Ye Jun Ye Jun Source: Migration Statistics Unit, Office for National Statistics 39
42 Table Latest changes in net migration by citizenship, thousands Ye Jun 17 95% CI Ye Jun 18 95% CI Difference Total / / British / /-23-1 EU / / (of which) EU / /-24-7 (of which) EU / /-18-7 (of which) EU / /-15-6 Non-EU / / (of which) Asia / / (of which) Rest of World / / Source: Office for National Statistics, Long-T erm International Migration Notes: 1. EU other and Other Europe citizenship groupings are not included as separate groups in the table but are included under the EU and non-eu totals estimates are provisional. 3. Figures are rounded to the nearest thousand. Figures may not sum due to rounding. 4. CI is Confidence Interval. Further information on confidence intervals can be found in the Migration Statistics Quarterly Report Information for Users. 5. is year ending. 6. Statistically significant change at the 5% level is indicated by an asterisk. 40
43 Thousands Figure Long-Term International Migration Total In- and Outflows Inflow Outflow Source: International Passenger Survey, Office for National Statistics 41
44 Thousands Figure Long-Term International Migration Non-British Citizens In- and Outflows Inflow Outflow Source: International Passenger Survey, Office for National Statistics 42
45 Thousands Figure Long-Term International Migration British Citizens In- and Outflows Inflow Outflow Source: International Passenger Survey, Office for National Statistics 43
46 Thousands Figure Long-Term International Migration Net Flows By Citizenship Total British Non- British EU Source: International Passenger Survey, Office for National Statistics 44
47 Thousands 160 Figure Inflow by age and citizenship British 80 EU & EFTA (15) Rest of Europe (15) 60 Other Source: International Passenger Survey, Office for National Statistics 45
48 Thousands Figure Outflow by age and citizenship British EU & EFTA (15) Rest of Europe (15) Other Source: International Passenger Survey, Office for National Statistics 46
49 Thousands Figure Netflow by age and citizenship British EU & EFTA (15) Rest of Europe (15) Other Source: International Passenger Survey, Office for National Statistics 47
50 Thousands Figure Inflow by age 45 and over and by citizenship Source: International Passenger Survey All British Non British 48
51 Thousands Figure Outflow by age 45 and over and by citizenship Source: International Passenger Survey All British Non British 49
52 Thousands 350 Figure Reasons for immigration, December March Dec 04 Dec 05 Dec 06 Dec 07 Dec 08 Dec 09 Mar 10 Jun 10 Sep 10 Dec 10 Mar 11 Jun 11 Sep 11 Dec 11 Mar 12 Jun 12 Sep 12 Dec 12 Mar 13 Jun 13 Work Related Accompany / Join Formal study Other No reason stated Sep 13 Dec 13 Mar 14 Jun 14 Sep 14 Dec 14 Mar 15 Jun 15 Sep 15 Dec 15 Mar 16p Jun 16p Sep 16p Dec 16p Mar 17p Jun 17p Sep 17p Dec 17p Mar 18p Source: International Passenger Survey 50
53 Thousands 250 Figure Reasons for emigration, December March Dec 04 Dec 05 Dec 06 Dec 07 Dec 08 Dec 09 Mar 10 Jun 10 Sep 10 Dec 10 Mar 11 Jun 11 Sep 11 Dec 11 Mar 12 Jun 12 Sep 12 Dec 12 Mar 13p Jun 13p Sep 13p Dec 13p Mar 14p Jun 14p Sep 14p Dec 14p Mar 15p Jun 15p Sep 15p Dec 15p Mar 16p Jun 16p Sep 16p Dec 16p Mar 17p Jun 17p Sep 17p Dec 17p Mar 18p Work Related Accompany / Join Formal study Other No reason stated Source: International Passenger Survey 51
54 Thousands Figure Inflow of Professional and Managerial workers by citizenship EU & EFTA (15) Rest of Europe (15) Old Commonwealth Bangladesh, Pakistan, India & Sri Lanka Other Foreign - developed countries Rest of the world Source: International Passenger Survey 52
55 Thousands Figure Outflow of Professional and Managerial workers by citizenship EU & EFTA (15) Rest of Europe (15) Old Commonwealth Bangladesh, Pakistan, India & Sri Lanka Other Foreign - developed countries Rest of the world Source: International Passenger Survey 53
56 Thousands Figure Net flow of Professional and Managerial workers by citizenship EU & EFTA (15) + 15 Rest of Europe (15) Old Commonwealth Bangladesh, Pakistan, India & Sri Lanka Other Foreign - developed countries Rest of the world Source: International Passenger Survey 54
57 Thousands Figure Inflow of Manual and Clerical workers by citizenship EU & EFTA (15) Rest of Europe (15) Old Commonwealth Bangladesh, Pakistan, India & Sri Lanka Other Foreign - developed countries Rest of the world Source: International Passenger Survey 55
58 Thousands Figure Outflow of Manual and Clerical workers by citizenship EU & EFTA (15) 40 Rest of Europe (15) Old Commonwealth Bangladesh, Pakistan, India & Sri Lanka Other Foreign - developed countries Rest of the world Source: International Passenger Survey 56
59 Thousands Figure Net flow of Manual and Clerical workers by citizenship EU & EFTA (15) Rest of Europe (15) Old Commonwealth Bangladesh, Pakistan, India & Sri Lanka Other Foreign - developed countries Rest of the world Source: International Passenger Survey 57
60 2. SETTLEMENT AND FAMILY MIGRATION The data for this section are taken from the Home Office publication Immigration Statistics, Year ending June 2018 ( ). The chapter focuses on the 2017 calendar year, but where available, the latest figures for the first half of 2018 are provided. 2.1 Settlement The statistics in this section show the number of people, subject to immigration control, who were granted or refused permission to stay indefinitely. The numbers of applications and decisions made reflect changes over time in levels of those entering the country, as well as policy and legislative changes, which, for example, may affect the number of people potentially eligible for settlement Grants of settlement by category and nationality The number of people granted settlement in the UK in 2017 was 65,102, an increase of 7.3 per cent on the 60,670 grants in Despite the slight increase in 2017, the number granted settlement in 2017 was the second smallest since The level of settlement in the two most recent years contrasts against that observed in years prior to 2016, as presented in Table 2.1. Prior to 2016, the number granted settlement was many multiples greater than those observed to settle in 2017, with the level of annual settlement peaking in 2010 (with 241,192 settling), at almost four times the number settling in Although there has been a declining trend in recent years in the total number of people granted settlement in the UK, the first half of 2018 saw a total of 46,877 people granted settlement, 72.0 per cent of the total granted in 2017, and 53.1 per cent more than in the first half of 2017, suggesting the downward trend could be reversing in The fall in grants of settlement observed since 2016 compared to the previous decade is because of fewer employment related grants and those due to family formation or reunion (Figure 2.2). Employment related grants fell because fewer were in the 5 years aggregate of pre-pbs categories and the Tier 1 visa route, with only 3,753 such visas granted in 2017 compared to 10,657 in This declining trend has been present since Tier 1 grants fell due to the closure of the Tier 1 General (in April 2011) and Tier 1 Post-study routes (in April 2012). Despite this, in the first half of 2018 there has been a slight increase, 16.9 per cent, in Tier 1 grants of settlement relative to the same period in Grants of total 5 year aggregate of pre- PBS categories and Tier 2 work visas in contrast have increased between 2016 and 2017 by 16.1 per cent to 10,848. The grants of Tier 2 settlement have also increased by 47.6 per cent in the first half of 2018 relative to the same period in In Table 2.1, family formation and reunion accounts for people granted settlement on grounds of their relationship to another person already settled or a British citizen. In this table, dependants of migrants in other visa routes who are being granted settlement at the same time as the main applicants are grouped with the main applicants. For example, a dependant granted 58
61 settlement at the same time as a main applicant applying via a Tier 2 work route is included in the Category Tier 2 Sponsored with a job and Applicant type Dependant. The reduction of people granted settlement in 2017 has, in addition to the fall in employment related grants of settlement, also been driven by fewer people settling via family formation and reunion. A declining trend in this route of settlement has been observed since 2013, which has seen the number of people settling via this route fall by 90.9 per cent to 5,420 between 2013 and The reason for the slight increase in grants of settlement in 2017 relative to 2016 is driven by the total number of asylum-related grants, which rose by 29.6 per cent to 18,730 and the increase of other grants and unknown grants which rose by 43.3 per cent to 22,848. These increases in settlement from asylum-related grants were also observed in the first half of 2018, with 15,283 grants, 76.9 per cent more than in the same period in The increases in 2017 (and 2018) did not offset the large reduction in grants of settlement in the family reunion routes that have been observed since The decreases in family grants observed since 2013 are likely, in part, to reflect changes made to the family immigration rules in July 2012 which affected the qualifying period for settlement. Partners of PBS migrants who entered the UK after 9 July 2012 are required to complete a five year probationary period before they can apply for settlement. Where the main Points Based System migrant obtains settlement prior to their partner, the dependant can obtain a grant of further leave to remain in the Points Based System dependant category, rather than requiring the partner to apply for leave to remain as the partner of a person who has subsequently settled, and will be counted in the relevant PBS dependant category when granted settlement. The first half of 2018 does however show a slight increase in the number of people granted settlement via the family formation and reunion route, with 7,311 people granted settlement, a 234 per cent increase in number compared to the same period in 2017, and 34.9 per cent greater than in the whole of The increase could be due to the backlog of individuals who could not be granted settlement, due to the change in the qualifying time period required for settlement, which was increased to five years in 2012, now becoming eligible as sufficient time has now passed. The recording of Points Based System partners can differ depending on when they entered the UK. Partners of PBS migrants who entered the UK before 9 July 2012 could apply for settlement at the same time as the main applicant, provided they had been living together in the UK for at least two years, and would be counted in the relevant PBS dependant category. If they had not been living together in the UK for at least 2 years, they were required to apply for leave to remain as the partner of a person who has subsequently settled and would be counted in the family formation and reunion group when granted settlement. The grant of settlement may not necessarily reflect the entry category. For example, there is not a direct route to settlement for students or their dependants. However, if a student dependant switches to another category whilst in the UK and after a qualifying period applies for settlement, the grant will be recorded against the category that led to settlement. The data on grants of settlement by nationality in Table 2.2 shows that for each year in the time series presented, the majority of the grants were to citizens of Asian countries, accounting for 41.4 per cent of grants of settlement in However, the actual number of Asians granted settlement in 2017 is the lowest seen in this time series. Africans, accounting for 28.6 per cent 59
62 of the total in 2017, were again the second largest group, although their number has continued to fall year on year since In Table 2.3 and Figure 2.3 the spouses and dependants category includes people granted settlement on the grounds of their relationship to another person already settled or a British citizen, and other dependants (for example dependants of PBS work categories) granted settlement at the same time as the main applicant. Between 2016 and 2017 the total number of grants of settlement to spouses and dependants fell by 4.5 per cent. This figure can be disaggregated by type of spouse or dependent, which shows that the change in the grant of settlement between 2016 and 2017 for husbands fell by 18.3 per cent and similarly for wives grants of settlement fell by 13.2 per cent. In contrast, the grants of settlement to children increased by 6.3 per cent over the same period. There has been a significant increase in the number of EEA nationals seeking documents to confirm their situation in the UK, following the EU referendum. The number of issues of permanent residence documentation to EEA nationals who have been resident 5 years or more (and their non-eea family members) increased from 18,064 (in 2015) to 168,413 (year ending December 2017), more than a nine-fold increase, and the highest recorded annual figure. In the year ending June 2018, there were 116,323 documents certifying permanent residence and permanent resident cards, 85 per cent of which were issued to EU nationals. This was down from the peak observed in the year ending December Increases in applications from EU nationals in recent years is likely to reflect immigration in earlier years, while the most recent rise may be partly due to the impact of rule changes and perceived uncertainty following the 2016 EU referendum. After 12 November 2015, a person applying for citizenship who is claiming to have permanent residence as an EEA national or the family member of an EEA national has been required to provide a document certifying permanent residence or a permanent residence card as evidence that they meet the requirement to be free of immigration time restrictions. 2.2 Family migration There are a number of ways that people can come to the UK for family reasons. These include: i. The traditional family route where people come to join or accompany family members who are either British citizens or settled in the UK; ii. as visitors where people come for a short time to visit family members; or iii. as other dependants joining or accompanying where people come as dependants of migrants, for example those working or studying in the UK; or iv. as family members or extended family members of an EEA national or Swiss national resident in the UK (excluding UK nationals) by applying for an EEA family permit to come to the UK. The data presented in Table 2.4 show visas issued and differentiate between those immigrating to the UK via the family route and those coming as other dependants joining or accompanying migrants. Visitors are excluded from the analysis. In 2017, 40,131 family-related visas were granted, an increase of 6 per cent compared with 2016 (37,792) (Table 2.4). The upward trend in granting family-related visas was further observed in the first half of 2018, with 20,418 family related visas granted, 17.9 per cent more than over the same period in In total, 66,510 visas were granted to dependants (excluding 60
63 visitor visas) joining or accompanying migrants in the UK in 2017, a 4 per cent increase over the year. The first half of 2018 also saw an increase in visas granted relative to the same period in 2017, with 32,261 visas granted, a 7.4 per cent increase. Just over two thirds of visas granted in 2017 were to other dependants of workers, with the remainder predominantly students. The largest national group granted family visas in 2017 was Pakistan, with 7,199 visas issued in Additional data on those moving for family reasons are presented in Chapter 1 (reasons for moving) and Chapter 5 (visas for dependants). 61
64 Table Grants of settlement by category of grant, excluding EEA nationals, Employment (5) Employment with a work permit after 4/5 years 23,272 25,425 23,053 15,056 9,431 6,985 1, spouses and dependants 30,574 36,810 31,665 18,255 10,640 6,962 1, years aggregate of pre PBS categories and Tiers 1 and 2 (6) 4 1,993 6,612 13,253 18,228 19,664 17,042 19,450 11,762 8,899 - spouses and dependants 5 2,858 8,277 15,054 18,398 18,387 14,600 15,802 8,239 5,702 Permit-free employment, businessman, persons of independent means 2,065 4,881 5,783 2,737 1,574 2,221 1,565 1,866 1,174 1,318 - spouses and dependants 1,790 6,276 5,999 2, Commonwealth citizens with a UK-born grandparent 2,090 1,975 2,015 2,556 2,240 3,181 1,872 1,369 1,244 1,171 - spouses and dependants Total employment-related grants 60,770 81,185 84,346 69,891 62,192 59,280 38,709 39,779 23,321 18,095 Asylum (1) Refugees (2) and persons given exceptional leave to remain 1,995 2,102 3,158 7,493 6,498 11,168 9,696 9,997 7,572 9,840 - spouses and dependants 830 1,008 1,773 5,510 4,936 10,098 8,105 8,898 6,882 8,890 Total asylum-related grants 2,825 3,110 4,931 13,003 11,434 21,266 17,801 18,895 14,454 18,730 Family formation and reunion (3) Husbands (4) 15,990 19,872 18,425 14,188 12,620 16,652 9,526 4,721 1,540 1,118 Wives (4) 25,340 35,728 34,722 27,496 24,779 33,844 18,704 9,373 3,731 3,162 Children 8,265 10,147 9,699 7,501 6,036 7,418 4,101 2,430 1, Parents and grandparents 975 1,003 1,766 1,783 1, Other and unspecified dependents 4,780 5,489 4,616 3,118 2, Total family grants 55,350 72,239 69,228 54,086 47,374 59,649 32,846 16,808 6,927 5,420 O ther grants on discretionary basis (7) 29,095 37,940 82,295 29,547 8,479 14,269 14,222 15,102 15,791 22,687 Category unknown All grants of settlement 148, , , , , , ,054 90,827 60,651 65,093 Source: Home Office, Immigration statistics, April to June 2018 Notes: 1. Includes grants under the Family ILR exercise. 2. Excludes reconsideration cases and the outcome of appeals. 3. Spouses and dependants joining British citizens or persons previously granted settlement. 4. Includes unmarried and civil partners. 5. In 2006 the qualifying period for settlement in all employment-related categories changed from 4 to 5 years 6. Grants of settlement that combine qualifying periods of residence in PBS Tier 1or Tier 2 and other pre PBS categories. 7. Data from 2007 include persons granted indefinite leave outside the immigration rules under measurements aimed at clearing the backlog of outstanding unresolved cases (P) Provisional figures. 62
65 Table Grants of settlement by nationality, 2000 to (1) (1)(2) (1)(3)(4) (6) Europe 14,935 13,775 11,600 15,295 26,585 20,810 15,580 8,660 9,955 10,580 14,160 9,533 6,807 8,296 5,288 4,797 2,962 3,579 Americas 11,550 11,975 11,680 16,465 14,130 13,905 12,085 10,435 11,590 15,120 15,781 13,069 10,702 13,075 8,255 5,546 4,485 6,644 Africa 44,845 31,925 39,165 44,860 39,430 54,080 32,240 34,050 40,405 47,730 63,059 40,536 29,165 39,178 29,576 22,813 15,389 17,796 Asia Indian sub-continent 22,840 23,020 24,665 29,490 24,235 28,990 25,005 29,020 39,805 67,090 Rest of Asia 25,080 21,135 21,920 25,455 28,860 54,750 45,040 38,935 42,975 49,650 Asia Total 47,920 44,155 46,585 54,945 53,095 83,740 70,045 67,955 82, , ,256 85,266 67,936 78,932 51,450 48,600 28,943 26,736 Middle east 18,330 7,397 4,377 6,304 3,968 4,503 3,954 5,421 Oceania 4,905 5,455 6,250 7,125 5,690 6,335 4,215 3,615 4,040 4,365 4,843 4,855 5,313 5,955 3,655 2,345 1,639 1,624 Other nationalities 1, All nationalities 125, , , , , , , , , , , , , , ,413 89,142 58,083 62,613 Source: Home Office, Immigration statistics, Year ending June 2018 Notes 1. Excludes reconsideration cases and the outcome of appeals. 2. Includes grants under the Family ILR exercise. 3. Excludes those previously recognised as refugees, or given exceptional leave to remain, but accepted for settlement on other groups; also excludes dependants. 4. Data may be under-recorded due to 2,490 cases in 2002, 6,150 cases in 2003, 4,710 cases in 2004 and 4565 cases in 2005 for which the settlement category is unknown. 5. Figures in italics exclude nationals of Czech Republic, Cyprus, Estonia, Hungary, Latvia, Lithuania, Malta, Poland, Slovakia and Slovenia (countries which became part of the EEA on 1 May 2004) for the whole of 2003 and From 2007 excludes Bulgaria and Romania 2016 Excludes persons given settlement on arrival. (P) Provisional figures. 63
66 Table Grants of settlement, family migration, 2001 to (2) 2006 (3) Spouses and dependants Husbands settled on arrival settled on removal of time limit: 17,780 16,640 19,210 11,860 15,195 18,105 17,750 22,870 27,284 26,182 19,349 16,418 20,015 11,756 7,277 2,902 2,342 of which on basis of marriage (4) 16,850 15,470 17,275 7,985 8,540 15,185 13,495 15,640 19,693 18,256 13,947 12,461 16,560 9,472 4,683 1,514 1,069 at same time as wife 930 1,170 1,935 3,875 6,660 2,915 4,250 7,235 7,592 7,926 5,402 3,957 3,455 2,284 2,594 1,388 1,273 Total husbands 17,835 16,685 19,295 12,645 15,760 18,550 18,070 23,220 27,464 26,351 19,590 16,577 20,103 11,810 7,315 2,928 2,391 Wives settled on arrival ,450 2,080 1, settled on removal of time limit: 30,745 30,535 37,480 22,780 28,130 33,170 28,330 33,470 49,569 48,823 39,397 35,986 45,914 26,924 17,649 8,628 7,483 of which on basis of marriage (4) 26,590 24,930 30,560 12,520 15,205 26,365 22,405 24,635 35,380 34,122 26,827 24,421 33,552 18,540 9,227 3,722 3,144 at same time as husband 4,155 5,605 6,920 10,260 12,925 6,805 5,925 8,835 14,189 14,701 12,570 11,565 12,362 8,384 8,422 4,906 4,339 Total Wives 30,985 30,725 37,750 25,230 30,210 34,470 29,125 34,175 49,917 49,423 40,066 36,344 46,212 27,088 17,795 8,637 7,501 Children settled on arrival 1,730 1,505 1,590 7,485 5,385 5,105 4,390 3,260 2,408 2,464 2,354 1, settled on removal of time limit: 18,400 19,725 25,800 33,330 40,060 20,560 25,830 35,695 45,824 48,440 33,344 23,643 27,334 17,252 15,546 9,610 10,344 of which with parent accepted on basis of marriage 3,830 3,420 4,560 1,925 2,125 3,315 2,990 3,560 6,438 5,740 4,115 3,476 4,947 2,280 1, other 14,570 16,305 21,245 31,405 37,935 17,245 22,840 32,135 39,386 42,700 29,229 20,167 22,387 14,972 14,390 9,142 10,047 Total children 20,130 21,235 27,395 40,815 45,445 25,665 30,220 38,960 48,232 50,904 35,698 25,464 28,227 17,725 15,829 9,893 10,513 Parents and grandparents joining children or grandchildren: settled on arrival settled after entry (on removal of time limit) 1,465 1,530 3,020 1,885 1,185 1, Other and unspecified dependants (5) 6,600 6,940 6,360 8,405 11,520 8,050 5,785 5,455 6,368 6,136 4,307 4,022 2,657 2,018 2,233 2,257 2,271 Total spouses and dependants 77,305 77,335 93,910 89, ,380 88,205 84, , , , ,444 83,796 97,983 58,828 43,236 23,748 22,687 Source: Home Office, Immigration statistics, Year ending June 2018 Notes: 1. Includes reconsideration cases and the outcome of appeals 2. Includes nationals of Czech Republic, Cyprus, Estonia, Hungary, Latvia, Lithuania, Malta, Poland, Slovakia and Slovenia before 1 May, but excludes them from this date. 3. From 2007 excludes Bulgaria and Romania 4. Includes civil and unmarried partners 5. Data from 2001 to 2002 include husbands, wives and children of port asylum seekers given indefinite leave to remain 64
67 Table Family immigration visa issues, Change: latest 12 months Percentage change Family-related visas issued 53,544 49,173 52,309 44,940 40,149 33,162 34,876 37,719 37,792 40, % of which: Partners 45,099 39,556 40,466 34,832 31,508 24,562 26,944 29,521 28,938 32, % Children 3,506 4,260 5,698 4,693 4,086 3,901 2,959 3,067 2,614 2, % Other Dependants 4,939 5,357 6,145 5,415 4,555 4,699 4,973 5,131 6,240 5, % All other dependants (excl. Visitors visas)* 95,988 90,620 93,938 82,624 70,633 76,621 78,106 68,649 63,810 66, % Source: Home Office, Immigration statistics, Year ending June 2018, table vi04 Note: * - work, study and accompanying migrants 65
68 Number of persons Figure Total grants of settlement, 1960 to Source: Home Office, Immigration statistics, Year ending June
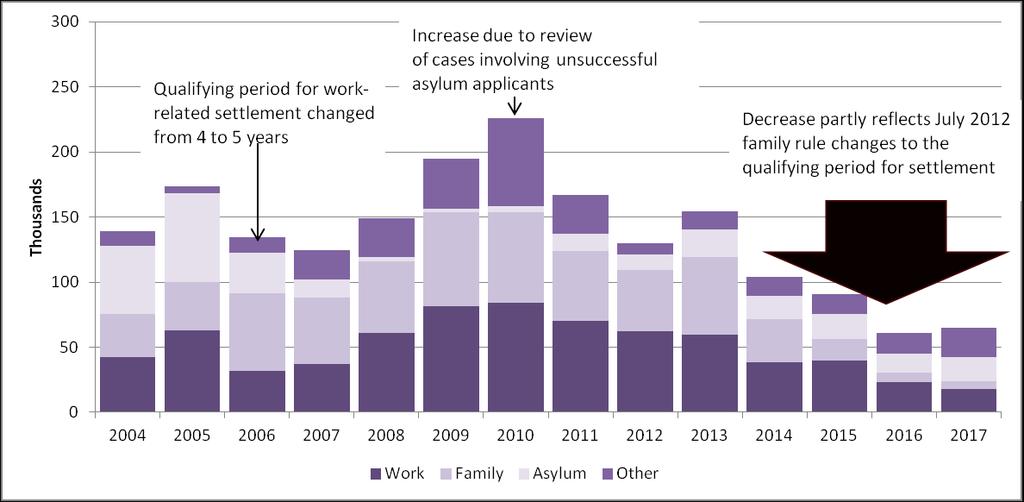
69 67
INTERNATIONAL MIGRATION AND THE UNITED KINGDOM REPORT OF THE UNITED KINGDOM SOPEMI CORRESPONDENT TO THE OECD, 2011
 INTERNATIONAL MIGRATION AND THE UNITED KINGDOM REPORT OF THE UNITED KINGDOM SOPEMI CORRESPONDENT TO THE OECD, 2011 Prof. John Salt Migration Research Unit Department of Geography University College London
BRIEFING. Long-Term International Migration Flows to and from the UK.
 BRIEFING Long-Term International Migration Flows to and from the UK AUTHORS: DR CARLOS VARGAS-SILVA DR YVONNI MARKAKI PUBLISHED: 02/06/2017 NEXT UPDATE: 05/07/2018 6th Revision www.migrationobservatory.ox.ac.uk
Standard Note: SN/SG/6077 Last updated: 25 April 2014 Author: Oliver Hawkins Section Social and General Statistics
 Migration Statistics Standard Note: SN/SG/6077 Last updated: 25 April 2014 Author: Oliver Hawkins Section Social and General Statistics The number of people migrating to the UK has been greater than the
August 2010 Migration Statistics
 WWW.IPPR.ORG August 2010 Migration Statistics ippr briefing 26 August 2010 ippr 2010 Institute for Public Policy Research Challenging ideas Changing policy 1 What do the latest migration statistics say?
BRIEFING. Non-EU Labour Migration to the UK. AUTHOR: DR SCOTT BLINDER PUBLISHED: 04/04/2017 NEXT UPDATE: 22/03/2018
 BRIEFING Non-EU Labour Migration to the UK AUTHOR: DR SCOTT BLINDER PUBLISHED: 04/04/2017 NEXT UPDATE: 22/03/2018 5th Revision www.migrationobservatory.ox.ac.uk This briefing examines labour migration
ANNUAL REPORT ON MIGRATION AND INTERNATIONAL PROTECTION STATISTICS FOR THE UNITED KINGDOM Katharine Thorpe
 ANNUAL REPORT ON MIGRATION AND INTERNATIONAL PROTECTION STATISTICS FOR THE UNITED KINGDOM 2009 Katharine Thorpe Annual Report on Migration and International Protection Statistics for the United Kingdom
BRIEFING. Long-Term International Migration Flows to and from Scotland. AUTHOR: WILLIAM ALLEN PUBLISHED: 18/09/2013
 BRIEFING Long-Term International Migration Flows to and from Scotland AUTHOR: WILLIAM ALLEN PUBLISHED: 18/09/2013 www.migrationobservatory.ox.ac.uk This briefing provides an overview of Long Term International
Short-term International Migration Trends in England and Wales from 2004 to 2009
 Short-term International Migration Trends in England and Wales from 2004 to 2009 Simon Whitworth, Konstantinos Loukas and Ian McGregor Office for National Statistics Abstract Short-term migration estimates
Migrant population of the UK
 BRIEFING PAPER Number CBP8070, 3 August 2017 Migrant population of the UK By Vyara Apostolova & Oliver Hawkins Contents: 1. Who counts as a migrant? 2. Migrant population in the UK 3. Migrant population
BRIEFING. Immigration by Category: Workers, Students, Family Members, Asylum Applicants.
 BRIEFING Immigration by Category: Workers, Students, Family Members, Asylum Applicants AUTHORS: DR SCOTT BLINDER PUBLISHED: 9/3/217 NEXT UPDATE: 6/3/218 5th Revision www.migrationobservatory.ox.ac.uk This
Economic Activity in London
 CIS2013-10 Economic Activity in London September 2013 copyright Greater London Authority September 2013 Published by Greater London Authority City Hall The Queens Walk London SE1 2AA www.london.gov.uk
Quarterly Labour Market Report. February 2017
 Quarterly Labour Market Report February 2017 MB14052 Feb 2017 Ministry of Business, Innovation and Employment (MBIE) Hikina Whakatutuki - Lifting to make successful MBIE develops and delivers policy, services,
Migration Review: 2010/2011
 briefing Migration Review: 2010/2011 ippr December 2010 ippr 2010 Institute for Public Policy Research Challenging ideas Changing policy About ippr The Institute for Public Policy Research (ippr) is the
The Outlook for Migration to the UK
 European Union: MW 384 Summary 1. This paper looks ahead for the next twenty years in the event that the UK votes to remain within the EU. It assesses that net migration would be likely to remain very
The outlook for EU migration if the UK remains subject to the free movement of people
 The outlook for EU migration if the UK remains subject to the free movement of people European Union: MW 416 Summary 1. Should the UK remain subject to free movement rules after Brexit as a member of the
ISBN International Migration Outlook Sopemi 2007 Edition OECD Introduction
 ISBN 978-92-64-03285-9 International Migration Outlook Sopemi 2007 Edition OECD 2007 Introduction 21 2007 Edition of International Migration Outlook shows an increase in migration flows to the OECD International
People. Population size and growth. Components of population change
 The social report monitors outcomes for the New Zealand population. This section contains background information on the size and characteristics of the population to provide a context for the indicators
Levels and trends in international migration
 Levels and trends in international migration The number of international migrants worldwide has continued to grow rapidly over the past fifteen years reaching million in 1, up from million in 1, 191 million
BRIEFING. EU Migration to and from the UK.
 BRIEFING EU Migration to and from the UK AUTHOR: DR CARLOS VARGAS-SILVA DR YVONNI MARKAKI PUBLISHED: 31/10/2016 NEXT UPDATE: 31/10/2017 5th Revision www.migrationobservatory.ox.ac.uk This briefing provides
BRIEFING. Migrants in the UK: An Overview.
 BRIEFING Migrants in the UK: An Overview AUTHOR: DR CINZIA RIENZO DR CARLOS VARGAS-SILVA PUBLISHED: 21/02/2017 NEXT UPDATE: 21/02/2018 6th Revision www.migrationobservatory.ox.ac.uk This briefing provides
MIGRATION REPORT NEWCASTLE
 MIGRATION REPORT NEWCASTLE 2002-2009 December 2010 By John Horne Carol Burdis Kadhem Jallab CONTENTS Summary and Key Messages....... 1 1 Introduction.. 2 Section 2. Natural Change.... 3 3. Internal (Domestic)
I. LEVELS AND TRENDS IN INTERNATIONAL MIGRANT STOCK
 I. LEVELS AND TRENDS IN INTERNATIONAL MIGRANT STOCK A. INTERNATIONAL MIGRANT STOCK BY DEVELOPMENT GROUP The Population Division estimates that, worldwide, there were 214.2 million international migrants
CHAIN ANNUAL BULLETIN GREATER LONDON 2016/17
 CHAIN ANNUAL BULLETIN GREATER LONDON 2016/17 This bulletin presents information about people seen rough sleeping by outreach teams in London between April 2016 and March 2017. Information in the bulletin
REPORT. Highly Skilled Migration to the UK : Policy Changes, Financial Crises and a Possible Balloon Effect?
 Report based on research undertaken for the Financial Times by the Migration Observatory REPORT Highly Skilled Migration to the UK 2007-2013: Policy Changes, Financial Crises and a Possible Balloon Effect?
THE NORTHERN TERRITORY S RY S OVERSEAS BORN POPULATION
 STUDIES RESEARCH BRIEF ISSUE Number 2008010 School for Social and Policy Research 2008 Population Studies Group School for Social and Policy Research Charles Darwin University Northern Territory 0909 dean.carson@cdu.edu.au
Britain s Population Exceptionalism within the European Union
 Britain s Population Exceptionalism within the European Union Introduction The United Kingdom s rate of population growth far exceeds that of most other European countries. This is particularly problematic
Notes to Editors. Detailed Findings
 Notes to Editors Detailed Findings Public opinion in Russia relative to public opinion in Europe and the US seems to be polarizing. Americans and Europeans have both grown more negative toward Russia,
BRIEFING. Non-European Migration to the UK: Family and Dependents.
 BRIEFING Non-European Migration to the UK: Family and Dependents AUTHOR: DR SCOTT BLINDER PUBLISHED: 24/4/217 NEXT UPDATE: 21/3/218 5th Revision www.migrationobservatory.ox.ac.uk This briefing examines
People. Population size and growth
 The social report monitors outcomes for the New Zealand population. This section provides background information on who those people are, and provides a context for the indicators that follow. People Population
Summary of the Results
 Summary of the Results CHAPTER I: SIZE AND GEOGRAPHICAL DISTRIBUTION OF THE POPULATION 1. Trends in the Population of Japan The population of Japan is 127.77 million. It increased by 0.7% over the five-year
ASSESSING THE ECONOMIC IMPACT OF FOREIGN WORKERS IN MALTA
 ASSESSING THE ECONOMIC IMPACT OF FOREIGN WORKERS IN MALTA Article published in the Quarterly Review 2016:1, pp. 39-44 BOX 3: ASSESSING THE ECONOMIC IMPACT OF FOREIGN WORKERS IN MALTA 1 Between the late
Migration Report Central conclusions
 Migration Report 2013 Central conclusions 2 Migration Report 2013 - Central conclusions Migration Report 2013 Central conclusions The Federal Government s Migration Report aims to provide a foundation
EUROPEAN MIGRATION NETWORK ANNUAL REPORT ON STATISTICS ON MIGRATION, ASYLUM AND RETURN: IRELAND 2004 EMMA QUINN
 EUROPEAN MIGRATION NETWORK ANNUAL REPORT ON STATISTICS ON MIGRATION, ASYLUM AND RETURN: IRELAND 2004 EMMA QUINN Research Study Financed by European Commission Directorate-General Justice, Freedom and Security
BRIEFING. Non-European Student Migration to the UK.
 BRIEFING Non-European Student Migration to the UK AUTHOR: DR SCOTT BLINDER PUBLISHED: 20/07/2017 NEXT UPDATE: 30/06/2018 6th Revision www.migrationobservatory.ox.ac.uk This briefing answers key questions
The Outlook for EU Migration
 Briefing Paper 4.29 www.migrationwatchuk.com Summary 1. Large scale net migration is a new phenomenon, having begun in 1998. Between 1998 and 2010 around two thirds of net migration came from outside the
The UK and the European Union Insights from ICAEW Employment
 The UK and the European Union Insights from ICAEW Employment BUSINESS WITH CONFIDENCE icaew.com The issues at the heart of the debate This paper is one of a series produced in advance of the EU Referendum
Trademarks FIGURE 8 FIGURE 9. Highlights. Figure 8 Trademark applications worldwide. Figure 9 Trademark application class counts worldwide
 Trademarks Highlights Applications grew by 16.4% in 2016 An estimated 7 million trademark applications were filed worldwide in 2016, 16.4% more than in 2015 (figure 8). This marks the seventh consecutive
EUROPEAN MIGRATION NETWORK ANNUAL REPORT ON STATISTICS ON MIGRATION, ASYLUM AND RETURN: IRELAND 2004
 EUROPEAN MIGRATION NETWORK ANNUAL REPORT ON STATISTICS ON MIGRATION, ASYLUM AND RETURN: IRELAND 2004 INTRODUCTION The current report provides analysis on statistics relating to migration and asylum in
Categories of International Migrants in Pakistan. International migrants from Pakistan can be categorized into:
 Pakistan Haris Gazdar Research Collective - Pakistan The collection and reporting of data on international migration into and from Pakistan have not kept up with the volume and diversity of the country
European Integration Consortium. IAB, CMR, frdb, GEP, WIFO, wiiw. Labour mobility within the EU in the context of enlargement and the functioning
 European Integration Consortium IAB, CMR, frdb, GEP, WIFO, wiiw Labour mobility within the EU in the context of enlargement and the functioning of the transitional arrangements VC/2007/0293 Deliverable
HIGHLIGHTS. There is a clear trend in the OECD area towards. which is reflected in the economic and innovative performance of certain OECD countries.
 HIGHLIGHTS The ability to create, distribute and exploit knowledge is increasingly central to competitive advantage, wealth creation and better standards of living. The STI Scoreboard 2001 presents the
SOURCES AND COMPARABILITY OF MIGRATION STATISTICS INTRODUCTION
 SOURCES AND COMPARABILITY OF MIGRATION STATISTICS INTRODUCTION Most of the data published below are taken from the individual contributions of national correspondents appointed by the OECD Secretariat
Migrant Youth: A statistical profile of recently arrived young migrants. immigration.govt.nz
 Migrant Youth: A statistical profile of recently arrived young migrants. immigration.govt.nz ABOUT THIS REPORT Published September 2017 By Ministry of Business, Innovation and Employment 15 Stout Street
How did immigration get out of control?
 Briefing Paper 9.22 www.migrationwatchuk.org How did immigration get out of control? Summary 1 Government claims that the present very high levels of immigration to Britain are consistent with world trends
STATISTICAL REFLECTIONS
 World Population Day, 11 July 217 STATISTICAL REFLECTIONS 18 July 217 Contents Introduction...1 World population trends...1 Rearrangement among continents...2 Change in the age structure, ageing world
Stockton upon Tees. Local Migration Profile. Quarter
 Stockton upon Tees Local Migration Profile Quarter 1 2011-12 This document summarises the main migration trends and data that we can access for Stockton-on-Tees up to 30 th June 2011 Any reproduction of
Needs of Migrant Communities
 Bedford & District Citizens Advice Bureau Needs of Migrant Communities Local Issues Paper Charles Leslie January 2015 1 NEEDS OF MIGRANT COMMUNITIES Summary This paper looks at the profile of migrants
ARI 39/2013 (Translated fron Spanish) Contrary to what numerous media reports seem to suggest, current Spanish emigration is very slight.
 Contrary to what numerous media reports seem to suggest, current Spanish emigration is very slight.") ARI ARI 39/2013 (Translated fron Spanish) 8 October 2013 Do Spaniards emigrate? Carmen González-Enríquez Senior Analyst for Demography, Population and International Migration, Elcano Royal Institute. Theme
ARI ARI 39/2013 (Translated fron Spanish) 8 October 2013 Do Spaniards emigrate? Carmen González-Enríquez Senior Analyst for Demography, Population and International Migration, Elcano Royal Institute. Theme
Executive summary. Migration Trends and Outlook 2014/15
 Executive summary This annual report is the 15th in a series that examines trends in temporary and permanent migration to and from New Zealand. The report updates trends to 2014/15 and compares recent
BRIEFING. Short-Term Migration in the UK: A Discussion of the Issues and Existing Data.
 BRIEFING Short-Term Migration in the UK: A Discussion of the Issues and Existing Data AUTHOR: DR CARLOS VARGAS-SILVA PUBLISHED: 22/08/2016 NEXT UPDATE: 22/07/2017 4th Revision www.migrationobservatory.ox.ac.uk
BRIEFING. Short-Term Migration in the UK: A Discussion of the Issues and Existing Data.
 BRIEFING Short-Term Migration in the UK: A Discussion of the Issues and Existing Data AUTHOR: DR CARLOS VARGAS-SILVA PUBLISHED: 13/10/2017 NEXT UPDATE: 22/06/2018 5th Revision www.migrationobservatory.ox.ac.uk
Migration Report Central conclusions
 Migration Report 2012 Central conclusions 2 Migration Report 2012: Central conclusions Migration Report 2012 Central conclusions The Federal Government s Migration Report aims to provide a foundation for
DURABLE SOLUTIONS AND NEW DISPLACEMENT
 CHAPTER III DURABLE SOLUTIONS AND NEW DISPLACEMENT INTRODUCTION One key aspect of UNHCR s work is to provide assistance to refugees and other populations of concern in finding durable solutions, i.e. the
Settling In 2018 Main Indicators of Immigrant Integration
 Settling In 2018 Main Indicators of Immigrant Integration Settling In 2018 Main Indicators of Immigrant Integration Notes on Cyprus 1. Note by Turkey: The information in this document with reference to
BRIEFING. Permanent or Temporary: How Long do Migrants stay in the UK?
 BRIEFING Permanent or Temporary: How Long do Migrants stay in the UK? AUTHORS: Zovanga Kone Madeleine Sumption PUBLISHED: 29 January 2019 NEXT UPDATE: 28 January 2020 1st edition www.migrationobservatory.ox.ac.uk
London Measured. A summary of key London socio-economic statistics. City Intelligence. September 2018
 A summary of key socio-economic statistics September 2018 People 1. Population 1.1 Population Growth 1.2 Migration Flow 2. Diversity 2.1 Foreign-born ers 3. Social Issues 3.1 Poverty & Inequality 3.2 Life
CHAPTER 1 POST-WAR MIGRATION FROM CYPRUS TO BRITAIN
 CHAPTER 1 POST-WAR MIGRATION FROM CYPRUS TO BRITAIN Sources There are several sources of statistical information concerning Cypriot migration to Britain during the post-war period. The chief of these is
COMMENTARY. Untangling the net: Understanding why migrants come and go. PUBLISHED: 29/08/2013
 COMMENTARY Untangling the net: Understanding why migrants come and go PUBLISHED: 29/08/2013 www.migrationobservatory.ox.ac.uk Today s (29 August 2013) new data released by the Office for National Statistics
ILO Global Estimates on International Migrant Workers
 ILO Global Estimates on International Migrant Workers Results and Methodology Executive Summary Labour Migration Branch Conditions of Work and Equality Department Department of Statistics ILO Global Estimates
Magdalena Bonev. University of National and World Economy, Sofia, Bulgaria
 China-USA Business Review, June 2018, Vol. 17, No. 6, 302-307 doi: 10.17265/1537-1514/2018.06.003 D DAVID PUBLISHING Profile of the Bulgarian Emigrant in the International Labour Migration Magdalena Bonev
EUROPEAN MIGRATION NETWORK ANNUAL REPORT ON ASYLUM AND MIGRATION STATISTICS FOR THE UK 2007
 UK Border Agency EUROPEAN MIGRATION NETWORK ANNUAL REPORT ON ASYLUM AND MIGRATION STATISTICS FOR THE UK 2007 Janet Dobson, Alan Latham, John Salt Migration Research Unit, UCL Contents 1. Introduction 2
3Z 3 STATISTICS IN FOCUS eurostat Population and social conditions 1995 D 3
 3Z 3 STATISTICS IN FOCUS Population and social conditions 1995 D 3 INTERNATIONAL MIGRATION IN THE EU MEMBER STATES - 1992 It would seem almost to go without saying that international migration concerns
Brexit and the UK Labour Market. Jonathan Wadsworth. Royal Holloway College, CEP LSE, CReAM UCL, MAC and IZA Bonn
 Brexit and the UK Labour Market Jonathan Wadsworth Royal Holloway College, CEP LSE, CReAM UCL, MAC and IZA Bonn Forecasting the likely consequences of a UK exit from the EU is fraught with difficulties
Middlesbrough. Local Migration Profile. Quarter
 Middlesbrough Local Migration Profile Quarter 1 2011-12 This document summarises the main migration trends and data that we can access for Middlesbrough up to 30 th June 2011 Any reproduction of the data
The present picture: Migrants in Europe
 The present picture: Migrants in Europe The EU15 has about as many foreign born as USA (40 million), with a somewhat lower share in total population (10% versus 13.7%) 2.3 million are foreign born from
Mass Immigration. Labour s enduring legacy to Britain.
 Mass Immigration Labour s enduring legacy to Britain www.migrationwatch.org 1 Chaos or conspiracy? Every country must have firm control over immigration and Britain is no exception. Labour election manifesto
Irish Emigration Patterns and Citizens Abroad
 Irish Emigration Patterns and Citizens Abroad A diaspora of 70 million 1. It is important to recall from the outset that the oft-quoted figure of 70 million does not purport to be the number of Irish emigrants,
Changing Times, Changing Enrollments: How Recent Demographic Trends are Affecting Enrollments in Portland Public Schools
 Portland State University PDXScholar School District Enrollment Forecast Reports Population Research Center 7-1-2000 Changing Times, Changing Enrollments: How Recent Demographic Trends are Affecting Enrollments
New Brunswick Population Snapshot
 New Brunswick Population Snapshot 1 Project Info Project Title POPULATION DYNAMICS FOR SMALL AREAS AND RURAL COMMUNITIES Principle Investigator Paul Peters, Departments of Sociology and Economics, University
QUARTERLY INTERNATIONAL DATA RELEASE
 QUARTERLY INTERNATIONAL DATA RELEASE IN PARTNERSHIP WITH CONTACT US Woburn House 2 Tavistock Square London, WC1H 9HQ EMAIL info@universitiesuk.ac.uk TEL +44 ()2 7419 4111 @UUKIntl Universities UK International
Alice According to You: A snapshot from the 2011 Census
 Research Brief 201301 Alice According to You: A snapshot from the 2011 Census Pawinee Yuhun, Dr Andrew Taylor & James Winter The Northern Institute Charles Darwin University (Image source: Alice Springs
Fiscal Impacts of Immigration in 2013
 www.berl.co.nz Authors: Dr Ganesh Nana and Hugh Dixon All work is done, and services rendered at the request of, and for the purposes of the client only. Neither BERL nor any of its employees accepts any
The proportion of the UK population aged under 16 dropped below the proportion over state pension age for the first time in (Table 1.
 Population In 2007, there were 6.0 million people resident in the UK, an increase of almost 400,000 (0.6 per cent) on 2006, equivalent to an average increase of around,000 people a day. (Table.) Chapter
English - Or. English ECONOMICS DEPARTMENT ECONOMIC AND DEVELOPMENT REVIEW COMMITTEE
 Unclassified ECO/EDR(2015)15/ANN4 ECO/EDR(2015)15/ANN4 Unclassified Organisation de Coopération et de Développement Économiques Organisation for Economic Co-operation and Development 30-Jun-2015 English
Working paper 20. Distr.: General. 8 April English
 Distr.: General 8 April 2016 Working paper 20 English Economic Commission for Europe Conference of European Statisticians Work Session on Migration Statistics Geneva, Switzerland 18-20 May 2016 Item 8
Londoners born overseas, their age and year of arrival
 CIS201308 Londoners born overseas, their age and year of arrival September 2013 copyright Greater London Authority August 2013 Published by Greater London Authority City Hall The Queens Walk London SE1
Migration Policies and Trends: International Comparisons
 Migration Policies and Trends: International Comparisons FINAL REPORT TO THE HOME OFFICE James Clarke, Jennifer Hogarth and John Salt Migration Research Unit University College London April 2004 Table
A limit on work permits for skilled EU migrants after Brexit
 A limit on work permits for skilled EU migrants after Brexit European Union: MW 391 Summary 1. An annual limit for highly skilled migration from the EU should be set at a level that allows for the renewal
BRIEFING. International Migration: The UK Compared with other OECD Countries.
 BRIEFING International Migration: The UK Compared with other OECD Countries AUTHOR: DR CARLOS VARGAS-SILVA PUBLISHED: 11/3/214 2nd Revision www.migrationobservatory.ox.ac.uk This briefing uses data from
CER INSIGHT: The biggest Brexit boon for Germany? Migration. by Christian Odendahl and John Springford 11 December 2017
 The biggest Brexit boon for Germany? Migration by Christian Odendahl and John Springford 11 December 217 Germany s economy desperately needs qualified immigrants to fill 78, jobs. Brexit will help it to
Regional Consultation on International Migration in the Arab Region
 Distr. LIMITED RC/Migration/2017/Brief.1 4 September 2017 Advance copy Regional Consultation on International Migration in the Arab Region In preparation for the Global Compact for Safe, Orderly and Regular
SPANISH NATIONAL YOUTH GUARANTEE IMPLEMENTATION PLAN ANNEX. CONTEXT
 2013 SPANISH NATIONAL YOUTH 2013 GUARANTEE IMPLEMENTATION PLAN ANNEX. CONTEXT 2 Annex. Context Contents I. Introduction 3 II. The labour context for young people 4 III. Main causes of the labour situation
ASPECTS OF MIGRATION BETWEEN SCOTLAND AND THE REST OF GREAT BRITAIN
 42 ASPECTS OF MIGRATION BETWEEN SCOTLAND AND THE REST OF GREAT BRITAIN 1966-71 The 1971 Census revealed 166,590 people* resident in England and Wales who had been resident in Scotland five years previously,
Executive summary. Strong records of economic growth in the Asia-Pacific region have benefited many workers.
 Executive summary Strong records of economic growth in the Asia-Pacific region have benefited many workers. In many ways, these are exciting times for Asia and the Pacific as a region. Dynamic growth and
Trends in Labour Supply
 Trends in Labour Supply Ellis Connolly, Kathryn Davis and Gareth Spence* The labour force has grown strongly since the mid s due to both a rising participation rate and faster population growth. The increase
V. MIGRATION V.1. SPATIAL DISTRIBUTION AND INTERNAL MIGRATION
 V. MIGRATION Migration has occurred throughout human history, but it has been increasing over the past decades, with changes in its size, direction and complexity both within and between countries. When
The likely scale of underemployment in the UK
 Employment and Welfare: MW 446 Summary 1. The present record rates of employment are misleading because they take no account of the underemployed those who wish to work more hours but cannot find suitable
GLOBALISATION AND WAGE INEQUALITIES,
 GLOBALISATION AND WAGE INEQUALITIES, 1870 1970 IDS WORKING PAPER 73 Edward Anderson SUMMARY This paper studies the impact of globalisation on wage inequality in eight now-developed countries during the
Monthly Inbound Update June th August 2017
 Monthly Inbound Update June 217 17 th August 217 1 Contents 1. About this data 2. Headlines 3. Journey Purpose: June, last 3 months, year to date and rolling twelve months by journey purpose 4. Global
Understanding the Macroeconomic Impact of Migration in Malta
 Understanding the Macroeconomic Impact of Migration in Malta Aaron G. Grech 1 Policy Note December 2015 1 Dr Grech is the Head of the Economic Research Department of the Central Bank of Malta. He would
INTERNATIONAL MIGRATION FLOWS TO AND FROM SELECTED COUNTRIES: THE 2008 REVISION
 E c o n o m i c & S o c i a l A f f a i r s INTERNATIONAL MIGRATION FLOWS TO AND FROM SELECTED COUNTRIES: THE 2008 REVISION CD-ROM DOCUMENTATION United Nations POP/DB/MIG/Flow/Rev.2008 Department of Economic
EASO EU+ asylum trends 2018 overview
 EASO EU+ asylum trends 2018 overview Support is our Mission 2 EU+ ASYLUM TRENDS - 2018 OVERVIEW EASO EU+ asylum trends 2018 overview EU+ ASYLUM TRENDS - 2018 OVERVIEW 3 Source: EASO EPS, December 2016
1.3. Rankings: imports, exports and overall trade volume Philippines trade with EU Member States Structure and trends by product
 Front Cover Contents 1 Overview 2 1. Trade Relations 1.1. Trade in goods: main trends 1.2. Trade in services 1.3. Rankings: imports, exports and overall trade volume 1.4. Comparison of EU-Philippines
International student behaviours
 November 2018 International student behaviours quarterly data release in partnership with Contact us Woburn House 20 Tavistock Square London, WC1H 9HQ Email info@universitiesuk.ac.uk TEL +44 (0)20 7419
BRIEFING. Yorkshire and the Humber: Census Profile.
 BRIEFING Yorkshire and the Humber: Census Profile AUTHOR: ANNA KRAUSOVA DR CARLOS VARGAS-SILVA PUBLISHED: 12/06/2013 www.migrationobservatory.ox.ac.uk This briefing summarises key statistics from the 2011
VIII. INTERNATIONAL MIGRATION
 VIII. INTERNATIONAL MIGRATION International migration is closely tied to global development and generally viewed as a net positive for both sending and receiving countries. In the sending countries, emigration
2.3 IMMIGRATION: THE NUMBERS
 1964 1966 1968 1970 1972 1974 1976 1978 1980 1982 1984 1986 1988 1990 1992 1994 1996 1998 2000 2002 2004 2006 2008 2010 2012 2014 2016 2.3 IMMIGRATION: THE NUMBERS HOW MANY PEOPLE ARE COMING TO THE UK
Bringing skilled workers into Sri Lan Is it a viable option?
 Bringing skilled workers into Sri Lan Is it a viable option? Nisha Arunatilake October 2018 Institute of Policy Studies of Sri Lanka Sri Lanka is facing a labour shortage Construction sector - 20,224 Total
POPULATION STUDIES RESEARCH BRIEF ISSUE Number
 POPULATION STUDIES RESEARCH BRIEF ISSUE Number 2008021 School for Social and Policy Research 2008 Population Studies Group School for Social and Policy Research Charles Darwin University Northern Territory
MIGRATION TRENDS REPORT
 MIGRATION TRENDS REPORT Migration Flows and Population Trends in Wales AUTHOR: Dr Yvonni Markaki PUBLISHED: February 2017 revision http://www.wrc.wales/migration-information This report is the third of