Long-term impacts of migration on housing consumption
|
|
|
- Willa Wheeler
- 5 years ago
- Views:
Transcription


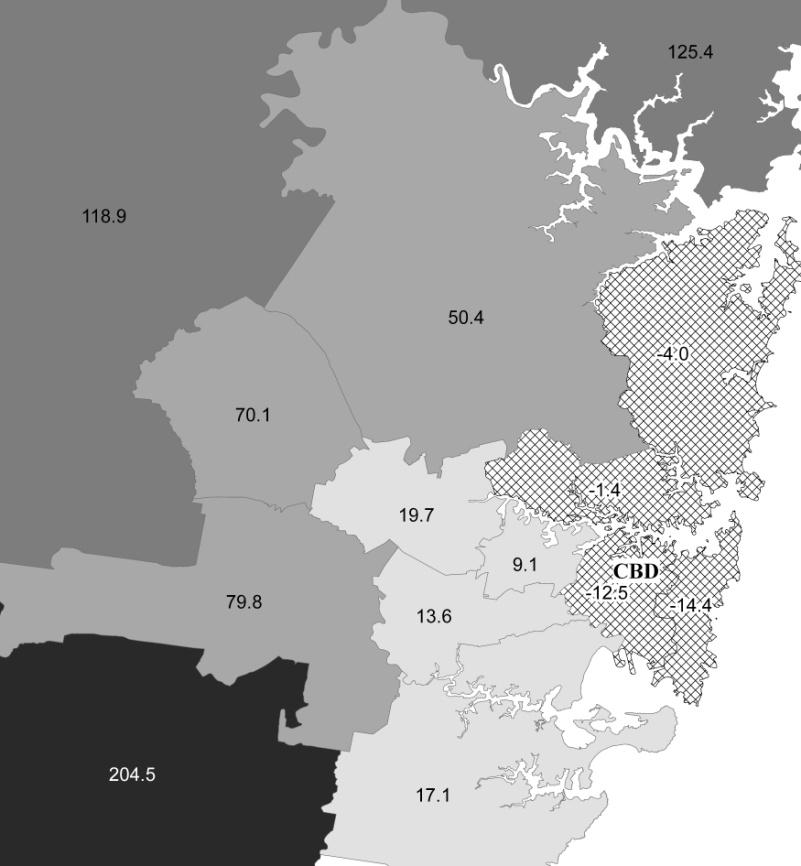
1 City Futures Research Centre Never Stand Still Faculty of Built Environment City Futures Research Centre Long-term impacts of migration on housing consumption A case study of Sydney, Australia Dr Edgar Liu Research Associate
2 Housing migrants Much work to date has focussed on settlement patterns and housing options of first generation migrants A wide range of work focusing on housing careers/pathways of first generation migrants first entering private rental sector prior to entering homeownership when economics improved More recent work on housing temporary migrants, especially the role of urban villages in housing labour migrants in China
3 Housing migrants Burnley (2009) settlement patterns of second or later generation migrants far more dispersed than compared to first generation migrants As yet limited research on living arrangements of migrants, especially beyond the first generation, with Canadian evidence showing influence of ethnicity on migrants living arrangements (Gee, Mitchell & Wister 2003)
4 Housing multi-generation households Definition two or more generations of related adults living in the same dwelling Based on principles of reciprocity, filial piety & generational contracts (Chui 2008; Izuhara 2004; 2010)
5 Housing multi-generation households Recent Australian research shows increasing incidence of multi-generation households, with some indicating economics as main factors (Cobb-Clark 2008) while others point to wider systemic shifts (Flatau et al. 2007) Liu & Easthope (2012) changing demographic, socioeconomic & housing characteristics of multigeneration households vs. other household types
6 Methodology 1981, 1986, 1991, 1996, 2001 & 2006 Australian Census of Population and Housing Location Birthplace by region Educational qualification Employment status / Occupation Tenure / Dwelling type / Dwelling size Household size Housing costs
7 Methodology 2006 Census via TableBuilder Ancestral background Person s birthplace Parents birthplace Relationship within household (relating to reference person)
8 Housing consumption of multi-generation households Separate house Semi detached, row/terrace house, townhouse Flat, unit or apartment in three or less storey block Flat, unit or apartment in four or more storey block Other dwelling Not stated
9
10 Housing consumption of multi-generation households Region of birth Number of Australian residents born in this region and living in multigeneration households NorthAfricaandtheMiddleEast Southern and Eastern Europe South-East Asia North-East Asia Sub-Saharan Africa Americas Southern and Central Asia Oceania and Antarctica North-West Europe Not stated Total % of Australian residents born in this region living in multi-generation household
11 Housing consumption of multi-generation households Region of birth Oceania and Antarctica North West Europe Southern and Eastern Europe North Africa &the Middle East South-East Asia North-East Asia Southern and Central Asia Americas Sub-Saharan Africa Not stated Total
12 Housing consumption of multi-generation households Australian Non-dep child G child G parent Sub-total First generation Second generation Third or later generation English Non-dep child G child G parent Sub-total First generation Second generation Third or later generation
13 Housing consumption of multi-generation households Greek Non-dep child G child G parent Sub-total First generation Second generation Third or later generation Maltese Non-dep child G child G parent Sub-total First generation Second generation Third or later generation
14 Housing consumption of multi-generation households Chinese Non-dep child G child G parent Sub-total First generation Second generation Third or later generation Samoan Non-dep child G child G parent Sub-total First generation Second generation Third or later generation *
15 Conclusion Multi-generation households as a traditional living arrangement amongst many cultures across the world can persist for two or more generations away from migrants culture of origin Wider and longer-term implications on host societies with high numbers of migrant/refugee intakes Housing providers and policymakers need to have longer-term foresight in meeting the housing needs of not just recently arrived migrants but also their descendents who may have different housing expectations and requirements than compared to the host society s traditions
Ward 16 River. City of Ottawa Ward Profiles 2011 Census and National Household Survey POPULATION* 45, ,390. Total City of Ottawa Population
 POPULATION* Total Ward Population 45,795 +2.0% 2006-2011 Total City of Ottawa Population 883,390 +8.8% 2006-2011 Population by Age Group Ward 16 City of Ottawa 2006 2011 06-11 2006 2011 06-11 Age Group
CITY OF MISSISSAUGA. Overview 2-1. A. Demographic and Cultural Characteristics
 Portraits of Peel Overview 2-1 A. Demographic and Cultural Characteristics Population: Size, Age and Growth 2-2 Immigrants 2-3 Visible Minorities 2-4 Language 2-5 Religion 2-6 Mobility Status 2-7 B. Household
Second Generation Australians. Report for the Department of Immigration and Multicultural and Indigenous Affairs
 Second Generation Australians Report for the Department of Immigration and Multicultural and Indigenous Affairs Siew-Ean Khoo, Peter McDonald and Dimi Giorgas Australian Centre for Population Research
Ward 17 Davenport City of Toronto Ward Profiles 2016 Census
 Bar Chart showing the rate of population growth between the years 2006 and 2016 for the Ward compared to the City of based on the 2006 and data. For more information, please contact Michael Wright at 416-392-7558
people/hectare Ward Toronto
 Bar Chart showing the rate of population growth between the years 2006 and 2016 for the Ward compared to the City of based on the 2006 and data. For more information, please contact Michael Wright at 416-392-7558
Scarborough City of Toronto Community Council Area Profiles 2016 Census
 Bar Chart showing the rate of population growth between the years 2006 and 2016 for the Ward compared to the City of based on the 2006 and data. For more information, please contact Michael Wright at 416-392-7558
Ward 14 Parkdale-High Park City of Toronto Ward Profiles 2016 Census
 Bar Chart showing the rate of population growth between the years 2006 and 2016 for the Ward compared to the City of based on the 2006 and data. For more information, please contact Michael Wright at 416-392-7558
Fanshawe Neighbourhood Profile
 Fanshawe Profile For further information contact: John-Paul Sousa Planning Research Analyst Direct: (519) 661-2500 ext. 5989 I email: jpsousa@london.ca Page 1 Page 2 Population Characteristics & Age Distribution
Population and Dwelling Counts
 Release 1 Population and Dwelling Counts Population Counts Quick Facts In 2016, Conception Bay South had a population of 26,199, representing a percentage change of 5.4% from 2011. This compares to the
Subsequent Migration of Immigrants Within Australia,
 Population Research and Policy Review (2018) 37:1053 1077 https://doi.org/10.1007/s11113-018-9482-4 ORIGINAL RESEARCH Subsequent Migration of Immigrants Within Australia, 1981 2016 James Raymer 1 Bernard
North York City of Toronto Community Council Area Profiles 2016 Census
 Bar Chart showing the rate of population growth between the years 2006 and 2016 for the Ward compared to the City of based on the 2006 and data. For more information, please contact Michael Wright at 416-392-7558
Ward 4 Etobicoke Centre City of Toronto Ward Profiles 2016 Census
 Bar Chart showing the rate of population growth between the years 2006 and 2016 for the Ward compared to the City of based on the 2006 and data. For more information, please contact Michael Wright at 416-392-7558
Bostwick Neighbourhood Profile
 Bostwick Profile For further information contact: John-Paul Sousa Planning Research Analyst Direct: (519) 661-2500 ext. 5989 I email: jpsousa@london.ca Page 1 Page 2 Population Characteristics & Age Distribution
Study Area Maps. Profile Tables. W Broadway & Cambie St, Vancouver, BC Pitney Bowes 2016 Estimates and Projections. W Broadway & Cambie St
 Powered by PCensus Page 1 Study Area Maps Profile Tables 2016 Demographic Snapshot Population Trends Household Trends Population by Age and Sex Comparison Population by Age and Sex Household Maintainers
(Note: These are inititial neighbourhood estimates and are subject to change.) NEI Score. 1,000 Female 52%
 NEI Score. 1,000 Female 52%") 0-4 5-9 10-14 15-19 20-24 25-29 30-34 35-39 40-44 45-49 50-54 55-59 60-64 65-69 70-74 75-79 80-84 85-89 90-94 95-99 100+ 2011 Neighbourhood Demographic Estimates EGLINTON AVE E C P R DON VALLEY PARKWAY
0-4 5-9 10-14 15-19 20-24 25-29 30-34 35-39 40-44 45-49 50-54 55-59 60-64 65-69 70-74 75-79 80-84 85-89 90-94 95-99 100+ 2011 Neighbourhood Demographic Estimates EGLINTON AVE E C P R DON VALLEY PARKWAY
(Note: These are inititial neighbourhood estimates and are subject to change.) 1,000 Female 54%
 1,000 Female 54%") LAWRENCE AVE E 0-4 5-9 10-14 15-19 20-24 25-29 30-34 35-39 40-44 45-49 50-54 55-59 60-64 65-69 70-74 75-79 80-84 85-89 90-94 95-99 100+ 2011 Neighbourhood Demographic Estimates RAILSIDE RD C P R DON RIVER
LAWRENCE AVE E 0-4 5-9 10-14 15-19 20-24 25-29 30-34 35-39 40-44 45-49 50-54 55-59 60-64 65-69 70-74 75-79 80-84 85-89 90-94 95-99 100+ 2011 Neighbourhood Demographic Estimates RAILSIDE RD C P R DON RIVER
Fiscal Impacts of Immigration in 2013
 www.berl.co.nz Authors: Dr Ganesh Nana and Hugh Dixon All work is done, and services rendered at the request of, and for the purposes of the client only. Neither BERL nor any of its employees accepts any
(Note: These are inititial neighbourhood estimates and are subject to change.) SCARBOROUGH SHORELINE. NEI Score. 1,500 Female 53%
 SCARBOROUGH SHORELINE. NEI Score. 1,500 Female 53%") 0-4 5-9 10-14 15-19 20-24 25-29 30-34 35-39 40-44 45-49 50-54 55-59 60-64 65-69 70-74 75-79 80-84 85-89 90-94 95-99 100+ 2011 Neighbourhood Demographic Estimates HIGHLAND CREEK WEST HIGHLAND CREEK KINGSTON
0-4 5-9 10-14 15-19 20-24 25-29 30-34 35-39 40-44 45-49 50-54 55-59 60-64 65-69 70-74 75-79 80-84 85-89 90-94 95-99 100+ 2011 Neighbourhood Demographic Estimates HIGHLAND CREEK WEST HIGHLAND CREEK KINGSTON
CENSUS ANALYSIS. St. BRENDAN s PARISH, FLEMINGTON 2011 Census Details
 CENSUS ANALYSIS The Pastoral Research Office of the Australian Catholic Bishops Conference, auspiced by the Australian Catholic University in Fitzroy, has in January released the 2011 census data for each
(Note: These are inititial neighbourhood estimates and are subject to change.) C N R. NEI Score. Female 54%
 C N R. NEI Score. Female 54%") 0-4 5-9 10-14 15-19 20-24 25-29 30-34 35-39 40-44 45-49 50-54 55-59 60-64 65-69 70-74 75-79 80-84 85-89 90-94 95-99 100+ 2011 Neighbourhood Demographic Estimates STANSBURY CRES MIDLAND AVE CITADEL DR WEST
0-4 5-9 10-14 15-19 20-24 25-29 30-34 35-39 40-44 45-49 50-54 55-59 60-64 65-69 70-74 75-79 80-84 85-89 90-94 95-99 100+ 2011 Neighbourhood Demographic Estimates STANSBURY CRES MIDLAND AVE CITADEL DR WEST
Measuring Mexican Emigration to the United States Using the American Community Survey
 Measuring Mexican Emigration to the United States Using the American Community Survey Eric Jensen and Matthew Spence Population Division U.S. Census Bureau International Forum on Migration Statistics January
(Note: These are inititial neighbourhood estimates and are subject to change.) C P R. NEI Score. Female 52%
 C P R. NEI Score. Female 52%") 0-4 5-9 10-14 15-19 20-24 25-29 30-34 JANE ST 35-39 40-44 45-49 50-54 55-59 60-64 65-69 70-74 75-79 80-84 85-89 90-94 95-99 100+ 2011 Neighbourhood Demographic Estimates EGLINTON AVE W JANE ST WESTON RD
0-4 5-9 10-14 15-19 20-24 25-29 30-34 JANE ST 35-39 40-44 45-49 50-54 55-59 60-64 65-69 70-74 75-79 80-84 85-89 90-94 95-99 100+ 2011 Neighbourhood Demographic Estimates EGLINTON AVE W JANE ST WESTON RD
BRAMALEA. Overview A. Demographic and Cultural Characteristics
 The Social Planning Council of Peel Portraits of Peel BRAMALEA Overview 13-1 A. Demographic and Cultural Characteristics Population: Size, Age and Growth 13-2 Immigrants 13-3 Visible Minorities 13-4 Language
CENSUS RESULTS NATIONAL HOUSEHOLD SURVEY
 2011 CENSUS RESULTS NATIONAL HOUSEHOLD SURVEY INTRODUCTION The inaugural National Household Survey (NHS) was a voluntary survey which replaced the mandatory long-form census questionnaire. The NHS was
The demographic diversity of immigrant populations in Australia
 The demographic diversity of immigrant populations in Australia Professor James Raymer School of Demography Research School of Social Sciences Mobility Symposium, Department of Immigration and Border Protection
BIRTHPLACE ORIGINS OF AUSTRALIA S IMMIGRANTS
 BIRTHPLACE ORIGINS OF AUSTRALIA S IMMIGRANTS Katharine Betts The birthplace origins of Australia s migrants have changed; in the 1960s most came from Britain and Europe. In the late 1970s this pattern
Definition of Migratory Status and Migration Data Sources and Indicators in Switzerland
 Definition of Migratory Status and Migration Data Sources and Indicators in Switzerland Marcel Heiniger, FSO United Nations Expert Group Meeting Improving Migration Data in the Context of the 2030 Agenda
People. Population size and growth. Components of population change
 The social report monitors outcomes for the New Zealand population. This section contains background information on the size and characteristics of the population to provide a context for the indicators
External migration. Executive summary
 21/4 7 March 21 External migration Executive summary New Zealand s permanent and long-term migrant flows have oscillated between positive and negative net figures over the last 4 years, with a net gain
$ $1,026. HIGHLIGHTS Ward Toronto. 52% with postsecondary 58% $978 average monthly rent. China #1 immigrant place of birth
 HIGHLIGHTS Ward Toronto 2010 Household Income 52% with postsecondary certificate, diploma or degree 58% with postsecondary certificate, diploma or degree 35% 30% 25% 20% 15% 10% 5% $978 average monthly
Population and Demographic. Tensions
 Population and Demographic Population Tensions All the people living in a territory Demography The study of populations The science that provides data about the population in order to study its general
The population universe (target population) of the 2011 Census includes the following groups:
 of the 2011 Census includes the following groups:") Glossary DEMOGRAPHICS Population The population universe includes variables that provide information about individuals, covering demographic characteristics and language. See Figure 16 for a list of these
Glossary DEMOGRAPHICS Population The population universe includes variables that provide information about individuals, covering demographic characteristics and language. See Figure 16 for a list of these
Keelesdale-Eglinton West
 BLACK CREEK DR 0-4 5-9 10-14 15-19 20-24 25-29 30-34 KEELE ST 35-39 40-44 45-49 50-54 -59 KANE AVE 60-64 65-69 70-74 75-79 80-84 85-89 90-94 95-99 100+ 2011 Neighbourhood Demographic Estimates EGLINTON
City Windsor 1981 Canada Census WARD 1
 City Windsor 1981 Canada Census March 2, 2012 Table of Contents... 3 POPULATION BY AGE... 4 LANGUAGE/RELIGION... 5 ETHNICITY/MOBILITY... 6 BIRTHPLACE / IMMIGRATION... 7 EDUCATION / LABOUR FORCE... 8 INDUSTRY
Mapping migrants: Australians wide-ranging experiences of immigration
 No. 13 December 2018 Mapping migrants: Australians wide-ranging experiences of immigration Charles Jacobs Mapping migrants: Australians wide-ranging experiences of immigration Charles Jacobs POLICY Paper
Housing and Older Immigrants in Australia: Issues for the 21st Century
 Housing and Older Immigrants in Australia: Issues for the 21st Century Andrew Beer and Debbie Faulkner Centre for Housing, Urban and Regional Planning, University of Adelaide, 2 nd International Conference
POPULATION STUDIES RESEARCH BRIEF ISSUE Number
 POPULATION STUDIES RESEARCH BRIEF ISSUE Number 2008021 School for Social and Policy Research 2008 Population Studies Group School for Social and Policy Research Charles Darwin University Northern Territory
Alberta Provincial Electoral Divisions. Calgary-McCall. Compiled from the 2016 Census of Canada
 Alberta Provincial Electoral Divisions Calgary-McCall Compiled from the 2016 Census of Canada July 2018 Introduction The following report produced by the Office of Statistics and Information presents a
Social and Demographic Trends in Burnaby and Neighbouring Communities 1981 to 2006
 Social and Demographic Trends in and Neighbouring Communities 1981 to 2006 October 2009 Table of Contents October 2009 1 Introduction... 2 2 Population... 3 Population Growth... 3 Age Structure... 4 3
The Demography of the Territory s
 The Demography of the Territory s Midtowns : Jabiru (Issue No.201401) The Northern Institute, 2013: This material is submitted for peer review. Correct citation is necessary. KEY FINDINGS The West Arnhem
(Note: These are inititial neighbourhood estimates and are subject to change.) C P R. NEI Score. 600 Female 51%
 C P R. NEI Score. 600 Female 51%") 0-4 5-9 10-14 15-19 20-24 25-29 30-34 35-39 40-44 45-49 50-54 55-59 60-64 65-69 70-74 75-79 80-84 85-89 90-94 95-99 100+ 2011 Neighbourhood Demographic Estimates STEELES AVE W FENMAR DR C P R GARYRAY DR
0-4 5-9 10-14 15-19 20-24 25-29 30-34 35-39 40-44 45-49 50-54 55-59 60-64 65-69 70-74 75-79 80-84 85-89 90-94 95-99 100+ 2011 Neighbourhood Demographic Estimates STEELES AVE W FENMAR DR C P R GARYRAY DR
Alberta Provincial Electoral Divisions
 Alberta Provincial Electoral Divisions Edmonton-Decore Compiled from the 2011 Census of Canada and National Household Survey Introduction This report presents the statistical profile for the Provincial
HIGHLIGHTS. 62% with postsecondary 58% $1,081 average monthly rent. $1,026 average monthly rent. China #1 immigrant. China #1 immigrant place of birth
 HIGHLIGHTS Ward Toronto 2010 Household Income 62% with postsecondary certificate, diploma or degree 58% with postsecondary certificate, diploma or degree 30% 25% 20% 15% 10% 5% $1,081 average monthly rent
HIGHLIGHTS Ward Toronto. 67% with postsecondary 58% $1,040 average monthly rent. $ $1,026 average monthly rent. China #1 immigrant place of birth
 HIGHLIGHTS Ward Toronto 2010 Household Income 67% with postsecondary certificate, diploma or degree 58% with postsecondary certificate, diploma or degree 30% 25% 20% 15% 10% 5% $1,040 average monthly rent
Migration is a global phenomenon, one that includes adults, youth and children alike. And Australia is a country built on migration with almost 50%
 1 Migration is a global phenomenon, one that includes adults, youth and children alike. And Australia is a country built on migration with almost 50% of our population either a first-born or second-born
Londoners born overseas, their age and year of arrival
 CIS201308 Londoners born overseas, their age and year of arrival September 2013 copyright Greater London Authority August 2013 Published by Greater London Authority City Hall The Queens Walk London SE1
A Multicultural Northern Territory Statistics from the 2016 Census (and more!) Andrew Taylor and Fiona Shalley
 Andrew Taylor and Fiona Shalley") A Multicultural Northern Territory Statistics from the 2016 Census (and more!) Andrew Taylor and Fiona Shalley Todays discussion Part I Background and the NT s multicultural make-up Part II Key statistics,
A Multicultural Northern Territory Statistics from the 2016 Census (and more!) Andrew Taylor and Fiona Shalley Todays discussion Part I Background and the NT s multicultural make-up Part II Key statistics,
Macquarie University ResearchOnline
 Macquarie University ResearchOnline This is the author version of an article published as: Parr, N. & Guo, F. (2005). Occupational concentration and mobility of Asian immigrants in Australia. Asian and
Sustainable cities, human mobility and international migration
 Sustainable cities, human mobility and international migration Report of the Secretary-General for the 51 st session of the Commission on Population and Development (E/CN.9/2018/2) Briefing for Member
Copyright is owned by the Author of the thesis. Permission is given for a copy to be downloaded by an individual for the purpose of research and
 Copyright is owned by the Author of the thesis. Permission is given for a copy to be downloaded by an individual for the purpose of research and private study only. The thesis may not be reproduced elsewhere
United Nations World Data Forum January 2017 Cape Town, South Africa. Sabrina Juran, Ph.D.
 United Nations World Data Forum 16 18 January 2017 Cape Town, South Africa DATA COLLECTION CONCERNING INTERNATIONAL MIGRANTS: POPULATION CENSUSES Sabrina Juran, Ph.D. Paper: The Potential of the 2010 Population
The urban transition and beyond: Facing new challenges of the mobility and settlement transitions in Asia
 The urban transition and beyond: Facing new challenges of the mobility and settlement transitions in Asia Professor Yu Zhu Center for Population and Development Research Fujian Normal University/ Asian
The Economic and Social Outcomes of Children of Migrants in New Zealand
 The Economic and Social Outcomes of Children of Migrants in New Zealand Julie Woolf Statistics New Zealand Julie.Woolf@stats.govt.nz, phone (04 931 4781) Abstract This paper uses General Social Survey
Planning Study Area 1 Burnaby Heights
 Neighbourhood Profiles 2006 Census Planning Study Area 1 Heights is bounded by Burrard Inlet to the north, Willingdon Avenue to the east, Hastings Street to the south and Boundary Road to the west. PLANNING
Place in Ageing: The Housing Experiences of Older Chinese Immigrants in New Zealand
 INTEGRATION OF IMMIGRANTS PROGRAMME 2007 2012 Place in Ageing: The Housing Experiences of Older Chinese Immigrants in New Zealand Elsie Ho University of Auckland Wendy Li James Cook University Outline
Alberta Provincial Electoral Divisions
 Alberta Provincial Electoral Divisions Innisfail-Sylvan Lake Compiled from the 2011 Census of Canada and National Household Survey Introduction This report presents the statistical profile for the Provincial
Introduction CHRISTCHURCH CITY UPDATE 2000
 CHRISTCHURCH CITY UPDATE 2000 Introduction Christchurch City experienced significant population growth during the first half of the 1990s. This trend was fuelled by high levels of international migration,
Alberta Provincial Electoral Divisions. Lacombe- Ponoka. Compiled from the 2016 Census of Canada
 Alberta Provincial Electoral Divisions Lacombe- Ponoka Compiled from the 2016 Census of Canada July 2018 Introduction The following report produced by the Office of Statistics and Information presents
Alberta Provincial Electoral Divisions. Calgary-Shaw. Compiled from the 2016 Census of Canada
 Alberta Provincial Electoral Divisions Calgary-Shaw Compiled from the 2016 Census of Canada July 2018 Introduction The following report produced by the Office of Statistics and Information presents a statistical
Alberta Provincial Electoral Divisions
 Alberta Provincial Electoral Divisions Calgary-Foothills Compiled from the 2011 Census of Canada and National Household Survey Introduction This report presents the statistical profile for the Provincial
REFUGEE RESETTLEMENT LOCAL GOVERNMENT CONTEXT
 REFUGEE RESETTLEMENT LOCAL GOVERNMENT CONTEXT LIVERPOOL S GROWTH Rapid and significant economic, demographic, infrastructural, and physical change, becoming one of the fastest growing regions in Sydney.
Rethinking Australian Migration
 Rethinking Australian Migration Stephen Castles University of Sydney Department of Sociology and Social Policy Challenges to Australian migration model 1. Changes in global and regional migration 2. From
Alice According to You: A snapshot from the 2011 Census
 Research Brief 201301 Alice According to You: A snapshot from the 2011 Census Pawinee Yuhun, Dr Andrew Taylor & James Winter The Northern Institute Charles Darwin University (Image source: Alice Springs
» fast facts NEIGHBOURHOOD MARKET PROFILE Hastings-North.
 Figure 1 FRANKLIN ST. HASTINGS ST. PENDER ST. KAMLOOPS ST. NANAIMO ST. HASTINGS ST. FRANKLIN ST. PENDER ST. POWELL ST.» fast facts BIA size: 21 city blocks; residential area size: 1,155 sq. km. 42,000
Introduction... i. Population Family Structure Education Mobility Status... 7
 Table of Contents Introduction... i Population... 2 Family Structure... 5 Education... 6 Mobility Status... 7 ward two Ethnicity, Language, Immigrants and Visible Minority... 9 Labour Force Characteristics...13
China-Australia Free Trade Agreement Safeguards
 China-Australia Free Trade Agreement Safeguards Introduction Labor will seek to amend the Migration Act 1958 to introduce safeguards around the China-Australia Free Trade Agreement s provisions on temporary
Alberta Provincial Electoral Divisions
 Alberta Provincial Electoral Divisions Calgary-Mackay-Nose Hill Compiled from the 2011 Census of Canada and National Household Survey Introduction This report presents the statistical profile for the Provincial
Introduction... i. Population Family Structure Education Mobility Status... 7
 ward ten Table of Contents Introduction... i Population... 2 Family Structure... 5 Education... 6 Mobility Status... 7 ward ten Ethnicity, Language, Immigrants and Visible Minority... 9 Labour Force Characteristics...13
2014 Migration Update Report
 2014 Migration Update Report by Graeme Hugo ARC Australian Professorial Fellow and Professor of Geography, The University of Adelaide Presentation to 2014 Migration Update Conference, Adelaide 11 th September,
QUANTIFYING TRANSNATIONALISM: ASIAN SKILLED MIGRATION TO AUSTRALIA
 QUANTIFYING TRANSNATIONALISM: ASIAN SKILLED MIGRATION TO AUSTRALIA by Graeme Hugo Federation Fellow Professor of Geography and Director of the National Centre for Social Applications of GIS The University
Introduction... i. Population Family Structure Education Mobility Status... 7
 Table of Contents Introduction... i Population... 2 Family Structure... 5 Education... 6 Mobility Status... 7 Ethnicity, Language, Immigrants and Visible Minority... 9 ward three Labour Force Characteristics...13
ATTITUDINAL DIVERGENCE IN A MELBOURNE REGION OF HIGH IMMIGRANT CONCENTRATION: A CASE STUDY
 ATTITUDINAL DIVERGENCE IN A MELBOURNE REGION OF HIGH IMMIGRANT CONCENTRATION: A CASE STUDY Andrew Markus and Arunachalam Dharmalingam Dingley Village and Springvale are two suburbs in South-Eastern Melbourne
Michael Haan, University of New Brunswick Zhou Yu, University of Utah
 The Interaction of Culture and Context among Ethno-Racial Groups in the Housing Markets of Canada and the United States: differences in the gateway city effect across groups and countries. Michael Haan,
Canada at 150 and the road ahead A view from Census 2016
 Canada at 150 and the road ahead A view from Census 2016 Dr. Doug Norris Senior Vice President and Chief Demographer 2017 Environics Analytics User Conference November 8, 2017 Canada continues to lead
"Measures for inclusive and antidiscriminatory PAPER TO THE
 "Measures for inclusive and antidiscriminatory labour markets in Australia" PAPER TO THE IQ SYMPOSIUM: LABOUR MARKET INTEGRATION OF IMMIGRANTS IN GERMANY AND EUROPE: CHALLENGES PERSPECTIVES OPPORTUNITIES
Integrating housing and transportation using structural change. A case study of Filipino immigrants in the Toronto CMA. Ren Thomas PhD Candidate, UBC
 Integrating housing and transportation using structural change A case study of Filipino immigrants in the Toronto CMA Ren Thomas PhD Candidate, UBC Outline for the presentation Research context and definitions
AHURI Research & Policy Bulletin
 AHURI Research & Policy Bulletin ISSUE 74 June 2006 ISSN 1445-3428 Are housing affordability problems creating labour shortages? Up until 2001 there was little direct evidence that housing affordability
Gender, migration and well-being of the elderly in rural China
 Gender, migration and well-being of the elderly in rural China Shuzhuo Li 1 Marcus W. Feldman 2 Xiaoyi Jin 1 Dongmei Zuo 1 1. Institute for Population and Development Studies, Xi an Jiaotong University
CENSUS RESULTS WARD 3 PROFILE
 2011 CENSUS RESULTS WARD 3 PROFILE Town of Halton Hills City of Brampton Hwy. 407 Finch Ave. Town of Milton Hwy. 407 ETR Ninth Line 10 Derry Rd. Winston Churchill Blvd. 9 Erin Mills Pkwy. Mississauga Rd.
MIGRATION, SETTLEMENT AND THE CONCEPTS OF HOUSE AND HOME. Dr Iris Levin The Brotherhood of St Laurence 14 April 2016
 MIGRATION, SETTLEMENT AND THE CONCEPTS OF HOUSE AND HOME Dr Iris Levin The Brotherhood of St Laurence 14 April 2016 OUTLINE Settlement and belonging, home and house The research Houses of migrants from
MIGRATION BETWEEN THE ASIA-PACIFIC AND AUSTRALIA A DEVELOPMENT PERSPECTIVE
 MIGRATION BETWEEN THE ASIA-PACIFIC AND AUSTRALIA A DEVELOPMENT PERSPECTIVE by Graeme Hugo University Professorial Research Fellow Professor of Geography and Director of the National Centre for Social Applications
Irish Emigration Patterns and Citizens Abroad
 Irish Emigration Patterns and Citizens Abroad A diaspora of 70 million 1. It is important to recall from the outset that the oft-quoted figure of 70 million does not purport to be the number of Irish emigrants,
Languages of work and earnings of immigrants in Canada outside. Quebec. By Jin Wang ( )
") Languages of work and earnings of immigrants in Canada outside Quebec By Jin Wang (7356764) Major paper presented to the Department of Economics of the University of Ottawa in partial fulfillment of the
Languages of work and earnings of immigrants in Canada outside Quebec By Jin Wang (7356764) Major paper presented to the Department of Economics of the University of Ottawa in partial fulfillment of the
What is the Census? Why is it important?
 1 What is the Census? Every five years, Statistics Canada conducts a Census providing a detailed account of the Canadian population. The Census is intended to provide snapshot of the demographic, social
Migrant Youth: A statistical profile of recently arrived young migrants. immigration.govt.nz
 Migrant Youth: A statistical profile of recently arrived young migrants. immigration.govt.nz ABOUT THIS REPORT Published September 2017 By Ministry of Business, Innovation and Employment 15 Stout Street
Transitions to residential independence among young second generation migrants in the UK: The role of ethnic identity
 Transitions to residential independence among young second generation migrants in the UK: The role of ethnic identity Ann Berrington, ESRC Centre for Population Change, University of Southampton Motivation
Verdun borough HIGHLIGHTS. In 1996, the Verdun borough had a population of 59,714. LOCATION
 Socio-economic profile borough February 2002 HIGHLIGHTS In 1996, the borough had a population of 59,714. LOCATION Between 1991 and 1996, the population of the borough declined by 2.6%. One-person households
Emigration Statistics in Georgia. Tengiz Tsekvava Deputy Executive Director National Statistics Office of Georgia
 Emigration Statistics in Georgia Tengiz Tsekvava Deputy Executive Director National Statistics Office of Georgia Main Sources for International Migration in Georgia Annual data of inflows and outflows
Children, education and migration: Win-win policy responses for codevelopment
 OPEN ACCESS University of Houston and UNICEF Family, Migration & Dignity Special Issue Children, education and migration: Win-win policy responses for codevelopment Jeronimo Cortina ABSTRACT Among the
Population and Migration. Chapters 2 and 3 Test Review
 Population and Migration Chapters 2 and 3 Test Review 1. What is land suited for agriculture? 1. Farm Land 2. Brain Drain 3. Arable Land 4. Crop Land 1. What is land suited for agriculture? 1. Farm Land
8th International Metropolis Conference, Vienna, September 2003
 8th International Metropolis Conference, Vienna, 15-19 September 2003 YOUNG MIGRANT SETTLEMENT EXPERIENCES IN NEW ZEALAND: LINGUISTIC, SOCIAL AND CULTURAL ASPECTS Noel Watts and Cynthia White New Settlers
K.W.S. Saddhananda. Deputy Director Statistics. Department of Labour, Sri Lanka. Member of the National Statistical Office (DCS)
") Regional workshop on strengthening the collection and use of international migration data in the context of the 2030 Agenda for Sustainable Development from 31 January to 3 February 2017 in Bangkok, Thailand.
Regional workshop on strengthening the collection and use of international migration data in the context of the 2030 Agenda for Sustainable Development from 31 January to 3 February 2017 in Bangkok, Thailand.
Jean-Luc Richard Université de Rennes 1 - Rennes, France
 Jean-Luc Richard Université de Rennes 1 - Rennes, France Life Course Perspective and the Study of Integration in France We need longitudinal data. Why? -France is a country where there are no national
Overview The Dualistic System Urbanization Rural-Urban Migration Consequences of Urban-Rural Divide Conclusions
 Overview The Dualistic System Urbanization Rural-Urban Migration Consequences of Urban-Rural Divide Conclusions Even for a developing economy, difference between urban/rural society very pronounced Administrative
Immigrants and the North Shore Labour Market
 Immigrants and the North Shore Labour Market Many North Shore employers are challenged to find the skilled workers they need. Looming skills shortages and specialized job requirements have led many to
The Future of North West Sydney
 The Future of North West Sydney AUGUST 2018 2 Contents Demographic & Education Trends in Sydney s North West 5 Methodology 7 Sydney s North West 8 Population growth 8 Age profile 9 Student enrolments 12
2011 National Household Survey Profile on the Town of Richmond Hill: 1st Release
 2011 National Household Survey Profile on the Town of Richmond Hill: 1st Release Every five years the Government of Canada through Statistics Canada undertakes a nationwide Census. The purpose of the Census
2011 CENSUS & NATIONAL HOUSEHOLD SURVEY CITY OF BRAMPTON - WARD 1 PROFILE
 CENSUS & NATIONAL HOUSEHOLD SURVEY CITY OF BRAMPTON WARD 1 PROFILE WARD HIGHLIGHTS Population 53,130 Population 51.0% Females Population by Age Group 9% 20% 014 10.14% of total population 36 Median Age
2011 CENSUS & NATIONAL HOUSEHOLD SURVEY CITY OF BRAMPTON - WARD 3 PROFILE
 2011 CENSUS & NATIONAL HOUSEHOLD SURVEY CITY OF BRAMPTON WARD 3 PROFILE WARD HIGHLIGHTS Population 47,500 2011 Population 50.7% Females 2011 Population by Age Group 13% 18% 014 9.07% of total population
2011 CENSUS & NATIONAL HOUSEHOLD SURVEY CITY OF BRAMPTON - WARD 4 PROFILE
 2011 CENSUS & NATIONAL HOUSEHOLD SURVEY CITY OF BRAMPTON WARD 4 PROFILE WARD HIGHLIGHTS Population 9.51% of total population 49,850 2011 Population 34 Median Age 50.5% Females 49.5% Males 2011 Population